Article

A Statistical Assessment of Blending Hydrogen into Gas Networks

by
Enrico Vaccariello
1,2,*,
Riccardo Trinchero
2,
Igor S. Stievano
2 and
Pierluigi Leone
1
1
Department of Energy, Politecnico di Torino, c.so Duca degli Abruzzi 24, 10129 Torino, Italy
2
Department of Electronics and Telecommunications, Politecnico di Torino, c.so Duca degli Abruzzi 24, 10129 Torino, Italy
*
Author to whom correspondence should be addressed.
Energies 2021, 14(16), 5055; https://doi.org/10.3390/en14165055
Submission received: 14 July 2021 / Revised: 9 August 2021 / Accepted: 12 August 2021 / Published: 17 August 2021

Abstract

:
The deployment of low-carbon hydrogen in gas grids comes with strategic benefits in terms of energy system integration and decarbonization. However, hydrogen thermophysical properties substantially differ from natural gas and pose concerns of technical and regulatory nature. The present study investigates the blending of hydrogen into distribution gas networks, focusing on the steady-state fluid dynamic response of the grids and gas quality compliance issues at increasing hydrogen admixture levels. Two blending strategies are analyzed, the first of which involves the supply of NG–H2 blends at the city gate, while the latter addresses the injection of pure hydrogen in internal grid locations. In contrast with traditional case-specific analyses, results are derived from simulations executed over a large number (i.e., one thousand) of synthetic models of gas networks. The responses of the grids are therefore analyzed in a statistical fashion. The results highlight that lower probabilities of violating fluid dynamic and quality restrictions are obtained when hydrogen injection occurs close to or in correspondence with the system city gate. When pure hydrogen is injected in internal grid locations, even very low volumes (1% vol of the total) may determine gas quality violations, while fluid dynamic issues arise only in rare cases of significant hydrogen injection volumes (30% vol of the total).

1. Introduction

1.1. Background

The gas sector constitutes a major pillar of today’s energy systems, covering 24% of the world’s total primary energy consumption (2019) [1]. Gas from fossil origin is extensively deployed in the industry and for the generation of electrical energy, while it still dominates in subsectors such as residential heating in Europe, in which it accounts for 45% of the energy needs [2]. Sectors widely relying on gas, such as heating, are currently lagging behind in the path of decarbonization internationally agreed in 2015 in Paris [3], which recently led to the European proposal of reducing greenhouse gases (GHG) emissions by 55% with respect to 1990 levels by 2030 [4].
Electricity based on renewable energy sources (RES) will support the transition towards a low-carbon system, but full-system electrification is hardly conceivable due to infrastructural and technological limits [5], nor would it be desirable for an adequate resilience of the energy supply system [6,7].
It is therefore increasingly agreed that, in the framework of low-carbon multi-vector energy systems, a complementary role should still be assigned to gas. Nevertheless, reconversion of the gas sector to renewable and low-carbon gases is an unavoidable condition to keep the gas infrastructures running while meeting climate policy targets, as also underlined by recent IEA figures [6].
While perspective sustainable gas systems may be characterized by diversified supplies of gas, one of the most promising options is represented by the utilization of hydrogen. Not only can hydrogen be deployed as an industrial feedstock or as a fuel for mobility [5], but it can also replace natural gas within the existing grids in pure, blended or methanised (i.e., synthetic natural gas, SNG) forms [8,9]. This latter option is part of the European Hydrogen strategy, especially in an initial scaling-up stage [10]. Additionally and most importantly, injecting into the gas grid hydrogen from power-to-gas (PtG) plants provides strategic infrastructural couplings with the power grid [11,12]. The addition of PtG capacity and the consequent deployment of electrolytic hydrogen represents one of the pillars of the European Strategy for Energy System Integration [13], and massive investments in the sector are expected in the current decade [14]. For the above reasons, hydrogen is already being deployed in more than 20 ongoing power-to-gas (PtG) projects [8,9,15], and the number of pilot and full-scale demonstrational initiatives is expected to increase in the next future.
The utilization of pure hydrogen in existing gas grids comes with technological and regulatory challenges. Its lower density and heating value (volume-based) with respect to natural gas raise compatibility issues both on transmission and distribution operations and at the final users’ equipment.
Accordingly, several research works studied the system-level behavior of gas grids in the presence of hydrogen admixtures. Gas network operators are, in fact, subject to technical requirements that constrain the fluid dynamic operations and the quality of gas delivered to the end-users. Simulation-based works are, therefore, typically carried out to predict the network capability of receiving and delivering volumes of hydrogen while complying with operational and gas quality restrictions. A selection of such studies is presented in the following subsection.

1.2. Literature Review

Steady-state simulations proposed in [16] address the injection of hydrogen (in pure and blended form) and upgraded biogas in a distribution system. The study is carried out over a fictitious low-pressure (LP) simple grid model and assesses the impact of renewable gases on the nodal pressures and on the quality of the distributed blend. It is also demonstrated how hydrogen admixture levels of 10% vol—i.e., beyond the limits set by UK legislation (0.1% vol)—may still comply with other quality restrictions, such as the Wobbe index.
A full reconversion to hydrogen for a real-world medium-pressure (MP) and LP distribution system is modeled in [17] (in the framework of the H21 Leeds Citygate project). No fluid dynamic issues emerge from the analyses, apart from pressure and velocity violations in a limited set of nodes and pipelines, that may be addressed with limited efforts.
The model proposed in [18] proves to effectively handle non-trivial networks characterized by non-pipeline elements while adopting a non-isothermal assumption accounting for gas temperature changes induced by the Joule–Thomson effect, heat exchanges with the soil, compressions and expansions. The results indicate that the deployment of hydrogen enhances pressure drops along the pipelines, with consequent higher compression costs. The study is also replicated for substitute natural gas (SNG) and upgraded biogas.
Other steady-state analyses are presented in [19,20]. The study in [19] addresses the introduction of up to 10% vol of hydrogen in a low-pressure natural gas grid, and violations of gas quality restrictions are discussed. In reference [20], a complex MP distribution system with two gas infeed sites (or city gates) is deployed as a simulation testbed. Hydrogen admixtures up to 20% are modeled in correspondence with one of the city gates. The study supports the evidence that the deployment of hydrogen leads to significantly higher pressure drops and that concentrations of 10% vol H2 raise compliance issues against Polish requirements on HHV. The contribution also offers a comprehensive description of modeling and solution approaches to natural gas network studies.
A transient fluid dynamic tool is deployed in [21] to assess the effect of PtG on coupled electrical and gas distribution grids. Disturbances in the gas network pressure, velocity and gas quality are related to the penetration of RES in the electrical grid. Emphasis is given to the benefits deriving from a proper location for the injection site, as well as from a suitable injection profile along the day. Similar information is targeted in [22], where the analyses are carried out at steady-state conditions. Finally, steady and transient analyses on looped networks characterized by homogeneous mixtures of natural gas and hydrogen are addressed in [23], evidencing different pressure oscillations in transients when the networks are operated with natural gas and hydrogen blends.
Most of the extensive remaining research around the coupling of NG and power grids through PtG was carried out on a transmission scale (regional and National) and explore the extent to which electrolyzers may be deployed to improve the dispatchability of renewables and feed the natural gas network with hydrogen (see for instance [11,12]).

1.3. Motivation and Objectives

What emerges from the available literature is that the research landscape is rich in studies of gas networks in the presence of alternative fuels. It is also noticeable that, however, some difficulties may be encountered to gather a generalized understanding of the effect of green gases in gas grids. In most cases, simulated scenarios are, in fact, hardly comparable, involving different types of networks (e.g., pressure tiers, number of gas sources, etc.) and admixture levels of alternative gases.
Additionally, as a common practice, all the existing contributions adopt a single network whose response is significantly influenced by the grid topology and other factors such as the location of the NG source (s), the loads and the injection of hydrogen (or other green gases). It can be therefore inferred that available studies are affected by an intrinsic case-specificity that limits the extent of their validity and prevents generalized outputs.
To overcome the above limitations, the present work proposes a generalized assessment of the injection of hydrogen into distribution gas networks. In contrast with existing case-specific studies, the present work analyses the effect of injecting hydrogen into gas grids using a large number of gas network models. The networks deployed for the analysis are complex synthetic models of distribution gas grids generated according to an in-house developed tool described in [24]. Increasing hydrogen admixture levels and different injection locations are considered. Steady-state simulations with gas quality tracking are hence carried out for 1000 gas networks, and findings on the effect of hydrogen in gas grids are accordingly derived in a statistical-based fashion. Focus is given to the fluid dynamic response of the grids and to gas quality compliance issues.
The rest of the paper is structured as follows. In the methodological Section 2, details on the procedure leading to the creation of synthetic grids models are provided, together with the overall rationale of the study. Section 3 presents the statistical results on the effect of deploying hydrogen according to two cases, the first of which involves the supply of NG–H2 blends at the city gate, while the latter addresses the injection of pure hydrogen in internal grid locations. Conclusions are finally derived in Section 4.

2. Methodology

The tool presented in [24] is used for the generation of a large number (1000) of unique and realistic models of gas distribution networks. The network models are deployed to simulate and assess the introduction of hydrogen into existing grids. The synthetic networks feature realistic topologies and technical characteristics. Fluid dynamic analyses are carried out over the stochastic network models, and results are derived in a statistical fashion similar to a Monte Carlo simulation approach. The blending of hydrogen with natural gas is evaluated at increasing volume admixtures and for different locations of grid injection.

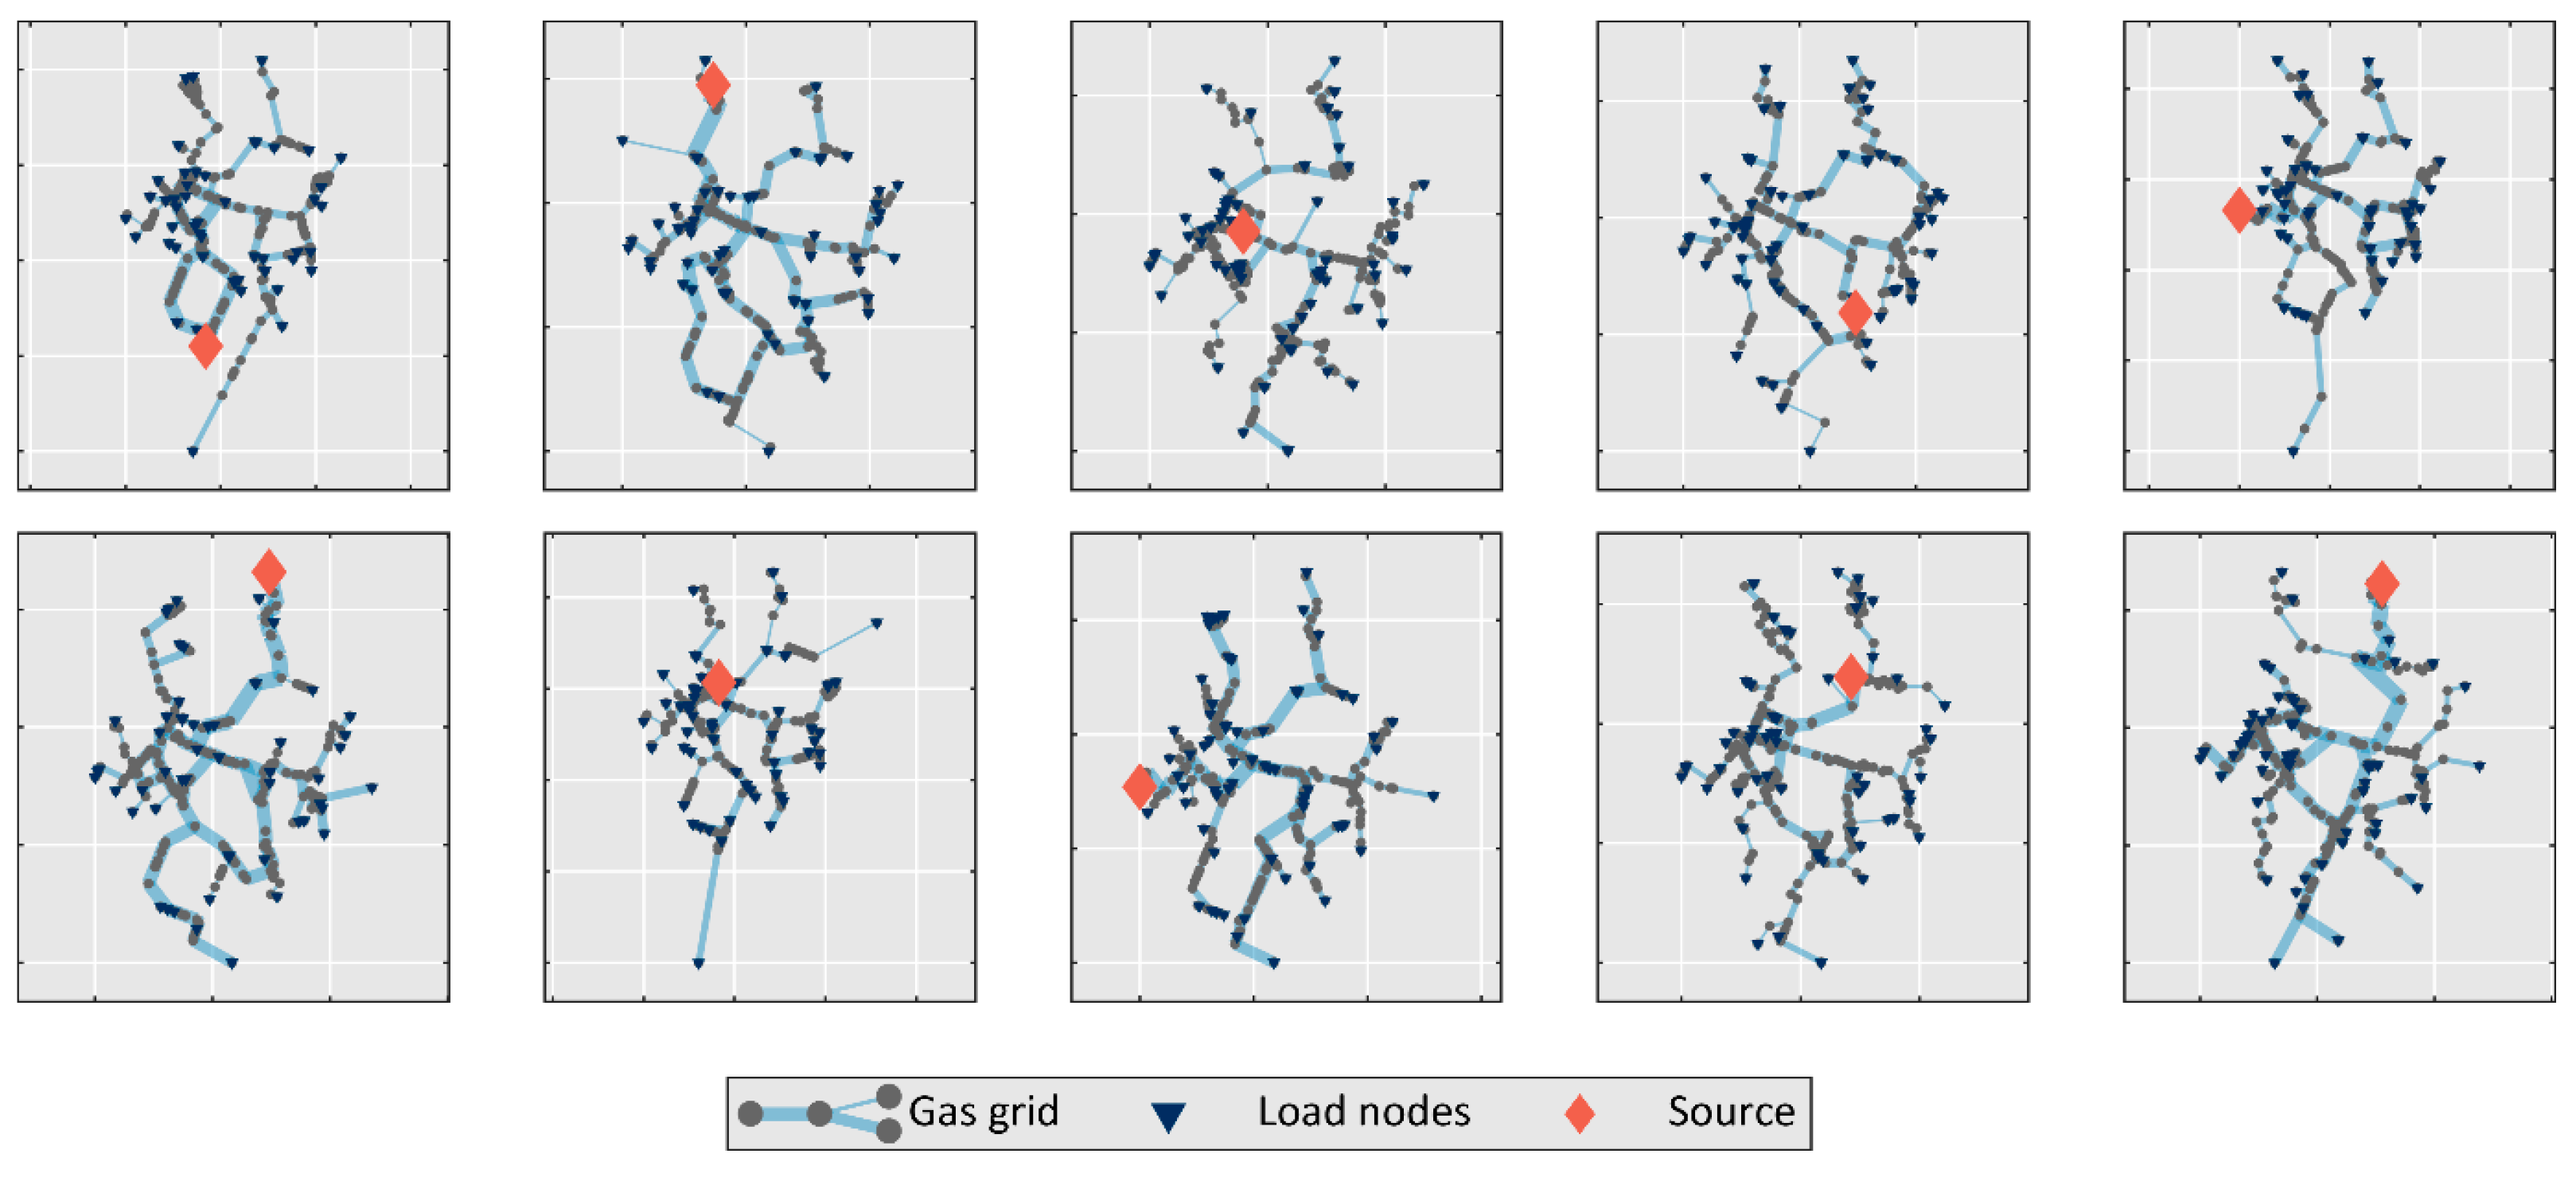
2.1. Synthetic Models of Distribution Gas Grids

The creation of synthetic gas network models is based on the algorithm described in [24,25,26], which, with moderate computational efforts, produces complex network structures with realistic topological and technical properties. According to the Italian classification (see [27,28]), gas network models created for this study are medium-pressure (MP) grids of 4th species, operated at a single pressure tier with admitted pressures ranging—by definition—from 1.5 to 5 bar (all the pressures indicated within this paper refer to gauge pressures). All the networks are designed for a peak gas demand of 30 MW and are characterized by a single infeed site (the city gate of the distribution system). One thousand network models are created according to a methodology articulated in two phases: the establishment of the network topology and the definition of its technical parameters.

2.1.1. Topology of the Synthetic Networks

Synthetic networks topologies are created mimicking an input reference gas grid with known topology and spatial coordinates of nodes. A graph-based representation of the networks is adopted, where the links (or edges) of the graph represent the pipelines of the network, while the nodes (or vertices) constitute junctions among the pipelines, points of gas consumption and points of gas supply.
The following steps are followed:
  • Fitting of a Gaussian Mixture Model (GMM): The spatial distribution of the reference grid is described with a statistical model fitted to the (x, y) coordinates of the nodes. Gaussian Mixture Models (GMM) are used for this purpose. A GMM is a simple, viable description of the probability that a given node of a network is located in a specific region of the plane. A weighted sum of bell-shaped (Gaussian) functions is adopted to describe the above probability, with parameters that are fitted from real data, i.e., from the (x, y) coordinates of a reference known network. Once the model parameters are computed, the GMM can be used (see item B) to generate randomly extracted nodes of a companion network that turns out to be coherent, even if different, with the initial reference network.
    p ( x | θ ) = i = 1 M ω i   G ( x | μ i , Σ i ) , θ = { ω i ,   μ i ,   Σ i }           i = 1 , ,   M  
    In the above expressions, p is the probability, G is a Gaussian function, parameters μ i and Σ i are the mean and the covariance matrix of the ith Gaussian component, ω i is its weight and M is the number of components of the mixture. Vector x is for the planar coordinates of the network nodes. The resulting GMM is a statistical model fitted to the nodal coordinates of the reference grid, with an optimal selection of parameters (the Expectation–Maximization algorithm and the Bayesian Information Criterion are respectively used to fit M and θ to data);
  • Creation of synthetic network nodes: A predefined number N of random points, constituting the nodes of the synthetic network, are generated in accordance with the fitted GMM. The coordinates of the synthetic nodes are determined by sampling N random points from the statistical model. As a result, the spatial distribution of the synthetic nodes is consistent with the original network. Since the nodes are randomly extracted from the GMM, their location is different for every synthetic network. In all the synthetic networks, N is set equal to 373 (the same network size as the reference grid is used);
  • Establishment of basic network connectivity: Network connectivity is established by progressively adding connections among pairs of synthetic nodes. Node-to-node links are formed until all the nodes are included in the growing structure of the network. A probabilistic approach is followed, which favors links among close pairs of nodes to avoid unrealistic long-range connections. The resulting network is a connected graph with a tree structure featuring—by definition—N-1 edges;
  • Network reinforcement: As gas networks are typically looped systems, additional pipelines are included in the tree-shaped network model to create loops. In medium-pressure networks, loops are established with the aim of improving the connectivity of the network. Therefore, the additional links are formed among those node pairs featuring the largest ratio between the topological distance (i.e., length of the network paths connecting the two nodes) and the physical distance (i.e., the Euclidean distance between the two nodes). The number of loops in a synthetic network is established in a random fashion, accounting for the variability of specific cycle numbers in real-world MP gas networks, which is observed to range between 0 and 0.124 loops/km.
A simple illustrative example is shown in Figure 1 to clarify the above step-by-step procedure. Further details on the proposed method can be found in [26,29].

2.1.2. Technical Parameters of the Synthetic Networks

Network topologies created as from above require to be assigned with technical specifications to constitute finished case studies readily deployable for simulation applications. A dedicated algorithm is used to perform the technical sizing of the networks [24].
The sizing process guarantees admitted intervals of operational conditions. Distribution systems are, in fact, normally designed to comply with hydraulic restrictions indicated by standards and legislations. Among the restricted variables, constituting input design parameters to the algorithm, are [27,30]:
  • The maximum allowable operating pressure (MAOP): it represents the maximum pressure at which the system can be continuously operated at ordinary working conditions;
  • The design minimum pressure (DMP): it is the minimum pressure level to be guaranteed across the system to ensure the safe and correct operation of customer appliances, service regulators and intermediate pressure reduction stations;
  • The maximum gas flow velocity in pipelines: it constitutes a further constraint to prevent excessive mechanical stress, noise, dragging of impurities and corrosion of pipelines.
The above restrictions may vary according to the pressure tier at which the network is operated, and differences exist among national conventions. In Italy, MP networks belonging to the 4th species are constrained to operate between 5 bar and 1.5 bar, with gas flow velocities not higher than 20–25 m/s [27,28].
The following steps are followed to convert the synthetic grid topologies into finished network models:
  • Identification of the source node: the gas infeed point is identified in one node randomly selected among the end-nodes of the network—i.e., the nodes with a number of connections (or degree) equal to one. The selected node acts as the source of natural gas for the whole distribution system. Its pressure is assumed fixed and equal to the MAOP (i.e., 5 bar). The source node may represent a reduction and metering station fed by the upstream (high pressure) infrastructure or, in the case of islanded systems, a GNL storage tank and injection site;
  • Identification of consumption nodes: loads are located in all the end nodes of the network, excluding the city gate. Being the network a medium-pressure infrastructure, load nodes may indiscriminately be large (e.g., industrial and commercial) gas users or MP/LP pressure regulators feeding downstream grid sections;
  • Assignment of load values to consumption nodes: a total load of 30 MW is distributed among the consumption nodes, according to a suitable statistical model (Weibull distribution is adopted here);
  • Technical sizing of the grid: having identified the location of the infeed site, the consuming nodes and their thermal loads, a rigorous system design is carried out respecting target operational restrictions (MAOP, DMP and maximum velocity).
With given input design parameters, the main objective of the algorithm deployed for the technical sizing is the assignment of suitable diameters to the pipelines of the network. The procedure ensures that, at design conditions, all the nodes are characterized by acceptable pressure values (p ≥ DMP), and all the pipelines feature admitted velocities (vvmax) when the pressure at the source node equals the MAOP.
The technical sizing of the grid returns the minimum design solution to meet a given design value of gas consumption. Network oversizing—normally desirable for future system extensions, as well as for larger system flexibility and operational tolerances—is modeled by assuming a utilization coefficient u equal to 0.6. The coefficient u provides a relation between the total maximum load—i.e., the network load at peak demand conditions—and the total design load—i.e., the gas demand for which the network is designed and which, therefore, could be potentially sustained by the system. Calling Li the gas load of the ith consuming node at maximum ( L i M a x ) and design ( L i D e s i g n ) load conditions, the following relation is therefore given.
i L i max = u · i L i D e s i g n                     i = 1 ,   ,   N L o a d s
The value of u is selected equal to 0.6 consistently with observations on real-world networks, as well as with approaches adopted for other energy network infrastructures (power grids) [31]. Accordingly, while the maximum gas demand of the synthetic grids is 30 MW, the total load for which the networks are designed amounts to 50 MW.
A summary of the properties of the synthetic networks and of the technical parameters adopted for their creation is provided in Table 1. A sample of finished network models created as from above is illustrated in Figure 2.

2.2. Gas Network Analysis in the Presence of Hydrogen

Fluid dynamic simulations are carried out over all the 1000 gas grids with increasing penetrations of hydrogen over the total gas demand. The simulations are executed at steady-state and peak demand conditions. A stationary and non-isothermal fluid dynamic model is used for this purpose, which provides the numerical solution of the network-wide equations of mass, momentum and energy conservation. The model also accounts for the copresence of different gas sources, being able to map the molar composition and the thermophysical properties of the gas across the network in the presence of distributed injections of alternative fuels such as hydrogen. For a complete description of the fluid dynamic model adopted for the simulations, please refer to [18].
The extent to which H2 affects the gas network operations is evaluated by observing the fluid dynamic response of the system and the thermophysical properties of the H2–NG blend delivered to the nodes of consumption.
Hydrogen (ρH2 = 0.125 kg/Sm3, HHVH2 = 12.08 MJ/Sm3) is about eight times lighter than methane, and its volume-based higher heating value (HHV) is about three times lower. Accordingly, introducing hydrogen into gas grids alters the system hydraulics and the thermophysical properties of the distributed gas mixture.
The lower volume-based HHV of H2–NG blends with respect to pure natural gas requires higher volume flow rates to supply equivalent thermal powers to the end-users. Further operational changes occur when H2 is injected in distributed sites of the network, which has the effect of converting part of the grid to active infrastructure with the internal generation of fuel. Both aspects have a direct effect on the gas velocities and on the pressure profiles across the system, potentially undermining its correct functioning as under- and over-pressures and maximum velocity violations may arise.
The variation in the thermophysical properties of H2–NG mixtures with increasing fractions of hydrogen is illustrated in Figure 3. In the same figure, the bounds for the thermophysical properties indicated by the Italian legislation are included. While limits on maximum H2 concentrations are not always prescribed by the legislation (as in the Italian regulatory framework), restrictions are typically applied to the HHV, relative density and Wobbe Index.
The specific gravity (or relative density) ρ S is a dimensionless property providing the ratio between the densities of the gas mixture and a reference (air with molar mass equal to 28.965 kg/kmol, according to [32]), computed at reference conditions. The Wobbe Index (WI) provides a measure of the interchangeability of different gases for combustion applications, as it is proportional to the heat input to a burner at constant pressure [33]. It is defined as follows:
W I = H H V ρ S
In Italy, restrictions on the quality of gas are indicated by [34]. Prescribed thermophysical boundaries are included in the charts of Figure 3, where it can be observed that gas quality violations may arise for relatively low hydrogen admixture levels. The specific gravity constitutes the most binding parameter, for which a maximum of 9% vol of hydrogen is permitted. Hydrogen concentrations higher than 15% vol cause violations of HHV restrictions as well. Wobbe index limits cause weaker restrictions on the maximum admitted hydrogen concentration, which may be pushed up to 22% vol without violations. The properties of H2–NG blends are sensitive to the considered composition of natural gas, which, in this study, is as indicated in Table 2.
Increasing levels of hydrogen penetration are considered in the analysis. With the term penetration, it is here meant the volume fraction of the gas consumed within the grid is constituted by hydrogen. This quantity is denoted in the following relations as x H 2 , where it is deployed to evaluate the volume flow rate of hydrogen Q ˙ H 2 injected into the grid when the sum of the loads (thermal powers) i P i t h is a known input:
Q ˙ H 2 = x H 2 Q ˙ B l e n d
where
Q ˙ B l e n d = i P i t h H H V B l e n d
and
H H V B l e n d = x H 2 H H V H 2 + ( 1 x H 2 ) H H V N G
Q ˙ B l e n d is the volume flow rate of the H2–NG blend consumed by the network, and HHV represents the volume-based higher heating value at standard conditions.
With these premises, the analysis is carried out with the following values of hydrogen penetration: 0%, 1%, 3%, 5%, 10%, 20%, 30%, 40%, 50%, 75%. Penetration levels span from initial exploratory admixture levels up to extreme scenarios of systems that are predominantly operated on H2.
The impact of hydrogen on the system hydraulics and gas quality strongly depends on the location of the hydrogen injection within the grid, as well as on its introduction in pure or blended form. For this reason, two different strategies for introducing hydrogen in existing grids are investigated.

2.2.1. Upstream Blending of Hydrogen with Natural Gas (Case A)

In the first case, an H2–NG blend is supplied from the main city gate to the grid as if the gas blending occurred upstream of the distribution system or in correspondence with the reduction and metering station. Introducing H2 at the city gate may be desirable for several reasons. In the first place, it is useful for maximizing the uniformity of gas quality across the grid. Additionally, pipelines located close to the city gate typically offer a higher distribution capacity, which can more suitably accommodate the injection of non-conventional fuels, with lower impacts on the system fluid dynamics (with particular attention to pressure drops and maximum flow velocities).

2.2.2. Distributed Injection of Hydrogen (Case B)

In the second case, hydrogen is injected in random locations within the grid in pure form. In fact, it is not always possible to foresee the installation of power-to-gas facilities and/or pressurized hydrogen storage tanks nearby the natural gas city gate. The first reason relies on the geographical and safety constraints that typically are applied to these systems. Another aspect is that, in the selection of the location for a power-to-gas (PtG) facility, priority may be given to maximizing the benefits on the electrical side. PtG plants, and the annexed connection to the gas grid, may therefore be installed nearby renewable power generation plants and in saturated regions of the electrical network, in view of providing grid services. In the above cases, the gas grid accepts the location of the injection of hydrogen as is.
For the above reasons, in this stage, simulations are carried out assuming a random location of the hydrogen injection, as long as the injection node complies with some constraints that exclude unfeasible or unrealistic locations. In particular, the injection of H2 must occur at nodes with zero loads and be served by pipelines with sufficient capacity for the injected volumes. The pipeline capacity is considered adequate whenever its cross-sectional area allows transporting the required amount of hydrogen without exceeding the maximum velocity of 25 m/s.

3. Effect of Blending Hydrogen in Distribution Gas Grids

The effect of blending hydrogen in gas networks is assessed by observing the fluid dynamic response of the networks and the quality of gas delivered to the points of consumption in the distribution system.
As long as the system hydraulics are concerned, it is here assessed the extent to which hydrogen admixtures affect the network nodes, as well as the velocities of gas in the pipelines, at steady-state peak load conditions. Regarding the gas quality aspects, changes in the physical properties of the distributed blend are evaluated at increasing H2 penetrations. Standard physical parameters are observed, including the higher heating value (HHV), the specific gravity and the Wobbe index (WI).
The results are separately presented for the cases involving the supply of H2–NG blends from the city gate and the injection of pure hydrogen in random locations within the grid.

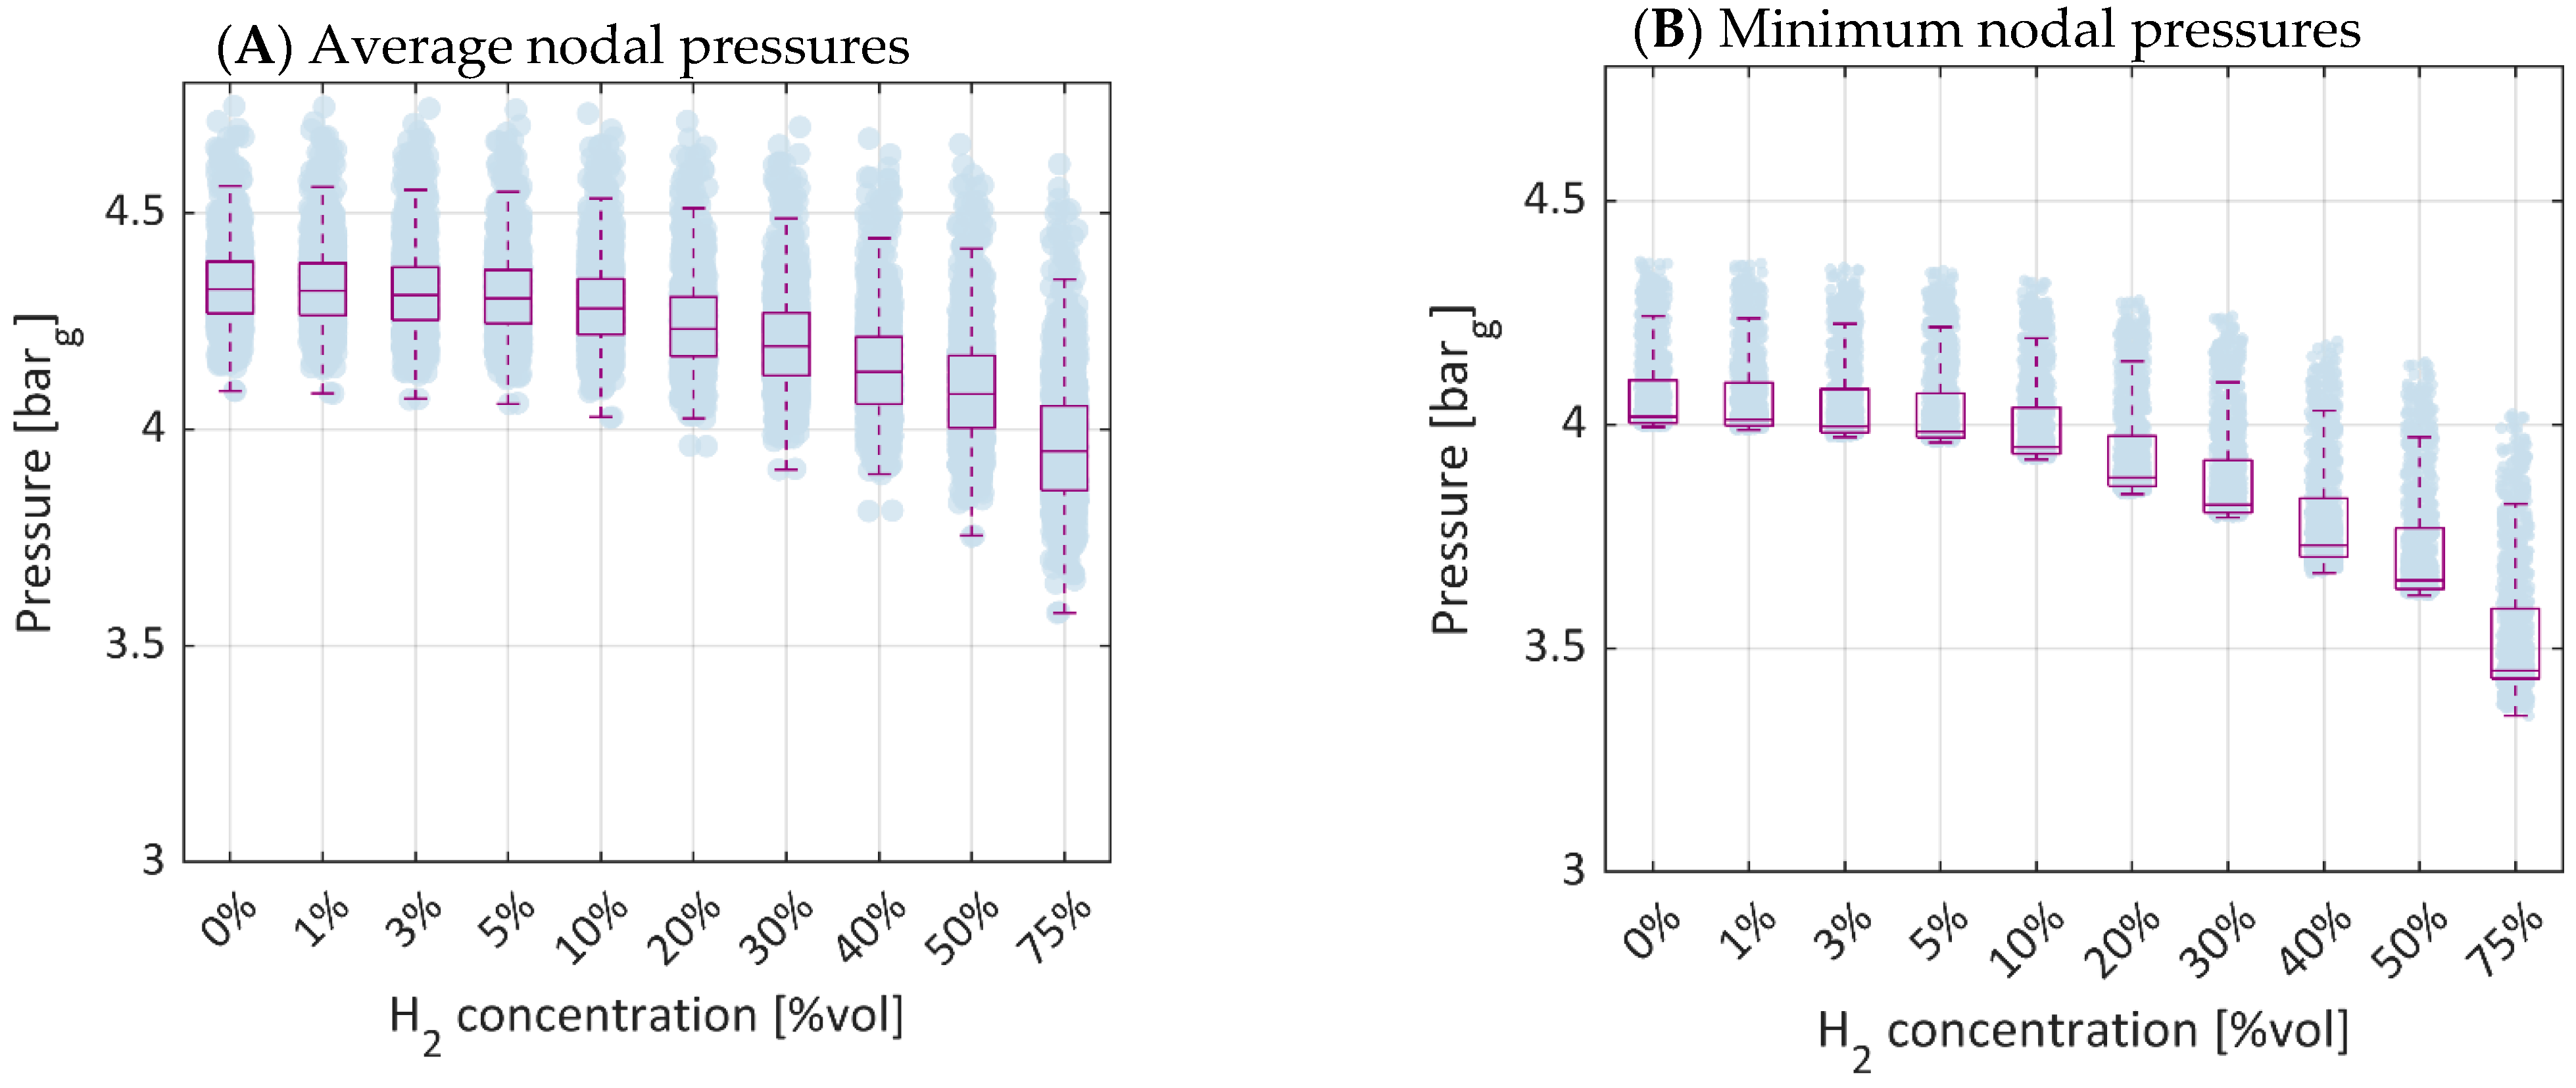
3.1. Case A: Effect of Injecting H2–NG Blends at the Network City Gate

The upstream injection of hydrogen provides homogeneity to the gas composition in the network, regardless of the admixture levels of H2. Accordingly, the effects of injecting hydrogen in blended form from the city gate are uniformly observable across the grid. The network-wide compliance with the restrictions on the thermophysical properties of the blend depends on the admixture level, in the same way as illustrated in Figure 3. Therefore, as already pointed out in Section 2.2, gas quality violations should be expected in all the networks whenever hydrogen admixture levels are higher than 9% vol (due to specific gravity), 15% vol (higher heating value) and 22% vol (Wobbe index).
The upstream introduction of hydrogen causes different fluid dynamic responses among the simulated grids. A statistical approach is adopted in Figure 4 and Figure 5 to illustrate the network fluid dynamic behaviors (i.e., pressures and velocities) at increasing H2 admixtures making use of boxplots. Boxes in the charts span from the 25th to the 75th percentile of the observations. Whiskers (dashed lines) cover the remaining data not detected as outliers. Every point corresponds to one observed network, and outliers are included.
The upstream introduction of hydrogen causes a general reduction in the pressure across the network (see Figure 4). This trend is driven by an increase in the volume flow rates across the network due to the lower density of hydrogen with respect to natural gas (see the variation in the specific gravity in Figure 3B)—partly compensated by a lower viscosity. Despite this trend, no violations in the minimum pressure (1.5 bar) are recorded. Minimum pressures amount to 4.1 bar on average with 100% NG and linearly decrease to 3.5 bar when grids run with 75% vol of hydrogen. The results suggest that even high admixtures of hydrogen should not pose serious concerns of underpressure contingencies, as long as the system does not operate too close to its maximum capacity—and is therefore characterized by sufficient operational margins.
Another evident effect caused by the introduction of hydrogen is represented by a general increase in the velocities of the blend, as shown in Figure 5. Nevertheless, thanks to the high capacity of the pipelines surrounding the city gate, the effect does not cause velocity violations in all the cases, even for admixtures of 75% vol. In this latter case, the highest recorded velocity is, in fact, 25.0 m/s.
The fluid dynamic responses of the network’s evidence that the infrastructures offer an adequate capacity for the upstream introduction of hydrogen in blended form with natural gas. Operational violations and needs of network reinforcement may arise for an infrastructure operating closer to its maximum capacity, featuring more narrow operational margins.

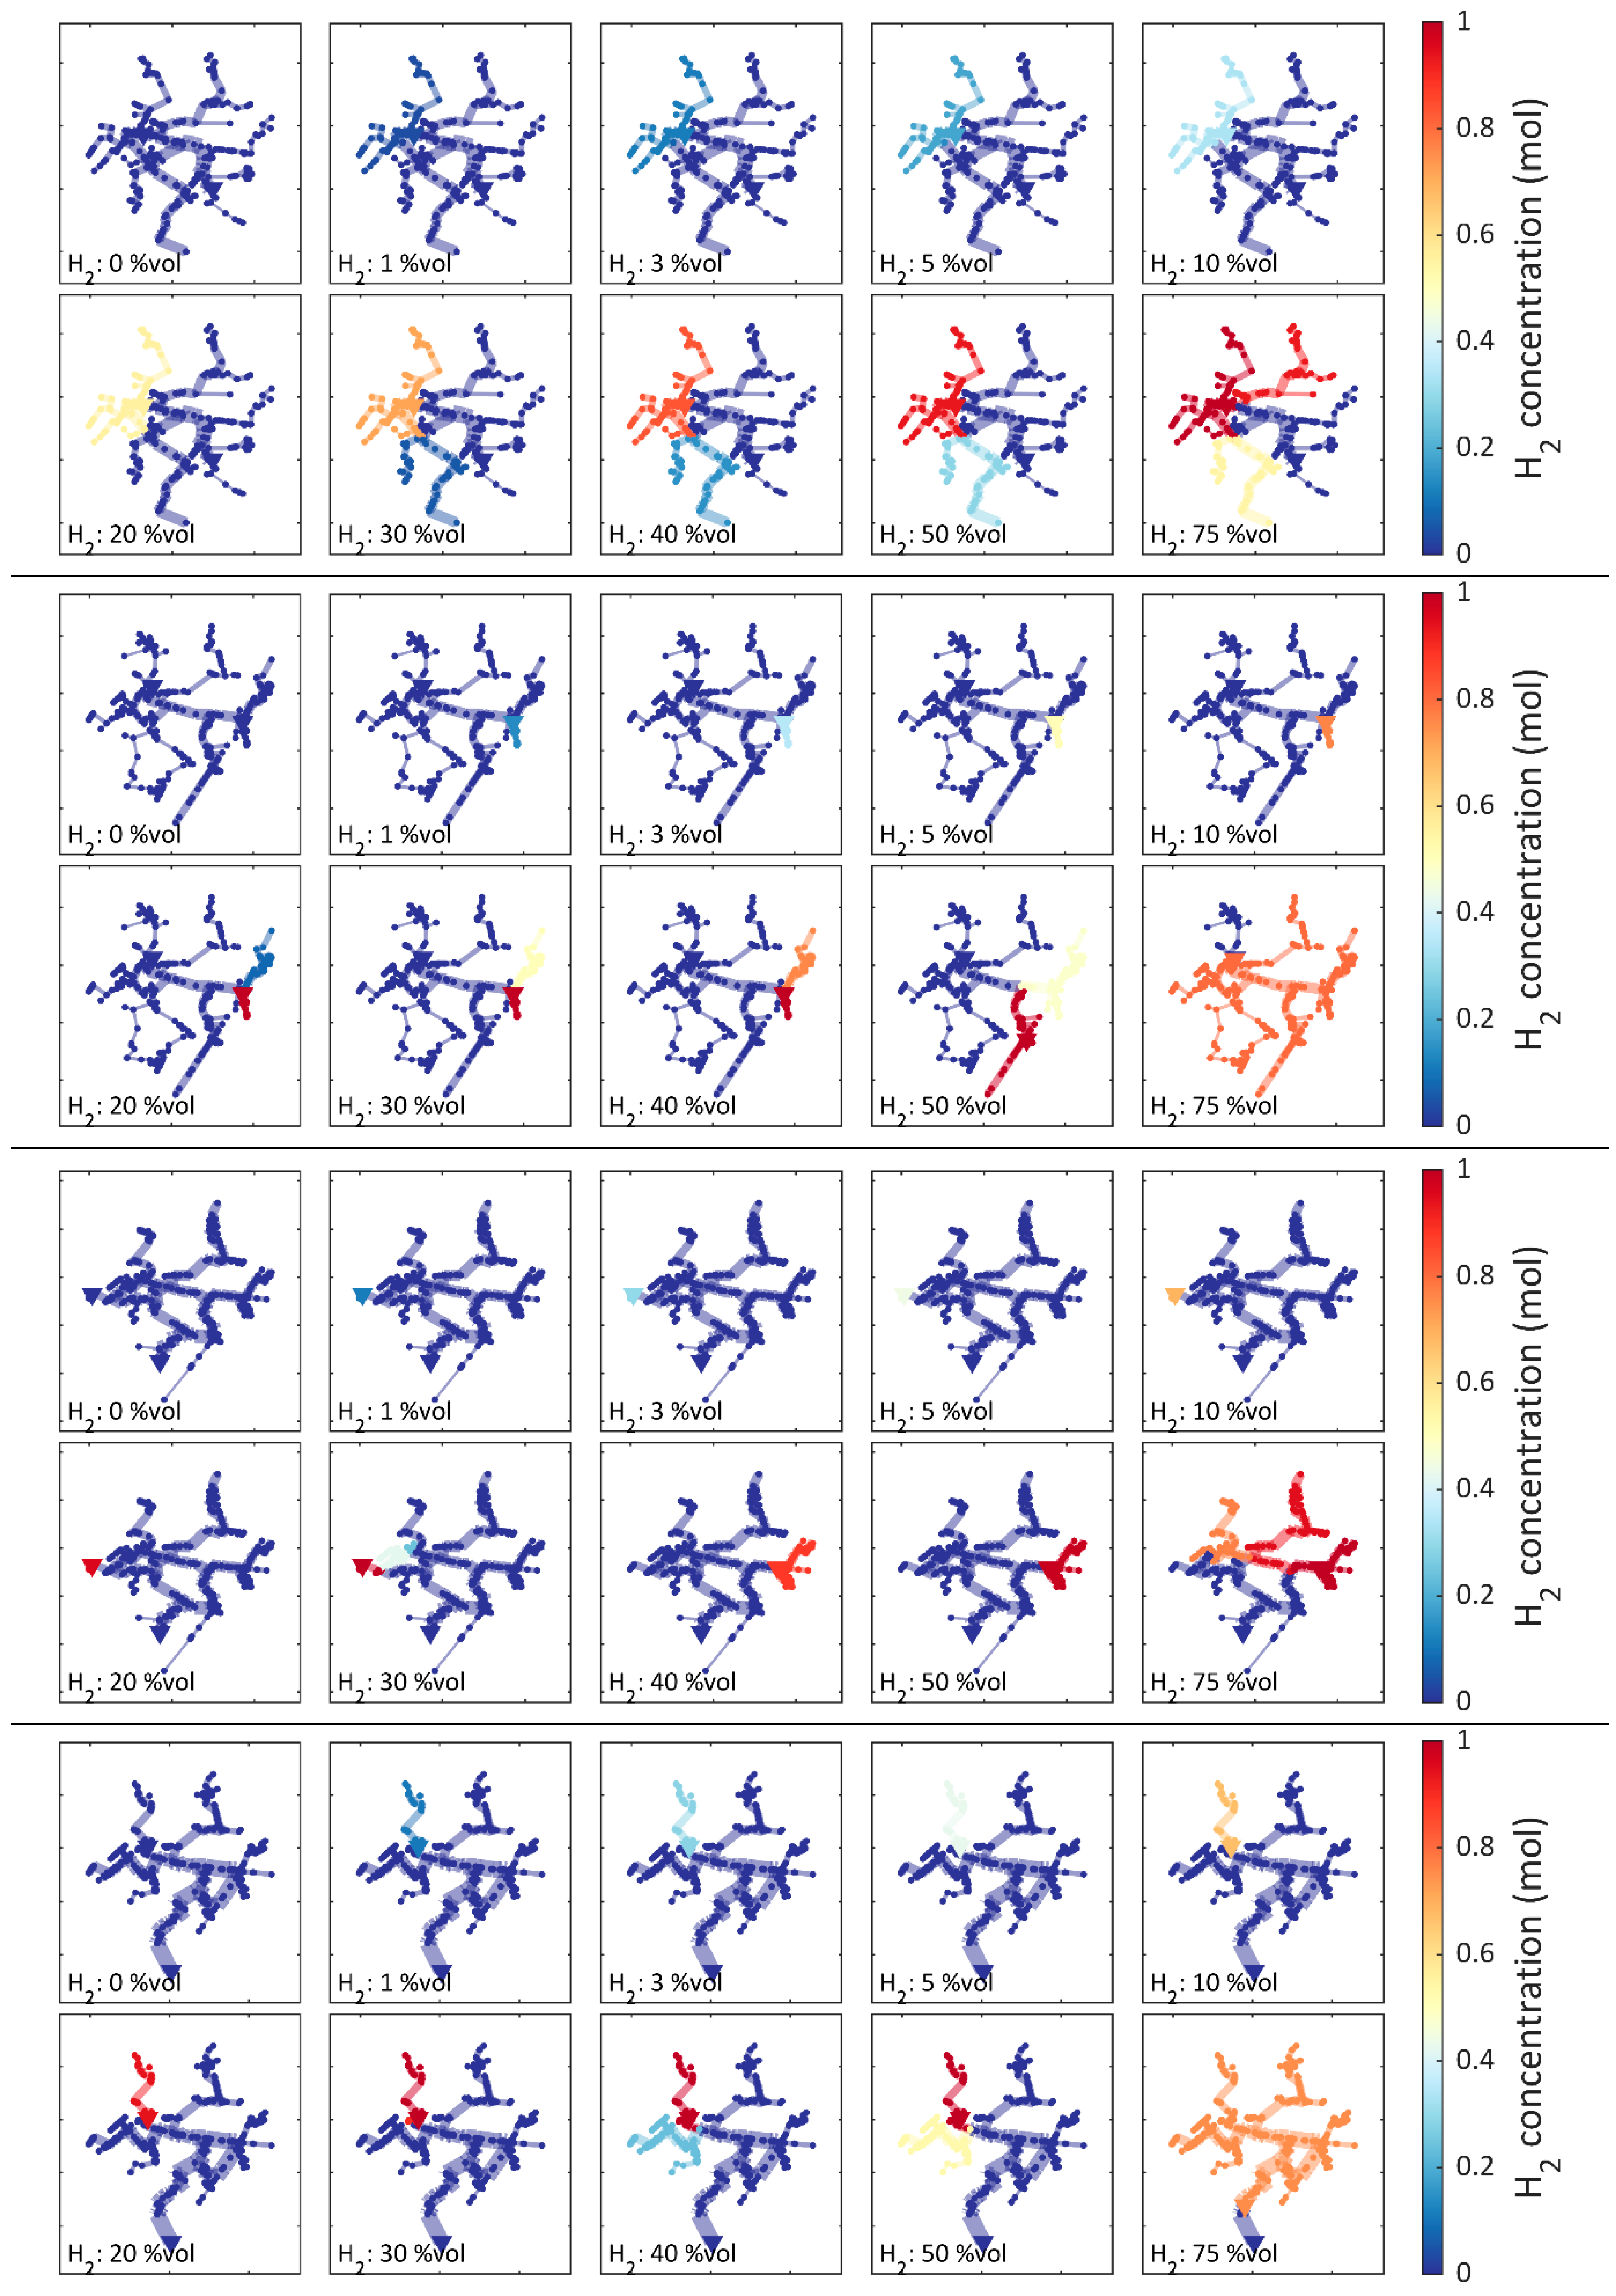
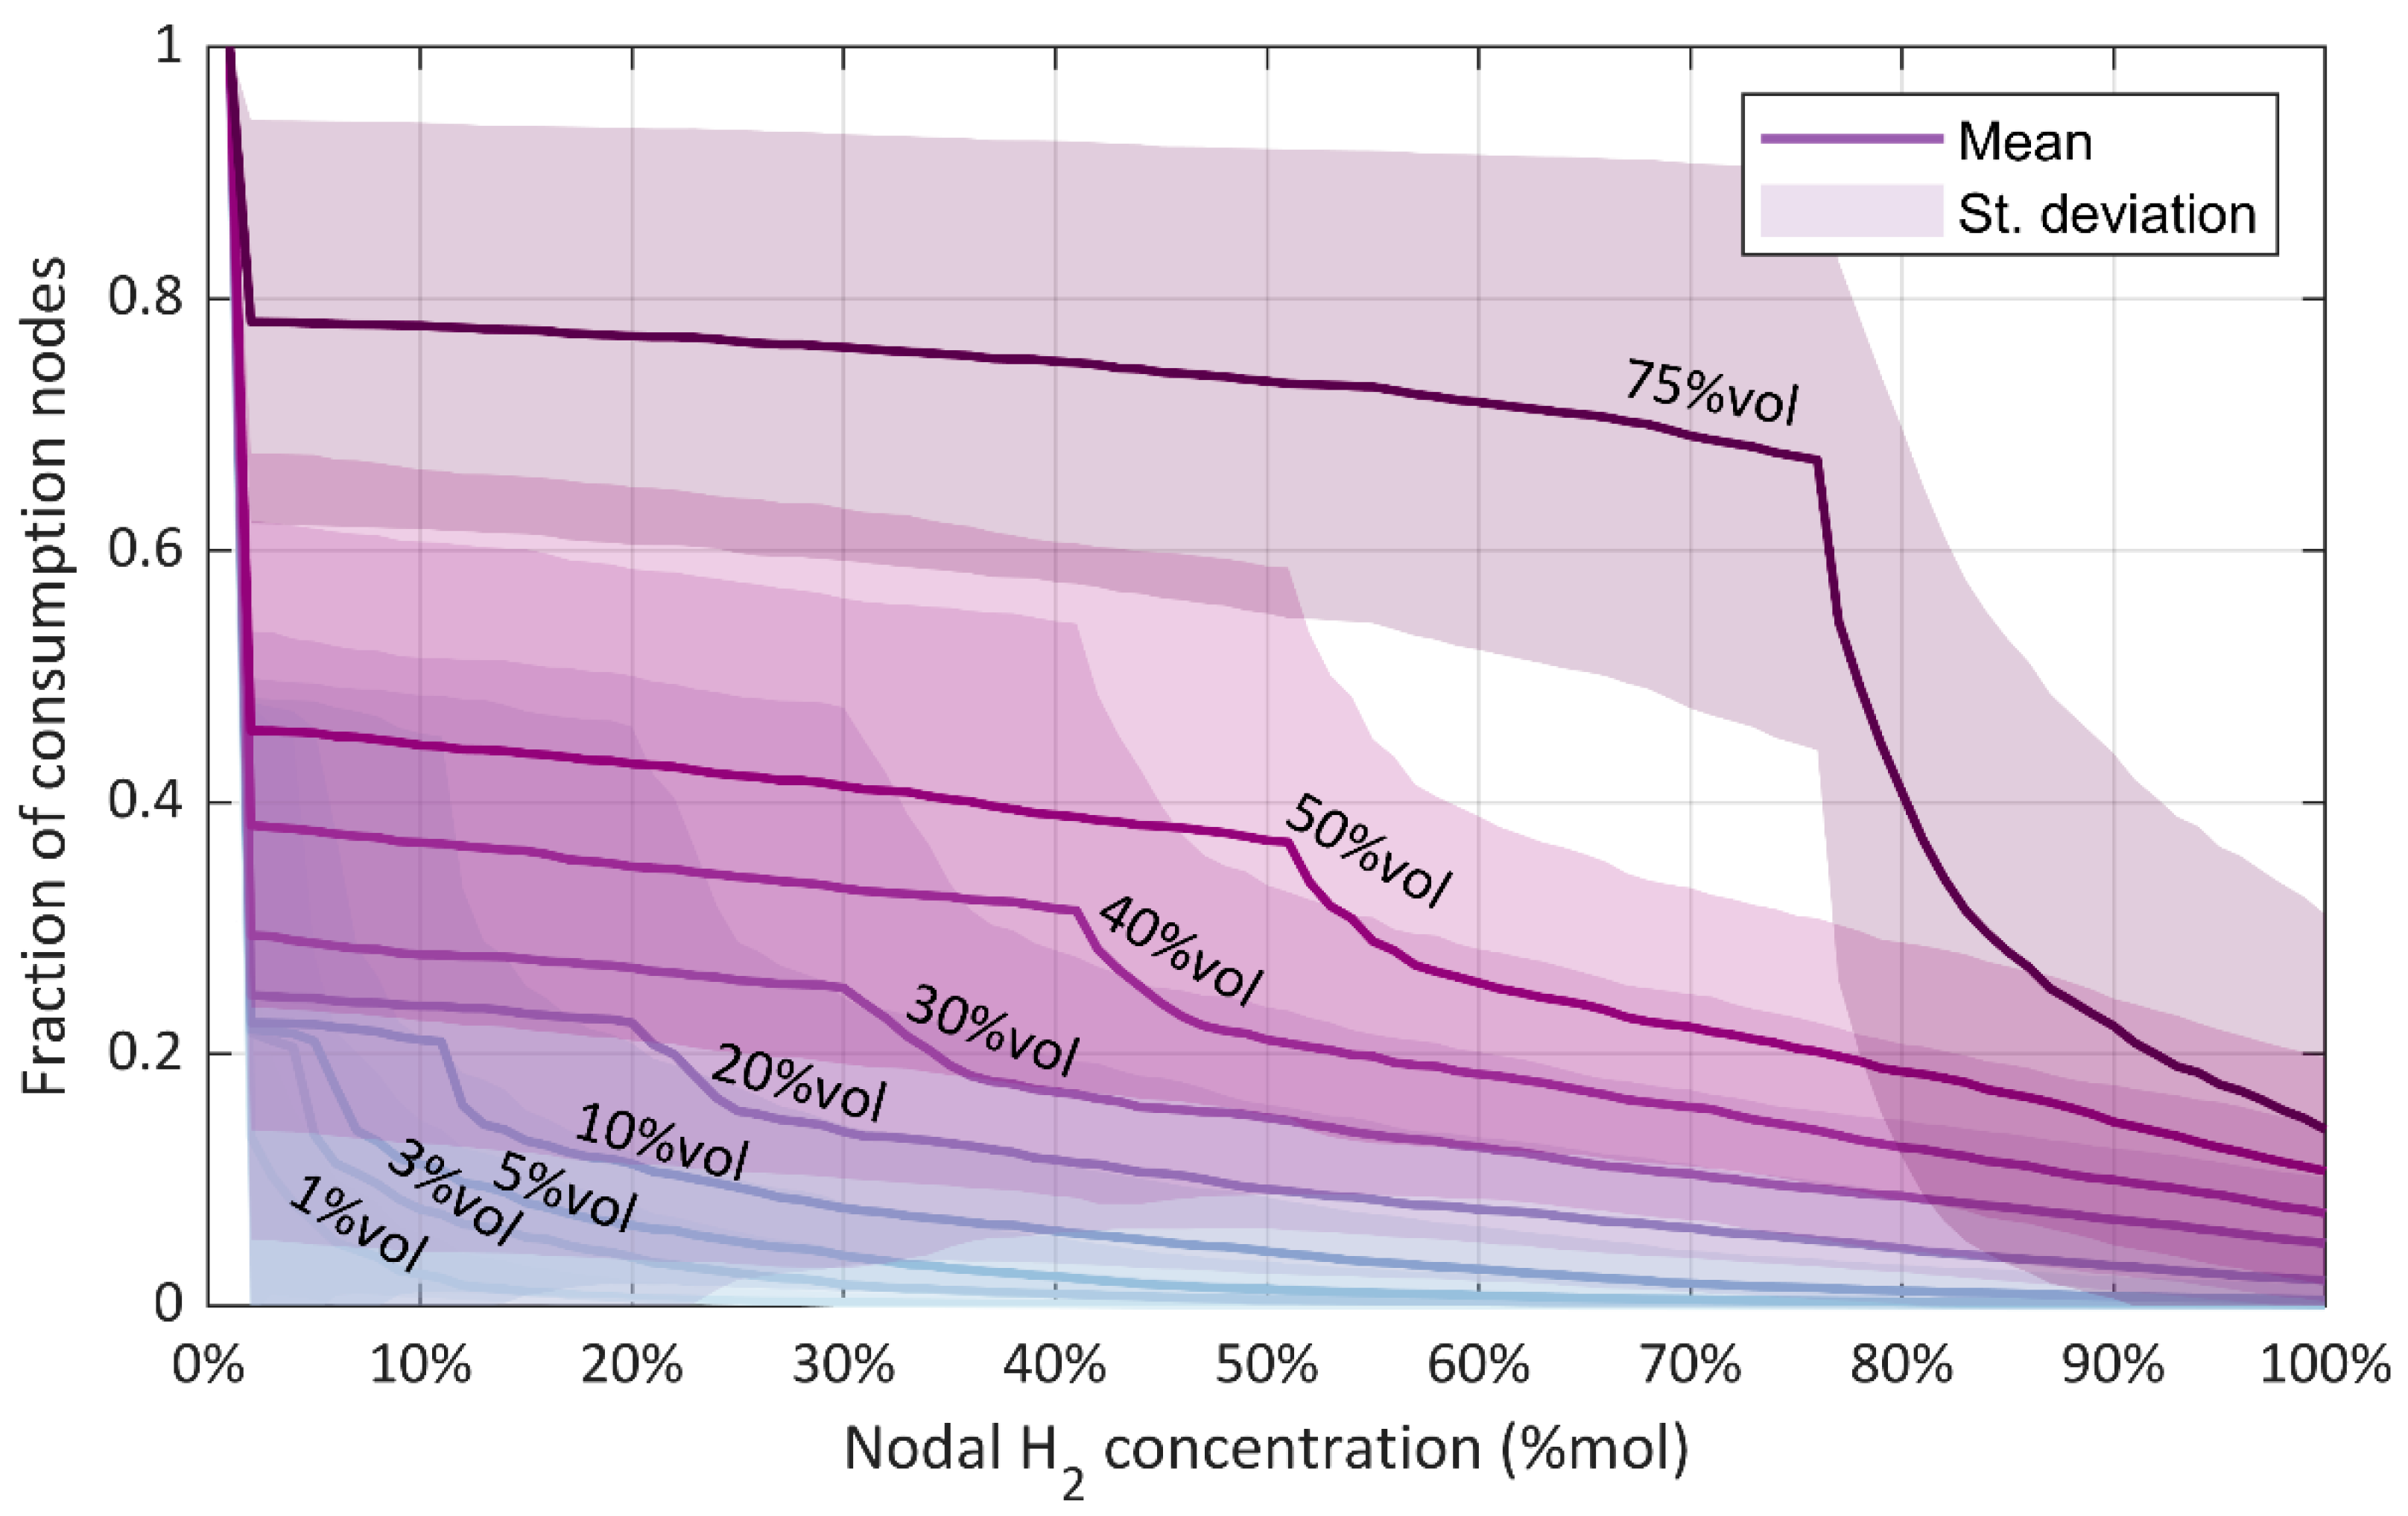
3.2. Case B: Effect of Injecting Pure H2 in Random Network Locations

Intuitively, a lower uniformity in the composition of the gas is obtained when the injection of pure hydrogen occurs at arbitrary locations within the network. The point of injection may be found close to the NG city gate or in remote areas of the distribution grid. The resulting stationary patterns of the H2 concentrations at increasing penetration levels are depicted in Figure 6. The injection of pure hydrogen within the grid produces local areas with high H2 concentrations. It can be seen that, even at modest H2 penetration levels (e.g., ≤20% vol), clusters of nodes surrounding the point of injection are likely to receive H2-rich blends (in some cases ≥60% mol), while the remaining regions of the network receive natural gas in predominant shares or pure form.
Triangles in the same charts of Figure 6 indicate points of gas supply. The triangles on the left-hand side (blue color) constitute NG city gates. The remaining triangles in random locations within the grid represent the points of H2 injection. It can be noticed that the H2 injection may change the location at increasing hydrogen penetrations. In fact, as mentioned before, the H2 injection point is by assumption identified among those nodes served by an adequate pipeline capacity. When both the penetration of hydrogen and, therefore, its flow rate increase, the injection node may require to be changed. The newly selected nodes are found in network areas with higher pipeline capacities that are typically found closer to the main NG city gate.
A statistical analysis of the H2 concentrations delivered to the consumption nodes based on the cumulative distributions of the simulated grids is illustrated in Figure 7. For each network-wide hydrogen penetration level (overall volume percentage), the chart indicates the fraction of consumption nodes for which the molar concentration of H2 exceeds a given value. Average curves (continuous lines) are calculated over the 1000 synthetic network realizations. Shaded areas around the average lines account for the standard deviations. What emerges is that, on average, a significant number of users receive higher hydrogen (molar) concentrations than the targeted network-wide (volume) H2 penetration. As a matter of example, when a 10% vol of hydrogen is targeted in the system, more than 20% of the nodes receive a hydrogen concentration higher than 10% mol on average. In some cases (see upper bound of the corresponding shaded area), even around 45% of the nodes may receive concentrations higher than 10% mol.
When the injection of H2 occurs at random and peripherical nodes of the grid, gas quality in the surroundings is sensibly affected. Due to the uneven distribution of the H2 concentrations, violations of quality constraints are obtained with even small quantities of hydrogen (Figure 8). Violations on WI, HHV and specific gravity are already recorded at overall H2 penetrations of 1% vol. Gas qualities at nodes become systematically not compliant to legislative restrictions (100% of the networks) when admixtures equal to or higher than 10% vol are targeted. Nevertheless, at 10% vol of hydrogen penetration, a minority of the grids (around 8%) still complies with WI and HHV limits.
The fluid dynamic responses of the networks to the distributed injection of pure hydrogen are illustrated in Figure 9 and Figure 10. Consistently with the previously analyzed case of introducing H2 at the city gate (Case A), enhanced pressure drops may be obtained at increasing H2 penetration levels. In most of the simulated random cases, however, H2 is supplied in peripherical regions of the grids (i.e., not nearby the source of NG). In these conditions, the forced injection of H2 produces the effect of raising the pressure levels of the surrounding nodes. Accordingly, the effect on the nodal pressures sensibly depends on the location of the hydrogen injection and may either enhance pressure drops when H2 is introduced close to the city gate or provide for higher pressures when the injection occurs in peripherical areas. At high hydrogen penetrations (75% vol), the restrictions on the location of the H2 injection have an evident effect. As hydrogen is injected at nodes closer to the city gate—served by higher pipeline capacities—average and minimum pressures tend to decrease.
While minimum pressure constraints are never violated, a few overpressure contingencies are recorded starting from penetrations of 30% vol of H2 (0.4% of cases) and become more frequent for higher penetration levels (5.6% of occurrences at 50% vol H2 and 9.7% of occurrences at 75% vol H2).
As in the previous case, the injection of H2 causes a general increase in the gas velocities (see Figure 10). Risks of exceeding the velocity limits of 25 m/s are higher than in Case A. Violations are recorded starting from H2 penetrations of 30% vol and become more frequent at higher penetration levels. Limits are exceeded in 16% of the networks when hydrogen accounts for 75% vol of the distributed blend. In these cases, the maximum recorded velocities are in the order of 35 m/s, indicating that minor modifications to the infrastructures may help meeting the upper limit of 25 m/s.

4. Conclusions

The proposed study has provided a statistical assessment of the effect of deploying hydrogen in existing gas networks. The results are derived by steady-state fluid dynamic simulations based on one thousand synthetic gas grid models. Two main cases were investigated, the first of which assumes that NG–H2 mixtures are supplied to the system from the city gate (desirable option for uniform H2 concentrations) and the latter using arbitrary locations for the injection of hydrogen (a possible scenario in the case of power-to-gas plants at the service of the electrical grid).
The responses of the networks were compared against operational and quality limits set by Italian law. The results provide evidence that the principal criticalities linked to the use of H2 are on the quality of gas, while no violations on the system hydraulics are recorded in most cases, even for significant hydrogen penetration levels.
Larger H2 contributions to the total demand are obtainable when hydrogen is blended with natural gas and supplied from the system city gate. In these conditions, effects are mitigated both on the velocities and on the quality of the blend (higher heating value, specific gravity, Wobbe index), which is uniform all across the grid. Quality violations are recorded whenever H2 admixture levels are higher than 9% vol, representing specific gravity as the tightest constraint. The deployment of hydrogen causes an increase in the gas velocities and in the pressure drops, but no violations of the prescribed operational limits are recorded even for extreme admixtures of 75% vol.
The sensitivity of the networks is significantly higher to pure hydrogen injections from arbitrary locations, causing significant asymmetries in the composition of gas delivered to the users. Serious quality issues are encountered at early-stage hydrogen penetration levels (1% vol), while H2 penetrations of 10% vol or higher produce violations in 100% of the grids. Networks for which the injection of H2 occurs in peripherical network areas experience a local increment of pressures, as well as overall velocity increases. Hydraulic-related issues (overpressures and violations of maximum velocity) are recorded starting from H2 admixtures of 30% vol onwards, affecting 16% of the networks at extreme overall H2 fractions of 75% vol. These figures may result significantly more severe in the absence of constraints for the location of the hydrogen infeed point, including weak network areas among the candidate injection sites.
The findings evidence that medium-pressure distribution systems offer an overall adequate structural readiness to accommodate even significant shares of hydrogen. The main barrier to a massive deployment of H2 is constituted by quality requirements (specific gravity in first place). Transitional and demonstrational applications of hydrogen injections with total contributions up to around 10% vol (slightly depending on the composition of natural gas—9% vol is the limit for this case) can, however, take place with low risks of non-compliance to the thermophysical requirements of the gas, as long as attention is given to the location of the injection facility. In this regard, foreseeing the injection of hydrogen in higher-capacity network areas—as well as in correspondence or in the proximity of the main city gate—mitigates the risk of overpressure, maximum velocity and gas quality violations.
Through the statistical analysis, this paper sheds light on hydrogen blending into the natural gas grid with respect to increasing hydrogen volume concentration and injection points. Overall, results provide guidelines for the most advantageous hydrogen injection points that can help operators in the planning of power-to-gas infrastructure. Furthermore, the work provides insights into injecting hydrogen in pure or blended form, arising the issue of network monitoring in terms of required new tools and balance of responsibility among gas and power-to-gas operators.

Author Contributions

Conceptualization, E.V., P.L. and I.S.S.; methodology, E.V., R.T. and I.S.S.; software, data curation and validation, E.V. and R.T.; writing—original draft preparation, E.V.; writing—review and editing, E.V., P.L. and I.S.S.; supervision and funding acquisition, I.S.S. and P.L. All authors have read and agreed to the published version of the manuscript.

Funding

This research received no external funding.

Conflicts of Interest

The authors declare no conflict of interest.

References

  1. British Petroleum Statistical Review of World Energy 2020, 69th ed. 2020. Available online: https://www.bp.com/en/global/corporate/energy-economics/statistical-review-of-world-energy.html (accessed on 21 December 2020).
  2. Odyssee-Mure Project Sectorial Profile: Households. Available online: https://www.odyssee-mure.eu/publications/efficiency-by-sector/ (accessed on 15 June 2021).
  3. UNFCCC Secretariat. Paris Agreement. 2015, pp. 1–27. Available online: https://unfccc.int/sites/default/files/english_paris_agreement.pdf (accessed on 21 December 2020).
  4. European Commission. Stepping up Europe’s 2030 Climate Ambition; COM (2020) 562 Final; European Commission: Brussels, Belgium, 2020; pp. 1–23. [Google Scholar]
  5. Davis, S.J.; Lewis, N.S.; Shaner, M.; Aggarwal, S.; Arent, D.; Azevedo, I.L.; Benson, S.M.; Bradley, T.; Brouwer, J.; Chiang, Y.M.; et al. Net-zero emissions energy systems. Science 2018, 360, aas9793. [Google Scholar] [CrossRef] [PubMed] [Green Version]
  6. International Energy Agency. World Energy Outlook 2020; International Energy Agency: Paris, France, 2020; pp. 1–461. Available online: https://www.iea.org/reports/world-energy-outlook-2020 (accessed on 21 December 2020).
  7. Memon, Z.A.; Trinchero, R.; Manfredi, P.; Canavero, F.; Stievano, I.S. Compressed Machine Learning Models for the Uncertainty Quantification of Power Distribution Networks. Energies 2020, 13, 4881. [Google Scholar] [CrossRef]
  8. Quarton, C.J.; Samsatli, S. Power-to-gas for injection into the gas grid: What can we learn from real-life projects, economic assessments and systems modelling? Renew. Sustain. Energy Rev. 2018, 98, 302–316. [Google Scholar] [CrossRef]
  9. Thema, M.; Bauer, F.; Sterner, M. Power-to-Gas: Electrolysis and methanation status review. Renew. Sustain. Energy Rev. 2019, 112, 775–787. [Google Scholar] [CrossRef]
  10. European Commission. A Hydrogen Strategy for a Climate-Neutral Europe; COM(2020) 301 Final; European Commission: Brussels, Belgium, 2020. [Google Scholar]
  11. Qadrdan, M.; Abeysekera, M.; Chaudry, M.; Wu, J.; Jenkins, N. Role of power-to-gas in an integrated gas and electricity system in Great Britain. Int. J. Hydrogen Energy 2015, 40, 5763–5775. [Google Scholar] [CrossRef]
  12. Guandalini, G.; Campanari, S.; Romano, M.C. Power-to-gas plants and gas turbines for improved wind energy dispatchability: Energy and economic assessment. Appl. Energy 2015, 147, 117–130. [Google Scholar] [CrossRef]
  13. European Commission. Powering a Climate-Neutral Economy: An EU Strategy for Energy System Integration; COM(2020) 299 Final; European Commission: Brussels, Belgium, 2020. [Google Scholar]
  14. Hydrogen Europe. Hydrogen in the EU’s Economic Recovery Plans; Hydrogen Europe. 2021. Available online: https://www.hydrogeneurope.eu/wp-content/uploads/2021/07/Hydrogen-Europe_EU-Recovery-Plan-Analysis_FINAL.pdf (accessed on 15 July 2021).
  15. International Energy Agency. Hydrogen Projects Database. Available online: https://www.iea.org/reports/hydrogen-projects-database (accessed on 11 January 2021).
  16. Abeysekera, M.; Wu, J.; Jenkins, N.; Rees, M. Steady state analysis of gas networks with distributed injection of alternative gas. Appl. Energy 2016, 164, 991–1002. [Google Scholar] [CrossRef] [Green Version]
  17. Sadler, D.; Cargill, A.; Crowther, M.; Rennie, A.; Watt, J.; Burton, S.; Haines, M. H21 Leeds City Gate Report. 2017, pp. 1–382. Available online: https://www.northerngasnetworks.co.uk/wp-content/uploads/2017/04/H21-Report-Interactive-PDF-July-2016.compressed.pdf (accessed on 21 December 2020).
  18. Pellegrino, S.; Lanzini, A.; Leone, P. Greening the gas network—The need for modelling the distributed injection of alternative fuels. Renew. Sustain. Energy Rev. 2017, 70, 266–286. [Google Scholar] [CrossRef]
  19. Gondal, I.A. Hydrogen integration in power-to-gas networks. Int. J. Hydrogen Energy 2019, 44, 1803–1815. [Google Scholar] [CrossRef]
  20. Osiadacz, A.J.; Chaczykowski, M. Modeling and Simulation of Gas Distribution Networks in a Multienergy System Environment. Proc. IEEE 2020, 108, 1580–1595. [Google Scholar] [CrossRef]
  21. Cavana, M.; Mazza, A.; Chicco, G.; Leone, P. Electrical and gas networks coupling through hydrogen blending under increasing distributed photovoltaic generation. Appl. Energy 2021, 290, 116764. [Google Scholar] [CrossRef]
  22. Cheli, L.; Guzzo, G.; Adolfo, D.; Carcasci, C. Steady-state analysis of a natural gas distribution network with hydrogen injection to absorb excess renewable electricity. Int. J. Hydrogen Energy 2021, 46, 25562–25577. [Google Scholar] [CrossRef]
  23. Elaoud, S.; Hafsi, Z.; Hadj-Taieb, L. Numerical modelling of hydrogen-natural gas mixtures flows in looped networks. J. Pet. Sci. Eng. 2017, 159, 532–541. [Google Scholar] [CrossRef]
  24. Vaccariello, E.; Trinchero, R.; Leone, P.; Stievano, I.S. Synthetic Gas Networks for the Statistical Assessment of Low-Carbon Distribution Systems. Available online: https://doi.org/10.31219/osf.io/tw9pa (accessed on 21 December 2020).
  25. Vaccariello, E.; Leone, P.; Canavero, F.G.; Stievano, I.S. Topological modelling of gas networks for co-simulation applications in multi-energy systems. Math. Comput. Simul. 2021, 183, 244–253. [Google Scholar] [CrossRef]
  26. Vaccariello, E.; Leone, P.; Stievano, I.S. Generation of synthetic models of gas distribution networks with spatial and multi-level features. Int. J. Electr. Power Energy Syst. 2020, 117, 105656. [Google Scholar] [CrossRef]
  27. Standard UNI 9165:2020, Gas Infrastructures—Pipelines for Maximum Operating Pressure up to and Including 0.5 MPa (5 bar)—Design, Construction, Testing, Operation, Maintenance and Rehabilitation 2020. Available online: https://www.uni.com/ (accessed on 21 December 2020).
  28. Autorità di Regolazione per Energia Reti e Ambiente (ARERA). Codice di Rete per il Servizio di Distribuzione Gas—CRDG. Available online: https://www.arera.it/it/gas/codicerete/crdg/crdg.htm# (accessed on 21 December 2020).
  29. Vaccariello, E. Synthetic Models of Distribution Gas Networks in Low-Carbon Energy Systems. Ph.D. Thesis, Politecnico di Torino, Turin, Italy, 2021. [Google Scholar]
  30. Ministero dello Sviluppo Economico (Italian Ministry of Economic Development) Decreto 16 Aprile 2008—Regola Tecnica per la Progettazione, Costruzione, Collaudo, Esercizio e Sorveglianza delle Opere e dei Sistemi di Distribuzione e di Linee Dirette del gas Naturale con Densità non Superiore a 0,8. Available online: https://www.mise.gov.it/images/stories/energia/di160408.pdf (accessed on 21 December 2020).
  31. Abeysinghe, S. A Statistical Assessment Tool for Electricity Distribution Networks. Ph.D. Thesis, Cardiff University, Cardiff, Wales, 2018. [Google Scholar]
  32. Standard ISO 6976:2016. Natural Gas—Calculation of Calorific Values, Density, Relative Density and Wobbe Indices From composition. Available online: https://www.uni.com/ (accessed on 21 December 2020).
  33. Segeler, C.G. Gas Engineers Handbook; Industrial Press, Inc.: New York, NY, USA, 1965; ISBN 10: 0831133872. [Google Scholar]
  34. Decreto Ministeriale 18 Maggio 2018—Gas Combustibile, Aggiornamento Regola Tecnica. Available online: https://www.mise.gov.it/index.php/it/normativa/decreti-ministeriali/2038129-decreto-ministeriale-18-maggio-2018-gas-combustibile-aggiornamento-regola-tecnica (accessed on 17 April 2021).
Figure 1. Example of synthetic network topology generation: a Gaussian Mixture Model is fitted to the node coordinates of the reference grid (A) and subsequently used to generate N points constituting the nodes of the synthetic network (B); the nodes are linked together in a tree-shaped network structure (C), which is finally assigned with additional connections forming loops (D).
Energies 14 05055 g001
Figure 2. Sample of 10 synthetic networks among the 1000 models used for the study.
Energies 14 05055 g002
Figure 3. Variation in thermophysical properties of H2–NG blends with volume concentrations of H2: (A) HHV, (B) specific gravity, (C) Wobbe index, with given natural gas composition.
Energies 14 05055 g003
Figure 4. Evolution of average (A) and minimum (B) nodal pressures recorded in 1000 networks with increasing H2 concentrations—H2–NG blend supplied from the city gate.
Energies 14 05055 g004
Figure 5. Evolution of average (A) and minimum (B) nodal pressures recorded in 1000 networks with increasing H2 concentrations—H2–NG blend supplied from the city gate.
Energies 14 05055 g005
Figure 6. Tracking of gas quality for four sample networks featuring increasing levels of H2 injections—pure H2 is injected within the network. Triangles represent nodes of gas supply (NG or H2).
Energies 14 05055 g006
Figure 7. Distribution of H2 concentrations received by consumption nodes: fraction of load nodes for which the received H2 molar concentration exceeds a given value—pure H2 injected within the network.
Energies 14 05055 g007
Figure 8. Physical properties of the H2–NG blend received by the most disadvantaged load (i.e., the consuming node with highest % H2) in 1000 networks.
Energies 14 05055 g008
Figure 9. Evolution of average (A) and minimum (B) nodal pressures recorded in 1000 networks with increasing H2 concentrations—pure H2 injected within the network.
Energies 14 05055 g009
Figure 10. Evolution of average (A) and maximum (B) gas velocities recorded in 1000 networks at increasing H2 concentrations—pure H2 injected within the network.
Energies 14 05055 g010
Table 1. Inputs adopted for the creation of synthetic networks and their technical sizing.
Number of Nodes373
Total peak load (design load)30 MW (50 MW)
MAOP5.0 bar
DMP1.5 bar
Maximum flow velocity vmax25 m/s
NG properties
Higher heating value53.4 MJ/kg
Specific gravity0.608
Table 2. Natural gas reference molar composition (main components).
CH4C2H6C3H8iC4H10nC4H10iC5H12nC5H12C6H14N2CO2
92.90%4.60%0.68%0.09%0.10%0.02%0.01%0.02%0.90%0.65%
Publisher’s Note: MDPI stays neutral with regard to jurisdictional claims in published maps and institutional affiliations.

