Article

Optimizing the Size of Autonomous Hybrid Microgrids with Regard to Load Shifting

1
Department of Electrical Engineering, Saint Petersburg Mining University, 2 21st Line, 199106 Saint Petersburg, Russia
2
Department of Economics, Organization and Management, Saint Petersburg Mining University, 2 21st Line, 199106 Saint Petersburg, Russia
*
Author to whom correspondence should be addressed.
Energies 2021, 14(16), 5059; https://doi.org/10.3390/en14165059
Submission received: 17 June 2021 / Revised: 3 August 2021 / Accepted: 12 August 2021 / Published: 17 August 2021
(This article belongs to the Special Issue Planning and Operation of Renewable Energy Systems)

Abstract

:
The article proposes a method of multipurpose optimization of the size of an autonomous hybrid energy system consisting of photovoltaic, wind, diesel, and battery energy storage systems, and including a load-shifting system. The classical iterative Gauss–Seidel method was applied to optimize the size of a hybrid energy system in a remote settlement on Sakhalin Island. As a result of the optimization according to the minimum net present value criterion, several optimal configurations corresponding to different component combinations were obtained. Several optimal configurations were also found, subject to a payback period constraint of 5, 6, and 7 years. Optimizing the size of the hybrid power system with electric load shifting showed that the share of the load not covered by renewable energy sources decreases by 1.25% and 2.1%, depending on the parameters of the load shifting model. Net present cost and payback period also decreased, other technical and economic indicators improved; however, CO2 emissions increased due to the reduction in the energy storage system.

1. Introduction

An important part of global sustainable development is the creation of an environmentally friendly energy sector [1]. In this regard, renewable energy sources (RESs) are widely developed in the world, the most common types of which are wind power systems (WPSs) and photovoltaic systems (PVSs) [2,3]. Their total installed capacity in the world reached 1398 GW in 2020 [4].
Significant reserves of oil, gas, and coal and their availability have predetermined Russia’s own model of energy development. Therefore, the installed capacity of RESs in Russia, except for hydroelectric power plants, consists almost entirely of WPSs and PVSs and amounts to 1.12% in 2021. A similar figure for Germany is 60.1% (all types of RESs) and 54% (only WPSs and PVSs). However, changes in the energy complex structure in recent years have become more noticeable: for example, in 2020, for the first time in 5 years, there was a decrease in the total installed capacity of thermal power plants (by 1320 MW), almost equal to the growth of the installed capacity of RESs (by 1207 MW). It should be noted that, in general, the Russian energy complex is low-carbon, as more than half of the installed capacity of power systems is accounted for by hydropower and nuclear power plants.
RESs play a special role in isolated energy systems, which make up 2/3 of the territory of Russia with a population of about 10 million people [5]. RESs allow achieving not only an environmental, but also an economic effect in remote settlements, mining, oil and gas enterprises, exploration stations, etc., where diesel power systems (DPSs) were conventional sources of electricity [6,7,8,9]. As practice shows, hybrid energy systems (HESs) are more efficient if they combine several types of RESs or storage [10,11]. At present, the autonomous power supply of Russian settlements (excluding private generation of enterprises) is provided by five wind-diesel HESs (WPS power capacity is from 450 to 2500 kW), one solar-diesel HES (PVS power capacity 1000 kW), and small solar-diesel HESs (PVS power capacity 120 kW and less).
The topical task of the HES design is to optimize the composition of the main equipment: the number and capacity of DGs, wind turbines (WTs), photovoltaic panels (PVPs), battery energy storage system (BESS), etc., as well as the HES operating modes. Additionally, relevant is the development of various algorithms and solutions to improve the technical, economic, and environmental performance of the system [12,13,14]. It is important to note the need for a comprehensive approach to solving these problems since the assumed system operating modes directly affect the choice of the size of the HES.
Many classical [2,10,15] and heuristic [11,16,17] methods for optimizing the size of the HES are known. Powerful computer tools such as, HOMER and iHOGA, are known. They are based on heuristic algorithms and are widely used in the practice of the HES design and research [18,19,20]. A disadvantage of some of the proposed methods, including those underlying some software packages, is the use of monthly average values of solar radiation or wind speed. This reduces the accuracy of determining the solar and wind potential [2]. However, the use of hourly measured or simulated values of electrical load, solar radiation, or wind speed is preferable for the optimization of the HES [11,21]. Another software disadvantage is the incomplete control of the model, which is expressed by the impossibility to make changes in the program, which limits the development of new strategies to control the equipment.
At the same time, the possibility of a demand response is not considered in most studies related to the HES size optimization. To the authors’ knowledge, only a few studies have been conducted with respect to evaluating the effect of load shifting on the sizing optimization [20,22,23]. This is investigated in [23], which shows how the use of demand response affects the optimal size of an HES and its economic indicators that compose the net present cost (NPC). However, in the study, the load expectation loss is zero, all energy sources are renewable, and environmental performance could not be considered. The study [20] presents the results of the optimization of an autonomous HES with and without the use of electrical load control. It is shown that the optimal size of the BESS is reduced and the technical, economic, and environmental performance of the HES is improved. However, this article does not present a methodology for adjusting the electrical load schedules and considers a conditional example of a modified load schedule. A recent paper [22], noted a novel approach to the optimization of an HES with regard to the electrical load control. It is shown that the use of a demand response can reduce the cost of electricity by more than 20% and the investment in the BESS by about 10%. However, the impact of a demand response on the optimal size of the HES has not been fully investigated. For a system with and without load control, only the investment costs of the HES components and the cost of energy are shown, while other economic and environmental indicators are not considered. A paper [24], apart from HES sizing optimization, the scheduling of particular household loads is addressed. In this work, optimal switching intervals of several appliances were found, and the size of the HES was optimized after this. In a study [25], a model is proposed for the sizing optimization of the small HES based on a local resource assessment and demand side management. The load shifting process was performed by shifting the water pump load to the night hours. As a result, the HES size was reduced, and the main economic, technical, and environmental indicators were improved. However, one combination of the HES components without a demand response was found, which has almost the same objective function (cost of energy) value, due to the fact that the load shifting potential in the case is limited. A significant amount of savings in system sizes and costs obtained with a demand response strategy was performed in a paper [26]. However, the work does not show how an increase in the number of shiftable loads affects the optimal HES parameters. This article presents a method for optimizing the size of an HES by minimizing the NPC. Several optimal configurations corresponding to various combinations of components were obtained: diesel, wind, photovoltaic, and energy storage systems. The complete configuration was then re-optimized to account for load shifting. The methodology for adjusting the load schedule was described. Attention was paid to changes in various HES metrics, including CO2 emissions. A multipurpose optimization was also carried out without considering the load control, in which case the payback period (PB) was an additional constraint. At the end, a simulation of the behavior of the HES for one day was carried out and the ability of the selected HES components to provide power supply to the load was shown.

2. Materials and Methods

We propose the following method of optimizing the size of an autonomous HES with a load shifting system in accordance with the algorithm shown in Figure 1.
At the first stage, the sources and BESS optimal size selection were carried out without taking the load shifting into account. Then, if the composition was optimized for the first time, it was advisable to adjust an electrical load profile, for example, by allowing load shifts for a certain time. Thus, the modified electrical load profile depended on the RES generation schedule. The size of the HES must then be re-optimized with the modified electrical load profile. The final choice of the HES configuration and the application of the load shifting system was based on the obtained results of the two optimization calculations and the expected costs for the integration of an intelligent load control system.

2.1. Optimization Method, Criteria, and Evaluated Indicators

The classical iterative Gauss–Seidel (coordinate descent) method was used to solve the optimization problem. Its essence is the sequential adjustment of each optimized parameter while keeping all other parameters unchanged. Adjustment of all parameters once is called iteration. To find the objective function minimum, it is necessary to repeat iterations until each optimized parameter stops changing.
Several optimal HES configurations were determined depending on the type of sources used. The inclusion of the DPS in the HES was indicated in the name of the configuration as D; WPS—W; PVS—PV; BESS—B. Configurations of HES with BESS were obtained by matching the optimal number of batteries to the optimized HES without BESS.
The NPC was chosen as the main optimization criterion in this paper. It was determined by the Formula [27]:
M i n i m i z i n g N P C = C A P E X + T = 1 T max O P E X 1 + r T ,
where CAPEX and OPEX are the capital and operational expenditures, respectively, EUR, T is the year, Tmax is the HES life cycle duration, r is the discount rate, %.
CAPEX includes the initial cost of WTs, PVPs, batteries, inverters, and DGs, as well as equipment installation costs. OPEX includes the cost of diesel fuel, overhaul of DGs, the cost of operation and maintenance of DGs, the cost of battery replacement, operating costs to maintain WPS and PVS.
The PB of the configurations was determined in comparison with the basic configuration (energy complex includes only DPS with optimized range of DGs). In a separate part of the work, the PB was considered an additional objective goal for some HES configurations. The choice of the optimal solution required expert decision and was often not obvious when there were two conflicting criteria. Therefore, the main criterion was chosen, the NPC, and PB was set in the form of a constraint. Thus, multi-target optimization was reduced to single-objective optimization.
In addition to the CAPEX, OPEX, and NPC indicators, this study calculated the levelized cost of electricity (LCOE) by the W:
L C O E = N P C ( 1 + r ) T T = 1 T max E ( 1 + r ) T
where E is the generated electricity in kWh.
In the context of the global policy on decarbonization to contain the greenhouse effect, HES environment indicators should be considered [28]. CO2 emissions were assumed to be 3.15 kg CO2/L of diesel fuel [29]. The annual carbon tax was included in the HES OPEX and, accordingly, the NPC.

2.2. Mathematical Modeling of HES Components

The energy balance equation in the considered HES can be expressed as:
P P V S + P W P S + P B P L = 0 ,
where PPVS, PWPS, PB, PL are power generation by PVS, WPS, electricity generation/consumption by BESS, and the electrical load, respectively.

2.2.1. Photovoltaic System

Electricity generation by PVS [15] is as follows:
P P V S = m P V P A P V P G t η P V P η C 1 P H ,
where mPVP is the number of PVPs, APVP is the total PVPs area, Gt is the total solar irradiation, ηPVP is the PVP efficiency, ηC is the conversion and transmission efficiency, PH is the coefficient of decrease in the PVS production due to heating.
P H = K T T P V P 25 f 1 ,
where KT is the temperature coefficient of PVP maximum power derating, TPVP is the PVP temperature, f1 is the binary variable, f1 = 0 when TPV ≤ 25 and f1 = 1 when TPV > 25.
T P V P = T a m b + 0.0256 G t ,
where Tamb is the ambient temperature.
It was assumed that the PVS was not equipped with a solar tracking system.

2.2.2. Wind Power System

WT electricity generation was formulated as below [10]:
P W P S = 0 V < V C I m W T η W T P r a t W T V 3 V C I 3 V r a t 3 V C I 3 V C I V < V r a t , m W T η W T P r a t W T V r a t V < V C O 0 V V C O
where mWTis the number of WTs, V is the wind velocity at the hub height, VCI is the cut-in speed, VCOis the cut-off speed; Vrat is the rated speed, Prat WT is the WT rated power, ηWT is the WT efficiency, including electricity conversion and transmission.

2.2.3. Battery Energy Storage

This methodology searched for the optimal number of batteries of the selected type. It was assumed that batteries were discharged by the nominal current.
The maximum power capacity of the battery in Wh can be expressed from the data sheet as:
C W h = V b C A h ,
where Vb is the battery rated voltage, V, and CAh is the energy capacity in Ah.
Battery rated discharge power in kW were formulated as below:
P b r a t = V b I d r a t ,
where Id rat is the rated discharge current, A. The rated charge power can be expressed similarly with the use of a rated charge current. For example, for lithium-ion batteries Liotech the rated discharge current was equal to the rated charge current.
Maximum BES system discharge power were formulated as below:
P b max = m b P b r a t ,
where mb is the number of batteries. Depending on the system energy deficit and the BESS status of charge, the BESS power for each hour was based on the values as below:
0 P b P b max .
The battery’s energy reserve at the beginning of the first interval was taken equal to 100%. The energy reserve at the beginning of subsequent intervals was equal to the energy reserve at the end of the previous intervals as formulated below:
C b e g ( t + 1 ) = C e n d ( t ) .
It was assumed that batteries operate at nominal temperatures, and self-discharge which amounts to 2–3% of the nominal capacity per month is negligible. To determine the BES life cycle duration, we considered the manufacturer’s information on the maximum service life, as well as the number of cycles, which were determined in accordance with the method of equivalent full cycles (EFC) [30].

2.2.4. Diesel Power System

One of the main DPS operational indicators is diesel fuel consumption. In various studies, the following Formula is often used [10,16,31]:
F D G ( t ) = a 1 P r a t . D G + a 2 P D G ( t ) ,
where FDG(t) is the DG fuel consumption per time interval, Prat.DG is the DG rated power, PDG(t) is the DG load power, a1 and a2 are the empirical coefficients. So, for a DG with a rated power of more than 20 kW, it was proposed to use the coefficients a1 = 0.0184 L/kWh and a2 = 0.2088 L/kWh [31].
The analysis of the consumption characteristics of DGs from different manufacturers showed that the coefficients in Formula (13) could not be used for all DGs. The dependence of the diesel fuel-specific consumption on the DG load factor can either monotonically decrease with load growth or have a minimum at about 75% of nominal load. Therefore, it was proposed to specify the empirical coefficients of Formula (13) for the model range of DGs considered for optimization.
In the method, the optimal number and installed capacity of DGs were selected. We considered that a DPS generally consists of elements of unequal power, in contrast to a PVS or a WPS. At each calculated iteration, not a particular DG (with its consumption characteristics and price) was considered, but only the optimized parameters: the theoretical power of a DG was changed. In this regard, it was necessary to use the function of the DG cost on the rated power, which can be expressed by the quadratic dependence on the price lists of equipment suppliers. When the database of DGs was created, the calculation could be performed iteratively, using their individual characteristics.

2.3. Load Shifting Algorithm

The impact of the use of the electrical load control on the result of solving the HES size optimization problem could be investigated by the load shifting adjusting according to the proposed algorithm.
The proposed algorithm is shown in Figure 2. There are the following designations in Figure 2: variable P is the power (load consumption or RES generation), and t is the time interval number, and indices: L, RES, 1, 2 correspond to the load, RES, the value before load shifting, the value after load shifting, respectively.
If the RES power was less than the load power in the considered time interval t, then the predicted RES power and the predicted load power in the next interval t + 1 were compared by analogy. If the RES power was less than the load power in the next time interval t + 1, then part of the power of the current interval was carried over to the next one. In this case, two options were possible: all the required power was transferred to the next interval, and the interval t no longer had a power deficit, or only a part of the load power, limited by the RES power reserve of the next interval t + 1, was transferred.
In addition to the algorithm shown in Figure 2, an algorithm for the load shifting up to 2 h intervals was also considered. In this case, if the load shifting by one-hour interval did not allow to eliminate the deficit, the shifting of the remaining load part to the second-hour interval was considered.
The influence of the restriction of the shifting load power share on the efficiency of load control was also investigated.

3. Case Study

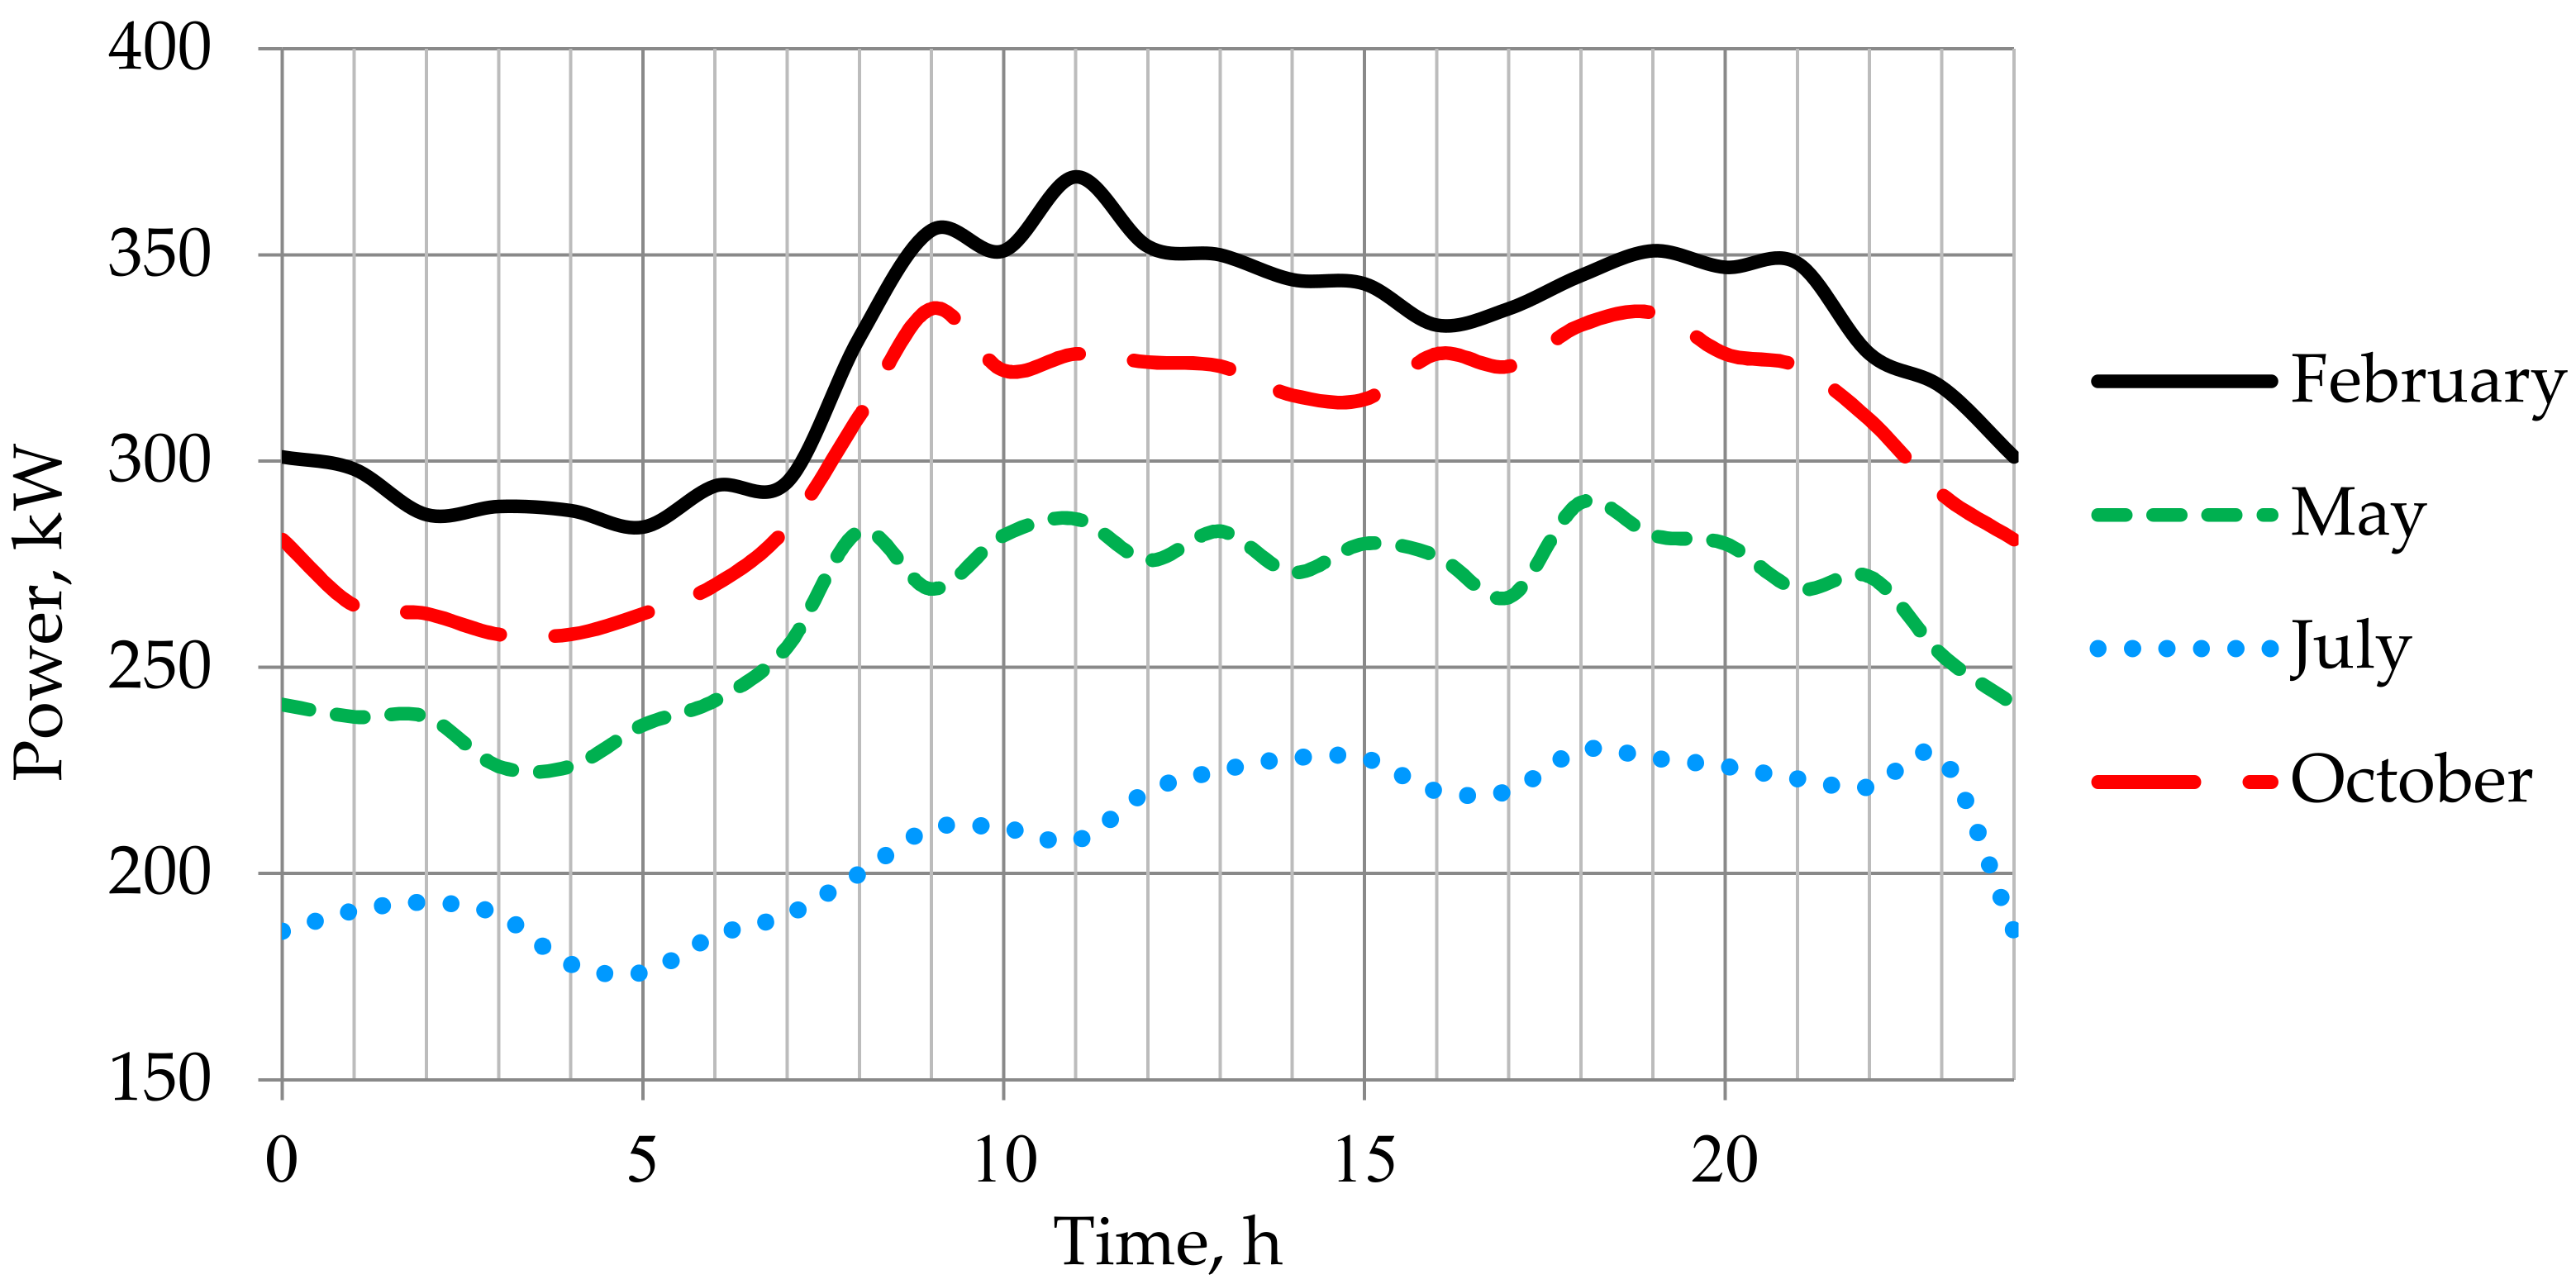
3.1. General Information on the Research Object

The Novikovo settlement is located in the southern part of Sakhalin Island. Novikovo became widely known in the country for the discovery of such a rare metal as germanium in coal. The extraction of coal with germanium and mudstones continued from 1966 to 2005, and 950 tons of the valuable metal were extracted. Given the importance of coal in the energy balance of the region, the production of which on Sakhalin continues at other deposits, and the high demand for germanium on the part of the industry, in the future, it would be possible to resume production in Novikovo [32].
The Sakhalin Island energy system operates separately from the Russian United Energy System. On the territory of the region, it is divided into autonomous power systems: the Central and Northern power systems, the Kuril Islands power systems, and the power systems of remote Sakhalin settlements.
There is a DPS in Novikovo, which has two Caterpillar DGs with a rated power of 508 kW each and five DGs with a rated power of 800 kW each (in reserve). In 2015, two WTs were integrated into the power grid, each with a rated power of 225 kW.
The electrical load power, averaged over an hourly interval, varied from 176 to 376 kW during the year, with an average of 288 kW. Twelve daily load profiles with an average of 1 h for each month of the year were used as input data, four of which are shown in Figure 3. The daily load profiles for each month were provided by the power supply company, so only schedules averaged over 1 h intervals were available.
Annual wind speed and insolation profiles averaged over 1 h during one year were used as input data on the wind and solar energy potential [33]. Profiles for a longer period could be used as input data on wind and insolation, and then the proposed model would take into account the averaged meteorological values for a longer time interval. If the load profile averaging interval was reduced and power consumption was shifted to shorter intervals, such as 30 or 15 min, the wind and insolation profiles should also be averaged according to the length of the load profile interval. This would improve the accuracy but would not conceptually change the approach outlined in this paper.
The duration of the HES life cycle was taken to be 25 years. Usually, this period is chosen based on the service life of RES-based power systems (20–25 years).

3.2. Specifications of the HES Components

Before sizing optimizing, it was necessary to prepare information about the main HES equipment: select the model range of DGs and models of WTs, PVPs, batteries and inverters.

3.2.1. Specifications of the PVPs

The main characteristics of some PVPs of the largest Russian manufacturer, Hevel, are shown in Table 1.
Although Hevel already manufactures modules with 22.7% efficiency, there are still modules with an efficiency up to 19.75% in the mass segment. Therefore, HVL-395/HJT, with the highest energy efficiency of this manufacturer, were chosen as PVPs.

3.2.2. Specifications of the WTs

The main characteristics of some Vestas WTs are shown in Table 2.
Vestas V27 was chosen in the calculation because such WTs are use in Novikovo nowadays.

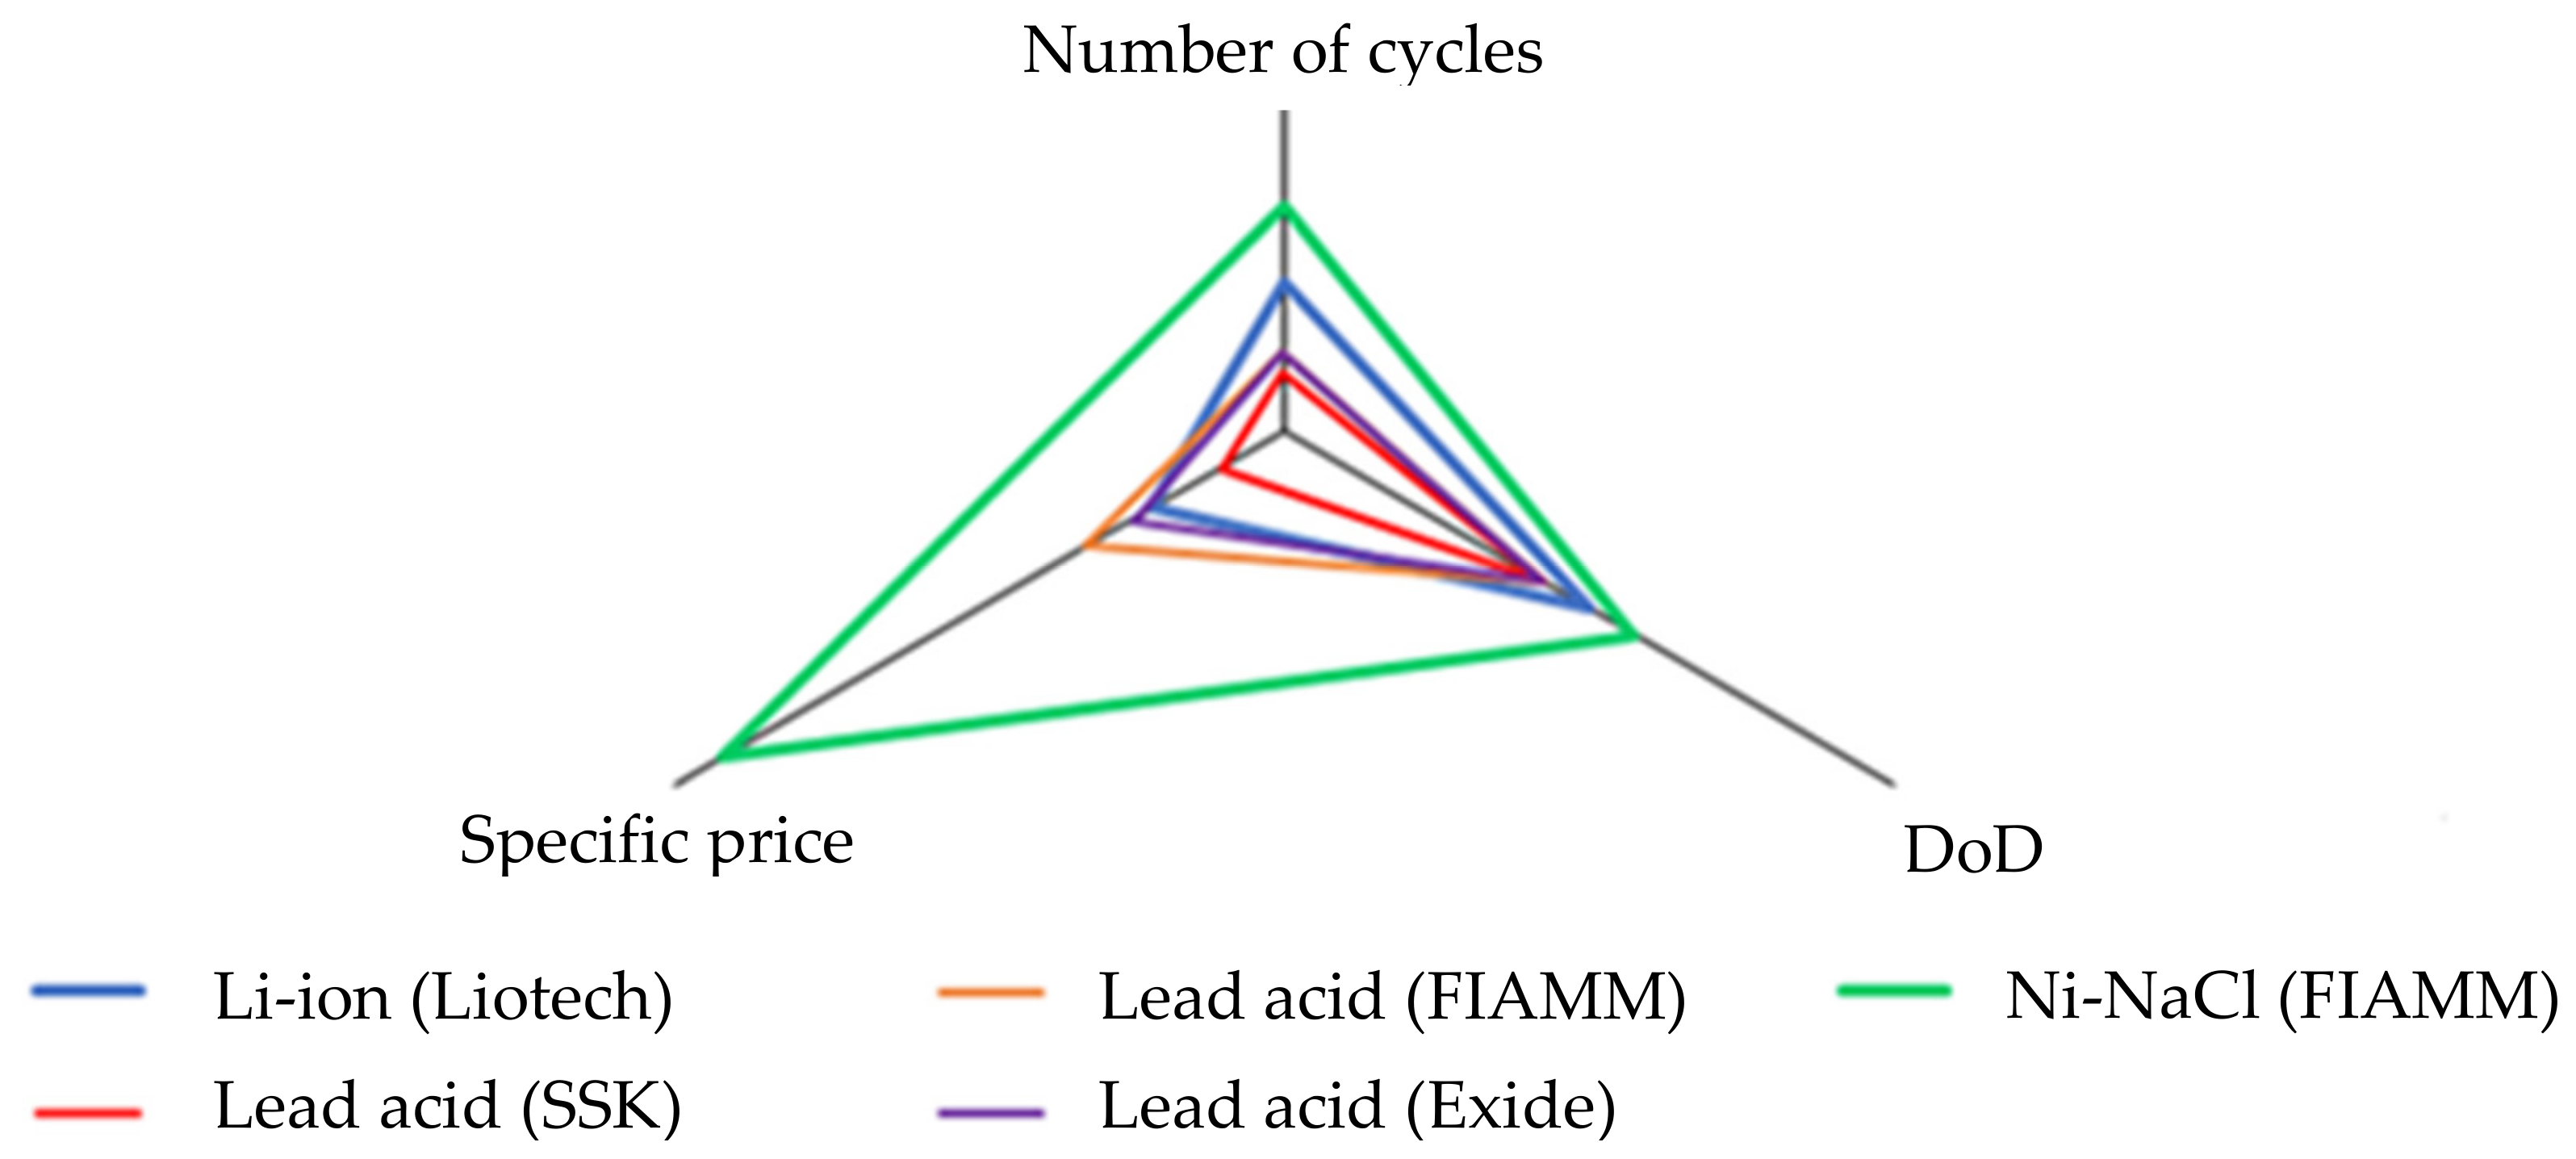
3.2.3. Specifications of Batteries

The main characteristics of some batteries are shown in Table 3.
Some critical characteristics of the considered batteries are shown in Figure 4, where specific capital investments, the number of charge/discharge cycles, and the maximum depth of discharge were plotted along the radar diagram axes in relative units.
The batteries of the Russian companies SSK and Liotech were the most acceptable in terms of capital costs, while the batteries of FIAMM (Ni-NaCl) and Liotech were preferable in terms of service life. Thus, lithium-ion batteries by Liotech were chosen as the main element of the HES BESS.

3.2.4. Specifications of the DGs

The main characteristics of some DGs based on the Russian engine’s manufacturer YMZ are shown in Table 4.
A computer program was written to determine the coefficients of Formula (13) in the mathematical modeling system GAMS. The program searches for the coefficients minimizing the difference between the squares of the passport flow rate and the flow rate calculated by the approximating Formula (13). As a result, the dependence of the diesel fuel consumption on the rated power and the current load of YMZ DG, produced in a standard size from 60 to 400 kW, can be represented in the following form:
F D G Y M Z ( t ) = 0 , 0101 P r a t . D G Y M Z + 0 , 2654 P D G Y M Z ( t ) ,
where FDG YMZ(t) is the fuel consumption per 1 h, Prat. DG YMZ is the DG rated power, PDG YMZ(t) is the DG load in kW.

3.3. Economic and Environmental Parameters

The main parameters used in OPEX calculating are shown in Table 5.
The Emissions Trading System has been successfully operating in Europe since 2005 [34]. CO2 taxes differ significantly in countries where CO2 price regulation is adopted, and they average USD30/t in the EU [35].
Russia still does not have a carbon dioxide tax. Nevertheless, the environmental aspect is often taken into account in the design of new energy facilities in Russia. For example, the ROSATOM Corporation, which is the Russian leader in the construction of nuclear power plants and large wind farms, takes into account the carbon tax of USD6/t [36]. In the case study, the carbon tax was also assumed to be USD6/t.

4. Results

4.1. Size Optimization without Load Shifting

4.1.1. Basic Configuration Selection (Only DPS)

The configuration of the HES consisting of DPS was the basic one. The DPS was considered with one, two or three DGs. The total installed capacity of the DPS was taken as 450 kW, which was 20% more than the maximum load power averaged for 1 h during the year. The choice of standby was left outside the scope of this study. Table 6 shows the main performance indicators of the HESs consisting only of DPSs.
Calculations showed that it was optimal to use three DGs of different capacities among the configurations with 1–2–3 DGs. At the same time, the use of four and more DGs was impractical based on the practice of designing such systems. Thus, the configuration with three DGs was chosen as the basic.

4.1.2. Optimization by NPC Criterion

Optimal parameters of the seven considered HES configurations are given in Table 7.
Technical and economic indicators of the considered HES configurations are given in Table 8.
Any increase in the number of batteries in the D/W+B configuration only reduced the insufficiently high intensity of battery use, while the NPC increased. In this regard, the optimal D/W+B configuration degenerated into the D/W configuration, and the integration of BES was not economically feasible. The analysis showed that a 100-lithium-ion-battery integration into the HES resulted in 146 equivalent full battery cycles per year. The actual number of discharge cycles was 177.
A different picture was observed in the case of the D/PV+B configuration. The minimum NPC in this configuration was achieved with a large number of PVPs. The integration of a small number of batteries into the HES also led to the NPC increase, but this was not due to low battery usage, as in the case of the D/W+B configuration. Thus, the integration of 100 batteries into the HES resulted in a higher number of equivalent full cycles, which was 313. The actual number of discharge cycles was 329, i.e., almost any start of the BESS discharge preceded its maximum discharge. According to calculations, due to a large number of cycles during a life cycle, not one will BESS replacement be required, but two BESS replacements. In the case of an iterative increase in the number of batteries when the total capacity of the BESS reached 3.834 MWh, the intensity of the battery use decreased so much that they could be replaced once in the middle of the HES life cycle (12–13 years after installation). This led to a significant NPC decrease over the HES life cycle and showed the optimal configuration according to the NPC criterion D/PV+B. A further increase in the number of batteries is not economically feasible. Note that by introducing an additional limitation (e.g., CAPEX), and integrating a smaller number of PVPs, the integration of an even a small number of batteries into the HES up to a certain point could reduce the NPC, including in the D/PV+B configuration.
Figure 5 shows the ratio of the main technical and economic indicators of the HES of the considered configurations. In Figure 5, all indicators were expressed in relative units and normalized relative to the largest indicator value among all configurations shown on the diagram.
In accordance with Figure 5, the D/PV+B configuration was the least acceptable option among all configurations with RES as part of the HES. The D/W/PV+B configuration, despite the highest CAPEX, had the highest fuel replacement rate, which has a positive impact on the environmental performance and makes this configuration advantageous in terms of sensitivity to CO2 fees or higher diesel prices. The D/PV configuration also deserves attention due to the lowest CAPEX and a relatively short PB, but at the same time, there was a fairly large volume of emissions and, as a result, a vulnerability in the event of the introduction of tariffs on the CO2 production higher than those assumed in the calculation.

4.1.3. Optimization by the NPC Criterion with Limited PB

Obviously, choosing one optimization criterion is not enough in practice. For example, choosing only NPC to obtain an optimal D/PV/B configuration (not D/PV+B) requires simultaneously increasing the BESS capacity and the PVS size, the NPC decreases, and the PB and CAPEX increase. If only the PB was chosen as a criterion, it was reasonable to choose the minimum number of PVPs, WTs, or batteries.
The relatively low rate of construction of the HES with RESs in Russia was explained, among other things, by the long PBs, which are not attractive to private companies. To attract investments for the RESs development in decentralized systems, the Government developed the mechanism of energy-service contracts. This mechanism implies that the power supply company enters into an energy service contract with an investor who first finances the integration of RESs, over the next 10 years recovers the funds spent, and then receives a profit, while the power supply company operates the HES at costs corresponding to the costs before the integration of RESs. After 10 years, the integrated equipment becomes the property of the power supply company, which begins to receive economic benefits.
Thus, it is advisable to carry out an optimization according to the selected criterion with limitations on the PB. Within the framework of this study, optimization was carried out according to the NPC criterion with a limited PB for the D/W/PV+B configuration.
Numerical experiments showed that the PB for investments in RESs for a given facility was at least 4 years and it took place when a small number of PVPs was used and there was no WPS. However, a WPS consisting of two WTs was already functioning as a part of the HES. The change in the NPC and the PB for the HES, including two WTs and PVPs, with an increase in the number of PVPs, is shown in Figure 6.
Thus, with an increase in PVS power, the PB first decreased, after which it began to increase, while the NPC monotonously decreased. Since the main criterion also remained the NPC, we set certain values for the PB, for example, 5, 6, and 7 years.
The optimal parameters of the HES configuration with additional constraints in the PB are given in Table 9.
Table 10 shows the main HES performance indicators with a limited PB.
The ratios of the main HES technical and economic indicators of configurations D/W/PV+B, D/W/PV, and D/PV, as well as configurations with limited PBs, are shown in Figure 7, all indicators on which were expressed in relative units and normalized.
Analyzing the results of the integration of RESs and BESS we can conclude that in general, it allowed for an acceptable PB (6 years) to reduce the diesel fuel consumption and increase the time of DG operation until the next overhaul by more than two times, as well as to reduce the LCOE by 40%.

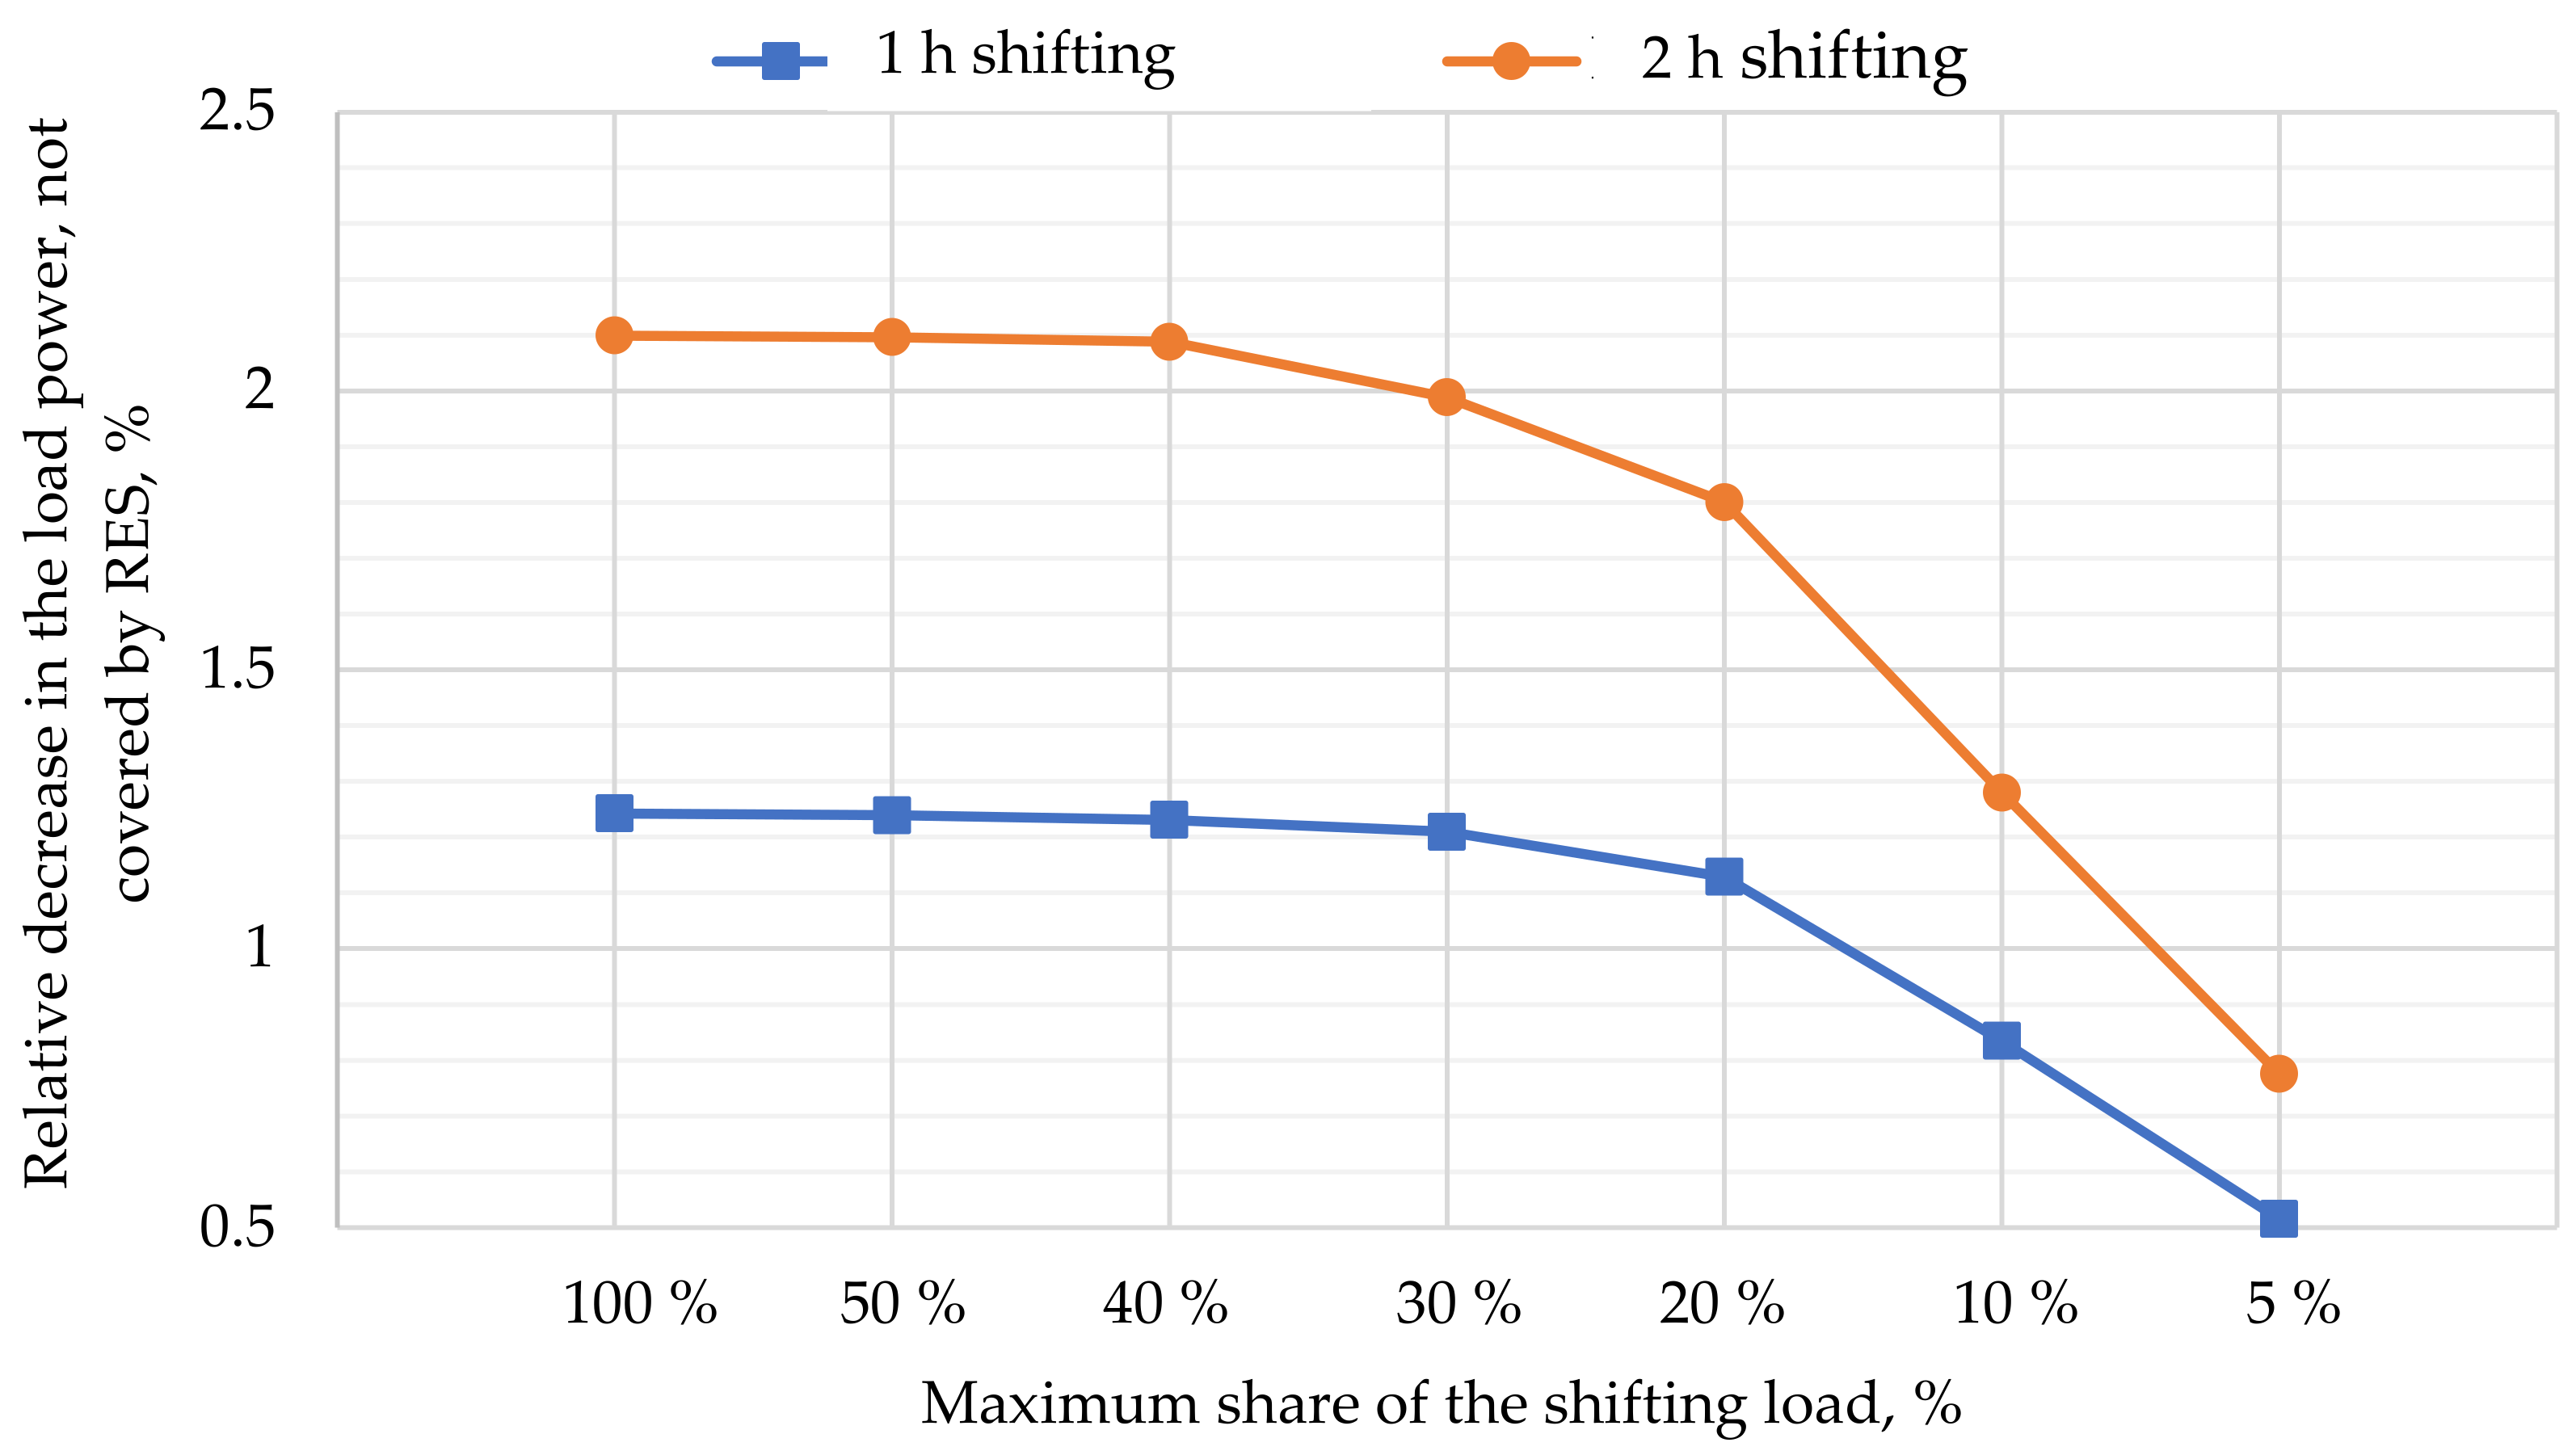
4.2. Size Re-Optimization with Load Shifting

The results of re-optimization of the HES size in the conditions of the Novikovo settlement, taking into account the electrical load shift, are shown in Table 11 and Table 12. Table 11 shows the optimal HES size for the D/W/PV+B configuration taking into account load shifting.
Table 12 shows technical and economic indicators of the considered configuration. The last row of Table 12 shows the HES indicators with the load shifting system but in the absence of size re-optimization.

5. Discussion

The analysis of the results of re-optimization of HES size, described in Section 4.2, showed that it became possible to reduce the size of the BESS. Note that in this case, with the improvement of the other technical and economic indicators, there was a decrease in the environmental performance, which may be associated with the reduction in the BESS capacity. This result does not coincide with the result obtained in study [20]. However, that work considered a hypothetical modified electrical load profile, obtained by significant adjustments to match the RES power output profile, which explains the reduction in CO2 emissions. Given that the environmental and economic criteria usually contradict each other, the situation with a decrease in the environmental indicator is quite possible, as demonstrated in this work.
There was no increase in emissions in the HES configuration without BESS: for example, the application of the proposed algorithm of load shifting (up to 2 h) in the HES configuration D/W/PV+B led to an increase in fuel consumption by 3 t per year while reducing all other costs. On the contrary, for the HES D/W/PV configuration, the same algorithm reduced the fuel consumption by 4 t per year.
It should also be noted that the integration of the electrical load control system in the absence of re-optimization improved all the considered HES indicators (however, the minimum of the NPC objective function was not achieved).
The dependence of the relative decrease in the load power, not covered by RESs, on the maximum share of the shifting load for any interval for two variants of the algorithm implementation is shown in Figure 8.
Figure 8 allows us to conclude that with a constant (fair for any hour interval in the year) possibility of shifting about 30 % of the electrical load in the conditions of the HES under consideration, there was a large relative decrease in the power not covered by RESs, reaching 1.25% for the algorithm with the shifting of 1 h and 2.1% for the algorithm with the shifting of the operating time of 2 h. This led to savings in diesel fuel and changed the optimal composition of the HM obtained without taking into account the electrical load control.

6. Conclusions

The presented method of optimizing, the HES size, can be applied both at the stage of the system design and at the stage of its operation when planning the equipment replacement or the RES integration. The technique was applied to the conditions of a remote Novikovo settlement, and the installed capacities of the PVS, WPS, DPS and BESS, at which the minimum NPC was achieved, were determined. Optimization was also performed for configurations that did not contain one or more of the considered HES components. In addition, the introduction of an additional constraint of PB was considered. In general, the integration of RESs into an autonomous HES allowed, while maintaining the PB at an acceptable level (6 years), to extend the service life of the DG more than two times and reduce the LCOE by 40%.
The influence of the integration of electrical load shifting algorithm on the technical, economic, and environmental performance of the HES was investigated. It was found that when shifting the load operating for up to 2 h, the relative decrease in the load power not covered by RESs was 2.1% and for up to 1 h—1.25%. It was established that the possibility of shifting more than 40% of the power consumption of the time interval for the following intervals practically did not affect the technical and economic indicators of the HES in the conditions under consideration.
An assessment of changes in the optimal parameters of the HES when implementing the electrical load control in the conditions of an autonomous HES in Novikovo was carried out. With the full HES configuration D/W/PV+B, the use of the proposed algorithm of load shifting led to the possibility of reducing the BES capacity by 12.5%, which improves all economic indicators of the HES with a simultaneous reduction in environmental indicators. It should be noted that at the preservation of CAPEX at the same level and absence of reduction in investment in the BESS, there was a slightly smaller improvement of all economic indicators, and also an improvement of an environmental indicator, but the minimum of the NPC objective function was not reached.
On the one hand, further work consists of a more detailed development of algorithms for the electrical load shifting, their linkage with the technical implementation of an electricity demand response, consideration of different load shifting intervals, including shifting at an earlier time [37,38,39]. On the other hand, it is expected to develop the part of data preparation, in which the time series of an electrical load or meteorological parameters can be used as the basis for models that allow obtaining synthetic graphs of any duration.

Author Contributions

Conceptualization, A.L. and Y.Z.; methodology, A.L. and Y.Z.; software, A.L. and Y.Z.; validation, Y.Z. and P.T.; formal analysis, Y.Z.; investigation, A.L.; resources, A.L. and P.T.; data curation, P.T.; writing—original draft preparation, A.L.; writing—review and editing, P.T. and Y.Z.; visualization, P.T.; supervision, P.T.; project administration, Y.Z. and P.T.; funding acquisition, P.T. All authors have read and agree with the published version of the manuscript.

Funding

This research was carried out within the state assignment of the Ministry of Science and Higher Education of the Russian Federation (theme No. FSRW-2020–0014).

Conflicts of Interest

The authors declare no conflict of interest.

Nomenclature and Abbreviations

BESbattery energy storage;
CAPEXcapital expenditure;
DGdiesel generator;
DoDdepth of discharge;
DPSdiesel power system;
HEShybrid energy system;
LCOElevelized cost of electricity;
NPCnet present cost;
OPEXoperating expenditure;
PBpayback period;
PVPphotovoltaic panels;
PVSphotovoltaic system;
RESrenewable energy source;
WPSwind power system;
WTwind turbine.

References

  1. Litvinenko, V.S.; Tsvetkov, P.S.; Dvoynikov, M.V.; Buslaev, G.V. Barriers to implementation of hydrogen initiatives in the context of global energy sustainable development. J. Min. Inst. 2020, 244, 428–438. [Google Scholar] [CrossRef]
  2. Hossein Alizadeh, R.; Shakouri, G.H.; Amalnick, M.S.; Taghipour, P. Economic sizing of a hybrid (PV-WT-FC) renewable energy system (HRES) for stand-alone usages by an optimization-simulation model: Case study of Iran. Renew. Sustain. Energy Rev. 2016, 54, 139–150. [Google Scholar] [CrossRef] [Green Version]
  3. Sychev, Y.A.; Abramovich, B.N.; Zimin, R.Y.; Kuznetsov, P.A. Mathematical modeling of harmonic correction by parallel active filter in conditions of distributed generation. J. Phys. Conf. Ser. 2019, 1333, 032081. [Google Scholar] [CrossRef]
  4. IEA. Total Installed Power Capacity by Fuel and Technology 2019–2025. Available online: https://www.iea.org/data-and-statistics/charts/total-installed-power-capacity-by-fuel-and-technology-2019–2025-main-case (accessed on 6 June 2021).
  5. Belsky, A.A.; Dobush, V.; Haikal, S.F. Operation of a single-phase autonomous inverter as a part of a low-power wind complex. J. Min. Inst. 2019, 239, 564–569. [Google Scholar] [CrossRef]
  6. Dobush, V.S.; Belsky, A.A.; Skamyin, A.N. Electrical complex for autonomous power supply of oil leakage detection systems in pipelines. J. Phys. Conf. Ser. 2020, 1441, 012021. [Google Scholar] [CrossRef]
  7. Abramovich, B.N.; Ustinov, D.A.; Abdallah, W.J. Development and design of a mobile power plant in the form of a standalone power supply. J. Phys. Conf. Ser. 2021, 1753, 1–28. [Google Scholar] [CrossRef]
  8. Lukutin, B.V.; Muravyev, D.I.; Ryzhkova, A.V. The efficiency of combined electrothermal and electrochemical accumulation of electricity of a photovoltaic power plant. In IOP Conference Series: Materials Science and Engineering; IOP Publishing: Bristol, UK, 2021; Volume 1019, p. 012053. [Google Scholar] [CrossRef]
  9. Elistratov, V.V. Energy supply of autonomous territories based on renewable energy sources. In Proceedings of the 2020 7th International Conference on Energy Efficiency and Agricultural Engineering (EE&AE), Ruse, Bulgaria, 12–14 November 2020; pp. 1–3. [Google Scholar] [CrossRef]
  10. Kaabeche, A.; Ibtiouen, R. Techno-economic optimization of hybrid photovoltaic/wind/diesel/battery generation in a stand-alone power system. Sol. Energy 2014, 103, 171–182. [Google Scholar] [CrossRef]
  11. Luna-Rubio, R.; Trejo-Perea, M.; Vargas-Vázquez, D.; Ríos-Moreno, G.J. Optimal sizing of renewable hybrids energy systems: A review of methodologies. Sol. Energy 2012, 86, 1077–1088. [Google Scholar] [CrossRef]
  12. García-Triviño, P.; Torreglosa, J.P.; Jurado, F. Optimised operation of power sources of a PV/battery/hydrogen-powered hybrid charging station for electric and fuel cell vehicles. IET Renew. Power Gener. 2019, 13, 3022–3032. [Google Scholar] [CrossRef]
  13. Abramovich, B.N.; Babanova, I.S. Development of neural network models to predict and control power consumption in mineral mining industry. Min. Inf. Anal. Bull. 2018, 5, 206–213. [Google Scholar] [CrossRef]
  14. Bolshunova, O.M.; Korzhev, A.A.; Vatlina, A.M. Power stabilization system for the regulated electric drive of transport vehicles. J. Phys. Conf. Ser. 2021, 1753, 012014. [Google Scholar] [CrossRef]
  15. Bhuiyan, F.A.; Yazdani, A.; Primak, S.L. Optimal sizing approach for islanded microgrids. IET Renew. Power Gener. 2015, 9, 166–175. [Google Scholar] [CrossRef]
  16. Dufo-López, R.; Bernal-Agustín, J.L.; Yusta-Loyo, J.M. Multi-objective optimization minimizing cost and life cycle emissions of stand-alone PV–wind-diesel systems with batteries storage. Appl. Energy 2011, 88, 4033–4041. [Google Scholar] [CrossRef]
  17. Ogunjuyigbe, A.S.O.; Ayodele, T.R.; Akinola, O.A. Optimal allocation and sizing of PV/Wind/Split-diesel/Battery hybrid energy system for minimizing life cycle cost, carbon emission and dump energy of remote residential building. Appl. Energy 2016, 171, 153–171. [Google Scholar] [CrossRef]
  18. Baghdadi, F.; Mohammedi, K.; Diaf, S.; Behar, O. Feasibility study and energy conversion analysis of stand-alone hybrid renewable energy system. Energy Convers. Manag. 2015, 105, 471–479. [Google Scholar] [CrossRef]
  19. Rajanna, S.; Saini, R.P. Development of optimal integrated renewable energy model with battery storage for a remote Indian area. Energy 2016, 111, 803–817. [Google Scholar] [CrossRef]
  20. García-Vera, Y.E.; Dufo-López, R.; Bernal-Agustín, J.L. Techno-economic feasibility analysis through optimization strategies and load shifting in isolated hybrid microgrids with renewable energy for the non-interconnected zone (NIZ) of Colombia. Energies 2020, 13, 6146. [Google Scholar] [CrossRef]
  21. Sedighi, M.; Moradzadeh, M. Impact of demand response program on hybrid renewable energy system planning. In Demand Response Application in Smart Grids; Nojavan, S., Zare, K., Eds.; Springer: Cham, Switzerland, 2020. [Google Scholar] [CrossRef]
  22. Eltamaly, A.M.; Alotaibi, M.A.; Alolah, A.; Ahmed, M.A. A novel demand response strategy for sizing of hybrid energy system with smart grid concepts. IEEE Access 2021, 9, 20277. [Google Scholar] [CrossRef]
  23. Amrollahi, M.H.; Bathaee, S.M.T. Techno-economic optimization of hybrid photovoltaic/wind generation together with energy storage system in a stand-alone micro-grid subjected to demand response. Appl. Energy 2017, 202, 66–77. [Google Scholar] [CrossRef]
  24. Gil Mena, A.J.; Bouakkaz, A.; Haddad, S. Online Load-Scheduling Strategy and Sizing Optimization for a Stand-Alone Hybrid System. J. Energy Eng. 2021, 147, 04020078. [Google Scholar] [CrossRef]
  25. Kumar, S.; Kaur, T.; Upadhyay, S.; Sharma, V.; Vatsal, D. Optimal Sizing of Stand Alone Hybrid Renewable Energy System with Load Shifting. Energy Sources Part. A Recovery Util. Environ. Eff. 2020. [Google Scholar] [CrossRef]
  26. Chauhan, A.; Saini, R.P. Size optimization and demand response of a stand-alone integrated renewable energy system. Energy 2017, 124, 59–73. [Google Scholar] [CrossRef]
  27. Kharrich, M.; Kamel, S.; Abdeen, M.; Mohammed, O.H. Developed approach based on equilibrium optimizer for optimal design of hybrid PV/Wind/Diesel/Battery microgrid in Dakhla, Morocco. IEEE Access 2021, 9, 13655–13670. [Google Scholar] [CrossRef]
  28. Tcvetkov, P. Climate Policy Imbalance in the Energy Sector: Time to Focus on the Value of CO2 Utilization. Energies 2021, 14, 411. [Google Scholar] [CrossRef]
  29. Fleck, B.; Huot, M. Comparative life-cycle assessment of a small wind turbine for residential off-grid use. Renew. Energy 2009, 34, 2688–2696. [Google Scholar] [CrossRef]
  30. Dufo-López, R.; Bernal-Agustín, J.L.; Domínguez-Navarro, J.A. Generation management using batteries in wind farms: Economical and technical analysis for Spain. Energy Policy 2009, 37, 126–139. [Google Scholar] [CrossRef]
  31. Suhane, P.; Rangnekar, S.; Khare, A.; Mittal, A. Sizing and performance analysis of standalone wind-photovoltaic based hybrid energy system using ant colony optimization. IET Renew. Power Generation 2016, 10, 964–972. [Google Scholar] [CrossRef]
  32. Bosikov, I.I.; Klyuev, R.V.; Kelekhsaev, V.B. Development of indicators for performance functioning natural-industrial system evaluation at the mining and processing complex using the analytical hierarchy method. In Proceedings of the 2017 International Conference on Industrial Engineering, Applications and Manufacturing, ICIEAM 2017, Chelyabinsk, Russia, 16–19 May 2017; pp. 1–6. [Google Scholar] [CrossRef]
  33. Renewables.ninja. Available online: https://www.renewables.ninja (accessed on 6 June 2021).
  34. Bayer, P.; Aklin, M. The European Union Emissions Trading System reduced CO2 emissions despite low prices. Proc. Natl. Acad. Sci. USA 2020, 117, 8804–8812. [Google Scholar] [CrossRef] [PubMed] [Green Version]
  35. IEA. Projected Costs of Generating Electricity 2020. Available online: https://www.iea.org/reports/projected-costs-of-generating-electricity-2020 (accessed on 6 June 2021).
  36. Tolstouhov, D.A. Ensuring the competitiveness of nuclear energy. In Proceedings of the “Breakthrough” project: Place and Advantages of the Project in the Development of the Global Energy System, Ekaterinburg, Russia, 7–8 June 2016; Available online: http://www.innov-rosatom.ru/events/proriv/nauchno-prakticheskaya-konferentsiya-proektnoe-napravlenie-proryv-2016/ae13c91a88ffe014e4cd1e8c9ba4a826.pdf (accessed on 14 July 2021). (In Russian).
  37. Zhukovskiy, Y.L.; Lavrik, A.Y.; Buldysko, A.D. Energy demand side management in stand-alone power supply system with renewable energy sources. J. Phys. Conf. Ser. 2021, 1753, 012059. [Google Scholar] [CrossRef]
  38. Tostado-Véliz, M.; Icaza-Alvarez, D.; Jurado, F. A novel methodology for optimal sizing photovoltaic-battery systems in smart homes considering grid outages and demand response. Renew. Energy 2021, 170, 884–896. [Google Scholar] [CrossRef]
  39. Lujano-Rojas, J.M.; Monteiro, C.; Dufo-López, R.; Bernal-Agustín, J.L. Optimum load management strategy for wind/diesel/battery hybrid power systems. Renew. Energy 2012, 44, 288–295. [Google Scholar] [CrossRef]
Figure 1. Algorithm for multi-purpose optimization of the size of autonomous HESs with RESs and load shifting system.
Energies 14 05059 g001
Figure 2. Load control algorithm with a load shifting of no more than 1 h interval.
Energies 14 05059 g002
Figure 3. Daily load profile for Novikovo in February, May, July, and October.
Energies 14 05059 g003
Figure 4. Some critical batteries characteristics.
Energies 14 05059 g004
Figure 5. The main performance indicators of various configurations in relative units: CAPEX, PB, NPC, LCOE, and annual carbon dioxide emissions (CO2).
Energies 14 05059 g005
Figure 6. Change in the NPC and the PB for an HES, consisting of 2 WTs and PVPs, depending on the number of PVPs.
Energies 14 05059 g006
Figure 7. The main HES performance indicators of some configurations with and without restrictions on the PB.
Energies 14 05059 g007
Figure 8. Dependence of the relative decrease in the load power, not covered by RESs, on the maximum share of the shifting load for two variants of the algorithm implementation.
Energies 14 05059 g008
Table 1. Main characteristics of PVPs.
PVP ModelRated Power, WPrice,
EUR
Dimensions, mEfficiency, %KT,
%/°C
HVL-330/HJT3301741.671 × 1.00219.700.285
HVL-395/HJT3952121.996 × 1.00219.750.285
HVL-125/O125531.300 × 1.1008.740.29
Table 2. Main characteristics of WTs.
WT ModelRated Power, kWHub Height, mSpeed, m/sPrice,
EUR
Specific Price, EUR /kW
Cut-InRatedCut-Off
Vestas V25200303.511,525148,900750
Vestas V27225303.51425166,000740
Vestas V476606541550455,800690
Vestas V661650дo 8041550950,500580
Table 3. The main characteristics of some batteries.
ParameterBattery
ManufacturerLiotechFIAMMFIAMMSSKExide
ModelLFP270SONICK 48TL160H12SMG1306-GP-180PC12/180 FT
TypeLithium-ionNickel-salineLead acid
Characteristics
Capacity, Ah270160130180165
Rated discharge current, A5440131816.5
Voltage, V3.248121212
DoD, %7080606060
Number of cycles300045001600N.I.1600 (C10)
Weight, kg10105546358
Operational temperature, °C0… +50 (C)
−40… 50 (D)
−25… +60+10… +30+10… +30+10… +30
Price, EUR 31011,400830360790
Calculated characteristics
C1 max, kWh0.97.71.62.22.0
Rated discharge power, kW0.1731.9200.1560.2160.198
Specific price, EUR /kWh3451480520165395
Table 4. The main DGs characteristics of YMZ.
Rated Power, kWEngineModelPrice, EUR Diesel Fuel Consumption (L/h) When the Load Is…
50%75%100%
60YMZAD-60-T40011,2709.311.616.3
100AD-100-T40010,70016.824.131.4
200AD-200-T40015,60029.342.656.1
240AD-240-T40016,60034.850.766.9
320AD-320-T40031,70045.966.988.2
400AD-400-T40033,70055.681.6108.1
Table 5. Basic economic parameters of the calculation.
ParameterMeasureValue
Diesel priceEUR/t860
Discount rate%7
DG’s resource before overhaulhours25,000
DG’s overhaul cost% of DG’s CAPEX 10
Specific consumption of diesel engine oilg/kWh0.5
Diesel engine oil priceEUR/kg6
Batteries cyclespcs.3000
WPS OPEXEUR/kW/year29
PVS OPEXEUR/kW/year11.5
BESS OPEX% of CAPEX BES/year1
Installation price (WPS, PVS, DPS)% CAPEX equipment50
Installation price (BESS, inverters)% CAPEX equipment25
Table 6. Selection of the HES basic configuration.
ConfigurationTechnical and Economic Indicators
DG Rated Power, kWCapexOpex (1-st Year)NPCLCOECO2
DG1DG2DG3Thousand EURThousand EURMillion EUREUR/kWht/Year
45071.1522.133.270.2081610
31014057.4515.232.870.2061591
2401407051.6512.932.700.2051583
Table 7. Optimal parameters of the considered HES configurations.
NConfig.DPSWPSPVSBES
Rated Power, kWNumber of WTsPower, kWNumber of PVPsPower, kWNumber of BatteriesCapacity,
kWh
DG1DG2DG3
1D24014070
2D/W2501406092025
3D/W+B250140609202500
4D/W/PV24014070715752520995
5D/PV2401407043601722
6D/PV+B240140704360172242003780
7D/W/PV+B2401407071575252099514801332
Table 8. Technical and economic indicators of the considered HES configurations.
NConfigurationTechnical and Economic Indicators
CAPEX,Opex (1-st Year),NPC,LCOE,CO2,PB,
Thousand EURThousand EURMillion EUR EUR/kWht/YearYears
1D51.6512.932.700.2051583
2D/W2966.2283.420.970.1316949.2
3D/W+B2966.2283.420.970.1316949.2
4D/W/PV3449.2207.716.670.1044698.4
5D/PV2008.0331.623.080.1459638.2
6D/PV+B3873.8280.021.660.13656511.1
7D/W/PV+B4106.7190.516.160.1013289.2
Table 9. Optimal parameters of the HES configuration with the additional constraint of PB.
Config.PB, YearsDPSWPSPVSBES
Rated Power, kWNumber of WTsPower, kWNumber of PVPsPower, kWNumber of Batt.Capacity,
kWh
DG1DG2DG3
D/W/PV(5)5240140702450125049400
D/W/PV/B(6)624501910754460414
D/W/PV(6)63675195077000
D/W/PV/B(7)749001800711800720
D/W/PV(7)7511252000172200
Table 10. Economic indicators of HES configuration with the additional constraint of PB.
Config.CAPEX,
Thousand EUR
OPEX (1-st Year),
Thousand EUR
NPC,
Million EUR
LCOE,
EUR/kWh
CO2,
t/Year
PB,
Years
D/W/PV(5)1259.9307.520.810.1308905
D/W/PV/B(6)1760.2280.019.540.1227706
D/W/PV(6)1897.9260.518.440.1167166
D/W/PV/B(7)2509.5235.217.470.1095767
D/W/PV(7)2568.0228.317.100.1075787
Table 11. Optimal parameters of D/W/PV+B configuration with and without electric load shifting.
Load ShiftingRe-Optimization DPSWPSPVSBES
Rated Power, kWNumber of WTsPower, kWNumber of PVPsPower, kWNumber of Batt.Capacity,
kWh
DG1DG2DG3
no2401407071575252099514801332
1 h. max+71575252099513751238
2 h. max+71575252099512951166
Table 12. Technical and economic indicators of HES configuration D/W/PV+B.
Load ShiftingRe-OptimizationCAPEX,
Thousand EUR
OPEX (1-st Year),
Thousand EUR
NPC,
Milliom EUR
LCOE,
EU /kWh
CO2,
t/Year
PB,
Years
no4106.7190.516.160.1013289.2
1 h. max+4059.7189.316.080.1013329.1
2 h. max+4024.1189.316.030.1003369.0
2 h. max4106.7188.216.040.1003229.12
Publisher’s Note: MDPI stays neutral with regard to jurisdictional claims in published maps and institutional affiliations.

