Article

Analysis and Simulations of the Primary Frequency Control during a System Split in Continental Europe Power System

Engineering Department, University of Palermo, 90128 Palermo, Italy
*
Authors to whom correspondence should be addressed.
Energies 2021, 14(5), 1456; https://doi.org/10.3390/en14051456
Submission received: 8 February 2021 / Revised: 1 March 2021 / Accepted: 4 March 2021 / Published: 7 March 2021
(This article belongs to the Special Issue Planning and Operation of Renewable Energy Systems)

Abstract

:
The occurrence of system separations in the power system of Continental Europe has been observed in recent decades as a critical event which might cause power imbalances higher than the reference incident specified per system design, representing an actual challenge for the stability and safe operation of the system. This work presents an analysis and simulations of the primary frequency control in the Continental Europe synchronous area in conditions of system separation. The adopted approach is based on fundamental aspects of the frequency-containment reserve process. The analysis takes an actual event into consideration, which determined the separation of the system in January 2021. The main purpose of the work is the development of specific models and simulations able to reproduce the actual split event. Due to specific arrangements discussed in detail, it is possible to obtain a substantial match between the simulations and the frequencies registered after the system split. The work also provides insight into the importance of the temporal sequence of power imbalances and defensive actions in the primary frequency control process. The models developed in the work are finally used to investigate the separation event under different operating conditions, such as missing defensive actions and low inertia scenarios.

1. Introduction

In recent years, the power system of the Continental Europe (CE) synchronous area has experienced major incidents leading to the separation of the system into two or more parts. Often, the system split resulted in a more severe disturbance in terms of power imbalance than the reference incident assumed by ENTSO-E as a design hypothesis for the dimensioning of primary control of the system. The expected increase in the share of renewable energy sources can potentially lead to a worsening of the situation: sources as solar and wind are typically interfaced to the grid through power electronics, so unless specific controls are applied, they make a limited contribution to the frequency control and they are more subject to disconnections, making the system less resilient and more vulnerable [1,2,3,4]. In addition, transmission capacities between parts of the power system have increased considerably. This leads to corresponding increases in the power exchanged between the different areas of the system, creating the actual risk of high power imbalances in case of system separation. The two aspects of increasing power exchanges and decreasing synchronous generation can, therefore, have a critical impact on the frequency stability of the system, especially in the case of potential system-split scenarios. The ENTSO-E also specifies that, in case of a system separation, much higher power imbalances may happen compared to the reference incident during interconnected operation [1]. It is, therefore, strategic to assess the frequency stability of the system for situations of area separation, through specific investigations and analyses.
This work presents an analysis and simulation of the frequency containment reserve process in the power system of Continental Europe in conditions of system separation. An actual split event is considered in the investigations, and replicated according to a specific methodology. In the first part, the load-frequency control process and the related policy for frequency control in the CE synchronous area are briefly recalled and summarized. An up-to-date review and discussion regarding the frequency containment reserve is provided, including the description of concepts, policy and possible estimations of the power-frequency characteristic of the CE system. The modelling of the Continental Europe power system for the dynamic analysis of frequency transients is then introduced and described, discussing the use and required extensions of the model for the purposes of the investigations. The analysis of the frequency containment at the occurrence of a system separation is examined, taking an actual event into consideration, which happened in the CE system on the 8th January 2021. For the split event, specific simulation models for time-domain simulations of the two parts of the CE area are presented and implemented.
The main contribution of the work is the definition and the development of proper simulation models, able to reproduce the frequency transient that occurred in the parts of the CE system after the split event. The model adjustments and the specific simulation setup required to obtain a satisfactory match with the frequency measurements, and thus validate the models, are discussed. Through the analysis of the simulation results, the work also provides some relevant observations, indicating the decisive role of the temporal sequence of power imbalances and defensive disconnections, and the use of the power-frequency characteristic of the system in the representation of the frequency control process. The validated simulation models are finally used to extend the analysis to variant scenarios, investigating the occurred split incident under different assumptions such as limited defensive actions and low-inertia conditions. Moreover, another element of novelty consists in the analysis of the system-split condition itself. Indeed, many authors have investigated CE area stability, discussing the abilities of different generation technologies to provide a frequency containment reserve [5,6,7] or the role of battery energy-storage systems [8,9,10], however, the event of system split is barely studied. The rest of the paper is divided as follows: Section 2 provides an overview of relevant aspects of the primary frequency control in the CE system, focusing in particular on the frequency-containment reserve process and the use and computation of the power-frequency characteristic; Section 3 describes the specific details of dynamic modelling and simulation of the CE power system, discussing the required extensions and adaptations of the dynamic model made by the authors for the development of an accurate simulation of the separation event; analysis and simulations of the system split in the CE synchronous area are reported in Section 4, pointing out the importance of a proper temporal distribution of power imbalances and defensive actions; Section 4 reports the results of extended analyses done with the validated models, examining variant scenarios of missing defensive actions, reduced system inertia and comparison with the reference incident; finally, in Section 5, the main results of the work are summarized with conclusive comments and remarks.

2. Frequency Containment Reserve

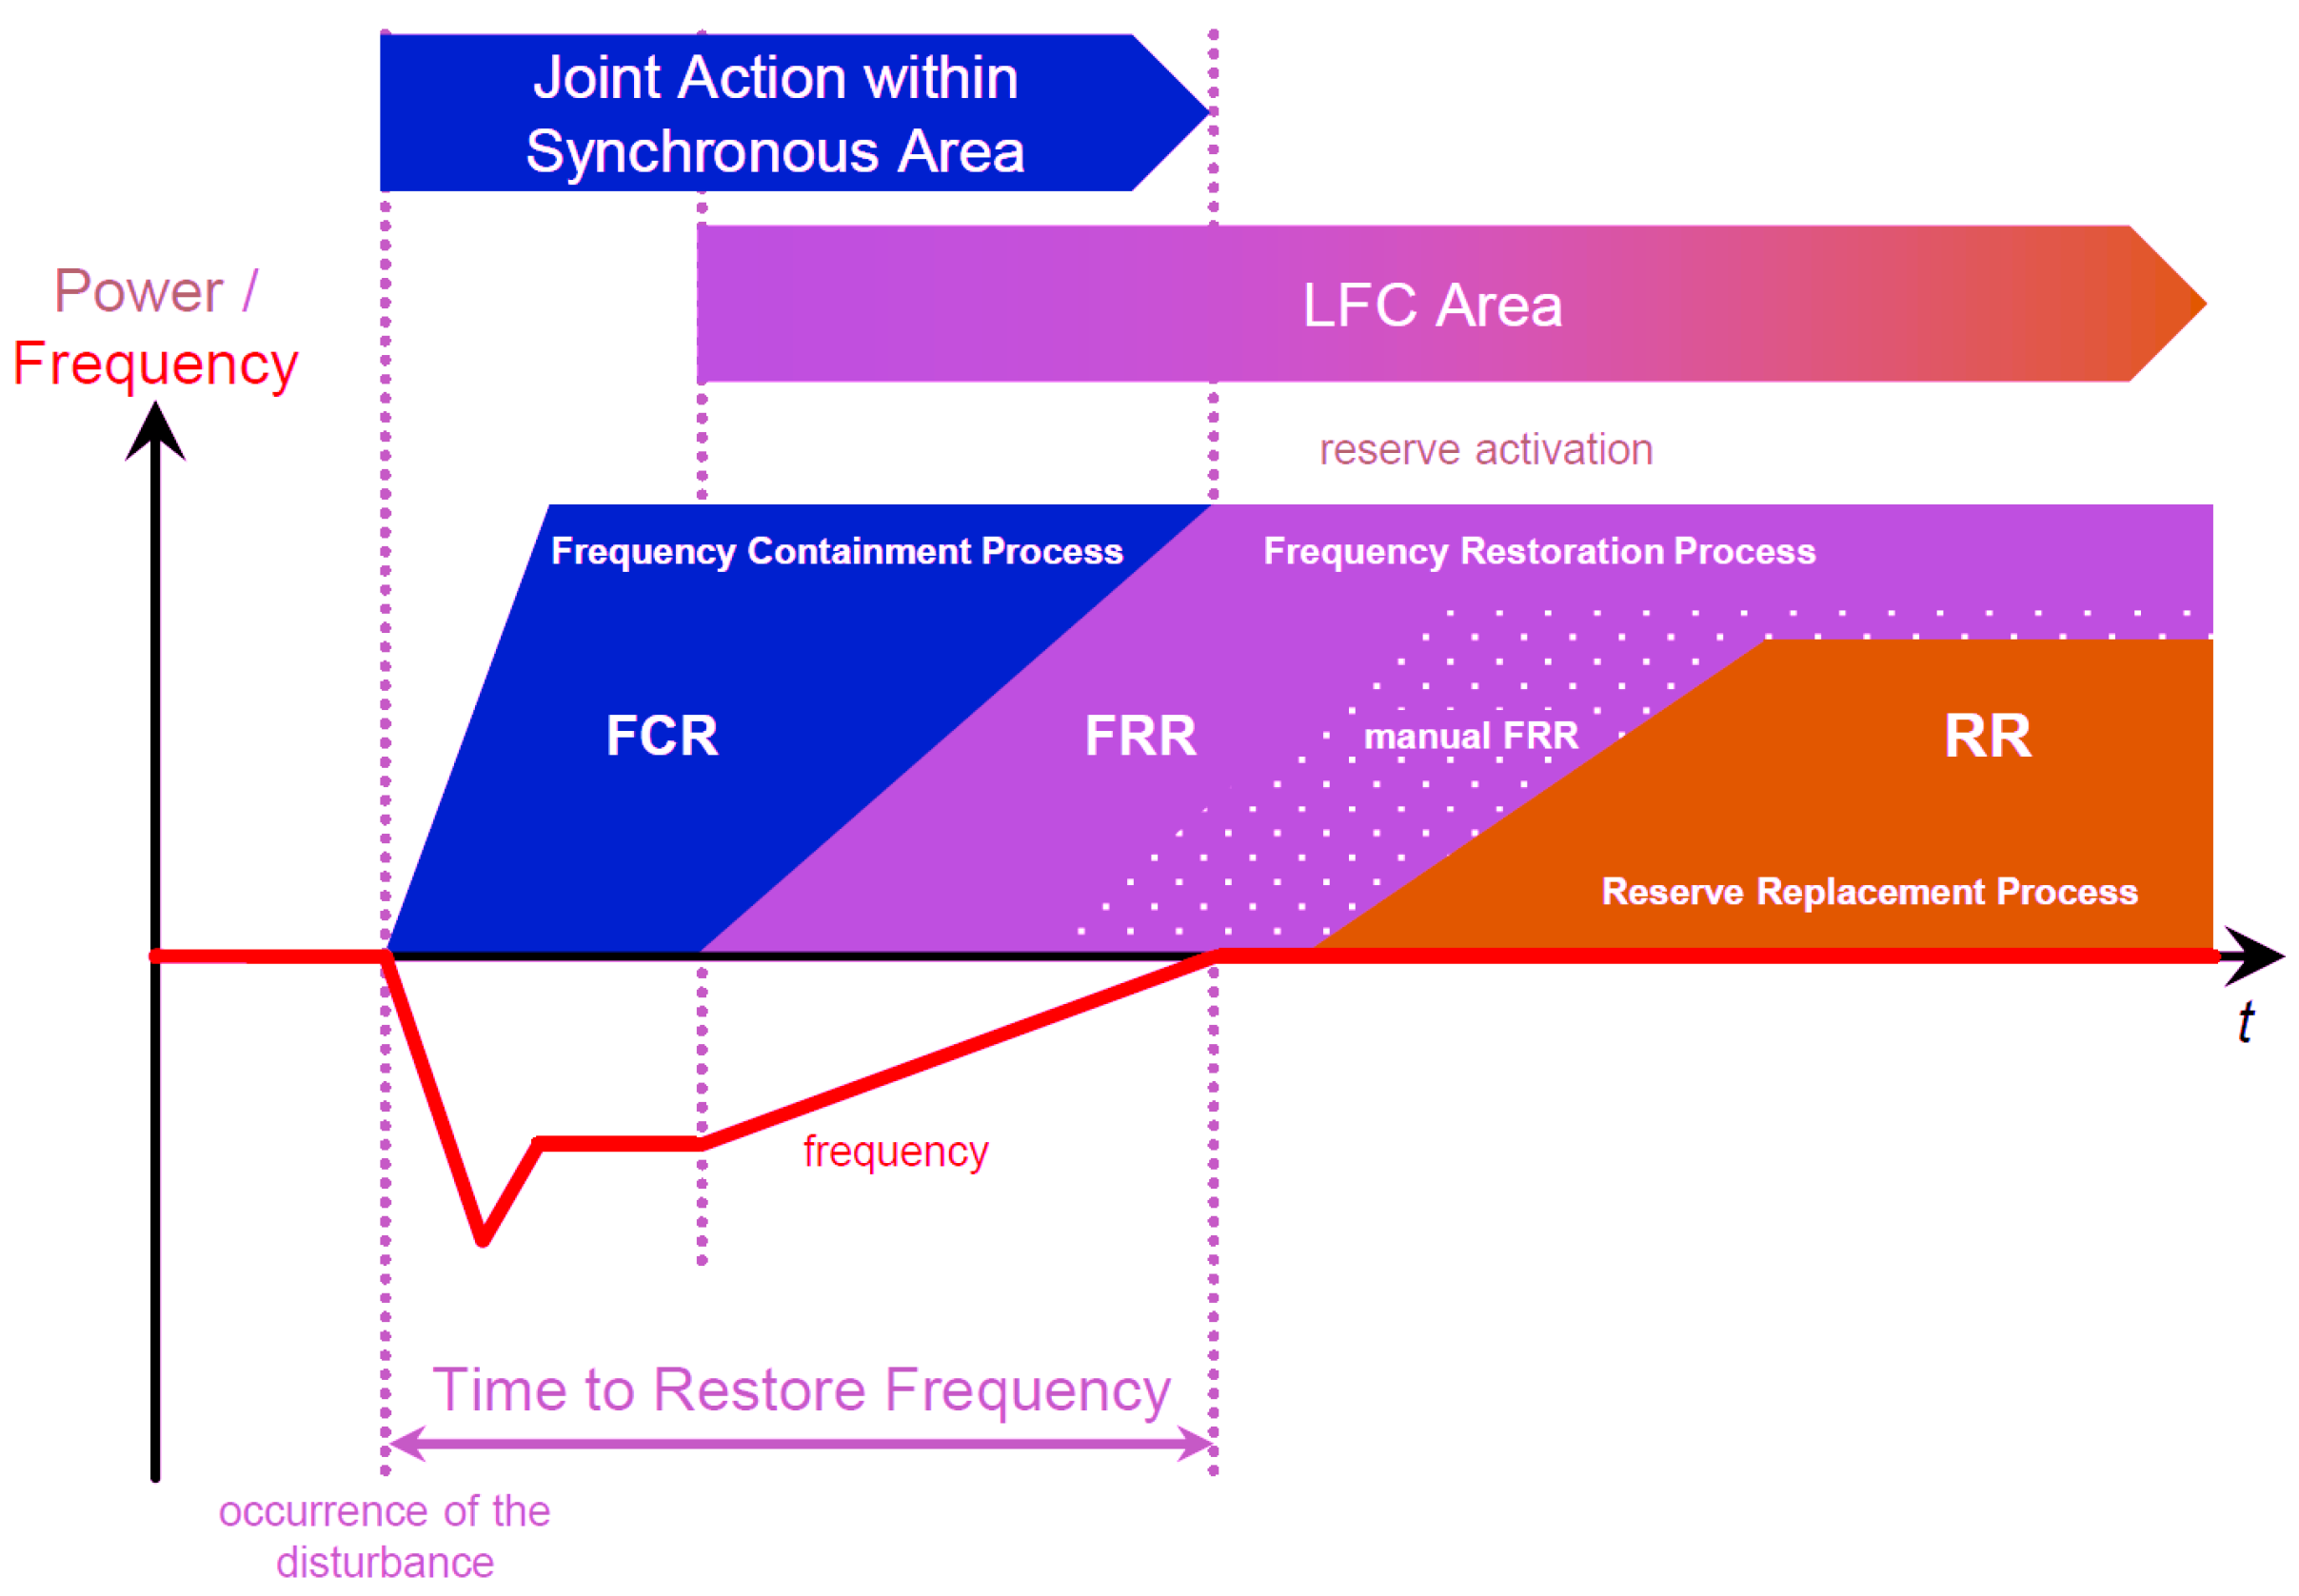
The load-frequency control structure defined by ENTSO-E is composed of different processes and stages at specific time ranges (Figure 1). The Frequency Containment Reserve (FCR) process takes place in the very first seconds after the occurrence of the disturbance, and is responsible for the stabilization of the frequency after the disturbance at a steady-state value. The FCR involves the joint action of all the parts belonging to the synchronous area. The steady-state deviation reached at the end of the FCR process must be within the permissible limit values defined for the system. For the dimensioning of the FCR in the synchronous area of Continental Europe, an N-2 criterion was introduced in the late 1990s, following a deterministic methodology and considering a power imbalance of 3000 MW as a reference incident [11,12,13].
During the FCR process, the intrinsic stabilization mechanism of the system takes place. For this stage, the ratio between the power imbalance that occurred in the system and the quasi-steady-state frequency deviation caused by that disturbance governs the behaviour of the system at the end of the primary frequency control. This ratio is known as the power-frequency characteristic or frequency bias factor and is defined by
λ = Δ P Δ f ,
where Δ P is the power imbalance that occurred in the network and Δ f is the frequency deviation observed at the steady-state. The value of Δ f corresponds to the frequency deviation which is established at the end of the primary frequency control stage. The value of Δ P is negative for power deficit (loss of generation) and positive for power surplus (loss of load). The setpoint value λ * for the overall power-frequency characteristic of the system is defined according to the specific policy described in [15,16], based on measurements, experience and theoretical considerations. The computation of λ * can be divided into the following terms [17]
λ m i n = 3000 MW 200 mHz ,
λ l o a d = 1 % Hz P l o a d ,
λ a d d = 30 % λ m i n ,
λ s u r p l u s = 50 % 50 Hz P g e n ,
λ * = λ m i n + λ l o a d + λ a d d + λ s u r p l u s .
The aggregated equivalent droop σ of the network can be computed by inverting the characteristic λ and normalizing for nominal frequency f n and power P n
σ % = 1 λ P n f n 100 .
For the given value of P n = 150 GW used as a low load in the design hypothesis of the FCR [1] and the minimum power-frequency characteristic of λ m i n = 15,000 MW/Hz, it results σ % = 20%. The 20% aggregated droop corresponds to the value reported in [11,12] for the CE system (formerly UCTPE/CENTREL network).
The latest version of the ENTSO-E (formerly UCTE) operation handbook on load-frequency control [16] defines policy and numbers for the application of the previous equations. Equation (2) defines the frequency containment reserve term of λ * , and it corresponds to the minimum frequency characteristic of 15,000 MW/Hz. This value is calculated according to the design hypothesis of 3000 MW loss of generation as a reference incident and of 200 mHz as the maximum permissible quasi-steady-state frequency deviation after the reference incident. The self-regulating effect of the total system load is taken into account with Equation (3), and it is fixed by policy in the range 1–2%. In addition to the FCR and the self-regulation effect of the load, two additional components are included in the calculation. The first term is introduced based on the consideration that the power-frequency characteristic of the Continental Europe synchronous area is experienced to be, on average, 30% higher than the minimum required value. This term is calculated with Equation (4) and it results in an average frequency characteristic λ a v e r of 19,500 MW/Hz. The second term is related to the surplus-control of generation and it takes the self-control effects of generation into account. This term is calculated with Equation (5) based on the mean generation power in the system, and it corresponds to an experienced linear frequency dependency of approximately 50% of all the generation units of the system reacting to frequency deviations.
The overall power-frequency characteristic setpoint for the Continental Europe synchronous area is then the sum of these four contributions, as per Equation (6), and it finally results in 26,680 MW/Hz. This value corresponds to the specifications of 2009, the year of the latest available version of the operation handbook. The operational data specified in [16] for the calculation of the setpoint λ * are reported in Table 1. It is important to notice that the value of λ * is determined on the main assumption that the power-frequency characteristics of the synchronous area is constant over the specific time-span of one year. It has been observed, however, that the value of λ * is subject to variability depending on the time of day and on the composition of the generation units [17], as it is reasonably expected.
The synchronous area of Continental Europe is normally divided into subareas or blocks, and each block is responsible for the coordination and contribution of the frequency regulation process. The requested contribution of a control block to the primary frequency control can be determined by the multiplication of the setpoint characteristic λ * of the entire synchronous area to the contribution coefficient c i of the given control block
λ i = c i λ * .
The contribution factors c i are determined and published on a yearly basis for each control block, and, according to [16], they can be calculated as the ratio between the energy generated in the given area i and the total energy of the entire synchronous area. In a more recent document of ENTSO-E [18], the contribution factors are determined as the sum of the electricity generation and consumption in the control area i divided by the sum of the total electricity generation and consumption in the whole CE synchronous area. The contribution factors are, in any case, a reflection of the weight of the given area in the overall system. These factors are used to divide the total required power-frequency characteristic λ * among the control blocks. The factors c i are also used to determine the share of each control block to the 3000 MW FCR, every year. The values of the coefficients c i , computed according to latest load and generation data published by ENTSO-E [19], are reported in Table 2.
The contribution coefficients c i are involved in the implementation of the joint action defined by ENTSO-E. In [15,16], the principle of joint action is stated as a fundamental measure to ensure the reliable and stable operation of the synchronous area, and it consists of a common reaction from each TSO of the synchronous area to a given disturbance in the system, according to the distribution of reserves for primary control determined by the coefficients c i . The joint action is a fundamental phenomenon taking place during the FCR process (Figure 1). For the principle of joint action to be realized, the power-frequency characteristic λ i of the single control blocks should be kept as constant as possible.
At the time of writing, there is no available revision of the load-frequency policy defined by ENTSO-E, and therefore no updated values of the power-frequency characteristic setpoint λ * for the synchronous area of Continental Europe. An assessment of a more updated value of λ * can be done in different ways. For instance, the frequency measurements corresponding to the forced outage of 1000 MW generation in Switzerland acquired by Swissgrid could be used for this purpose. The frequency measurements are reported here in Figure 2. The event corresponds to a forced outage of generation performed by SwissGrid on September 2017.
It can be observed that the frequency after some seconds from the application of the disturbance drops to approximately 49.965 Hz, corresponding to a steady-state frequency deviation of 40–45 mHz, as the initial frequency is slightly higher than 50 Hz. From the knowledge of the frequency deviation produced by a given power imbalance, it is possible to calculate the power-frequency characteristic of the system at the observed conditions applying Equation (1)
λ = Δ P Δ f = 1000 MW 0.045 Hz 23,000 MW / Hz .
Another way is to repeat the calculations indicated in Equations (2)–(5) with the operational data of the Continental Europe that are currently available. From the statistical fact-sheet published by ENTSO-E for the year 2018 [19], it is possible to determine a peak load of P l o a d = 450,600 MW, and a mean generation of P g e n = 331,300 MW. Entering these values in Equations (2)–(5) and summing up the four contributions, it results in an overall power-frequency characteristic of approximately 27,300 MW/Hz.
The values and the considerations regarding the power-frequency characteristic of the CE power system, and the calculated contribution coefficients of the single countries belonging to the CE synchronous area will be used for the analysis and the simulation of the transient response of the CE system under separation, as described in the following sections.

3. Dynamic Model of Continental Europe

The dynamics of the CE interconnected power system have been studied in several works, using detailed [21,22,23,24,25,26,27] and simplified models [28,29,30]. Here, the dynamic model of Continental Europe originally provided by ENTSO-E is used to derive an equivalent model for the purposes of this investigation. This model is available at [31] after the acceptance of ENTSO-E. The large-scale dynamic model includes 20,000 nodes, 1000 synchronous machines and 3000 controllers, and is a phasor representation of the Continental Europe synchronous area, suitable to reproduce the mean frequency transients (system inertia, frequency containment reserve) and the inter-area oscillations phenomena [21]. The model does not consider the effects of local phenomena such as voltage transients, protection systems of lines, generators and other devices and special protection schemes and defense plans, specific control schemes such as Automatic Generation Control (AGC), emergency overfrequency and underfrequency controls, dynamic load behaviour and specific models of generation interfaced through power converters. According to the guidelines provided in [32], a correct “local” configuration of the model must be done if specific studies have to be performed. The required modifications which are applied to the original model as part of this work are discussed later in Section 4.
The representation of the basic system dynamics is realized using standard dynamic models for synchronous machines and for the corresponding controllers. The synchronous machines are represented with subtransient 6th-order round-rotor models. The controllers connected to the machine are automatic voltage regulators (AVR), power-system stabilizers (PSS) and turbine-governors. For these controllers, the standard models described in [33] are used. The AVR and excitation system is modelled with the simplified excitation system SEXS, with deactivated PI controller. The standard model PSS2A is used as a power system stabiliser. The speed governor and turbine system is modelled with the steam turbine TGOV1. The block diagrams of the three controllers are shown in Figure 3, Figure 4 and Figure 5, respectively.
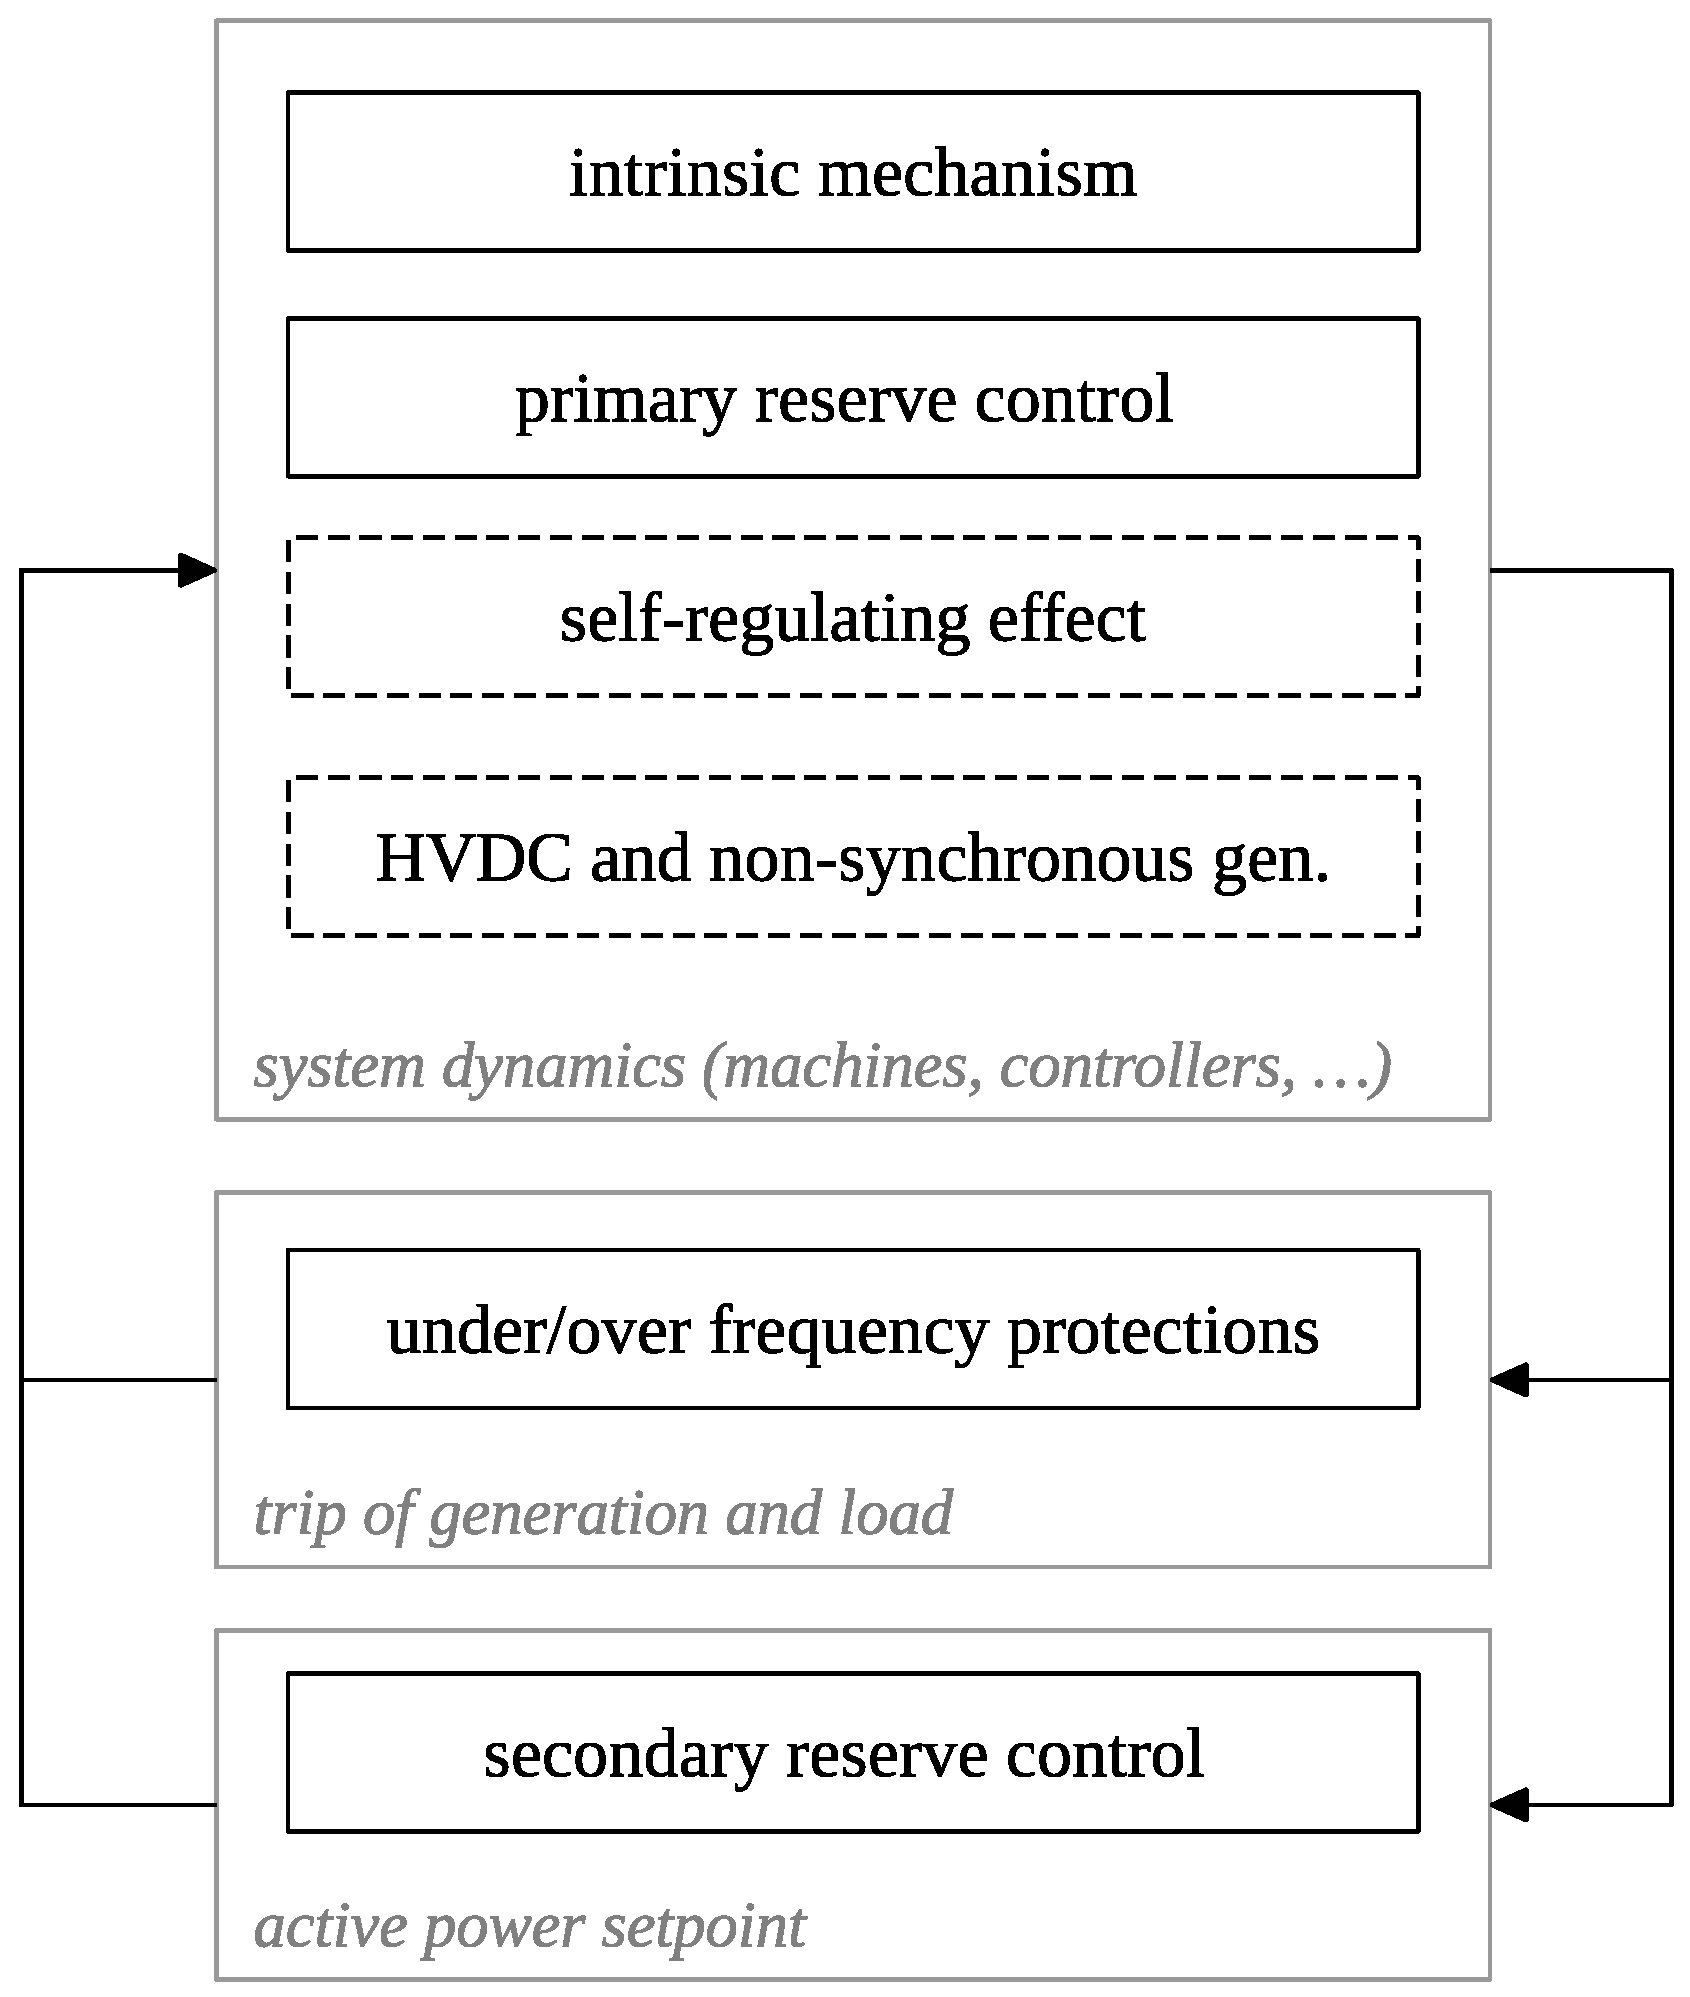
The dynamic model of the CE synchronous area provided by ENTSO-E is used to develop an extended Load Frequency Control (LFC) model for the system, suitable for the purposes of the investigation of split events. The flowchart of the developed LFC model is shown in Figure 6.
In the diagram, the blocks inside the box “system dynamics” represent the adaptation made by the authors of models and data originally provided by ENTSO-E in the dynamic model of the CE system. This block contains the intrinsic mechanism of the system reacting to a power imbalance and the primary frequency control actions which take place consequent to the disturbance. The block takes the transient behaviour of the synchronous machines connected to the system and the actions of the corresponding primary controllers into consideration for voltage and frequency regulation. The block “self-regulating effect” accounts for the self-regulating effect of the loads in the system. The block “HVDC and non-synchronous gen.” represents the possible support to the frequency regulation provided through HVDC interconnections and by non-synchronous generation sources operating in the frequency-sensitive mode. For the HVDC interconnections, the exchange can be operated within the different parts of the CE synchronous area, and also between the CE system and the other interconnected areas, such as the Nordic and the Great Britain systems. The two dashed blocks “self-regulating effect” and “HVDC and non-synchronous gen.” can be included in the simulation as part of the block “primary reserve control”, deriving aggregated equivalent parameters for droop and time constants. Regarding the dynamic contributions of the block “HVDC and non-synchronous gen.”, the approach of including it as equivalent is valid as long as the share of the non-synchronous sources is low compared to the overall power of the system. For higher share of power, a more accurate approach to the power converters simulation would be required.
The blocks containing the under/over-frequency protections and the secondary reserve control are additional blocks which are not present in the initial dynamic model of ENTSO-E. The first block implements the actions of specific under- and over-frequency protection schemes, in terms of disconnections of generation and load for the reduction in the frequency deviation. The second block is responsible for the activation of the secondary reserve control in the area, and it implements a simple integral control to adjust the active power setpoints sent to the governors of the generation units participating in the control.

4. Analysis and Simulation of System Split

4.1. Basic Methodology

When an interconnected power system splits into two or more parts, each part experiences a power-frequency transient. The power imbalance which originates in each separated part depends on the power exchange at the moment of the split. The total power imbalance is the resulting sum of the power exchanges through all the interconnecting lines between the parts. The transient response of each part is determined by the own dynamics and operational characteristics of that part, as the areas are separated and must react individually to the disturbance. The behaviour of the system subjected to a split event can, therefore, be studied with independent models for each part: the power imbalance originated by the separation will be applied with equal magnitude and opposite signs to the two systems. Each independent system can either be studied with a large-scale detailed model of the whole part or with an equivalent simplified model, aggregating the system-transient characteristic in an average dynamic model. If the mutual oscillations between synchronous machines or the dynamics of local phenomena are not of interest in the examinations, the approach of equivalent single-bus system might produce satisfactory simulation results. Since the separation process is generally composed of multiple events on a temporal sequence, it is also particularly important to replicate the most relevant events which took place during the time-window under examination.
A major challenge in the analysis and simulations of existing power systems is the availability of detailed data and information about the system and the events to be studied. Since time-domain models and simulations require multiple data, many parameters might be unknown or unavailable. In such cases, however, there are usually possible solutions to overcome the lack of required data. For instance, for the separation event that occurred in the CE system, which is examined in this work, relevant data missing are the power generation and load data of some countries (i.e., Turkey), the total amount of net power imbalance after the split, the exact temporal sequence of the defensive actions which were initiated in the system to maintain stable and safe operation. As will be presented in more detail in the next section, the knowledge of the composition and previous statistics of the system and the use of the power-frequency characteristic concept can help to estimate reasonable data and allow the realization of proper dynamic simulations for the study of the frequency transient. Models and simulations are implemented in the power systems analysis software NEPLAN [34], and all numerical results are graphically processed with the scientific computation software MATLAB [35]. The software NEPLAN is selected for computations as it is a specialized tool for power-system analysis, and it includes a specific module for dynamic simulations. In all computations, the simulated frequency will start from the nominal value, as this is a typical approach for RMS time-domain simulations.

4.2. Split of 8 January 2021

The analysis performed by the Expert Investigation Panel set up by ENTSO-E pointed out that the initial event was the tripping of a 400 kV busbar coupler in the Croatian network, followed by a sequence of overcurrent and distance protection trippings, which finally led to the split of the CE system in two areas. The split occurred at approximately 14:05 Central European Time (CET). The overall event involved the internal separation of the Croatian system and the disconnections on the borders of Hungary with Romania and Serbia (Figure 7). The countries of the CE system were then divided as follows: Portugal, Spain, France, Italy, Switzerland, Luxembourg, Belgium, Netherlands, Germany, Denmark, Austria, Slovenia, Czech Republic, Poland, Slovakia and Hungary in the North-West part; Croatia, Romania, Bosnia Herzegovina, Serbia, Montenegro, North Macedonia, Albania, Bulgaria, Greece and Turkey in the South-East part. The system separation resulted in a deficit of power in the North-West part and a surplus of power in the South-East part, for a total power imbalance of approximately 6.3 GW. Due to the large under- and over-frequencies experienced in the two parts of the system, automatic and manual countermeasures were activated in both parts in order to stabilize the frequency.
In the North-West part, France and Italy also contributed to the containment of the frequency deviation with the disconnection of the contracted interruptible services, approximately 1200 MW in France (RTE) and 400 MW in Italy (Terna), for a total load shedding of almost 1700 MW. In addition, the exports from the CE system towards the Nordic and the Great Britain systems through the HVDC interconnections at the time of the split were automatically reduced as a supportive action, for a total active power of 420 and 60 MW, respectively. These measures belong to the concept of cooperation between synchronous areas within the frequency containment process [37,38]. In the South-East part, automatic and manual countermeasures included a large disconnection of generation units, in order to stabilize the frequency. For instance, after a few seconds, a 975 MW generator in Turkey was automatically disconnected from the system. These countermeasures ensured that, in both parts, the system responses were stable and secured, limiting the frequency deviations and avoiding a potential collapse of the system. The resynchronisation of the two separated areas took place at around 15:07 CET, after a series of preparatory actions until the frequency difference between the two separated parts was reduced to an acceptable value. The process involved the coordination between TSOs through the use of the European Awareness System platform and a permanent observation of the system frequency, allowing the restoration of the CE synchronous area within a short period of time [36].
As a result of this whole sequence of events and actions, the frequency of the two parts followed the time response shown in Figure 8.
Several system data, such as area load, generation and cross-border exchanges, are made available by ENTSO-E on the Transparency Platform [39]. Processing and aggregating the data related to the 8 January, when the system split happened, it is possible to notice that, at 14:00 h, (some minutes before the split event) the system was at high load conditions. With analogue processing of the generation data of that day given per production type, it can be also observed that the share of non-synchronous generation (solar+wind) was approximately 10%. These two details are relevant in order to assess a plausible level of the kinetic energy in the system at the times under investigation, which will be used for the simulations of the next section.

4.3. Actual Conditions

In order to set up the simulation models for the purposes of the investigation, the conditions of the system at the beginning of the incident are first derived from the data made available by ENTSO-E at [39]. All the necessary data are collected and properly post-processed, in order to determine the snapshot of the system in terms of the power consumed, generated and exported/imported, for an accurate understanding and representation of the system at the instant of separation. At the time of writing, the values of load and generation related to Turkey are not available at [39]: this lack of data is tackled by considering that Turkey counts, on average, as around 9% of the total system load and has a load/generation ratio of approximately 0.97 [19,31]. Proceeding in this way, it is possible to reconstruct realistic power-flow conditions of the system at the time of the separation.
Based on the collected and aggregated power data at [39], it is also possible to produce an estimation of the contribution coefficients c i for each country of the CE area. The computed values substantially match the values calculated according to load and generation data of 2018 [19] and reported in Table 2, so they are not reported here to avoid repetition. The coefficients c i can be then added according to the system split, obtaining the overall contributions to the total power-frequency characteristic λ of the two separated areas. The values for the two parts are reported in Table 3, together with the sharing of the overall kinetic energy of the system. It can be seen that the North-West part is significantly more robust than South-East part due to its rather large size, in terms of both inertia and frequency containment reserve. The percentage values of the kinetic-energy-sharing are obtained by adding the country contributions found in [27].
In order to obtain the power-frequency characteristics λ of the two separated parts of the CE system, it is possible to follow the procedure described in Section 2 for the estimation of λ from frequency measurements and known power imbalance. For the North-West part, the quasi-steady-state frequency deviation observed after few minutes the occurrence of the split is around 49.84 Hz. For the South-East part, the frequency reached a temporary value of 50.2 Hz. The system separation caused an initial power imbalance of 6.3 GW in both areas. Considering the data and the information published by ENTSO-E and reported in the previous section, the net power imbalance Δ P N W ( n e t ) in the North-West part can be computed as the difference between the total power imbalance caused by the split (−6.3 GW) and the total load disconnected as defensive action (1.7 GW), resulting in a net value of −4.6 GW. The characteristic λ N W could be then estimated according to Equation (1) as
λ N W = Δ P N W ( n e t ) Δ f N W = 4.6 GW 160 mHz = 28,750 MW / Hz .
For the South-East part, the limited data and information available require a different estimation. According to the contributions reported in Table 3, the characteristic λ S E of the South-East part can be calculated in proportion to the characteristic λ N W of the North-West part as
λ S E = λ N W c S E c N W = 28,750 MW / Hz 0.17 0.83 = 5890 MW / Hz .
The net power imbalance Δ P S E ( n e t ) corresponding to the calculated characteristic and the observed frequency deviation Δ f S E can be estimated resolving Equation (1) for Δ P as
Δ P S E ( n e t ) = λ S E Δ f S E = 5890 MW Hz 200 mHz 1.2 GW .
The net power imbalance in this case is the resulting difference between the total power imbalance caused by the split (6.3 GW) and the total generation disconnected as defensive action. The value of Δ P S E ( n e t ) suggests that the countermeasures which took place in the South-East part during the very first minutes after the system separation were able to disconnect a total amount of approximately 5.1 GW of generation, reducing the surplus and containing the over-frequency. It is important to notice that, for the estimation of the power-frequency characteristic λ , the frequency deviation at steady-state has been determined assuming an initial frequency of 50 Hz, as the simulations start normally from the nominal value. In the actual conditions, as can be seen from Figure 8, the frequency of the system at the occurrence of the incident was slightly higher (around 50.02 Hz).
All the collected and processed data, the computed values and the estimations can, therefore, be synthesized to produce all the necessary data and parameters for system simulation. These data are summarized in Table 4 for the interconnected CE system at the instant of the split, and for the two separated areas North-West and South-East that originated after the incident.
The rated powers indicated in Table 4 are determined on the basis of the value of system load, and they basically correspond to the assumption of an approximate 70% loading of the system. The aggregated droops are then calculated for each part of the power-frequency characteristics λ and the rated powers S r as
σ % = S r λ f n 100 ,
and they include the contributions of the self-regulating effect of the load and the transient frequency support received from the neighbouring synchronous areas. As reported by ENTSO-E, the supportive power received by the CE area from the Nordic and the GB systems was 420 and 60 MW, respectively. Even if this support was positive for the CE system in reacting to the disturbance, the amount of power exchanged is small compared to the total generation of the CE area: the assumption of including the contribution of the HVDC interconnections in the equivalent model can, therefore, be considered valid for the purposes of the investigations.
The values of rated power, inertia constant and aggregated droop are then used inside the simulation models in order to define the main dynamics of the two implemented systems. In particular, rated power and inertia constant are specified inside the synchronous machine dynamic model, while the aggregated droop is entered inside the turbine-governor as parameter R. The values of all the other parameters of the complete dynamic simulation model are defined as in the initial dynamic model of Continental Europe provided by ENTSO-E [31]. The parameters of the controllers are reported in Appendix A. The transient response of the system at the separation instant can then be simulated and analysed with the dynamic models of the North-West and South-East part shown in Figure 9. The two models simulate each part of the CE system according to the equivalent methodology described before, aggregating and implementing the system transient characteristics with the simulation parameters derived in this section. The dynamic models include the representation of the power imbalance originating from the split and the implementation of the defensive tripping actions, which were taken in the two parts as countermeasures to the large frequency deviations.
For the North-West part, the split imbalance is simulated as an equivalent generation loss of 6.3 GW, while the defensive actions are represented as a total load disconnection of 1.7 GW. In the South-East part, the imbalance due to system separation is simulated as an equivalent load loss of 6.3 GW, while the defensive actions are coordinated as disconnection steps of different generations for a total amount of 5.1 GW. As initial assumption, power imbalances and defensive trippings are considered to be time-wise concentrated at the same simulation instant. The results of the dynamic simulations of the two parts of the CE system are shown in Figure 10. It can be immediately observed that, while for the North-West part, the simulation results can already quite sufficiently approximate the actual frequency transient, for the South-East part the simulation is only capable of catching the steady-state frequency deviation, while the frequency transient within the first 50–60 s after the main event is not accurately reproduced.
The reason for this inaccuracy can be identified as the assumption of the system events, triggered at the same time, which provides imprecise results, especially in the case of the South-East, in part due to its rather small size. The simulations are then performed again, assuming a specific temporal sequence for the power imbalances originating from the system split and for the load/generation disconnections performed as defensive actions. To this purpose, the total power imbalance of 6.3 GW is divided into three portions: this corresponds to the red-shaded areas in Figure 9. For the North-West part, the total power imbalance (−6.3 GW) is simulated with the disconnection of three generators, respectively, 4400, 1800 and 100 MW. For the South-East part, the total power imbalance (6.3 GW) is simulated with the disconnection of three loads, respectively, 4400, 1800 and 100 MW. It is important to note that the three elements representing the power imbalances due to the system split are the same in both parts of the CE system, in terms of both equivalent amount of power and temporal sequence and times of occurrence. The equivalent disturbance is, therefore, identically applied to the two independent models of North-West and South-East part. It is also important to remark that the proposed repartition of the 6.3 GW power imbalance in the three parts does not pretend to reflect what actually happened on the 8 January 2021 in the CE system, since, to the best knowledge of the authors, a detailed report with such specific information has not yet been disclosed by ENTSO-E at the time of writing. These values have been simply derived from the observation of the published frequency measurements, on the basis of fundamental dynamics’ consideration. The simulation results for the adapted configuration of the system events are shown in Figure 11. It can be noticed that the simulation of a proper temporal sequence for the events representing power imbalances and defensive actions can produce accurate results for both parts of the system. The instants of the temporal sequence were identified with the following approach: a preliminary estimation of the instants for the application of power imbalances and defensive actions was made on the basis of the frequency thresholds currently defined for the CE synchronous area; starting from those values, a quick trial and error process was followed to adjust the instants of the temporal sequence, thus matching the frequency measurements of the event. From the implemented models, it can be also observed that the subdivision of the system events in 3–4 temporal steps is already adequate to reproduce the dynamic response of the system. A high-fidelity replication of each single event that occurred in the system is, therefore, not strictly required, unless a more specific examination of the local phenomena is needed: such a replication would still require detailed knowledge of the whole-system transient conditions, and this is not usually easily available.
From the results of Figure 11, it is possible to observe that the maximum instantaneous frequency deviations were approximately 250 mHz in the North-West part (minimum 49.75 Hz) and 550 mHz in the South-East part (maximum 50.55 Hz). The maximum rate of change of frequency (RoCoF) was −0.0431 Hz/s for the North-West part and 0.3614 Hz/s for the South-East part. The RoCoF values are computed over an average time-window of 500 ms, as indicated by ENTSO-E [40]. Some minutes after the occurrence of the system split, the maximum quasi-steady-state frequency deviations were approximately 150 mHz in the North-West part (steady-state value 49.85 Hz) and 200 mHz in the South-East part (steady-state value 50.2 Hz).

4.4. Variant Scenarios

The simulation models developed and described in the previous section are, to a certain extent, useful in replicating and understanding the dynamic phenomena that occurred in the CE system after the split event. Besides this, these models can also be conveniently used to analyse and investigate the system under different scenarios, assumptions and conditions, as a further step from the base analysis of the actual event.
For instance, a question which could be addressed is what would the frequency transient have been if there were no defensive actions in the separated parts of the system. The results of simulations were performed assuming no load-shedding in the North-West part and no generation-disconnection in the South-East part, and are shown in Figure 12. In the figure, the results of the actual conditions are also reported for comparison. It can be clearly seen that, in both parts of the CE system, the defensive countermeasures were effective in limiting the frequency deviations. For the North-West part in particular, without the load disconnection ordered in France and Italy the split event would have caused a steady-state frequency deviation of 220 mHz (minimum 49.78 Hz), beyond the maximum permissible quasi-steady-state frequency deviation of 200 mHz fixed by the design hypothesis [15,16]. For the South-East part, it can instead be observed that the absence of proper countermeasures would have resulted in a much more severe condition for the system, as expected given the small size of the South-East part, which had to face a large power imbalance with limited resources. The frequency would reach a steady-state value of 51.04 Hz, outside the range of ordinary operation fixed by ENTSO-E (49–51 Hz). These adverse conditions could have triggered cascading disconnections, possibly leading to the collapse of that system.
Another point which could be investigated is the possible response of the system to the split event under the operating conditions characterized by a reduced amount of available kinetic energy. The conditions of low inertia can be typically caused by a high share of renewable energy sources, typically operating as inverter-based generation, which do not inherently provide any contribution to the inertia of the system. The results of simulations performed assuming a reduction in the kinetic energy of approximately 75% in both parts are shown in Figure 13. From the results, it can be seen that a reduction in the inertia would not represent a critical condition for the system, at least from a theoretical point of view, with an expected increase in the maximum values of the frequency rates within reasonable limits. The complexity related to the examination of this aspect is, however, acknowledged by the authors, as the inertia reduction is not just a change in the value of the inertia constant of the system, and a detailed approach would require a proper modelling of the converters and the corresponding controls. A future scenario with high share of renewable energy sources, however, might not necessarily only imply issues and challenges for the frequency stability of the system: the FCR support provided by generation sources such as wind turbines or energy storage systems can, in fact, be much faster than that of conventional synchronous machines [5,8]. The aspect of low inertia conditions is introduced here just as an example of a possible use of the developed simulation models for the CE system split, and it can be considered as an opportunity for further and more accurate research.
A last aspect which could serve as a starting point for some relevant considerations is the examination of the split event assuming a consequent power imbalance equal to the 3 GW reference incident specified for the CE area. The results of simulations, performed assuming a sudden power imbalance of 3 GW in both parts, are shown in Figure 14. This assumption is particularly pessimistic and severe, as it assumes the imbalance occurring at a given time and without any defensive disconnections. The figure also reports the results for the application of the reference incident in more steps over time: the total imbalance is divided into three parts of 1 GW each, applied at a temporal distance of 10 s from each other. The simulations show that, at the occurrence of system separation, the part with the larger strength will react safely, without the need to initiate any defensive plan, and relying only on the available FCR, as per the design assumption. The smaller part will instead experience a more severe frequency transient, as expected given the limited strength in terms of kinetic energy and frequency reserve. The simulations show also that the temporal fractioning of the power imbalance has a decisive impact on the overall dynamic response of the system. These theoretical considerations might be a starting point for discussing the opportunity of a possible review of the policy related to FCR dimensioning rules and the definition of reference incidents under split scenarios. In this sense, the use of probabilistic methodologies to quantify the needed amount of FCR would also be appropriate [41].

5. Conclusions

The analysis and the simulations of the frequency-containment reserve process during conditions of system separation of the Continental Europe synchronous area are presented. An actual split event that occurred in January 2021 is considered in the investigations. The analysis is approached following a specific methodology, based on fundamental aspects of the frequency control dynamics and the concept of power-frequency characteristics. With proper considerations and arrangements, dynamic simulation models for the separation of Continental Europe system are developed and implemented. Model parameters are derived from statistics, power data and initial dynamic model of Continental Europe provided by ENTSO-E. The results of the simulations demonstrate a reasonable match with the frequencies reported for the actual split event, showing the relevance of considering a proper temporal sequence for the power imbalances and defensive disconnections which are involved in the process and representation of the frequency-containment reserve. The analysis of the system in the actual conditions of system split shows that the simulation models are able to replicate the dynamics of each part of the system within the first minutes of the occurrence of the separation. The simulation models are also used to examine the possible response of the system during the split under different operating conditions. The extended analyses can be applied for the investigation of hypothetical consequences related to missing or poor defensive actions, or to study the possible impact of a higher share of renewable energy generation and low inertia scenarios during the system split. In this sense, some considerations about penetration limits of renewable sources to maintain the FCR dimensioning hypothesis, or about the opportunity for new services provided by power converters, such as fast frequency response and synthetic/virtual inertia, could be made using the described simulation method and models. The simulation of the theoretical effects of the reference incident under the split conditions finally suggests the opportunity to review the policy defining the dimensioning rules of the frequency containment reserve.

Author Contributions

Conceptualization, simulations and formal analysis, R.M.; Collection and processing of data, R.M. and G.Z.; Writing—original draft, R.M.; Writing—review and editing, M.G.I. and G.Z.; Supervision, M.G.I. All authors have read and agreed to the published version of the manuscript.

Funding

This research received no external funding.

Data Availability Statement

The data of the dynamic model of Continental Europe are available at Continental Europe—Initial Dynamic Model (https://docstore.entsoe.eu/publications/system-operations-reports/continental-europe/Initial-Dynamic-Model/Pages/default.aspx (accessed on 6 March 2021)) after acceptance of ENTSO-E.

Acknowledgments

The simulation models described in this work have been developed using parameters and data given in the initial dynamic model of Continental Europe provided by ENTSO-E.

Conflicts of Interest

The authors declare no conflict of interest.

Appendix A

Table A1. Parameters set for the AVR model.
ParameterValueUnitDescription
K100pucontroller gain
TA3sfilter derivative time constant
TB10sfilter delay time constant
TE0.05sexciter time constant
Emin0puminimum output
Emax4pumaximum output
Table A2. Parameters set for the PSS model.
ParameterValueUnitDescription
KS15pucontroller gain
KS20.1564pusignal2 transducer factor
KS31puwashouts coupling factor
TW12swashout1 first time constant
TW22swashout1 second time constant
TW32swashout2 first time constant
TW40swashout2 second time constant
T10.25sleadlag1 derivative time constant
T20.03sleadlag1 delay time constant
T30.15sleadlag2 derivative time constant
T40.015sleadlag2 delay time constant
T60ssignal1 transducer time constant
T72ssignal2 transducer time constant
T80.5sramp tracking filter derivative time constant
T90.1sramp tracking filter delay time constant
M0-ramp tracking filter
N0-ramp tracking filter
VSTmin−0.1puminimum output
VSTmax0.1pumaximum output
Table A3. Parameters set for the turbine/governor model.
ParameterValueUnitDescription
R0.3pucontroller droop
T10.5sgovernor time constant
T28sturbine derivative time constant
T316sturbine delay time constant
Dt0pufrictional losses factor
Vmin0puminimum output
Vmax1pumaximum output

References

  1. ENTSO-E SPD (System Protection & Dynamics) Subgroup. Frequency Stability Evaluation Criteria for the Synchronous Zone of Continental Europe—Requirements and Impacting Factors; ENTSO-E: Brussels, Belgium, 2016. [Google Scholar]
  2. Tielens, P.; Hertem, D.V. The relevance of inertia in power systems. Renew. Sustain. Energy Rev. 2016, 55, 999–1009. [Google Scholar] [CrossRef]
  3. Kannan, A.; Nuschke, M.; Dobrin, B.-P.; Strauß-Mincu, D. Frequency stability analysis for inverter dominated grids during system split. Electr. Power Syst. Res. 2020, 188, 106550. [Google Scholar] [CrossRef]
  4. ENTSO-E SPD (System Protection & Dynamics) Subgroup. Dispersed Generation Impact on CE Region Security; ENTSO-E: Brussels, Belgium, December 2014. [Google Scholar]
  5. Das, K.; Altin, M.; Hansen, A.D.; Sørensen, P.E. Inertia Dependent Droop Based Frequency Containment Process. Energies 2019, 12, 1648. [Google Scholar] [CrossRef] [Green Version]
  6. Wu, Y.; Zhang, D.; Xiong, L.; Wang, S.; Xu, Z.; Zhang, Y. Modeling and Mechanism Investigation of Inertia and Damping Issues for Grid-Tied PV Generation Systems with Droop Control. Energies 2019, 12, 1985. [Google Scholar] [CrossRef] [Green Version]
  7. Donnini, G.; Carlini, E.M.; Giannuzzi, G.; Zaottini, R.; Pisani, C.; Chiodo, E.; Lauria, D.; Mottola, F. On the Estimation of Power System Inertia accounting for Renewable Generation Penetration. In Proceedings of the 2020 AEIT International Annual Conference (AEIT), Catania, Italy, 23–25 September 2020. [Google Scholar]
  8. Benato, R.; Bruno, G.; Palone, F.; Polito, R.M.; Rebolini, M. Large-Scale Electrochemical Energy Storage in High Voltage Grids: Overview of the Italian Experience. Energies 2017, 10, 108. [Google Scholar] [CrossRef]
  9. Andriollo, M.; Benato, R.; Bressan, M.; Sessa, S.D.; Palone, F.; Polito, R.M. Review of Power Conversion and Conditioning Systems for Stationary Electrochemical Storage. Energies 2015, 8, 960–975. [Google Scholar] [CrossRef] [Green Version]
  10. Datta, U.; Kalam, A.; Shi, J. Battery Energy Storage System for Aggregated Inertia-Droop Control and a Novel Frequency Dependent State-of-Charge Recovery. Energies 2020, 13, 2003. [Google Scholar] [CrossRef] [Green Version]
  11. Weber, H.W.; Madsen, B.; Asal, H.P.; Grebe, E. Kennzahlen der Primaerregelung im UCPTE-Netz und kuenftige Anforderungen. Elektrizitaetswirtschaft 1997, 96, 132–137. [Google Scholar]
  12. Asal, H.P.; Madsen, B.; Weber, H.W.; Grebe, E. Development in Power-Frequency Characteristic and Droop of the UCTE Power System and Proposals for new Recommendations for Primary Control. Proc. 37 CIGRE Sess. 1998, 28, 39–115. [Google Scholar]
  13. Asal, H.P.; Barth, P.; Grebe, E.; Quadflieg, D. Dynamic System Studies of new Requirements and Strategies for the Primary Control in the UCPTE/CENTREL Power System. In Proceedings of the CIGRE 39-106, Paris, France, January 1998. [Google Scholar]
  14. ENTSO-E. Supporting Document for the Network Code on Load Frequency Control and Reserves; ENTSO-E: Brussels, Belgium, June 2013. [Google Scholar]
  15. ENTSO-E. Operation Handbook OpHB, Policy 1: Load-Frequency Control and Performance; Version 2.2; ENTSO-E: Brussels, Belgium, July 2004. [Google Scholar]
  16. ENTSO-E. Operation Handbook OpHB, Policy 1: Load-Frequency Control and Performance; Version 3.0; ENTSO-E: Brussels, Belgium, March 2009. [Google Scholar]
  17. Scherer, M. Frequency Control in the European Power System Considering the Organisational Structure and Division of Responsibilities. Ph.D. Thesis, Eidgenössische Technische Hochschule ETH, Zürich, Switzerland, 2016. [Google Scholar]
  18. ENTSO-E. All CE TSOs Proposal for the Dimensioning Rules for FCR in Accordance with Article 153(2) of the Commission Regulation (EU) 2017/1485 of 2 August 2017 Establishing a Guideline on Electricity Transmission System Operation; ENTSO-E: Brussels, Belgium, August 2018. [Google Scholar]
  19. ENTSO-E. Statistical Factsheet; ENTSO-E: Brussels, Belgium, June 2019. [Google Scholar]
  20. ENTSO-E SPD (System Protection & Dynamics) Subgroup. Frequency Measurement Requirements and Usage; ENTSO-E: Brussels, Belgium, January 2018. [Google Scholar]
  21. Semerow, A.; Höhn, S.; Luther, M.; Sattinger, W.; Abildgaard, H.; Garcia, A.D.; Giannuzzi, G.M. Dynamic Study Model for the Interconnected Power System of Continental Europe in Different Simulation Tools. In Proceedings of the 2015 IEEE Eindhoven PowerTech, Eindhoven, The Netherlands, 29 June–2 July 2015. [Google Scholar]
  22. Hewes, D.; Altschaeffl, S.; Boiarchuk, I.; Witzmann, R. Development of a Dynamic Model of the European Transmission System using Publicly Available Data. In Proceedings of the 2016 IEEE International Energy Conference (ENERGYCON), Leuven, Belgium, 4–8 April 2016. [Google Scholar]
  23. Parma, F.; Pasquini, S.; Pozzi, M.; Bovo, C.; Merlo, M.; Giannuzzi, G.M.; Zaottini, R. A tool to investigate the PV and storage plants effective integration in the European interconnected transmission network. In Proceedings of the 2013 International Conference on Clean Electrical Power (ICCEP), Alghero, Italy, 11–13 June 2013. [Google Scholar]
  24. Pagnier, L.; Jacquod, P. Disturbance propagation, inertia location and slow modes in large-scale high voltage power grids. arXiv 2018, arXiv:1810.04982. [Google Scholar]
  25. Grebe, E.; Kabouris, J.; Barba, S.L.; Sattinger, W.; Winter, W. Low Frequency Oscillations in the Interconnected System of Continental Europe. In Proceedings of the IEEE PES General Meeting, Providence, RI, USA, 25–29 July 2010. [Google Scholar]
  26. Busarello, L.; Musca, R. Impact of Converter-Interfaced Generation to the Frequency Response of the European Power System. In Proceedings of the 18th Wind Integration Workshop, Dublin, Ireland, 16–18 October 2019. [Google Scholar]
  27. Busarello, L.; Musca, R. Impact of high share of converter-interfaced generation on electromechanical oscillations in Continental Europe power system. IET Renew. Power Gener. 2021. [Google Scholar] [CrossRef]
  28. Wang, Y.; Silva, V.; Lopez-Botet-Zulueta, M. Impact of high penetration of variable renewable generation on frequency dynamics in the continental Europe interconnected system. IET Renew. Power Gener. 2016, 10, 10–16. [Google Scholar] [CrossRef]
  29. Giannuzzi, G.M.; Lauria, D.; Pisani, C.; Sattinger, W.; Villacci, D. A dynamic equivalencing preliminary study on ENTSO-E CESA power system. In Proceedings of the 2015 AEIT International Annual Conference (AEIT), Naples, Italy, 14–16 October 2015. [Google Scholar]
  30. Máslo, K.; Kasembe, A.; Moroni, S.; Pestana, R. Frequency stability modelling of the future continental Europe power system. In Proceedings of the 2017 52nd International Universities Power Engineering Conference (UPEC), Heraklion, Greece, 28–31 August 2017. [Google Scholar]
  31. ENTSO-E. Initial Dynamic Model of Continental Europe. Available online: https://docstore.entsoe.eu/publications/system-operations-reports/continental-europe/Initial-Dynamic-Model/Pages/default.aspx (accessed on 25 January 2021).
  32. ENTSO-E SPD (System Protection & Dynamics) Subgroup. Dynamic Study Model—Range of Applications and Modelling Basis; ENTSO-E: Brussels, Belgium, 2015; Available online: https://eepublicdownloads.entsoe.eu/clean-documents/Publications/SOC/Continental_Europe/InitialDynamicModel_Handbook_gen.pdf (accessed on 25 January 2021).
  33. ENTSO-E SPD (System Protection & Dynamics) subgroup. Documentation on Controller Tests in Test Grid Configurations; ENTSO-E: Brussels, Belgium, 2013; Available online: https://eepublicdownloads.entsoe.eu/clean-documents/pre2015/publications/entsoe/RG_SOC_CE/131127_Controller_Test_Report.pdf (accessed on 25 January 2021).
  34. NEPLAN. Available online: https://www.neplan.ch/neplanproduct/en-neplan-360-cloud/ (accessed on 25 January 2021).
  35. MATLAB. Available online: https://mathworks.com/products/matlab.html (accessed on 25 January 2021).
  36. ENTSO-E. System separation in the Continental Europe Synchronous Area on 8 January 2021—2nd update. Available online: https://www.entsoe.eu/news/2021/01/26/system-separation-in-the-continental-europe-synchronous-area-on-8-january-2021-2nd-update/ (accessed on 25 January 2021).
  37. De Haana, J.E.S.; Concha, C.E.; Gibescu, M.; van Putten, J.; Doormand, G.L.; Kling, W.L. Stabilising system frequency using HVDC between the Continental European, Nordic, and Great Britain systems. Sustain. Energy Grids Netw. 2016, 5, 125–134. [Google Scholar] [CrossRef]
  38. Bizumić, L.; Musca, R. Primary Frequency Control in the Power System of Continental Europe including the Dynamics of the HVDC Link France-Great Britain. In Proceedings of the 2020 AEIT International Annual Conference (AEIT), Catania, Italy, 23–25 September 2020. [Google Scholar]
  39. ENTSO-E Transparency Platform. Available online: https://transparency.entsoe.eu/ (accessed on 25 January 2021).
  40. ENTSO-E. Guidance Document for National Implementation for Network Codes on Grid Connection, Rate of Change of Frequency (RoCoF) Withstand Capability; ENTSO-E: Brussels, Belgium, January 2018. [Google Scholar]
  41. Rodriguez, M.d.T.; Scherer, M.; Whitley, D.; Reyer, F. Frequency Containment Reserves Dimensioning and Target Performance in the European Power System. In Proceedings of the 2014 IEEE PES General Meeting, Conference and Exposition, National Harbor, MD, USA, 27–31 July 2014. [Google Scholar]
Figure 1. Load-Frequency Control processes over time [14].
Energies 14 01456 g001
Figure 2. Frequency measurements by Swissgrid for forced outage of 1000 MW generation in Switzerland [20].
Energies 14 01456 g002
Figure 3. Block diagram of AVR controller.
Energies 14 01456 g003
Figure 4. Block diagram of PSS controller.
Energies 14 01456 g004
Figure 5. Block diagram of turbine-governor controller.
Energies 14 01456 g005
Figure 6. Flowchart of the extended LFC model.
Energies 14 01456 g006
Figure 7. Separation of Continental Europe on 8 January 2021 [36].
Energies 14 01456 g007
Figure 8. Frequency of the two separated areas of the CE system during the system split [36].
Energies 14 01456 g008
Figure 9. Outline of simulation systems: (a) North-West part. (b) South-East part.
Energies 14 01456 g009
Figure 10. Comparison of simulation results with power imbalances and defensive actions concentrated at the same time: (a) frequency in North-West part; (b) frequency in South-East part.
Energies 14 01456 g010
Figure 11. Comparison of simulation results with power imbalances and defensive actions distributed during the transient: (a) frequency in North-West part; (b) frequency in South-East part.
Energies 14 01456 g011
Figure 12. Comparison of simulation results for variant scenario of no defensive actions: (a) frequency in North-West part; (b) frequency in South-East part.
Energies 14 01456 g012
Figure 13. Comparison of simulation results for variant scenario of low inertia conditions: (a) frequency in North-West part; (b) frequency in South-East part.
Energies 14 01456 g013
Figure 14. Comparison of simulation results for variant scenario of reference incident application concentrated (solid) and distributed (dashed): (a) frequency in North-West part; (b) frequency in South-East part.
Energies 14 01456 g014
Table 1. Operational data for the calculation of power-frequency characteristics of the Continental Europe synchronous area [16].
ParameterValueDated
Reference incident3000 MWfixed
Full activation of primary control reserves±200 mHzfixed
Self-regulation effect of load1–2%/Hzfixed
Peak load in the system412,000 MW2009
Minimum power-frequency characteristic15,000 MW/Hzfixed
Average power-frequency characteristic19,500 MW/Hz2009
Mean generation in the system306,000 MW2009
Surplus-control of generation3060 MW/Hz2009
Overall power-frequency characteristic26,680 MW/Hz2009
Table 2. Contribution coefficients in the CE synchronous area (2018).
CountryCountry CodeContribution ci %
AlbaniaAL0.26
AustriaAT2.55
Bosnia and HerzegovinaBA0.44
BelgiumBE3.04
BulgariaBG1.34
SwitzerlandCH2.34
Czech RepublicCZ2.37
GermanyDE17.49
DenmarkDK1.25
SpainES8.93
FranceFR18.16
GreeceGR1.85
CroatiaHR0.66
HungaryHU1.53
ItalyIT11.58
LuxembourgLU0.25
MontenegroME0.12
North MacedoniaMK0.24
NetherlandsNL4.21
PolandPL5.54
PortugalPT1.81
RomaniaRO2.09
SerbiaRS1.39
SloveniaSI0.53
SlovakiaSK1.09
TurkeyTR8.91
Table 3. Contribution coefficients to power-frequency characteristic and kinetic energy distribution in the two separated areas of the CE system.
AreaContribution c %Kinetic Energy Ek %
North-West8392
South-East178
Table 4. System simulation data.
ParameterCE (before Split)CE North-WestCE South-East
system load (GW)≈382≈317≈65
rated power (GVA)≈520≈434≈89
kinetic energy Ek (GWs)19301770160
characteristic λ (GW/Hz)34.628.755.89
aggregated droop σ (%)303030
Publisher’s Note: MDPI stays neutral with regard to jurisdictional claims in published maps and institutional affiliations.

