1. Introduction
The free-piston Stirling engine (FPSE) employs the Stirling cycle [
1], which converts thermal energy into mechanical energy by heating/cooling and compressing/expanding the working gas in an enclosed space with respect to the temperature difference of the heat source [
2]. It is composed of two springs and two pistons (displacer and power pistons) to construct a two-degree-of-freedom (2-DOF) oscillator and to generate electricity through thermal flow inside and outside the engine [
3,
4,
5]. FPSE is the most efficient Stirling engine system [
6], due to the removal of the mechanical linkage parts of pistons, such as the connecting rod and crank shaft, which reduces the weight and mechanical energy loss. Each piston is connected to a spring to generate the motion of the piston from the restoring force of the spring. This system has the advantages of compactness, reduced loss, and high durability, but requires a high level of mechanical vibration design and control [
7,
8,
9,
10].
For the FPSE, springs act as bearings to control the upward and downward motion of the piston. At the same time, the working frequency and charge pressure of the engine are determined by the stiffness and mass of the spring. These springs show elastic deformation of tens of Hz inside the FPSE, owing to the compression and expansion of the piston. The springs must be designed so that their fatigue characteristics enable an infinite life cycle within the operating amplitude. Continuous operation which applies an amplitude higher than the design amplitude causes fatigue fracture.
Previous studies were conducted as follows: Kavade et al. [
11] employed spiral springs for linear compressors and studied the mechanical behavior of spiral springs using the finite element method (FEM). Wen-rui et al. [
12] conducted a finite element analysis of flat springs and studied the stiffness and stresses with respect to the number of spirals. Chen and Chen [
13] predicted the stiffness and natural frequency of the spring, and validated the results through experiments. Jomde et al. [
14] utilized FEM to predict the equivalent stress of a spiral spring. In addition, many studies have been conducted to investigate the effects of geometric parameters on the stress distribution and lifetime of spiral springs [
15,
16,
17]. Instead of real experiments, finite element analysis was adopted to predict the mechanical behavior of a flat spiral spring. Additionally, we adopted the design of experiment (DOE), which provided a fast and efficient method to design simulation cases and analyze the simulation results.
In this work, we studied the effect of the outer diameter and the thickness of the spring on improving the fatigue life of a flat spiral spring. First of all, we proposed a stacking system with thin and flat spiral springs and determined the operating conditions of the existing 3 kW FPSE developed by Nexergy lab at Seoultech [
18]. The new spring geometry aimed to reduce stress by changing the outer diameter and thickness of the spring; the stacking of flat springs compensated for their reduced stiffness. Each simulation case was determined from the DOE, which was a fast and efficient method for determining the effects of variables [
19]. Finite element analysis was conducted for each case. The simulation results were fitted with a regression model [
20], and the effects of the design variables were studied. The optimized design variables of the flat spiral spring, which exhibited good fatigue characteristics, were obtained.
2. Preliminary Study Status
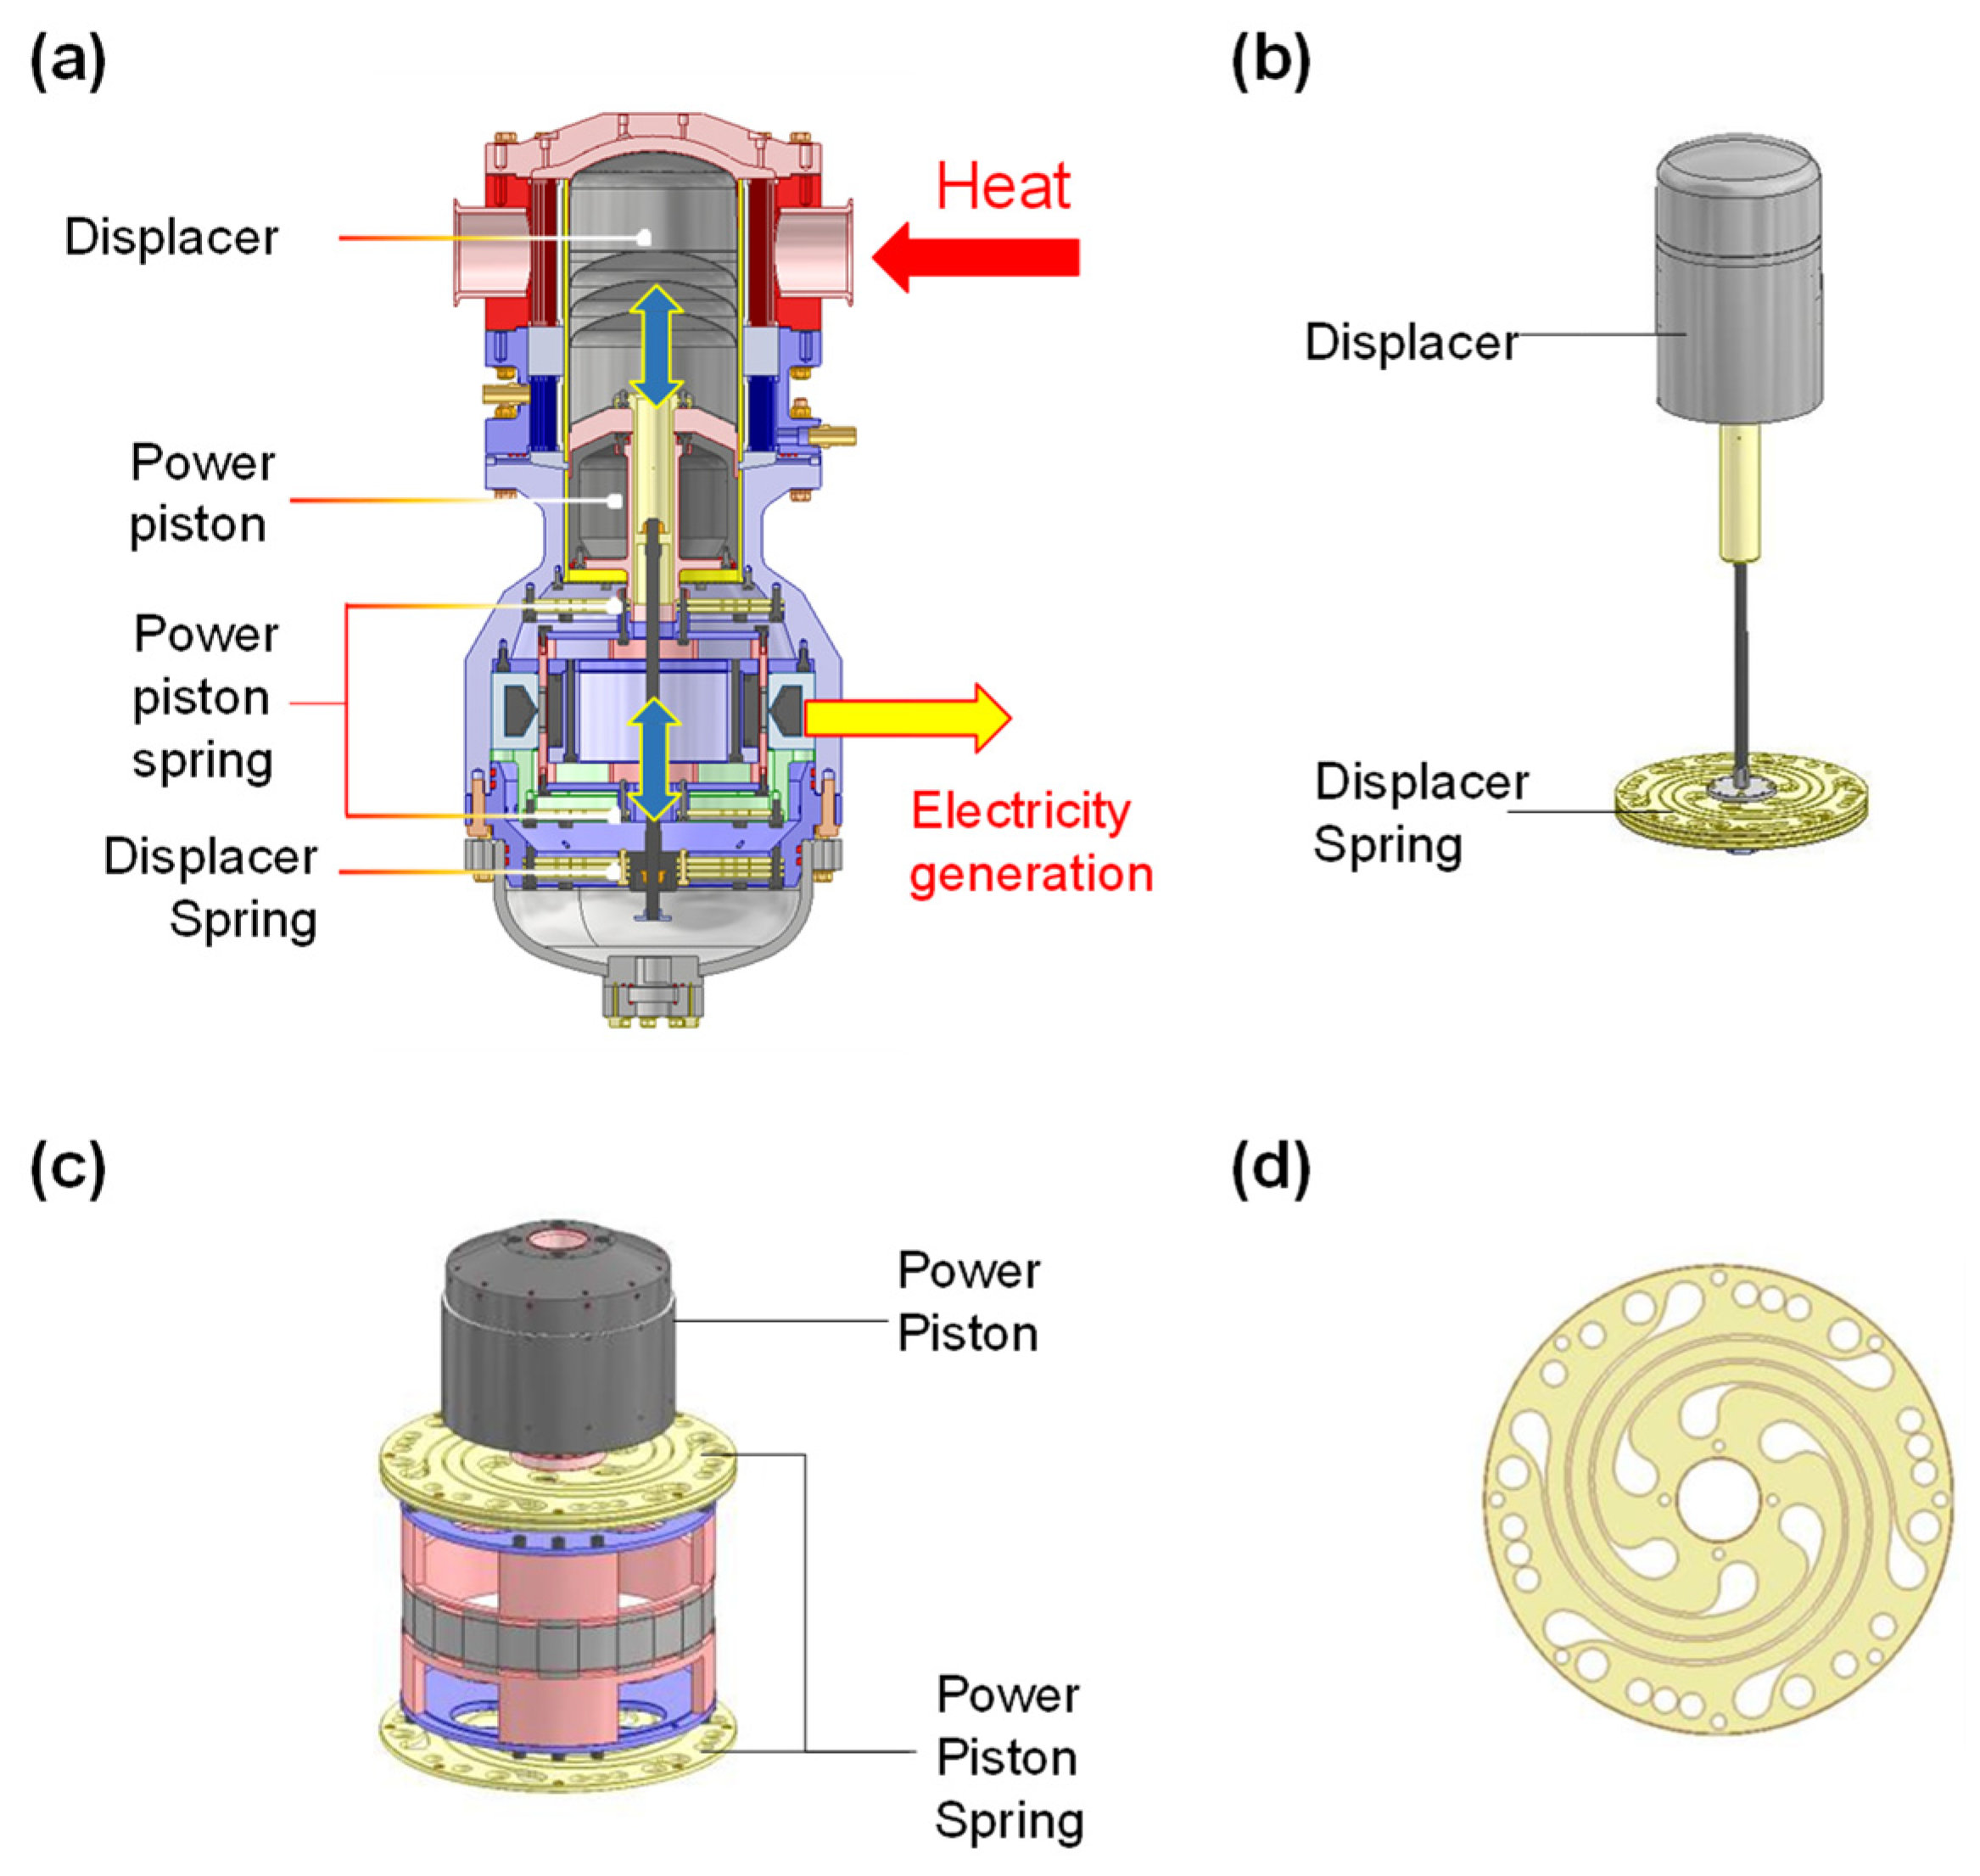
Figure 1a represents the display assembly of a 3 kW FPSE developed by Nexergy Lab [
18], and
Figure 1b,c represents the displacer piston and power piston assembly, respectively. The flat spiral spring presented in
Figure 1d is widely adopted for the spring structure of the FPSE. The flat spring structure enables the simplification of the system design with a small volume occupied.
The amplitude of the flat spiral spring for the developed 3 kW FPSE shown in
Figure 1d was 11 mm. The outer diameter was 260 mm, and the thickness was 5 mm. The material used was SK5, which is widely employed for springs, with a stiffness of 197 kN/m. The natural frequency of FPSE was 55 Hz. The previously designed flat spiral spring was not functional due to the fatigue fracture, as shown in
Figure 2. The broken parts were marked with red arrows. Thus, to avoid the fatigue fracture of the spring, its geometry should be modified to reduce the maximum stress.
3. Design Variables of the Spiral Spring
There are two methods for increasing the fatigue characteristics. One is to reduce the stress amplitude, and the other is surface treatment, such as shot pending [
21]. In this work, we aimed to increase fatigue life by reducing the stress amplitude of the spring.
Figure 3 shows the design concept for reducing the stress on the spring. A conventionally designed spring has a high stiffness owing to its large size, but its high stress makes it susceptible to rupturing. Therefore, the newly designed spring has reduced stress due to its reduced size, and the reduced stiffness is compensated for by the stacking of several springs.
Considering that the working frequency of the FPSE is the same as the natural frequency of the displacer piston assembly [
22], the equation for the spring module stiffness and spring module mass can be established as follows [
23]:
where
ksm is the stiffness of the spring module,
msm is the effective mass of the spring module,
md is the mass of the displacer piston, and
ω is the natural frequency of the displacer. Moreover,
ns is the number of springs in the spring module, and
ks and
ms are the stiffness and effective mass per spring, respectively. The effective mass of the spring is assumed to be one third of the mass of the part where deformation occurs, excluding the fixed part where deformation does not occur, as shown in
Figure 4 [
23].
A stacked structure of the flat spiral spring was employed to design the spring for a long lifetime. The stacking of springs enables the reduction of the outer diameter and thickness of the spring and is also highly productive. The design objectives are graphically represented in
Figure 5.
The constraints for the spring geometry are as follows: the working frequency of the displacer is 55 Hz and the mass of the displacer is 2.3 kg. In
Figure 5, line 1 represents the mass limit of the spring module and line 2 shows the relationship of the stiffness, which forms 55 Hz, expressed by Equation (2).
Line 3 indicates the relationship between the stiffness and mass when the spring is serially combined and indicates the stiffness per mass of the designed spring. Consequently, the target area should exceed line 2 and not exceed the mass limit (line 1), as shown in
Figure 5.
Figure 6 shows the initial shape and design parameters of the spring for design optimization. The spiral geometry of the flat spring acts as a spring through elastic deformation. Consequently, the number and geometry of the spirals have significant effects on the stiffness of the spring. In the design, there are three spring geometry parameters: the number of spirals, the outer diameter, and the thickness of the spring. Each parameter was categorized into three levels, as presented in
Table 1. The number of spirals was four, six, and eight; the outer diameters were 140, 160, and 180 mm; and the thicknesses of the springs were 1.2, 1.5, and 1.8 mm. The minimum and maximum values of each factor were determined from the manufacturability of the flat spring.
Figure 7a–c show the geometries for four, six, and eight spirals, respectively. As the outer diameter of each spring changes, the shape of the spiral changes with the ratio of the outer diameter change. In addition, the angle intervals for four, six, and eight spirals were 90°, 60°, and 45°, respectively. The number of holes in the center and outer regions of the flat spring was the same as the number of spirals. Regardless of the outer diameter of the spring, the center hole was 5 mm, and the outer hole diameter was 6 mm.
The objective function was determined as the maximum stress and the required number of springs for the spring module. The maximum stress of the spring was directly related to the fatigue of the spring. As the maximum stress decreased, the lifetime of the spring increased. For each spring geometry, the required number of springs for the spring module was expressed as follows by organizing Equation (1) for
ns:
As the required number of springs for the spring module increased, the stiffness per spring is smaller or the mass per spring was higher. The module height of the spring should be considered during the design process in an actual engine application. For 3 kW FPSE, the height of the spring module is limited to 34 mm owing to the geometry of the engine part, as shown in
Figure 8. The maximum numbers of springs were determined using Equation (4), and are listed in
Table 2:
The characteristics of both objective functions are that the smaller the maximum stress, the longer the spring module. To find the optimal point-of-response values from the selected design factors, three-level design points were chosen for three design variables, as shown in
Table 3, using the central composite design (CCD).
4. Finite Element Analysis
The spring material used was SK5, with a density, elastic modulus, and yield stress of 8000 kg/m
3, 196 MPa, and 1034 MPa, respectively. The simulations were conducted using the commercial finite element analysis software ANSYS 16. The size of the mesh was 1 mm, as shown in
Figure 9. The three elements were stacked in the thickness direction. The displacement boundary condition of the center region was 11 mm in the vertical direction, and the outer region of the spring was fixed. Finite element simulations were conducted for the 15 cases listed in
Table 3.
We verified the simulation model by comparing the stiffness of the experimental and simulation results.
Figure 10 shows the comparison of the stiffness between the finite element analysis and experiments. Experiments were conducted with a simple lathe to present the deformation of the flat spring as shown in
Figure 10a. The test rig was designed to mount the spring on the lathe and the handle of the lathe was used to push and pull the spring to measure the displacement and static load. A load cell measured the force applied to the spring, and a laser displacement sensor measured the displacement of the spring. The geometry of the spring employed in the experiments and the simulation were presented in
Figure 10b. The outer diameter of the spring was 102 mm, and it had four spirals. The comparison of the load-displacement curve for the experimental result and the simulation result is presented in
Figure 10c. The designed deformation of the spring was 5 mm. The measured and predicted spring stiffness values were 13,531 N/m and 13,478 N/m, respectively. The predictive accuracy was reasonable, with an error of 0.39%. Thus, the simulation model for the flat spiral spring precisely predicted the mechanical behavior of the spring.
Figure 11 presents the simulation results for case 1. The number of spiral arms was 4. The outer diameter and thickness were 140 mm and 1.2 mm, respectively. The stiffness of the spring was calculated from the ratio of the resultant load to the displacement. The maximum stress was 667.24 MPa, the stiffness of the spring for case 1 was 7072.36 N/m, and the required number of springs for the spring module was 61. The height of the spring module calculated using Equation (3) was 85.2 mm, which exceeded 34 mm and was not applicable to the developed FPSE. Similarly, cases 3, 4, 5, 7, 8, 10, and 14 presented in
Table 4 exceeded the permitted height of the spring modules and were not applicable to the developed FPSE. However, all cases were included in the Minitab analysis for optimal spring design by checking the tendency of the objective function.
Figure 12 shows the spring module stiffness for the spring module mass for cases 4, 8, 12, and 13 in the design plane, as shown in
Figure 5. In the graph, the slope of the line indicates the stiffness per mass of the spring module, and the point indicates an increase of 10 in the spring number. Case 4 exhibited a very low stiffness per mass of 199 kN/m·kg. Thus, it did not enter the target area even for a spring number higher than 60. Case 8 met the design stiffness for a spring number higher than 26, but it did not enter the target area because it exceeded the spring module mass. Case 12 had a large stiffness per mass and met the target area with less than 10 springs, while it had a very high maximum stress of 904 MPa. Case 13 entered the target area with an appropriate stiffness per mass and also an appropriate maximum stress. Thus, the design plane enabled a visualization of whether the spring met the design conditions.
5. Regression Analysis
The results of the finite element analysis for the 15 cases are listed in
Table 4. A regression analysis using the response surface method was conducted using commercial data analysis software (Minitab 19). To ensure that all variables reached a significant level, we used the backward elimination method, which removed one p-value for a term that did not exceed 0.05. Equations (5) and (6) were the order regression equations for the number of spirals, outer diameter, and thickness:
R-square represents the fitness of the regression model for the interpreted data.
Table 5 presents the values of R-square for the maximum stress and the number of springs for the spring module. It was found that the R-square values represented a high fit above 0.9.
In the regression model, the effects on the first-order, square, and interaction terms for the design factor were analyzed using the Pareto chart, as shown in
Figure 13. The parameters with higher effects for the maximum stress were the outer diameter (D) and thickness (T). The parameters with higher effects on the number of springs were the thickness and the outer diameter.
6. Analysis of the Influence of Variables
We analyzed the effect of the design variables on (a) the maximum stress and (b) the number of springs for the spring module, as shown in
Figure 14. For the maximum stress, as the outer diameter increased, the maximum stress decreased. As the thickness increased, the maximum stress increased. The change in the maximum stress due to the increase in the number of spirals was not significant. For maximum stresses, which showed smaller and better properties, increasing the outer diameter and decreasing thickness was required, as shown in
Figure 15a.
As the thickness and number of spirals increased, the number of springs decreased. In contrast, the number of springs increased as the outer diameter increased. An increased number of spiral arms, increased thickness and decreased outer diameter were required for a smaller number of springs for the spring modules. In particular, the number of springs for the spring module was inversely related to the spring stiffness, so that the thickness was the design factor with a major influence on the spring stiffness, as shown in
Figure 14b.
In the conventional spring shown in
Figure 1d, the maximum stress of the spring in the simulation at a displacement of 11 mm was 670 MPa. The stress limit of the spring was determined to be 670 MPa because the previous spring showed a fatigue fracture.
Figure 16 presents graphs of areas that meet the maximum stress value of 670 MPa or less at thicknesses of (a) 1.2 mm and (b) 1.5 mm, and meet the required maximum number of springs, as presented in
Table 2. For the 1.2 mm-thick spring, these conditions could not be satisfied. In the 1.5 mm-thick spring, the conditions could be satisfied with a minimum number of six or more spirals and an outer diameter of 154 mm or more. Furthermore, this graph allowed us to derive the optimal outer diameter range according to the number of spirals. If there are seven spirals, the optimal outer diameter ranges from 154 mm to 159 mm, whereas for eight spirals, it ranges from 154 mm to 163 mm.
A simulation of the springs with optimized variables was conducted. Among the possible geometries of the flat spiral spring, the thickness of the spring was selected as 1.5 mm. The simulation results are shown in
Figure 17. The red line in
Figure 17 represents the limit of the number of springs. When satisfying the conditions, such as the limited number of springs, the outer diameter of 165 mm, the corresponding number of springs (20), and number of spirals (eight), the maximum stress in the simulation was 580.91 MPa.
7. Experiments for Fatigue Life
The optimized geometry of the spiral springs was tested to determine the stiffness and fatigue fracture characteristics. A spiral spring with an outer diameter of 165 mm and eight spirals was fabricated through wire electrical discharge machining (EDM) cutting, as shown in
Figure 18a. The initial thickness of the material was 1.5 mm, and the material was SK5. First, the natural frequency of the spring was measured using an impact test. The total mass of the spring system was 2.013 kg and the natural frequency of the optimized spring was 16.33. In the simulation, the stiffness of the flat spiral spring was 22,061 N/m.
Figure 18b,c presents the design cross-sectional view of the spring fatigue test rig and its photograph, respectively. The test rig consists of a linear motor, linear guide, spring fixture, and spring. The spring is fixed on the outside by the spring fixture, and the inside is connected to the linear motor movers, which deform upward and downward. The displacement of the spring was measured using a laser displacement sensor (OD1-B100H50U14, SICK).
Figure 19a shows that the spring was driven at a displacement of 11 mm and an operating frequency of 22 Hz for 780 min (13 h) for a total of 1,029,600 cycles of fatigue. Because the fatigue limit of SK5 generally occurs with the number of cycles from 10
5 to 10
6 [
24], we conducted fatigue tests with the maximum number of cycles of 10
6. Consequently, when the number of cycles was higher than 10
6, the spring worked infinitely.
Experiments confirmed that the developed spring shape was applicable because no abnormalities were found after fatigue tests with more than 10
6 cycles.
Figure 19b shows the results of the stress analysis under a displacement of 11 mm. At this time, the spring point at which the maximum stress occurred was the inner spiral part, with a value of 553 MPa.
We conducted another experiment which resulted in the fracture of the spring.
Figure 20a shows the results of the fatigue tests under a spring displacement amplitude of 12 mm.
Figure 20b presents the structural stress analysis at a displacement of 12 mm. Unlike the 11 mm condition fatigue test, the spring displacement amplitude was found to slightly increase from the start of the test. After 180 min, the spring displacement amplitude increased to 14 mm under the same motor input condition, and a spring break occurred. One of the inner spirals of the spring broke where the maximum stress was predicted in the stress analysis, as shown in
Figure 21. The maximum stress was predicted to be 603 MPa.
When the amplitude was 11 mm, no fatigue fracture occurred, and the maximum stress was 553 MPa. When the amplitude was 12 mm, fatigue fracture occurred, and the maximum stress was 603 MPa. As a result, it was found that the fatigue limit of the flat spiral spring was between 553 and 603 MPa.
8. Discussion
Figure 22 shows the stress analysis results of case 4 with the lowest stress and case 12 with the highest stress among the 15 cases of the CCD. Both springs exhibited the highest stress at the beginning of the inner spiral. The outer diameter and thickness of case 4 were 180 mm and 1.2 mm, respectively, and those of case 14 were 140 mm and 1.8 mm, respectively. As a result, the larger the outer diameter of the spring and the thinner the thickness, the less stress and stiffness, which showed the same tendency as
Figure 14a.
To explain the changes in stress resulting from changes in the outer diameter and thickness of the spring, the spiral of the spring was assumed to be a simple cantilever, as shown in
Figure 23. The stress and deformation of the spiral were defined as follows [
25]:
F is the vertical load applied to the inside of the spiral, E is the Young’s modulus, and L is the length of the spiral; b is the width of the spiral and T is the thickness of the spring. Because the deformation is inversely proportional to the cube of the thickness, to make the same deformation when the thickness of the spring increases, the force increases to the cube, and the stress on the spiral increases. In addition, as the outer diameter of the spring increases, the L and b of the spiral increase. Because the deformation is proportional to the cube of L, the required force is reduced to 1/3 square, and the stress on the spiral decreases as the outer diameter of the spring increases. Note that the deformation is dominated by L; therefore, the effect of b is negligible. As such, the stress varies depending on the thickness and outer diameter of the spring; therefore, an optimal design based on the outer diameter and thickness is needed considering the design spring stiffness.
9. Conclusions
In this work, we proposed a new stacking spring system: 3 kW FPSE. The spring was designed to reduce the outer diameter and thickness of the spring module, which could improve the durability of the spring. We computed the maximum stress with finite element analysis. Additionally, the effects of the spring geometry, such as the outer diameter and the thickness on the fatigue life were studied. Design of experiments (DOE) and response surface methods were applied to design the optimized spring structures. The optimized flat spiral spring showed good fatigue characteristics.
The conventional spring had an outer diameter of 260 mm and a thickness of 5 mm, with a maximum stress of 670 MPa. Through experiments with DOE, the regression model for the maximum stress and required number of springs in the spring module was obtained. The effects of geometric variables were studied. The increased outer diameter of the spiral spring decreased the maximum stress of the spring. An increase in the number of spirals decreased the required number of springs. In addition, we determined the optimized conditions for the spiral springs. The optimal shape obtained from this study was 165 mm in outer diameter, 1.5 mm in thickness, and contained eight spirals. The maximum stress was reduced by 20% to 553.6 MPa. In the fatigue test, fracture did not occur for 106 cycles with displacements of 11 mm. The optimized spiral spring showed good performance under the operating conditions of a 3 kW Stirling engine.


