
Optimal Earthquake Intensity Measures for Probabilistic Seismic Demand Models of Base-Isolated Nuclear Power Plant Structures


Abstract
:1. Introduction
2. Ground Motions
2.1. Earthquake Intensity Measures
2.2. Input Ground Motions

| ID | Intensity Measure | Definition | Unit | Ref. |
|---|---|---|---|---|
| 1 | Peak ground acceleration | PGA = max |a(t)| | g | - |
| 2 | Peak ground velocity | PGV = max |v(t)| | m/s | - |
| 3 | Peak ground displacement | PGD = max |d(t)| | m | - |
| 4 | Root-mean-square of acceleration | g | Dobry et al. [42] | |
| 5 | Root-mean-square of velocity | m/s | Kramer [36] | |
| 6 | Root-mean-square of displacement | m | Kramer [36] | |
| 7 | Arias intensity | m/s | Arias [43] | |
| 8 | Characteristic intensity | m1.5/s2.5 | Park et al. [44] | |
| 9 | Specific energy density | SED | m2/s | - |
| 10 | Cumulative absolute velocity | CAV | m/s | Benjamin [45] |
| 11 | Acceleration spectrum intensity | ASI | g*s | Thun et al. [46] |
| 12 | Velocity spectrum intensity | VSI | m | Thun et al. [46] |
| 13 | Housner spectrum intensity | HI | m | Housner [47] |
| 14 | Sustained maximum acceleration | SMA = the 3rd of PGA | g | Nuttli [48] |
| 15 | Sustained maximum velocity | SMV = the 3rd of PGV | m/s | Nuttli [48] |
| 16 | Effective peak acceleration | EPA | g | Benjamin [45] |
| 17 | Spectral acceleration at T1 | g | Shome et al. [49] | |
| 18 | Spectral velocity at T1 | m/s | - | |
| 19 | Spectral displacement at T1 | m | - | |
| 20 | A95 parameter | A95 = 0.764 | g | Sarma & Yang [50] |
| Parameters | Min. | Max. | Mean | Standard Deviation | Coefficient of Variation |
|---|---|---|---|---|---|
| PGA (g) | 0.093 | 1.585 | 0.453 | 0.272 | 0.601 |
| PGA/PGV | 0.250 | 3.294 | 1.088 | 0.614 | 0.565 |
| Magnitude, Mw | 5.2 | 7.8 | 6.63 | 0.513 | 0.077 |
| Epicentral distance, R (km) | 0.07 | 89.76 | 12.23 | 14.027 | 1.14 |
| Significant duration, D5-95 (s) | 2.79 | 60.77 | 11.934 | 9.034 | 0.757 |
| Predominant period, Tp (s) | 0.04 | 1.24 | 0.374 | 0.202 | 0.540 |
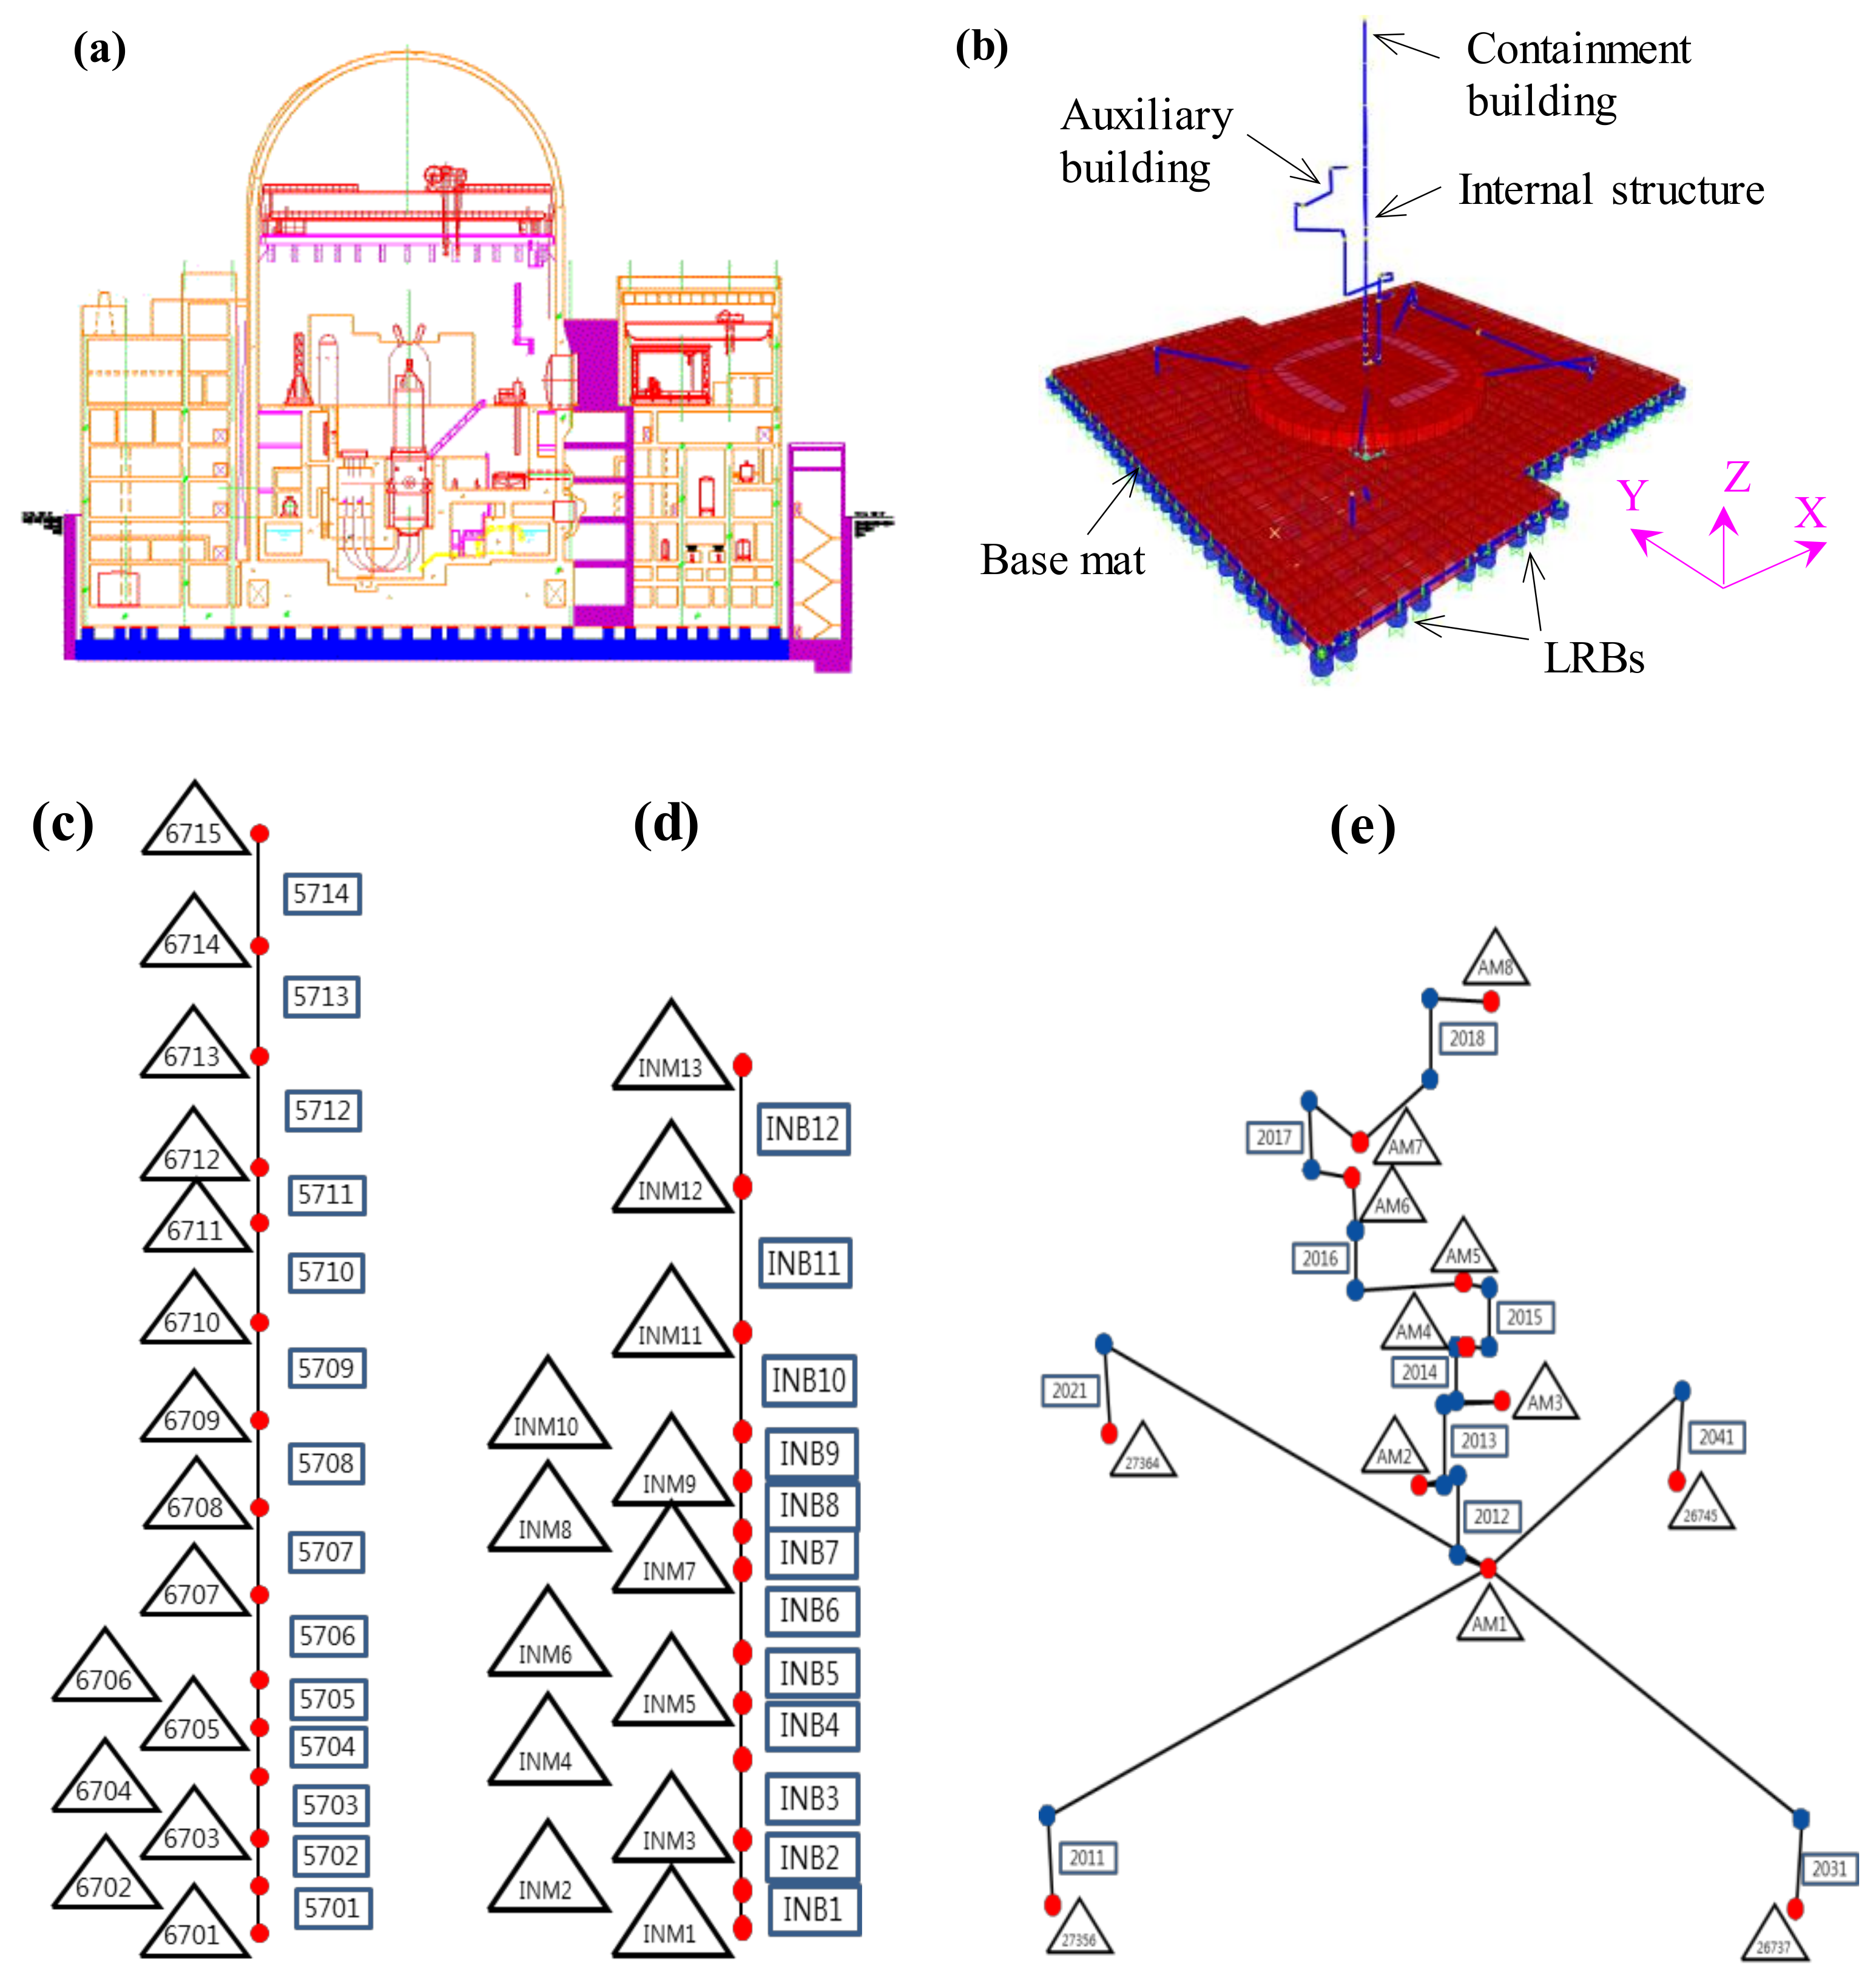
3. Numerical Modeling of Base-Isolated APR1400 NPP Structures
4. Seismic Performance of Isolated NPP Structures
- Maximum floor displacement (MFD), i.e., the maximum absolute value of the lateral floor displacement of the structures. MFD is an EDP correlated to the global stability of the structures.
- Maximum floor acceleration (MFA), i.e., the maximum absolute value of the floor acceleration of all the stories.
- Maximum isolator displacement (MID), i.e., an EDP to evaluate the damage of the base isolator.
5. Optimal Earthquake IMs for PSDM of Base-Isolated NPP Structures
5.1. Probabilistic Seismic Demand Model
5.2. Parameters for Evaluation of IMs
5.2.1. Coefficient of Determination ()
5.2.2. Efficiency (i.e., Standard Deviation)
5.2.3. Practicality
5.2.4. Proficiency
5.3. Results and Discussions
6. Conclusions
- The optimal IMs for PSDMs with respect to MFD and MID are VSI, HI, PGV, and Sv(T1). Meanwhile, DRMS, ASI, SMA, and PGD are inappropriate IMs for the PSDMs of isolated NPP structures.
- PGA, ASI, A95, EPA, and SMA are efficient IMs for PSDMs with respect to the MFA of the base-isolated structures, whereas DRMS, PGD, Sd(T1), and SED are not appropriate for conducting seismic performance evaluations of isolated NPP structures.
- CAV is not recommended for determining the exceedance of the operating basis earthquake of base-isolated NPP structures.
- The findings in this study can be applied for the probabilistic seismic risk assessment of base-isolated NPP structures.
- It should be noted that the analysis will be much more demanding for other types of reactors such as IV Gen reactors because of different designs of whole NPP due to the specific features of the reactor (e.g., mass of lead in case of LFR or lower structural integrity of HTR graphite blocks) [66,67].
Author Contributions
Funding
Institutional Review Board Statement
Informed Consent Statement
Data Availability Statement
Conflicts of Interest
References
- Cao, V.; Ronagh, H.R. Correlation between seismic parameters of far-fault motions and damage indices of low-rise reinforced concrete frames. Soil Dynam. Earthq. Eng. 2014, 66, 102–112. [Google Scholar] [CrossRef]
- Pejovic, J.R.; Serdar, N.N.; Pejovic, R.R. Optimal intensity measures for probabilistic seismic demand models of RC high-rise buildings. Earthq. Struct. 2017, 13, 221–230. [Google Scholar]
- Padgett, J.E.; Nielson, B.G.; DesRoches, R. Selection of optimal intensity measures in probabilistic seismic demand models of highway bridge portfolios. Earthq. Eng. Struct. Dynam. 2008, 37, 711–725. [Google Scholar] [CrossRef]
- Zelaschi, C.; Monteiro, R.; Pinho, R. Critical assessment of intensity measures for seismic response of Italian RC bridge portfolios. J. Earthq. Eng. 2019, 23, 980–1000. [Google Scholar] [CrossRef]
- Nguyen, D.D.; Azad, M.S.; Choi, B.H.; Lee, T.H. Efficient Earthquake Intensity Measure for Seismic Vulnerability of Integral Abutment Bridges. J. Korean Soc. Hazard Mitig. 2020, 20, 251–260. [Google Scholar] [CrossRef]
- Phan, H.N.; Paolacci, F. Efficient intensity measures for probabilistic seismic response analysis of anchored above-ground liquid steel storage tanks. In Proceedings of the Pressure Vessels and Piping Conference, American Society of Mechanical Engineers, Vancouver, BC, Canada, 17–21 July 2016. [Google Scholar]
- Nguyen, D.D.; Park, D.; Shamsher, S.; Nguyen, V.Q.; Lee, T.H. Seismic vulnerability assessment of rectangular cut-and-cover subway tunnels. Tunn. Undergr. Space Technol. 2019, 86, 247–261. [Google Scholar] [CrossRef]
- Huang, Z.K.; Pitilakis, K.; Argyroudis, S.; Tsinidis, G.; Zhang, D.M. Selection of optimal intensity measures for fragility assessment of circular tunnels in soft soil deposits. Soil Dynam. Earthq. Eng. 2021, 145, 106724. [Google Scholar] [CrossRef]
- Armstrong, R.; Kishida, T.; Park, D. Efficiency of ground motion intensity measures with earthquake-induced earth dam deformations. Earthq. Spectra 2018, 37, 5–25. [Google Scholar] [CrossRef]
- Shakib, H.; Jahangiri, V. Intensity measures for the assessment of the seismic response of buried steel pipelines. Bull. Earthq. Eng. 2016, 14, 1265–1284. [Google Scholar] [CrossRef]
- Mollaioli, F.; Lucchini, A.; Cheng, Y.; Monti, G. Intensity measures for the seismic response prediction of base-isolated buildings. Bull. Earthq. Eng. 2013, 11, 1841–1866. [Google Scholar] [CrossRef]
- Yang, C.; Xie, L.; Li, A.; Jia, J.; Zeng, D. Ground motion intensity measures for seismically isolated RC tall buildings. Soil Dynam. Earthq. Eng. 2019, 125, 105727. [Google Scholar] [CrossRef]
- Lee, T.-H.; Mosalam, K.M. Probabilistic Seismic Evaluation of Reinforced Concrete Structural Components and Systems; PEER Report 2006/04; Pacific Earthquake Engineering Research Center: Berkeley, CA, USA, 2006. [Google Scholar]
- Pnevmatikos, N.G.; Papagiannopoulos, G.A.; Papavasileiou, G.S. Fragility curves for mixed concrete/steel frames subjected to seismic excitation. Soil Dyn. Earthq. Eng. 2019, 116, 709–713. [Google Scholar] [CrossRef]
- Pnevmatilos, N.G.; Thomos, G.C. Stochastic structural control under earthquake excitations. Struct. Contr. Health Monit. 2014, 21, 620–633. [Google Scholar] [CrossRef]
- Huang, Y.N.; Whittaker, A.S.; Luco, N. A probabilistic seismic risk assessment procedure for nuclear power plants: (I) Methodology. Nucl. Eng. Des. 2011, 241, 3996–4003. [Google Scholar] [CrossRef]
- Nguyen, D.D.; Thusa, B.; Park, H.; Azad, M.S.; Lee, T.H. Efficiency of various structural modelling schemes on evaluating seismic performance and fragility of APR1400 containment building. Nucl. Eng. Technol. 2021, 53, 2696–2707. [Google Scholar] [CrossRef]
- Tran, T.T.; Cao, A.T.; Nguyen, T.H.X.; Kim, D. Fragility assessment for electric cabinet in nuclear power plant using response surface methodology. Nucl. Eng. Technol. 2019, 51, 894–903. [Google Scholar] [CrossRef]
- Cho, S.G.; Joe, Y.H. Seismic fragility analyses of nuclear power plant structures based on the recorded earthquake data in Korea. Nucl. Eng. Des. 2005, 235, 1867–1874. [Google Scholar] [CrossRef]
- Choi, I.K.; Choun, Y.S.; Ahn, S.M.; Seo, J.M. Probabilistic seismic risk analysis of CANDU containment structure for near-fault earthquakes. Nucl. Eng. Des. 2008, 238, 1382–1391. [Google Scholar] [CrossRef]
- Lee, H.; Ou, Y.C.; Roh, H.; Lee, J.S. Simplified model and seismic response of integrated nuclear containment system based on frequency adaptive lumped-mass stick modeling approach. KSCE J. Civ. Eng. 2015, 19, 1757–1766. [Google Scholar]
- Park, J.B.; Park, N.C.; Lee, S.J.; Park, Y.P.; Choi, Y. Seismic analysis of the APR1400 nuclear reactor system using a verified beam element model. Nucl. Eng. Des. 2017, 313, 108–117. [Google Scholar] [CrossRef]
- Ali, A.; Hayah, N.A.; Kim, D.; Cho, S.G. Probabilistic seismic assessment of base-isolated NPPs subjected to strong ground motions of Tohoku earthquake. Nucl. Eng. Technol. 2014, 46, 699–706. [Google Scholar] [CrossRef] [Green Version]
- Zhou, Z.; Wong, J.; Mahin, S. Potentiality of using vertical and three-dimensional isolation systems in nuclear structures. Nucl. Eng. Technol. 2016, 48, 1237–1251. [Google Scholar] [CrossRef] [Green Version]
- Jung, J.W.; Jang, H.W.; Kim, J.H.; Hong, J.W. Effect of second hardening on floor response spectrum of a base-isolated nuclear power plant. Nucl. Eng. Des. 2017, 322, 138–147. [Google Scholar] [CrossRef]
- Nguyen, D.D.; Thusa, B.; Lee, T.H. Seismic Fragility of Base-Isolated Nuclear Power Plant Considering Effects of Near-Fault Ground Motions. J. Korean Soc. Hazard Mitig. 2018, 18, 315–321. [Google Scholar] [CrossRef]
- Nguyen, D.D.; Thusa, B.; Lee, T.H. Effects of significant duration of ground motions on seismic responses of base-isolated nuclear power plant. J. Earthq. Eng. Soc. Korea 2019, 23, 149–157. [Google Scholar] [CrossRef]
- Eem, S.H.; Jung, H.J.; Kim, M.K.; Choi, I.K. Seismic fragility evaluation of isolated NPP containment structure considering soil-structure interaction effect. J. Earthq. Eng. Soc. Korea 2013, 17, 53–59. [Google Scholar] [CrossRef]
- Lee, J.H.; Song, J.K. Seismic fragility analysis of seismically isolated nuclear power plant structures using equivalent linear-and bilinear-lead rubber bearing model. J. Earthq. Eng. Soc. Korea 2015, 19, 207–217. [Google Scholar] [CrossRef] [Green Version]
- Sarebanha, A.; Mosqueda, G.; Kim, M.K.; Kim, J.H. Seismic response of base isolated nuclear power plants considering impact to moat walls. Nucl. Eng. Des. 2018, 328, 58–72. [Google Scholar] [CrossRef]
- Kim, S.W.; Jeon, B.G.; Hahm, D.G.; Kim, M.K. Seismic fragility evaluation of the base-isolated nuclear power plant piping system using the failure criterion based on stress-strain. Nucl. Eng. Technol. 2019, 51, 561–572. [Google Scholar] [CrossRef]
- Li, C.; Zhai, C.; Kunnath, S.; Ji, D. Methodology for selection of the most damaging ground motions for nuclear power plant structures. Soil Dynam. Earthq. Eng. 2019, 116, 345–357. [Google Scholar] [CrossRef]
- Nguyen, D.D.; Thusa, B.; Han, T.S.; Lee, T.H. Identifying significant earthquake intensity measures for evaluating seismic damage and fragility of nuclear power plant structures. Nucl. Eng. Technol. 2020, 52, 192–205. [Google Scholar] [CrossRef]
- Nguyen, D.D.; Thusa, B.; Azad, M.S.; Tran, V.L.; Lee, T.H. Optimal earthquake intensity measures for probabilistic seismic demand models of ARP1400 reactor containment building. Nucl. Eng. Technol. 2021, in press. [Google Scholar] [CrossRef]
- Tran, T.T.; Le, T.M.T.; Nguyen, P.C.; Kim, D.; Pham, T.M.; Salman, K.; Chang, S. Probabilistic seismic demand model and seismic fragility analysis of NPP equipment subjected to high and low-frequency earthquakes. Nucl. Sci. Eng. 2021, in press. [Google Scholar] [CrossRef]
- Kramer, S.L. Geotechnical Earthquake Engineering; Prentice Hall. Inc.: Upper Saddle River, NJ, USA, 1996. [Google Scholar]
- SeismoSignal—A Computer Program for Signal Processing of Strong-Motion Data. 2017. Available online: http://www.seismosoft.com (accessed on 15 May 2021).
- Shome, N. Probabilistic Seismic Demand Analysis of Nonlinear Structures. Ph.D. Thesis, Stanford University, Palo Alto, CA, USA, 1999. [Google Scholar]
- PEER Ground Motion Database. 2019. Available online: http://peer.berkeley.edu/peer_ground_motion_database (accessed on 17 May 2019).
- KMA. Korean Meteorological Administration. Available online: http://www.kma.go.kr/eng/index.jsp (accessed on 15 June 2016).
- NRC. US Nuclear Regulatory Commission 1.60. In Design Response Spectra for Seismic Design of Nuclear Power Plants, 2nd ed.; Regulatory Guide 1.60: Rockville, MD, USA, 2014. [Google Scholar]
- Dobry, R.; Idriss, I.M.; Ng, E. Duration characteristics of horizontal components of strong-motion earthquake records. Bull. Seismol. Soc. Am. 1978, 68, 1487–1520. [Google Scholar]
- Arias, A. A Measure of Earthquake Intensity. In Seismic Design for Nuclear Power Plants; Hansen, R.J., Ed.; MIT Press: Cambridge MA, USA, 1970; pp. 438–483. [Google Scholar]
- Park, Y.J.; Ang, A.H.S.; Wen, Y.K. Seismic damage analysis of reinforced concrete buildings. J. Struct. Eng. 1985, 111, 740–757. [Google Scholar] [CrossRef]
- Benjamin, J.R. A Criterion for Determining Exceedance of the Operating Basis Earthquake; Report No. EPRI NP-5930; Electrical Power Research Institute: Palo Alto, CA, USA, 1988. [Google Scholar]
- Thun, V. Earthquake Ground Motions for Design and Analysis of Dams. In Proceedings of the Earthquake Engineering and Soil Dynamics II-Recent Advances in Ground-Motion Evaluation, Park City, UT, USA, 27–30 June 1988. [Google Scholar]
- Housner, G.W. Spectrum intensities of strong-motion earthquakes. In Proceedings Symposium on Earthquake and Blast Effects on Structures; Earthquake Engineering Research Institute: Los Angeles, CA, USA, 1952. [Google Scholar]
- Nuttli, O.W. The Relation of Sustained Maximum Ground Acceleration and Velocity to Earthquake Intensity and Magnitude; US Army Engineer Waterways Experiment Station: Vicksburg, MS, USA, 1979. [Google Scholar]
- Shome, N.; Cornell, C.A.; Bazzurro, P.; Carballo, J.E. Earthquakes, records, and nonlinear responses. Earthq. Spectra 1998, 14, 469–500. [Google Scholar] [CrossRef]
- Sarma, S.K.; Yang, K.S. An evaluation of strong motion records and a new parameter A95. Earthq. Eng. Struct. Dynam. 1987, 15, 119–132. [Google Scholar] [CrossRef]
- SAP2000, version 15; Software for Structural Analysis and Design Program; Computers and Structures Inc: Berkeley, CA, USA, 2013.
- Lee, E.H.; Kim, J.M.; Joo, K.H.; Kim, H. Evaluation of the soil-structure interaction effect on seismically isolated nuclear power plant structures. J. Earthq. Eng. Soc. Korea 2016, 20, 379–389. [Google Scholar] [CrossRef]
- Kim, G.J.; Yang, K.K.; Kim, B.S.; Kim, H.J.; Yun, S.J.; Song, J.K. Seismic response evaluation of seismically isolated nuclear power plant structure subjected to Gyeong-Ju earthquake. J. Earthq. Eng. Soc. Korea 2016, 20, 453–460. [Google Scholar] [CrossRef]
- Cho, S.G.; Yun, S.M.; Kim, D.; Hoo, K.J. Analyses of Vertical Seismic Responses of Seismically Isolated Nuclear Power Plant Structures Supported by Lead Rubber Bearings. J. Earthq. Eng. Soc. Korea 2015, 19, 133–143. [Google Scholar] [CrossRef]
- An, G.; Kim, M.; Jung, J.W.; Mosqueda, G.; Marquez, J.F. Evaluation of Clearance to Stop Requirements in A Seismically Isolated Nuclear Power Plant. Energies 2020, 13, 6156. [Google Scholar] [CrossRef]
- Lee, T.H.; Nguyen, D.D. Seismic vulnerability assessment of a continuous steel box girder bridge considering influence of LRB properties. Sādhanā 2018, 43, 1–15. [Google Scholar] [CrossRef] [Green Version]
- Sarebanha, A.; Marquez, J.; Hughes, P.; Mosqueda, G. Considerations for modeling of base isolated nuclear power plants subjected to beyond design basis shaking. Nucl. Eng. Des. 2021, 379, 111236. [Google Scholar] [CrossRef]
- Nguyen, D.D.; Nguyen, C.N. Seismic Responses of NPP Structures Considering the Effects of Lead Rubber Bearing. Eng. Technol. Appl. Sci. Res. 2020, 10, 6500–6503. [Google Scholar] [CrossRef]
- Kim, J.H.; Kim, M.K.; Choi, I.K. Experimental Study on the Ultimate Limit State of a Lead-Rubber Bearing. In ASME 2016 Pressure Vessels and Piping Conference; American Society of Mechanical Engineers: Vancouver, BC, Canada, 2016. [Google Scholar]
- Kim, J.; Kim, M.; Choi, I. Experimental study on seismic behavior of lead-rubber bearing considering bi-directional horizontal input motions. Eng. Struct. 2019, 198, 109529. [Google Scholar] [CrossRef]
- Eem, S.; Hahm, D. Large strain nonlinear model of lead rubber bearings for beyond design basis earthquakes. Nucl. Eng. Technol. 2019, 51, 600–606. [Google Scholar] [CrossRef]
- Schellenberg, A.H.; Sarebanha, A.; Schoettler, M.J.; Mosqueda, G.; Benzoni, G.; Mahin, S.A. Hybrid Simulation of Seismic Isolation Systems Applied to an APR-1400 Nuclear Power Plant; Pacific Earthquake Engineering Research Center: Berkeley, CA, USA, 2015. [Google Scholar]
- Cornell, C.A.; Jalayer, F.; Hamburger, R.O.; Foutch, D.A. Probabilistic basis for 2000 SAC federal emergency management agency steel moment frame guidelines. J. Struct. Eng. 2002, 128, 526–533. [Google Scholar] [CrossRef] [Green Version]
- Rabiee, R.; Chae, Y. Adaptive base isolation system to achieve structural resiliency under both short-and long-period earthquake ground motions. J. Intell. Mater. Sys. Struct. 2019, 30, 16–31. [Google Scholar] [CrossRef]
- Reed, J.W.; Kassawara, R.P. A criterion for determining exceedance of the operating basis earthquake. Nucl. Eng. Des. 1990, 123, 387–396. [Google Scholar] [CrossRef] [Green Version]
- Stanisz, P.; Oettingen, M.; Cetnar, J. Monte Carlo modeling of Lead-Cooled Fast Reactor in adiabatic equilibrium state. Nucl. Eng. Des. 2016, 301, 341–352. [Google Scholar] [CrossRef]
- Kepisty, G.; Stanisz, P.; Cetnar, J. Monte Carlo burnup in HTR system with various TRISO packing. Ann. Nucl. Energy 2016, 92, 419–430. [Google Scholar] [CrossRef]


| Node | Height from Base-Mat (m) | Nodal Mass (ton) | Area (m2) | Moment of Inertia (m4) | Shear Area (m2) | Torsional Constant (m4) |
|---|---|---|---|---|---|---|
| 1 | 16.76 | 87.07 | 202.90 | 56,299.85, 56,299.85 | 101.45 | 112,634.22 |
| 2 | 20.27 | 166.52 | 202.90 | 56,299.85, 56,299.85 | 101.45 | 112,634.22 |
| 3 | 23.46 | 185.42 | 202.90 | 56,299.85, 56,299.85 | 101.45 | 112,634.22 |
| 4 | 27.73 | 189.29 | 202.90 | 56,299.85, 56,299.85 | 101.45 | 112,634.22 |
| 5 | 31.09 | 170.39 | 202.90 | 56,299.85, 56,299.85 | 101.45 | 112,634.22 |
| 6 | 34.59 | 234.68 | 202.90 | 56,299.85, 56,299.85 | 101.45 | 112,634.22 |
| 7 | 40.53 | 314.15 | 202.90 | 56,299.85, 56,299.85 | 101.45 | 112,634.22 |
| 8 | 47.24 | 333.05 | 202.90 | 56,299.85, 56,299.85 | 101.45 | 112,634.22 |
| 9 | 53.94 | 318.02 | 202.90 | 56,299.85, 56,299.85 | 101.45 | 112,634.22 |
| 10 | 60.65 | 310.43 | 202.90 | 56,299.85, 56,299.85 | 101.45 | 112,634.22 |
| 11 | 66.44 | 376.80 | 202.90 | 56,299.85, 56,299.85 | 101.45 | 112,634.22 |
| 12 | 70.56 | 279.92 | 179.76 | 47,591.20, 47,591.20 | 89.89 | 95,199.65 |
| 13 | 78.63 | 355.52 | 179.76 | 35,861.70, 35,861.70 | 89.89 | 71,732.03 |
| 14 | 86.72 | 352.09 | 166.11 | 12,825.63, 12,825.63 | 83.03 | 25,651.25 |
| 15 | 94.64 | 147.80 |
| Node | Height from Base-Mat (m) | Nodal Mass (ton) | Area (m2) | Moment of Inertia (m4) | Shear Area (m2) | Torsional Constant (m4) |
|---|---|---|---|---|---|---|
| 1201 | 16.76 | 184.17 | 833.15 | 51,055.67, 79,896.93 | 662.77 | 164,989.72 |
| 1202 | 18.28 | 341.40 | 883.97 | 51,262.81, 81,942.48 | 704.29 | 168,389.13 |
| 1203 | 20.26 | 796.48 | 857.92 | 51,149.25, 80,710.1 | 684.03 | 165,957.82 |
| 1204 | 23.46 | 523.67 | 313.78 | 9908.34, 21,253.36 | 221.77 | 37,753.43 |
| 1204 | 25.75 | 273.10 | 254.60 | 9816.63, 19,442.95 | 171.14 | 35,811.75 |
| 1205 | 27.73 | 296.29 | 221.94 | 9515.25, 19,384.02 | 144.33 | 35,233.94 |
| 1206 | 31.09 | 296.86 | 261.38 | 9848.14, 20,166.32 | 175.93 | 36,571.27 |
| 1207 | 32.61 | 355.47 | 202.76 | 9630.81, 18,524.13 | 130.81 | 34,566.87 |
| 1208 | 34.59 | 80.51 | 202.76 | 9630.81, 18,524.13 | 130.81 | 34,566.87 |
| 1209 | 36.57 | 264.64 | 202.76 | 9630.81, 18,524.13 | 130.75 | 34,566.87 |
| 1210 | 40.53 | 255.68 | 103.23 | 1932.60, 4666.70 | 94.90 | 7888.57 |
| 1211 | 46.32 | 271.76 | 97.93 | 1918.14, 4642.60 | 92.25 | 7840.37 |
| Node | Height from Base-Mat (m) | Nodal Mass (ton) | Area (m2) | Moment of Inertia (m4) | Shear Area (m2) | Torsional Constant (m4) |
|---|---|---|---|---|---|---|
| 1001 | 16.76 | 4608.78 | 1660.45 | 530,766.3, 405,355.4 | 770.35, 611.30 | 239,729.53 |
| 1002 | 23.46 | 5265.66 | 1503.17 | 466,685.8, 332,679.3 | 658.91, 582.41 | 198,363.83 |
| 1003 | 36.57 | 4680.11 | 1529.65 | 464,101.2, 340,852.6 | 659.42, 589.37 | 205,791.05 |
| 1004 | 41.91 | 4150.72 | 1363.35 | 368,330.8, 292,325.7 | 565.41, 558.81 | 187,226.65 |
| 1005 | 40.53 | 3218.83 | 842.16 | 241,060.5, 158,771.4 | 358.88, 329.06 | 173,747.81 |
| 1006 | 52.42 | 2000.28 | 579.06 | 142,392.3, 121,479.2 | 212.0, 261.6 | 76,553.8 |
| 1007 | 57.92 | 1659.49 | 371.98 | 75,850.4, 86,362.9 | 160.3, 192.0 | 52,753.99 |
| 1008 | 63.39 | 957.38 |
| Property | Value | Unit |
|---|---|---|
| Elastic stiffness, Ku | 544.70 | kN/mm |
| Hardening stiffness, Kd | 4.20 | kN/mm |
| Yield strength, Fy | 1009.65 | kN |
| Characteristic strength, Qd | 1001.03 | kN |
| Vertical stiffness, Kv | 12.896 | kN/mm |
| Effective stiffness, Keff | 8.97 | kN/mm |
| Equivalent damping ratio, ξ | 0.335 |
| Mode | Natural Frequency (Hz) | Description |
|---|---|---|
| Mode 1 | 0.477 | Translational Y of superstructure |
| Mode 2 | 0.477 | Translational X of superstructure |
| Mode 3 | 0.709 | Rotational Z of superstructure |
| Mode 4 | 3.786 | Translational Y of RCB |
Publisher’s Note: MDPI stays neutral with regard to jurisdictional claims in published maps and institutional affiliations. |
© 2021 by the authors. Licensee MDPI, Basel, Switzerland. This article is an open access article distributed under the terms and conditions of the Creative Commons Attribution (CC BY) license (https://creativecommons.org/licenses/by/4.0/).
Share and Cite
Nguyen, D.-D.; Lee, T.-H.; Phan, V.-T. Optimal Earthquake Intensity Measures for Probabilistic Seismic Demand Models of Base-Isolated Nuclear Power Plant Structures. Energies 2021, 14, 5163. https://doi.org/10.3390/en14165163
Nguyen D-D, Lee T-H, Phan V-T. Optimal Earthquake Intensity Measures for Probabilistic Seismic Demand Models of Base-Isolated Nuclear Power Plant Structures. Energies. 2021; 14(16):5163. https://doi.org/10.3390/en14165163
Chicago/Turabian StyleNguyen, Duy-Duan, Tae-Hyung Lee, and Van-Tien Phan. 2021. "Optimal Earthquake Intensity Measures for Probabilistic Seismic Demand Models of Base-Isolated Nuclear Power Plant Structures" Energies 14, no. 16: 5163. https://doi.org/10.3390/en14165163