Article

A Coordinated Charging Scheduling of Electric Vehicles Considering Optimal Charging Time for Network Power Loss Minimization

1
Department of Electrical Engineering, Mirpur University of Science and Technology (MUST), Mirpur 10250, Pakistan
2
Department of Electrical and Electronic Engineering, College of Engineering, University of Jeddah, Jeddah 21589, Saudi Arabia
3
Department of Electrical and Electronic Engineering Technology, University of Technology Nowshera, Nowshera 24100, Pakistan
4
Department of System Engineering, Military Technological College, Muscat 111, Oman
5
School of Science, Computing and Engineering Technologies, Swinburne University of Technology, Hawthorn, Melbourne, VIC 3122, Australia
6
Power Electronics and Renewable Energy Research Laboratory (PEARL), Department of Electrical Engineering, University of Malaya, Kuala Lumpur 50603, Malaysia
*
Author to whom correspondence should be addressed.
Energies 2021, 14(17), 5336; https://doi.org/10.3390/en14175336
Submission received: 29 June 2021 / Revised: 2 August 2021 / Accepted: 3 August 2021 / Published: 27 August 2021
(This article belongs to the Special Issue Electric Vehicles in a Smart Grid Environment)

Abstract

:
Electric vehicles’ (EVs) technology is currently emerging as an alternative of traditional Internal Combustion Engine (ICE) vehicles. EVs have been treated as an efficient way for decreasing the production of harmful greenhouse gasses and saving the depleting natural oil reserve. The modern power system tends to be more sustainable with the support of electric vehicles (EVs). However, there have been serious concerns about the network’s safe and reliable operation due to the increasing penetration of EVs into the electric grid. Random or uncoordinated charging activities cause performance degradations and overloading of the network asset. This paper proposes an Optimal Charging Starting Time (OCST)-based coordinated charging algorithm for unplanned EVs’ arrival in a low voltage residential distribution network to minimize the network power losses. A time-of-use (ToU) tariff scheme is used to make the charging course more cost effective. The concept of OCST takes the departure time of EVs into account and schedules the overnight charging event in such a way that minimum network losses are obtained, and EV customers take more advantages of cost-effective tariff zones of ToU scheme. An optimal solution is obtained by employing Binary Evolutionary Programming (BEP). The proposed algorithm is tested on IEEE-31 bus distribution system connected to numerous low voltage residential feeders populated with different EVs’ penetration levels. The results obtained from the coordinated EV charging without OCST are compared with those employing the concept of OCST. The results verify that incorporation of OCST can significantly reduce network power losses, improve system voltage profile and can give more benefits to the EV customers by accommodating them into low-tariff zones.

1. Introduction

Environmental issues, dependency on fossil fuel resources, climate change, and increasing energy costs are all very challenging issues that the world is facing at present. There is a significant rise in these issues due to the transportation and energy generation sectors as they are consuming a considerable portion of fossil fuels [1,2]. To this end, efforts are being made to minimize the dependency on traditional energy resources by developing different green energy. Electric vehicle (EV) technology is a developing solution to cope with environmental and energy efficiency issues. The EVs are the replacement of the conventional internal combustion engine vehicles and serve as an economically smart move centered on electrification of the transportation industry [3]. EVs will bring a reduction in greenhouse gas emissions such as CO2, SO2, and NOx by decreasing the consumption of fossil fuels, which is one of the main reasons of global warming [4].
The charging of EVs can be done with the home-based plugin system or via a public charging station. Advancement in EV technology and charging infrastructure enable the global promotion of EVs. However, the large-scale integration of electric vehicles (EVs) may lead to an extensive variation of impacts to the power system. From a grid point of view, it seems these modern vehicles are as an electric load on the system during the charging period. A frequent and uncontrolled charging strategy can cause negative effects such as an increase of power losses, voltage deviations, transformers, and line saturations [5,6,7,8,9]. As a result, the distribution grid’s safe and reliable operation may be under high risk. Furthermore, the power quality issues can be observed on the customer side due to random charging operation [6,10,11,12]. This situation can become worse when we see unpredicted EVs arrivals and their random charging demand. Hence, a well-synchronized charging coordination between EVs and grid operators is indispensable.
The system operator always tries to uphold network performance whereas the EV customers are looking to fully charge their vehicles in their desired time. In this context, the researchers have considered various objectives such as power loss minimization, voltage profile improvement, charging cost minimization, etc., and these objectives are optimized by applying different optimization techniques. In the study of [5], the authors aimed to minimize distribution network power losses by optimally managing charging requests from the customers. In this work, a typical driving pattern without having any charging preference was considered. In another work [13], the authors applied a heuristic approach to reduce network power loss while dealing with network constraints. By employing the valley filling approach, the authors in [14] proposed a charging scheduling algorithm for EVs while considering different constraints. Suyono et al. [15] proposed an EV charging coordination strategy with the objective of minimizing system losses. In this work, tariff zones have been used and customers’ demand is managed into their desired tariff slots. The authors have considered a fixed charging priority from the customers; the flexibility in the preference is not considered. A method to minimize the charging cost of EVs is proposed in Ref. [16]. The authors have taken the network and battery parameters as optimization constraints. A price based bi-level optimization strategy is proposed by [17] to maximize the benefits of aggregator while realizing the dynamic driving pattern. Although the reported work has exhibited reasonable profit of the EV aggregator, it has failed to capture network performance. A more realistic model is presented by [18] in which the authors have optimized the energy cost for EVs’ charging and network operation. Wei Wu et al. [19] inspected the financial effect of EVs’ integration by considering different charging strategies. However, the customer flexibility towards EV charging along the pricing horizon is not considered.
By analyzing the literature work reported above, it can be apprehended that the choice of scheduling objective is of extreme importance. For example, the objectives of power loss minimization, voltage profile improvement, etc., are network performance centered. Whereas, the charging cost minimization, profit maximization, etc., are more towards customer care. The studies cited above, either focused on network performance or customer benefits. No doubt, the supply network has ample importance all the way. However, offering the flexibility to the EV customers to charge their vehicle into their desired periods while maximizing network performance has a more challenging way of integrating the EVs into the distribution network. This aspect is not previously covered in the literature. The charging flexibility refers to the intended desire of an EV owner to charge his vehicle in the time of his choice with minimum charging cost. The network should be able to acknowledge this intention without compromising its standard.
By keeping in view the boundaries of the highlighted literature work, we have developed a coordinated EV charging framework in the low voltage residential distribution network in which network performance is heightened by minimizing the system losses while acknowledging the flexibility in charging behavior of EV customers with low cost. We offer an overnight flexible charging process that should be completed with minimum charging cost considering the constraint of arrival and departure time along with the time- of-use tariff. This needs to identify the optimal charging starting time of the individual vehicle. The organization of the paper is as follows: Section 2 deals with problem formulation; Section 3 discusses the coordinated charging framework. The test system used for the execution of the proposed method is explained in Section 4, and obtained results are discussed in Section 5. Finally, the whole work is concluded in Section 6.

2. Problem Formulation

2.1. Optimization Objective

The main objective of this research is to develop a coordinated EV charging scheduling algorithm for network power loss minimization considering the flexible priorities of users. Moreover, the proposed algorithm determines an optimal charging starting time for an EV which leads to further improve the system performance by offering a low-cost charging solution. To make the simulation model more realistic, 15 min time slots have been used for 24 h. For load flow studies, backward forward sweep method is implemented on a radial distribution test system [20]. Total real power loss of distribution test system for each time slot is calculated using Equation (1) by considering constraints as highlighted by Equations (4)–(6). The total network losses for any time slot are computed by Equations (2) and (3) and gives the real power loss of an individual network branch.
m i n ( F T o t a l     L o s s ) = m i n ( Δ t = 1 T P Δ t t o t a l     l o s s )
P Δ t t o t a l     l o s s = i = 0 N 1 P Δ t , ( i , i + 1 ) L o s s
P L o s s = R i , i + 1 ( | V i + 1 V i | | y i , i + 1 | ) 2
where V i and V i + 1 are voltages at nodes i , i + 1 respectively. R i , i + 1 and y i , i + 1 represent the resistance and admittance of the line segment between node i and i + 1 respectively. P Δ t , ( i , i + 1 ) L o s s denotes the real power loss between line section i and i + 1 for any time slot Δ t (15 min), F T o t a l     L o s s represents total losses of the system over 24 h period and N is the total number of nodes.

2.2. Network and Charging Constraints

To execute the coordinated EVs’ charging algorithm, different system constraints are also obligatory to be considered. These are network voltage limits and maximum demand level ( D Δ t , m a x ) of the distribution system at any time slot Δ t :
V m i n V i ( Δ t ) V m a x     f o r     i = 1 , N n o d e
P Δ t t o t a l     d e m a n d = i = 1 N ( P Δ t ,   i l o a d + P Δ t ,   i e v ) D Δ t ,   m a x
where V m i n and V m a x are minimum and maximum voltage limits respectively. V i ( Δ t ) is the voltage of node i at any time interval Δ t , D Δ t ,   m a x is maximum demand level without EVs at any time interval Δ t and P Δ t t o t a l     d e m a n d represents the total demand at any time interval Δ t .
Furthermore, the SOC of each EV battery must be within the limits for every time slot during the simulation as shown in Equation (6). When the maximum SOC is achieved, it means the charging of EV is complete and it is removed from the EV Queue table (e.g., x i = 0 ).
S O C i , m i n S O C i ( Δ t ) S O C i , m a x
where S O C i , m i n and S O C i , m a x represents the minimum and maximum energy levels of battery for the i th user whereas S O C i ( Δ t ) shows the energy level of the battery for the i th user at time Δ t .

3. Coordinated Charging Framework

This research work focuses on the development of coordinated charging algorithm by determining an optimal starting time for EV charging. In this research, OCST matrix along with BEP technique are used to determine the optimal combination of electric vehicles (EVs) to minimize the total system power loss and voltage deviation while considering the customer’s flexible priorities. In this regard, at first, we have defined a matrix which comprises of information about the suitable charging time within the arrival and departure constraint. Then, we have applied Binary Evolutionary Programming (BEP) to optimize the objective function defined in Equation (1) subject to constraints as given in Equations (4)–(6). In this optimization process, ToU electricity tariff scheme has been used aiming to minimize the EV charging cost. The algorithmic framework is explained as follows:
Step I:
The program starts with entering the system data including the network and EVs’ information. The network data consists of system parameters and daily load curve whereas the EVs’ data consists of arrival and departure time and their corresponding SOC levels and charger efficiency with rating.
Step II:
After this, the algorithm will check the maximum demand constraint. Once this constraint is satisfied, all the available EVs will be provisionally placed in OCST matrix formulated from the extracted data.
Step III:
The number of EVs which can be facilitated in each time slot are determined by Equation (7). This defines the number of EVs ready to participate in the optimization process for their charging demand.
Step IV:
After finding the number of EVs available at any time slot, the scheduler will check that either the available slots are greater or less than the required slots.
Step V:
If available time slots are less than the required time slots, BEP will be executed to select the optimal combination of EVs by considering the system constraints. Then the OCST matrix will be updated with permanent placement of selected EVs.
Step VI:
However, if the available time slots are greater than the required time slots, the load flow program will be executed with all available EVs followed by voltage constraint satisfaction and an update to OCST matrix. Upon violation of voltage constraint, BEP will execute to select optimal number of EVs from the set of available EVs for charging. Otherwise, OCST matrix will be directly updated without performing BEP optimization process.
Step VII:
The above steps will repeat until the maximum time slots for a whole day are reached.
The detail of complete scheduling activity is illustrated in Figure 1.

3.1. Formation of OCST Matrix

OCST matrix refers to a data set of charging slots of all EVs which are participating in the scheduling activity. The formation of this matrix is based on the logic which can be observed in Figure 2.
Referring to Figure 2, when an EV customer arrives at home and plugs in the vehicle in the charging outlet, the smart meter extracts the following information: (i) Address of EV; (ii) Arrival time; (iii) Departure time; (iv) SOC at the arrival, and (v) SOC at the departure. This information is communicated with the EV aggregator, who is responsible for hosting all EVs’ data and making a contact with the system operator to initialize the charging scheduling process. Then the system operator will formulate the OCST matrix by applying Equations (7) and (8) to determine the total number of EVs that can be facilitated in any given time slot and the total number of slots required to complete the desired SOC level respectively.
n t o t a l , Δ t e v = ( D m a x i = 1 n P Δ t ,   i l o a d α )
T s l o t s ,   i = ( S O C r e q u i r e d ,   i S O C p l u g i n ,   i β . ε ) × γ
where n t o t a l , Δ t e v is the total number of EVs which can be connected to the network at a time slot Δ t , D m a x is the maximum demand level, P Δ t , i l o a d shows the total domestic load connected to the system at a time slot Δ t , α is the power rating of charger in kW, T s l o t s ,   i is the time slots required to charge an EV of the i th user to the requested energy state, S O C r e q u i r e d ,   i , S O C p l u g i n ,   i is the initial energy state of the i th EV, β is the energy delivered by the charger during any time slot Δ t with efficiency ε , and γ is the battery rating in kWh.
Finally, the OCST matrix will be formed by placing the EVs’ arrival at a given instant of time into the defined time slots by keeping in view their arrival, departure time, and network constraints. The OCST matrix will update at each time slot.
Energies 14 05336 i001
where E V i , j , k n represents the address of EVs for a given penetration level PL, x i , j , k n shows the status (either present or absent) of a particular EV and s i , j , k m is the slot member of set of slots S.

3.2. Optimization Algorithm

Evolutionary programming (EP) is a stochastic search technique based on the evolutionary biological process. It is very useful for handling nonlinear optimization problems [21,22,23]. BEP do not require any initial information about the system to begin the searching process because they only work with chromosomes, which will optimize according to the given objective function and constraints of the system. This algorithm can search various regions in search space simultaneously. The best individuals are selected between parents and new generations, making the process more likely to converge to a global optimum. The basic difference among different types of EP techniques is their mutation formulation [24]. For the BEP, the mutation is applied by uniformly changing a variable from one to zero and vice versa. The mutation formulation for binary EP to generate an offspring x i + m from a parental vector x i is based on the rules as shown in Equation (9).
x i + m , j b = {   1 0 0 1               i f i f i f i f       x i , j b = 0 x i , j b = 0 x i , j b = 1 x i , j b = 1         a n d a n d a n d a n d         r 1 0.5 , r 1 > 0.5 , r 1 0.5 , r 1 > 0.5 ,     j = 1 , 2 , n         r 1 ~ U ( 0 , 1 )
where x i , j b represents binary j th element in the i th individual, r 1 is random number generated between 0 and 1 and U ( 0 , 1 ) denotes standard uniform distribution.

4. Radial Distribution Test System

A radial distribution system is simulated to show the effectiveness of the proposed coordinated charging scheduling algorithm. The test system is a modified form of an IEEE-31 bus 23 kV distribution system connected with numerous low voltage residential (415 V) feeders based on actual system data as shown in Figure 3, developed from ref [25]. Each LV feeder comprises 19 nodes representing house loads and selected nodes with EVs’ connection. These LV residential feeders are getting supply from the high voltage main buses through 23/0.415 kV, 0.1 MVA distribution transformers. There are a total of 449 nodes in the test system (31 high voltage and 418 low voltage nodes) [25].
For the daily residential load curve, real values (Western Australia) from a distribution transformer are used, as shown in Figure 4. The average peak demand of each house is 2 kW with a power factor of 0.9. ToU tariff scheme is used, and all the nodes are at different distances from the distribution transformer, so the line data vary according to their length. A 10 MVA, 132 kV/23 kV substation transformer is connected between nodes 1 and 2, and there are 22 distribution transformers (DT-10 to DT-31) to facilitate the household loads.
Four EV penetration levels of 16%, 32%, 47%, and 63% are assumed to cover the wide range of EVs’ charging consequences in near future. Total number of EVs connected to all the LV residential feeders for each penetration level is shown in Figure 5.

Electric Vehicle Charger and Battery Requirements

For the authentic casting of electric vehicle charging loads, the battery capabilities are of great importance to determine realistic charging profiles. For this analysis, an 18 kWh battery capacity per EV is selected. To best utilize the battery life expectancy, deep cycle batteries with a depth of discharge (DOD) of 80% of the rated battery are assumed [26]. A traditional charger efficiency of 90% is assumed, requiring a total of 16 kWh of energy from the grid to fully charge a single EV. In this research, only a residential distribution system is used, so the restrictions of domestic wiring must also be considered. A normal single-phase 240 V outlet can usually supply a maximum of 2.4 kW. A charger of a 4 kW rating is selected because this is generally available in most single-phase domestic houses without reinforcing the wiring [8].

5. Results and Discussion

This section deals with the authentication of the proposed coordinated charging scheduling technique on the radial distribution test system. In this study, random arrivals and departures of EVs are considered within the given time period. The charging of EVs can only be facilitated within the predefined period (TS = 18:00–Te = 07:00). Different simulation studies are performed for optimal coordinated charging. Furthermore, an analysis of reduction in losses and voltage deviation is carried out to support the proposed algorithm. Two different case studies are presented, including uncoordinated and coordinated charging with and without OCST matrix sub cases.

5.1. Random Uncoordinated Charging

A simulation study is performed for random uncoordinated charging to show its impacts on different parameters of the radial distribution system. Voltage deviation and power losses are calculated using Equations (10) and (11) respectively.
Δ V = 1 V m i n i
Δ l o s s = Δ t = 1 T i = 1 N 1 ( P Δ t , ( i , i + 1 ) l o s s ) Δ t = 1 T i = 1 N ( P Δ t , i l o a d + P Δ t , i e v )
where Δ V is voltage deviation at the worst node, V m i n i represents the minimum voltage at any node i , Δ l o s s is ratio of total power losses and total power consumption over 24 h period which is computed from real power loss between line section i and i + 1 ( P Δ t , ( i , i + 1 ) l o s s ) for any time slot Δ t and real power household load of the i th node ( P Δ t , i l o a d ) for any time slot. Real power load of EV at the ith node for any time slot Δ t and a total number of nodes are represented by P Δ t , i e v and N respectively.
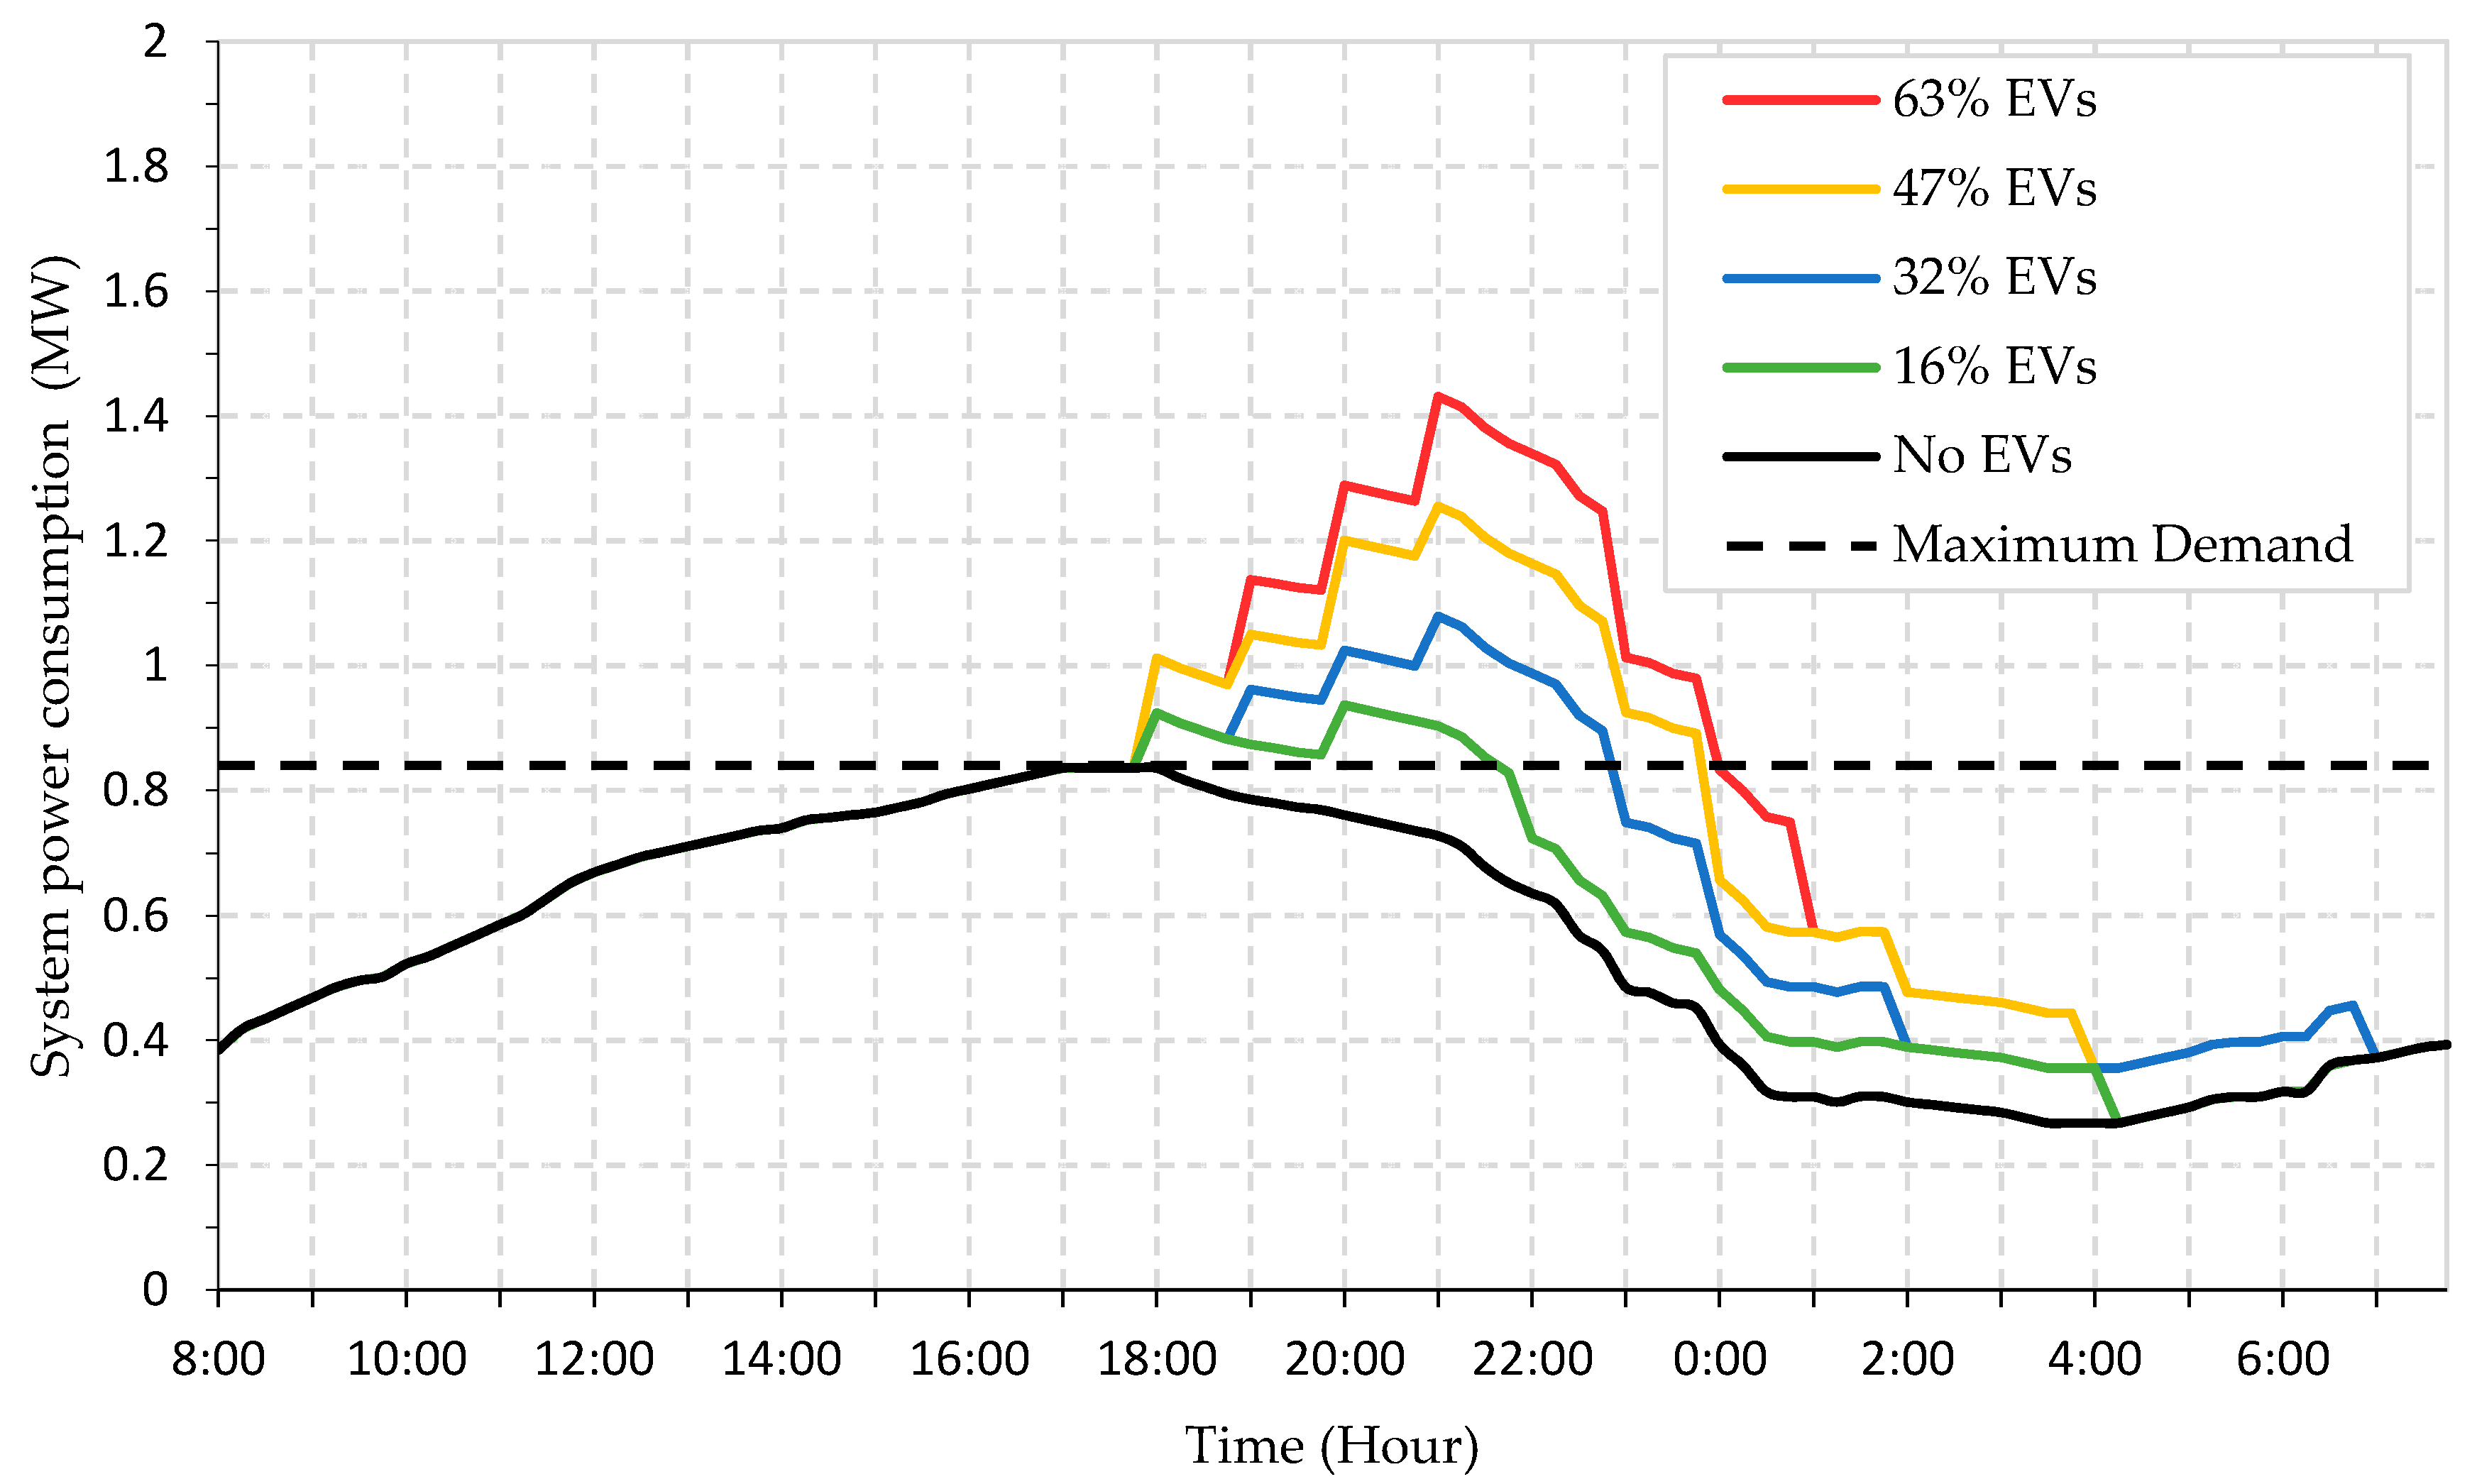
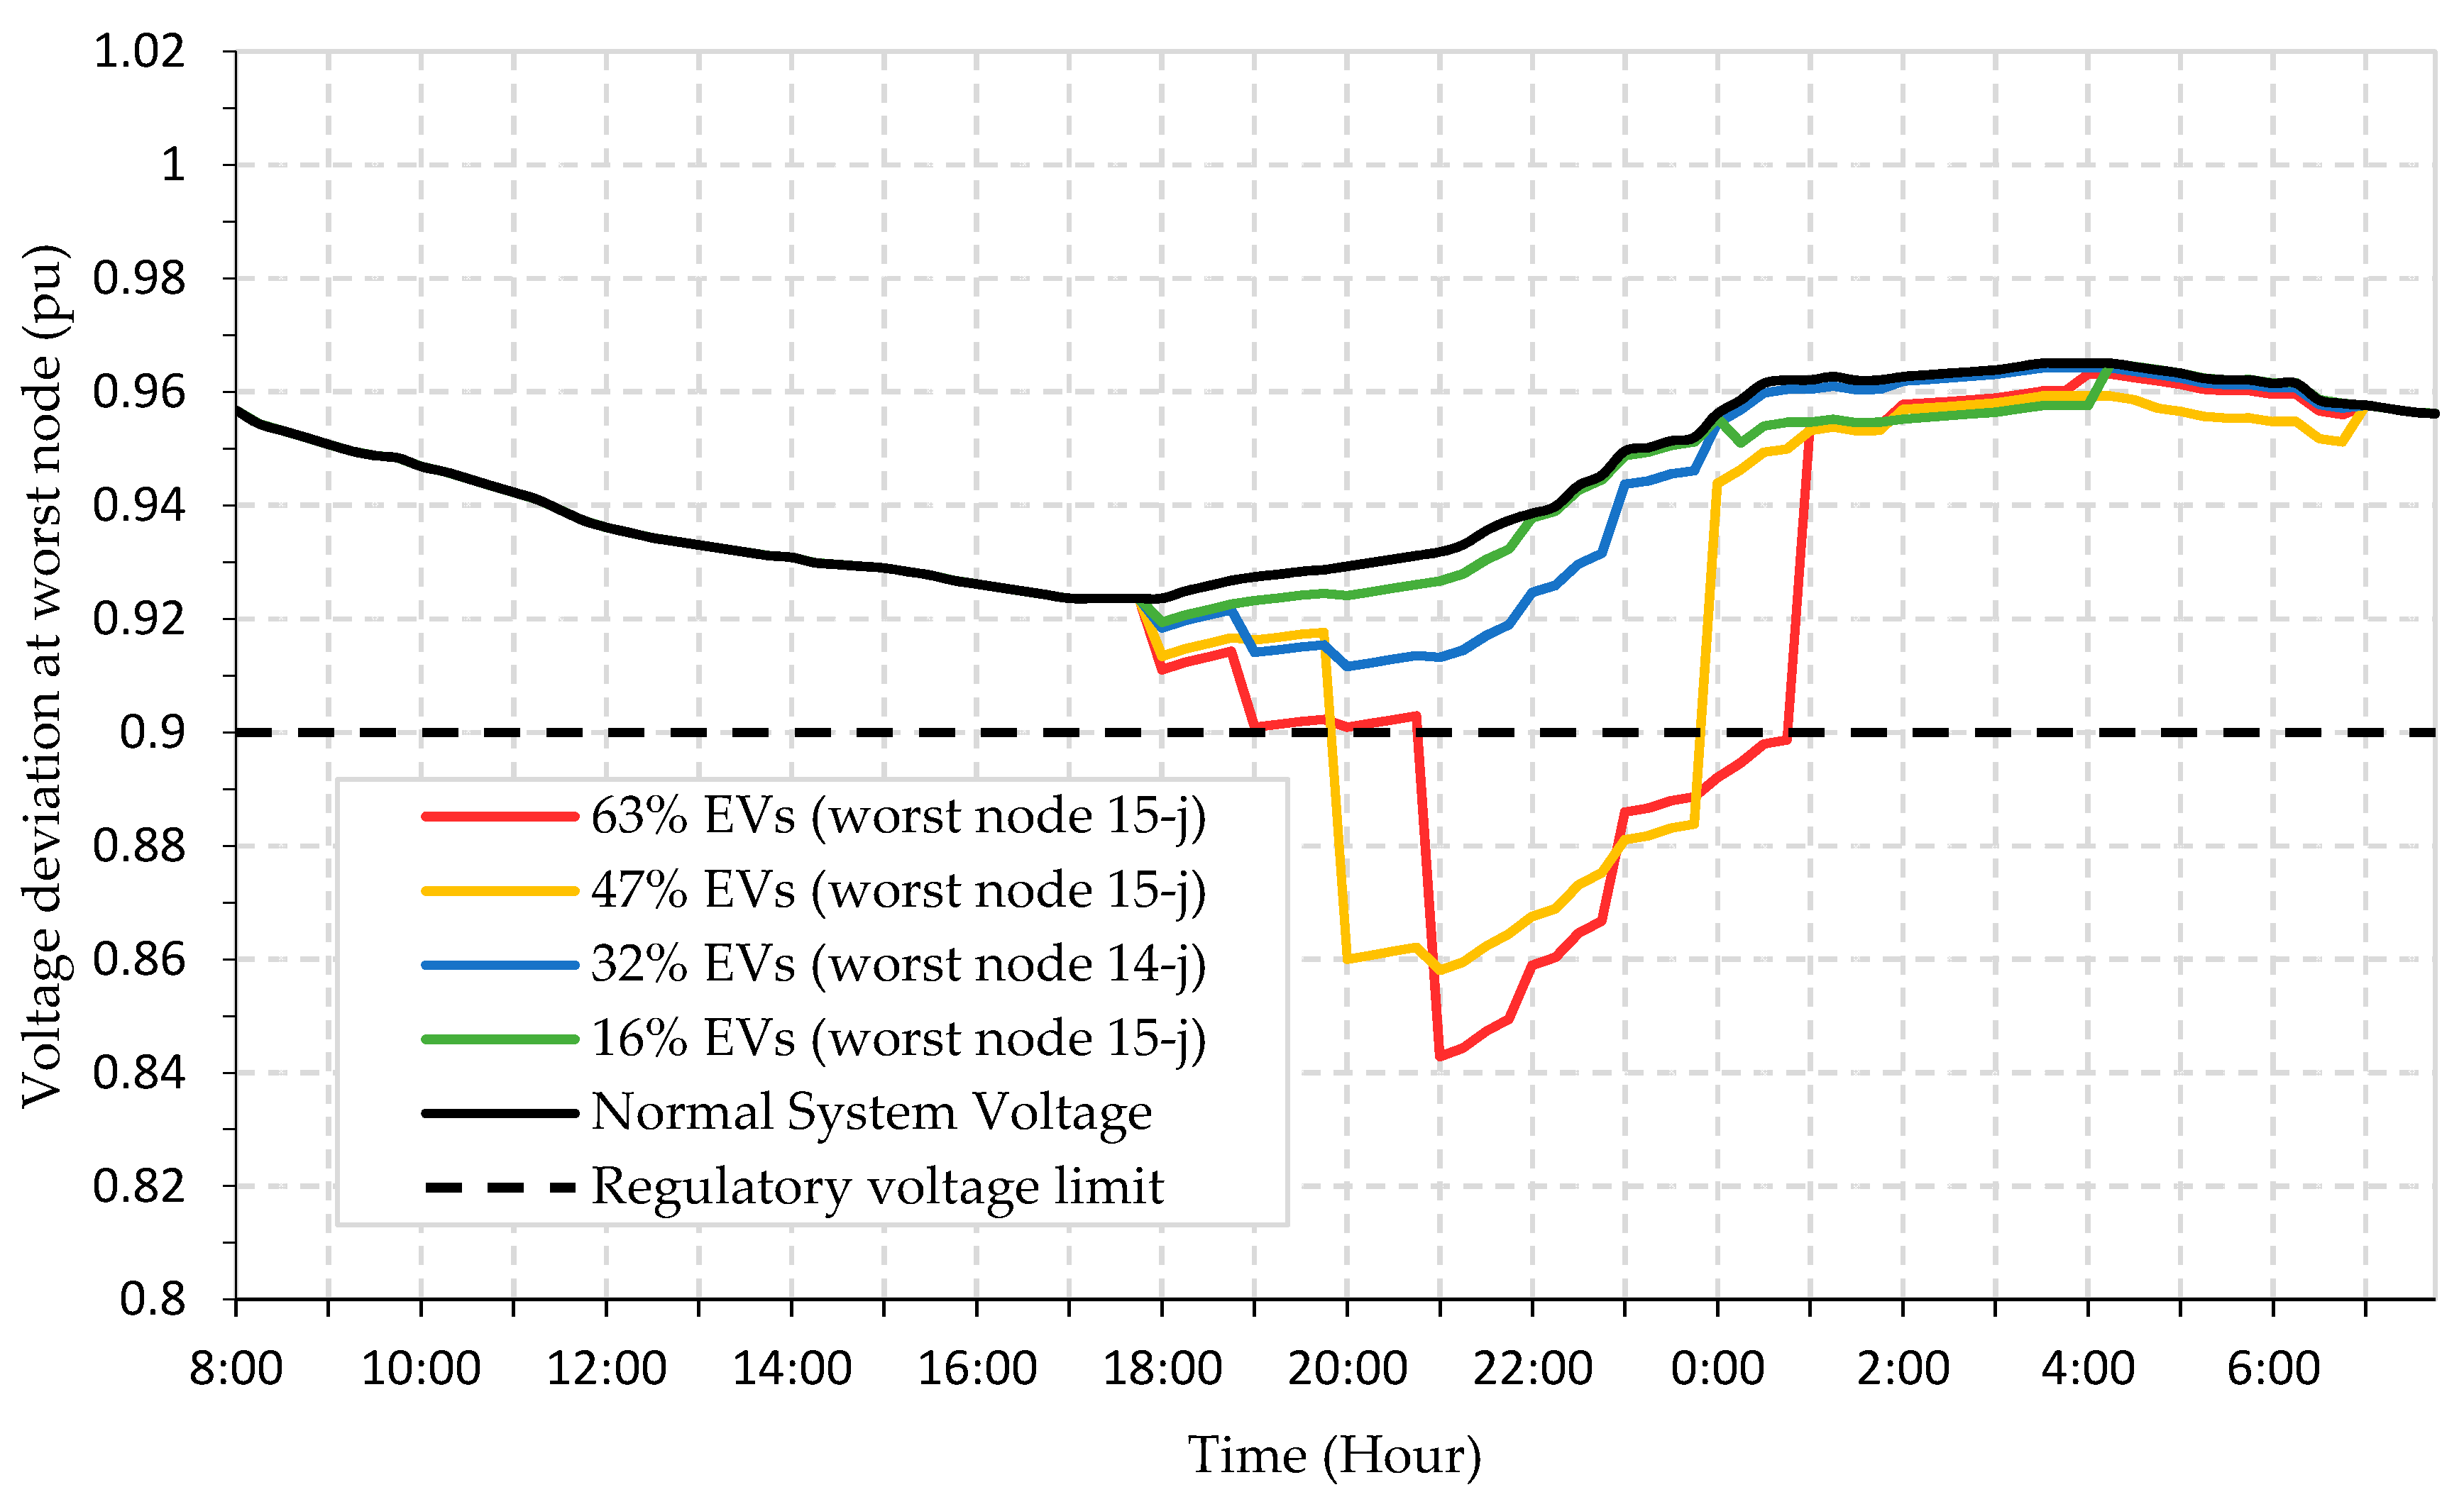
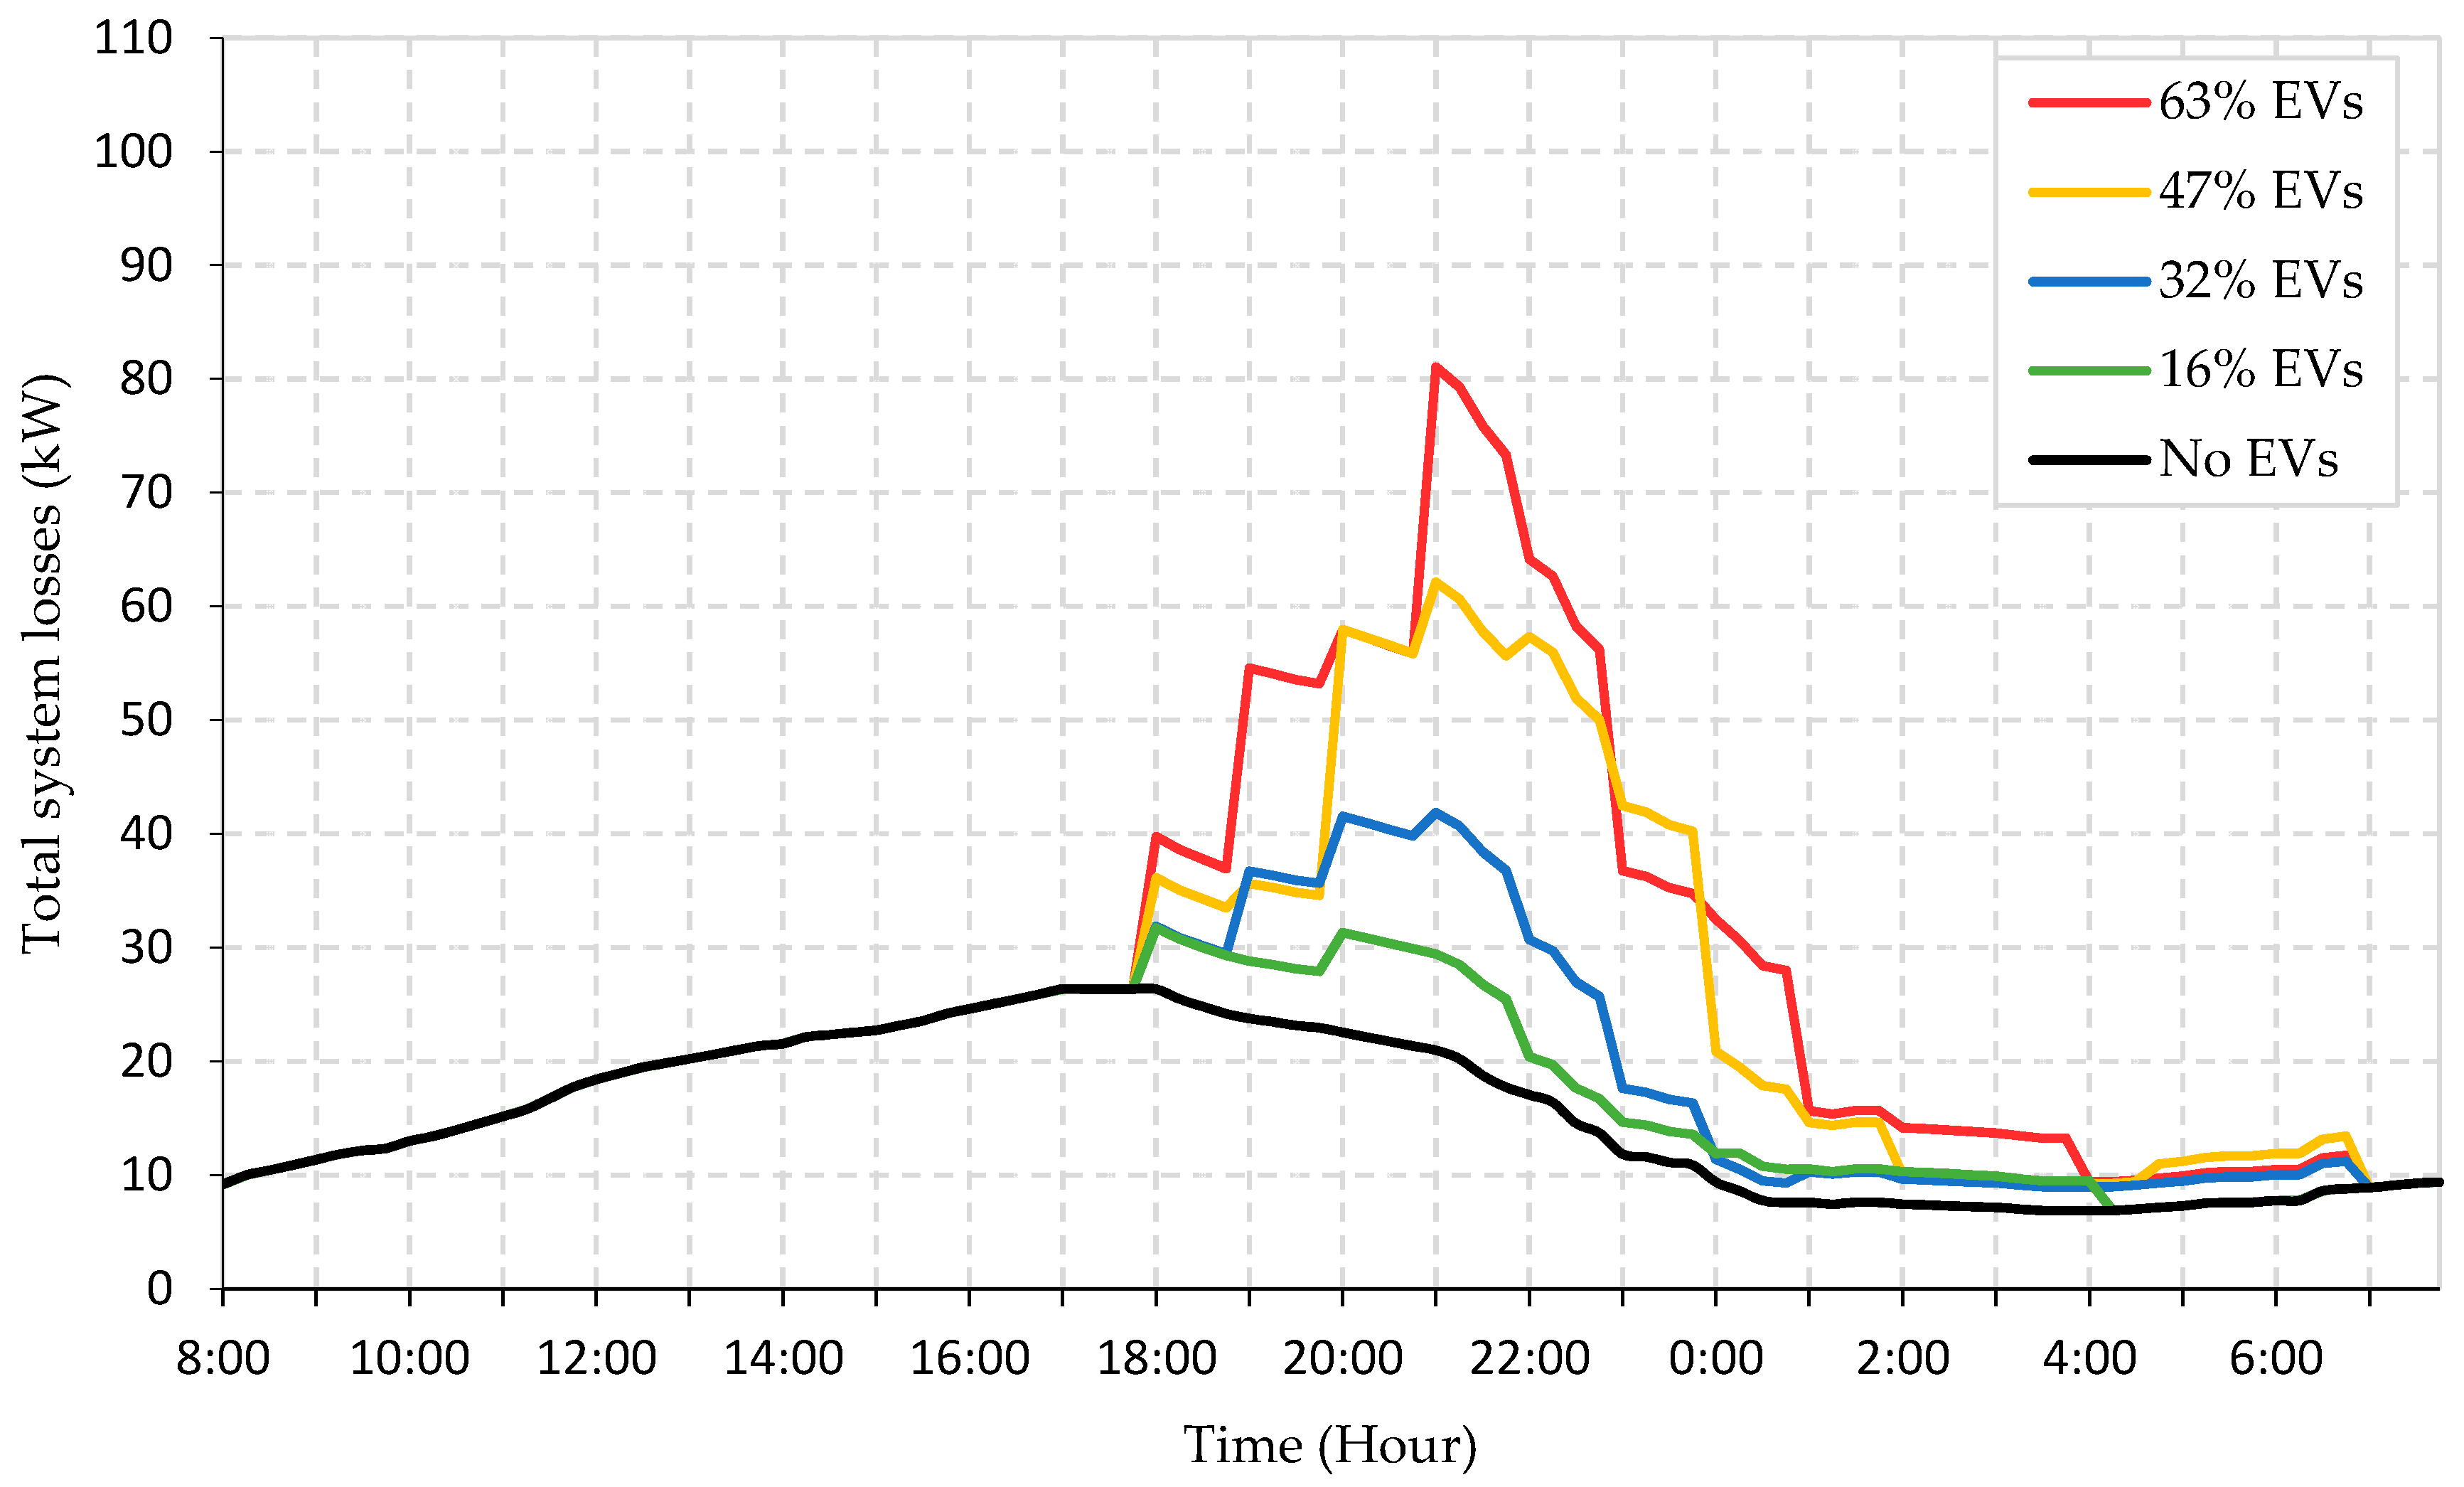
In this case, a random charging control is given to the customer so that they can charge their vehicles at any time slot without observing the network constraints. The impacts of this charging strategy are shown in Figure 6, Figure 7 and Figure 8. Referring to Figure 6, during peak hours, the system overloading occurs beyond the maximum demand limit, especially with a 63% EVs’ penetration level. In this case, the voltage constraint at the worst node violates and high network losses recorded that can be experiential from Figure 7 and Figure 8. The maximum losses are upheld with a 63% EVs’ penetration level since it carries maximum charging load compared to other levels. The results for this charging strategy are summarized in Table 1.

5.2. Coordinated Charging

After performing simulation study of random uncoordinated charging, the proposed optimal charging technique is implemented to observe its significance. At first, optimal charging technique without optimal starting time is implemented followed by the optimal charging technique by considering optimal charging starting time (OCST).

5.2.1. Coordinated Charging without Optimal Starting Time

Since this case does not consider the optimal charging starting time, therefore, with this strategy, those EVs that have minimum impact on system losses are selected during high demand period, and those having high losses find the charging slots during low demand period. Referring to Figure 9, during peak hours, the system loading is within maximum demand limit for all the penetration levels.
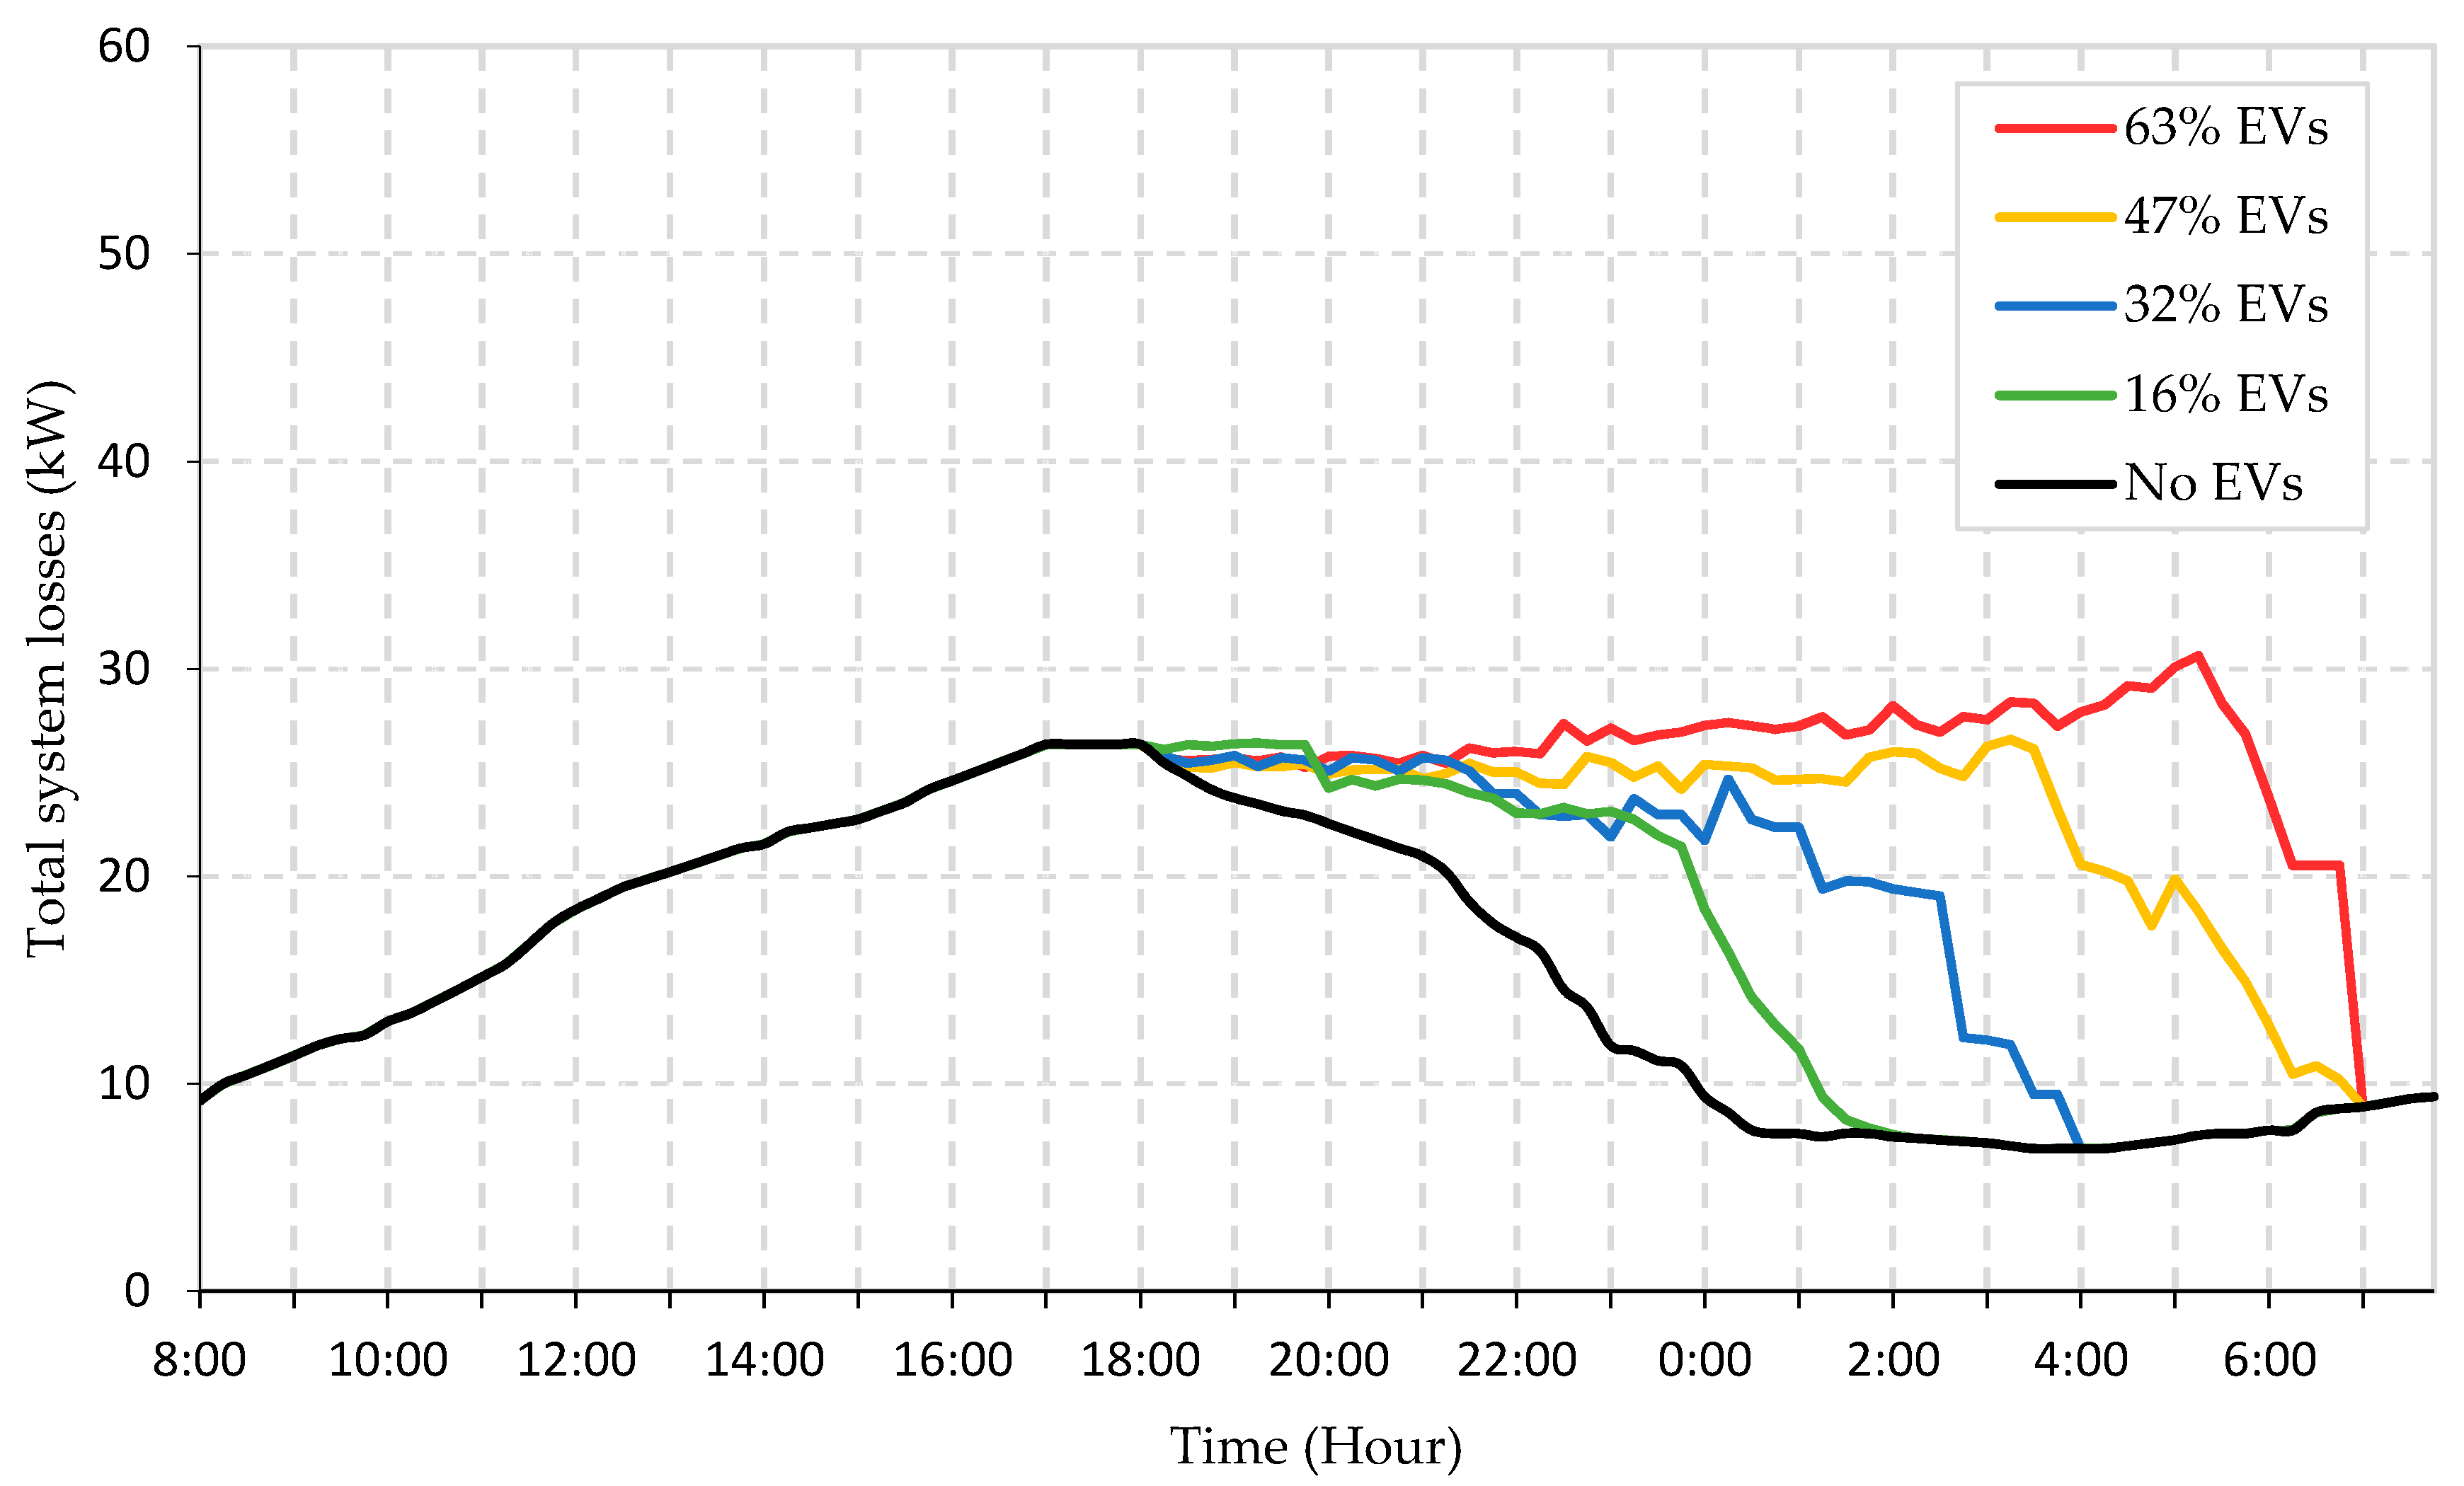
This case shows that the voltage drops at all the nodes are within the permissible limits of utility even under high EV penetrations as shown in Figure 10. Referring to Figure 11, there can be seen a significant reduction in total system power losses as compared to Figure 8. Overall, this algorithm satisfies all the parameters except the cost-effective one. In this case, charging has been started from high tariff (red zone) even for low penetration levels, so the cost of charging is high. For low and medium penetration levels, EVs can be facilitated in the low-tariff zone (green zone) instead of charging them in high price zone. To make this algorithm cost effective, the concept of optimal charging starting time (OCST) is considered.

5.2.2. Coordinated Charging Considering Optimal Starting Time (OCST) Matrix

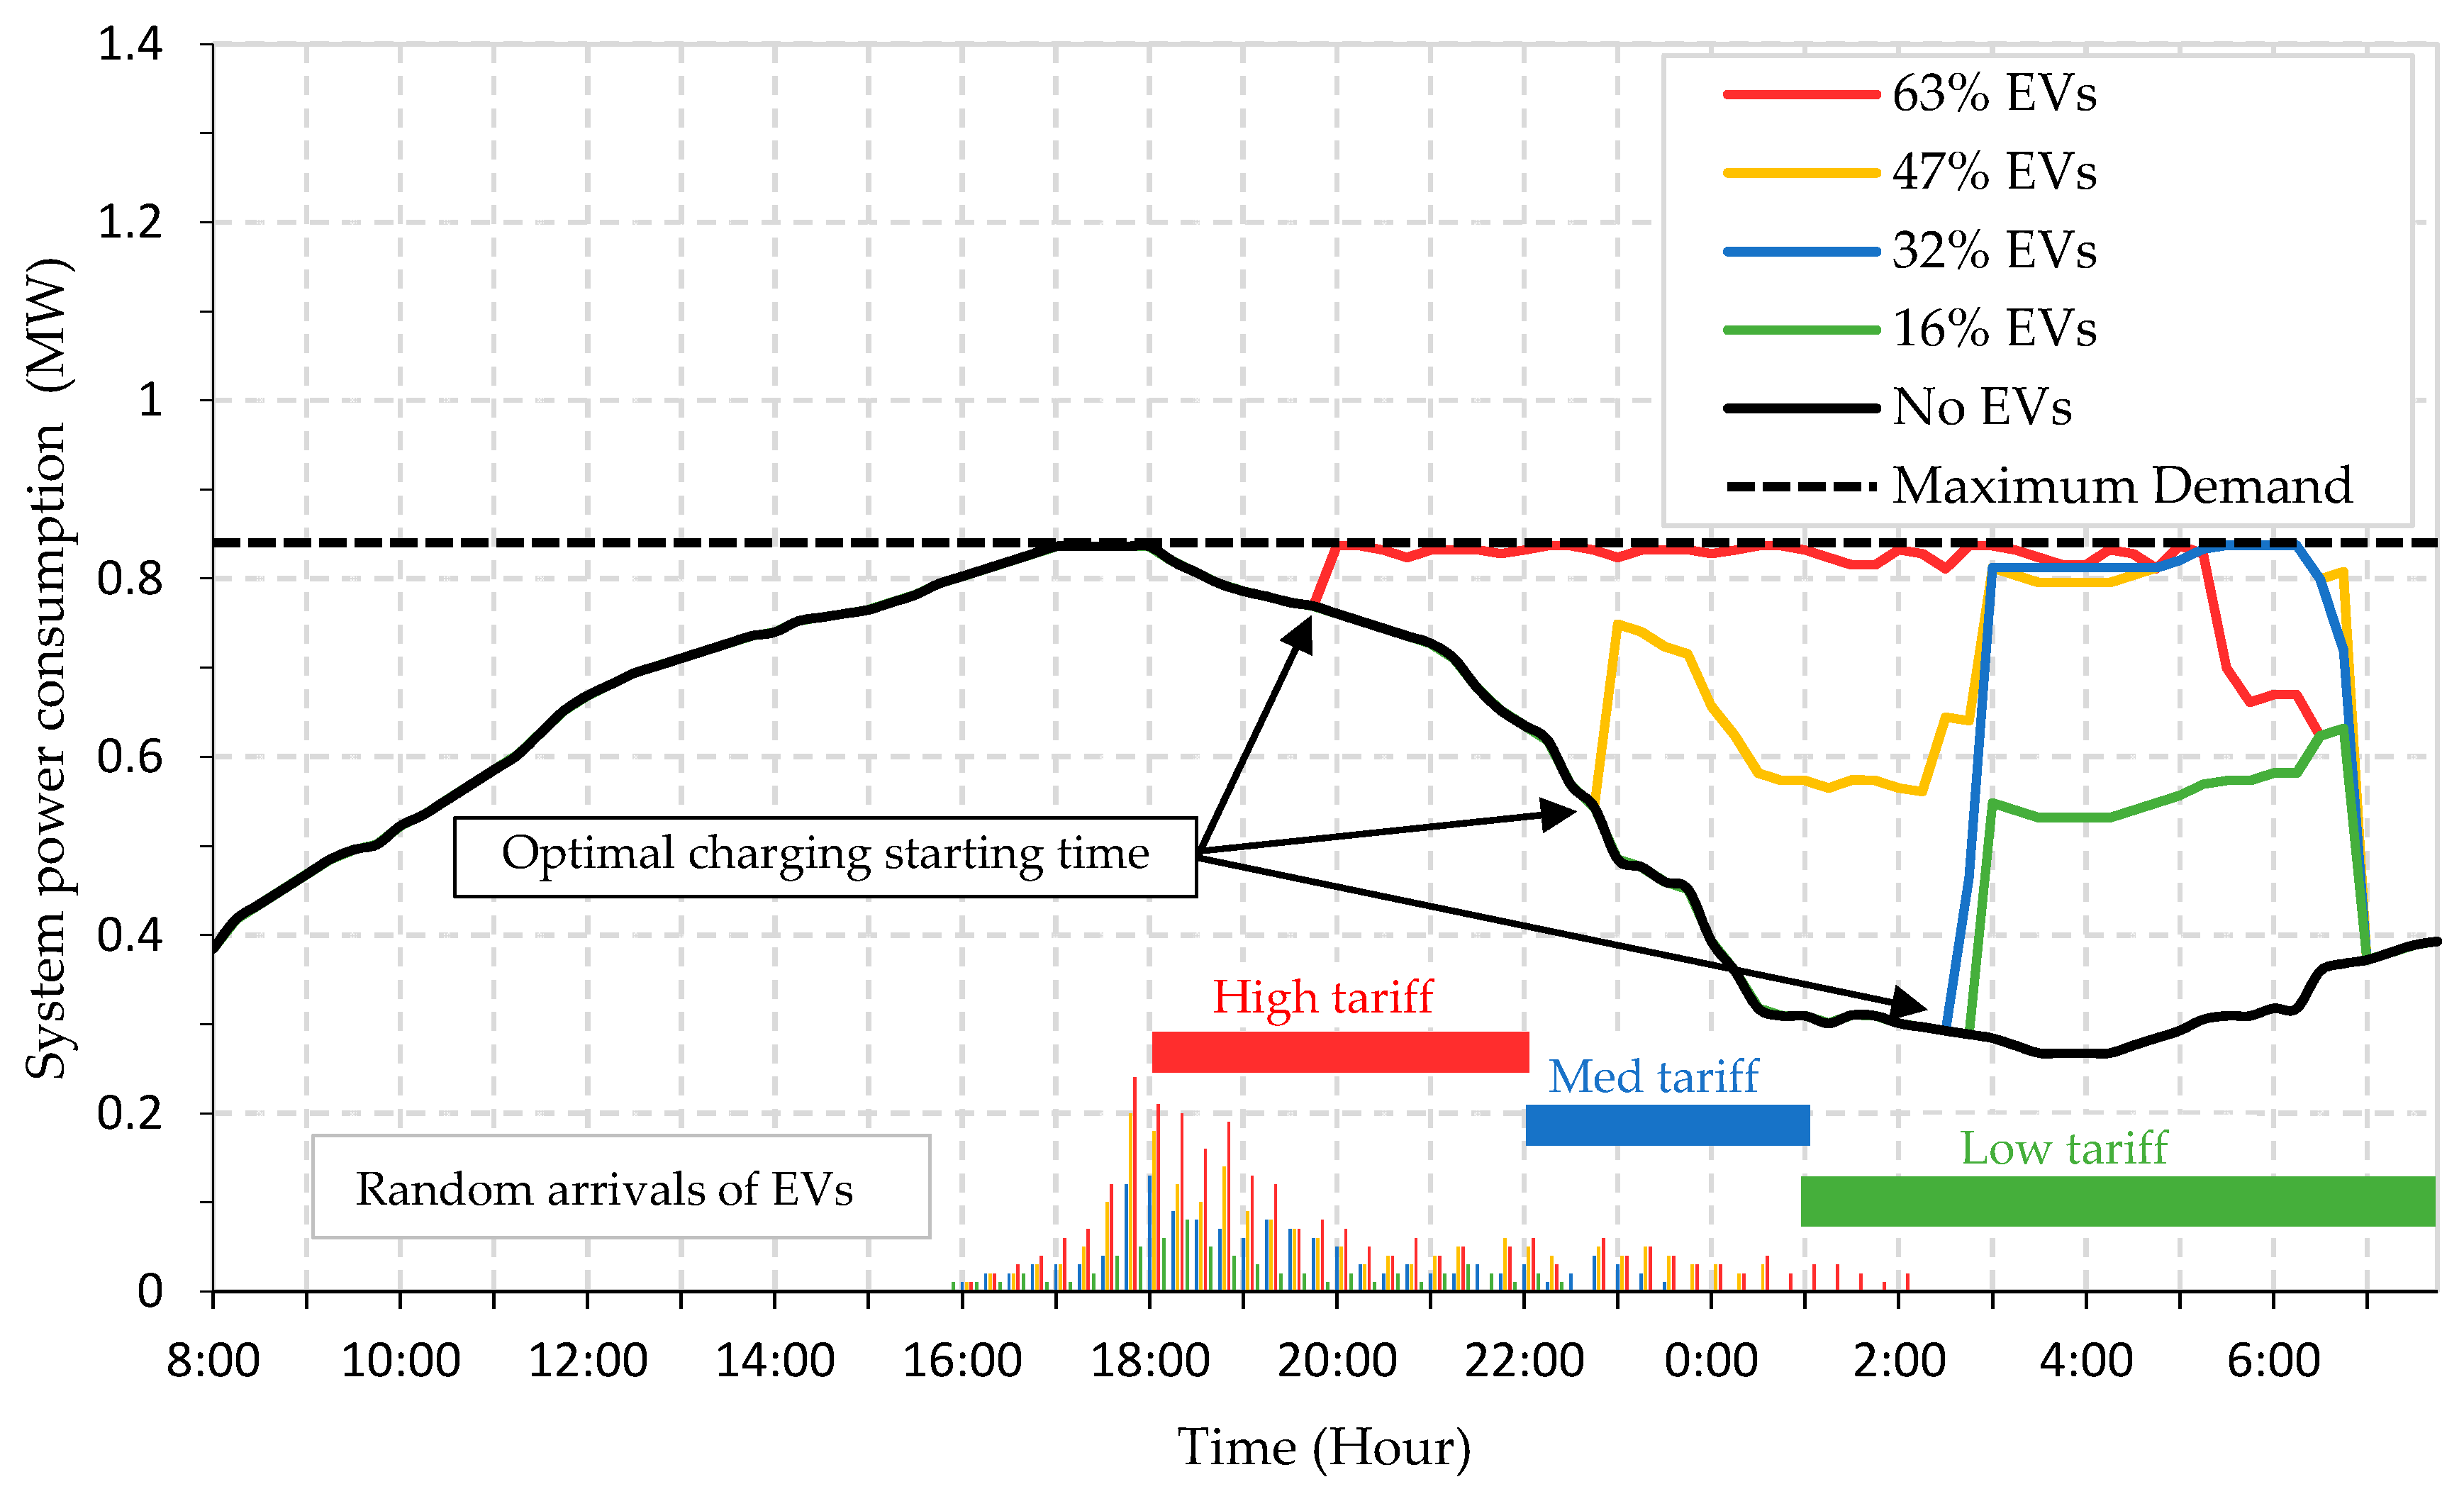
To overcome the economic aspect of the proposed algorithm, it is further modified to consider the concept of optimal charging starting time (OCST). This algorithm will shift the charging of EVs from a high-tariff zone to a low-tariff zone, considering their departure time. By doing this, a customer can save charging costs while operating in a low-tariff zone. The power consumption and optimal starting time of various penetration levels are shown in Figure 12. The proposed method improves network performance in terms of losses and voltage variations.
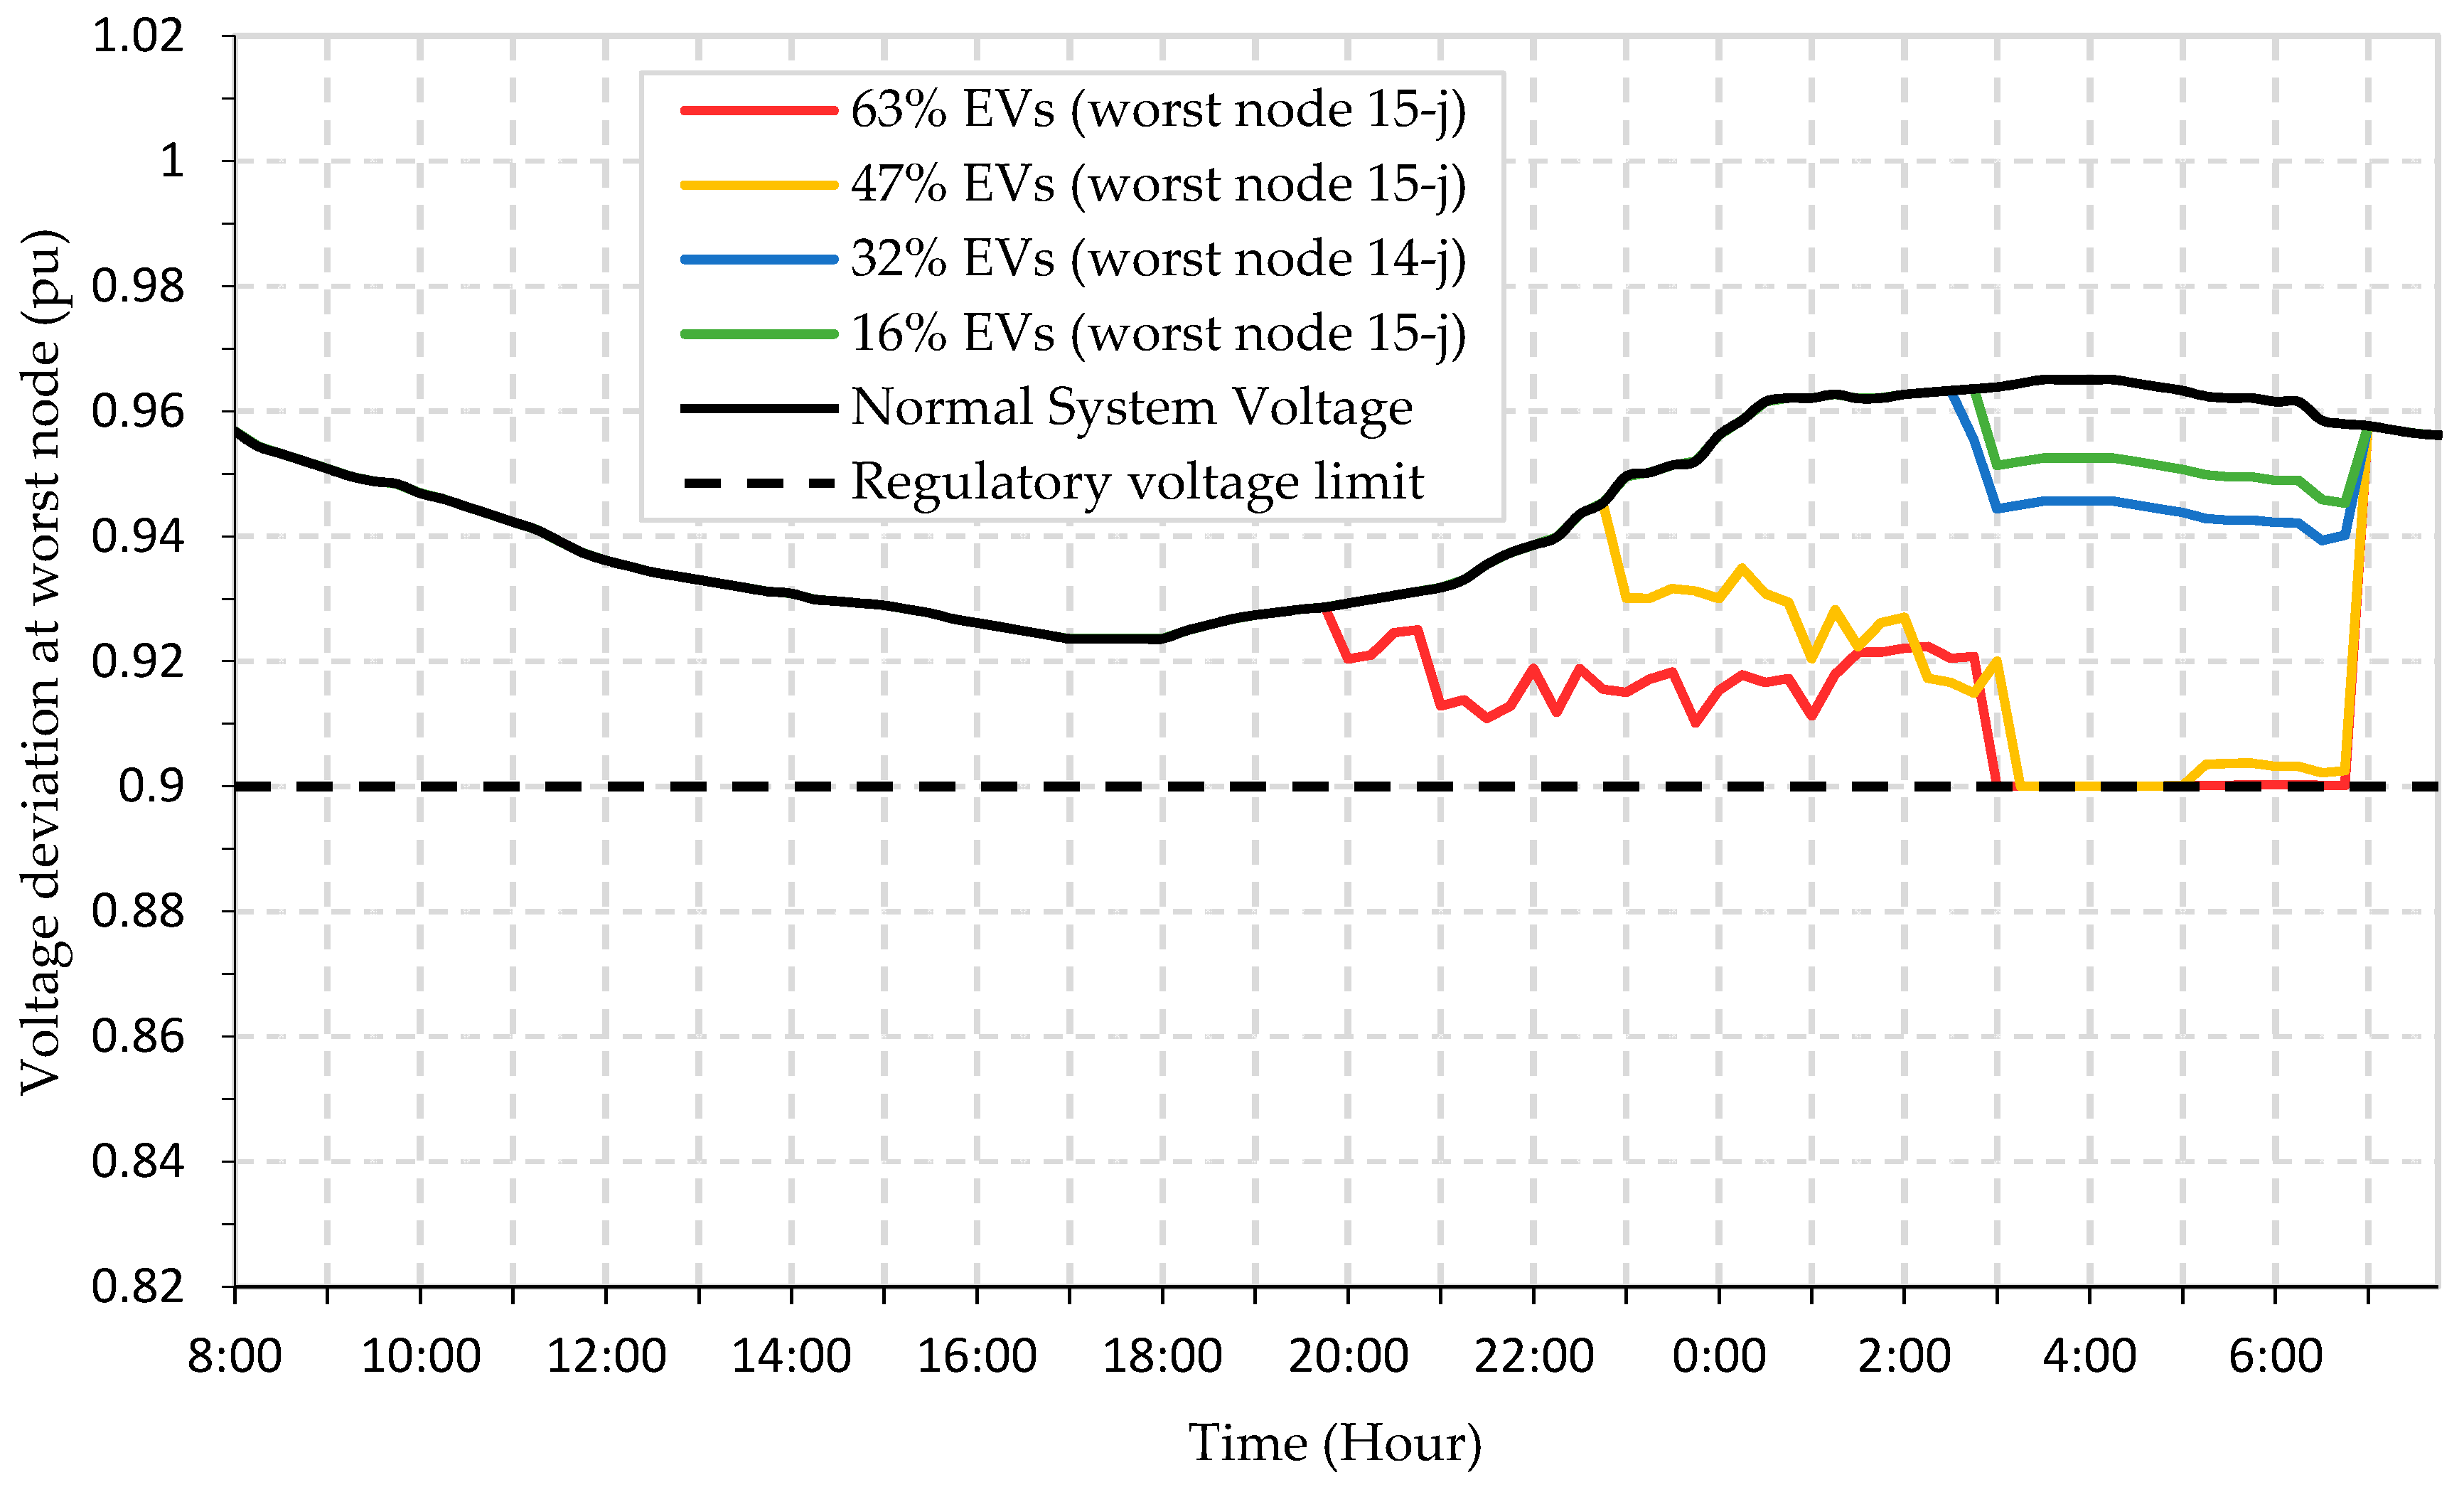
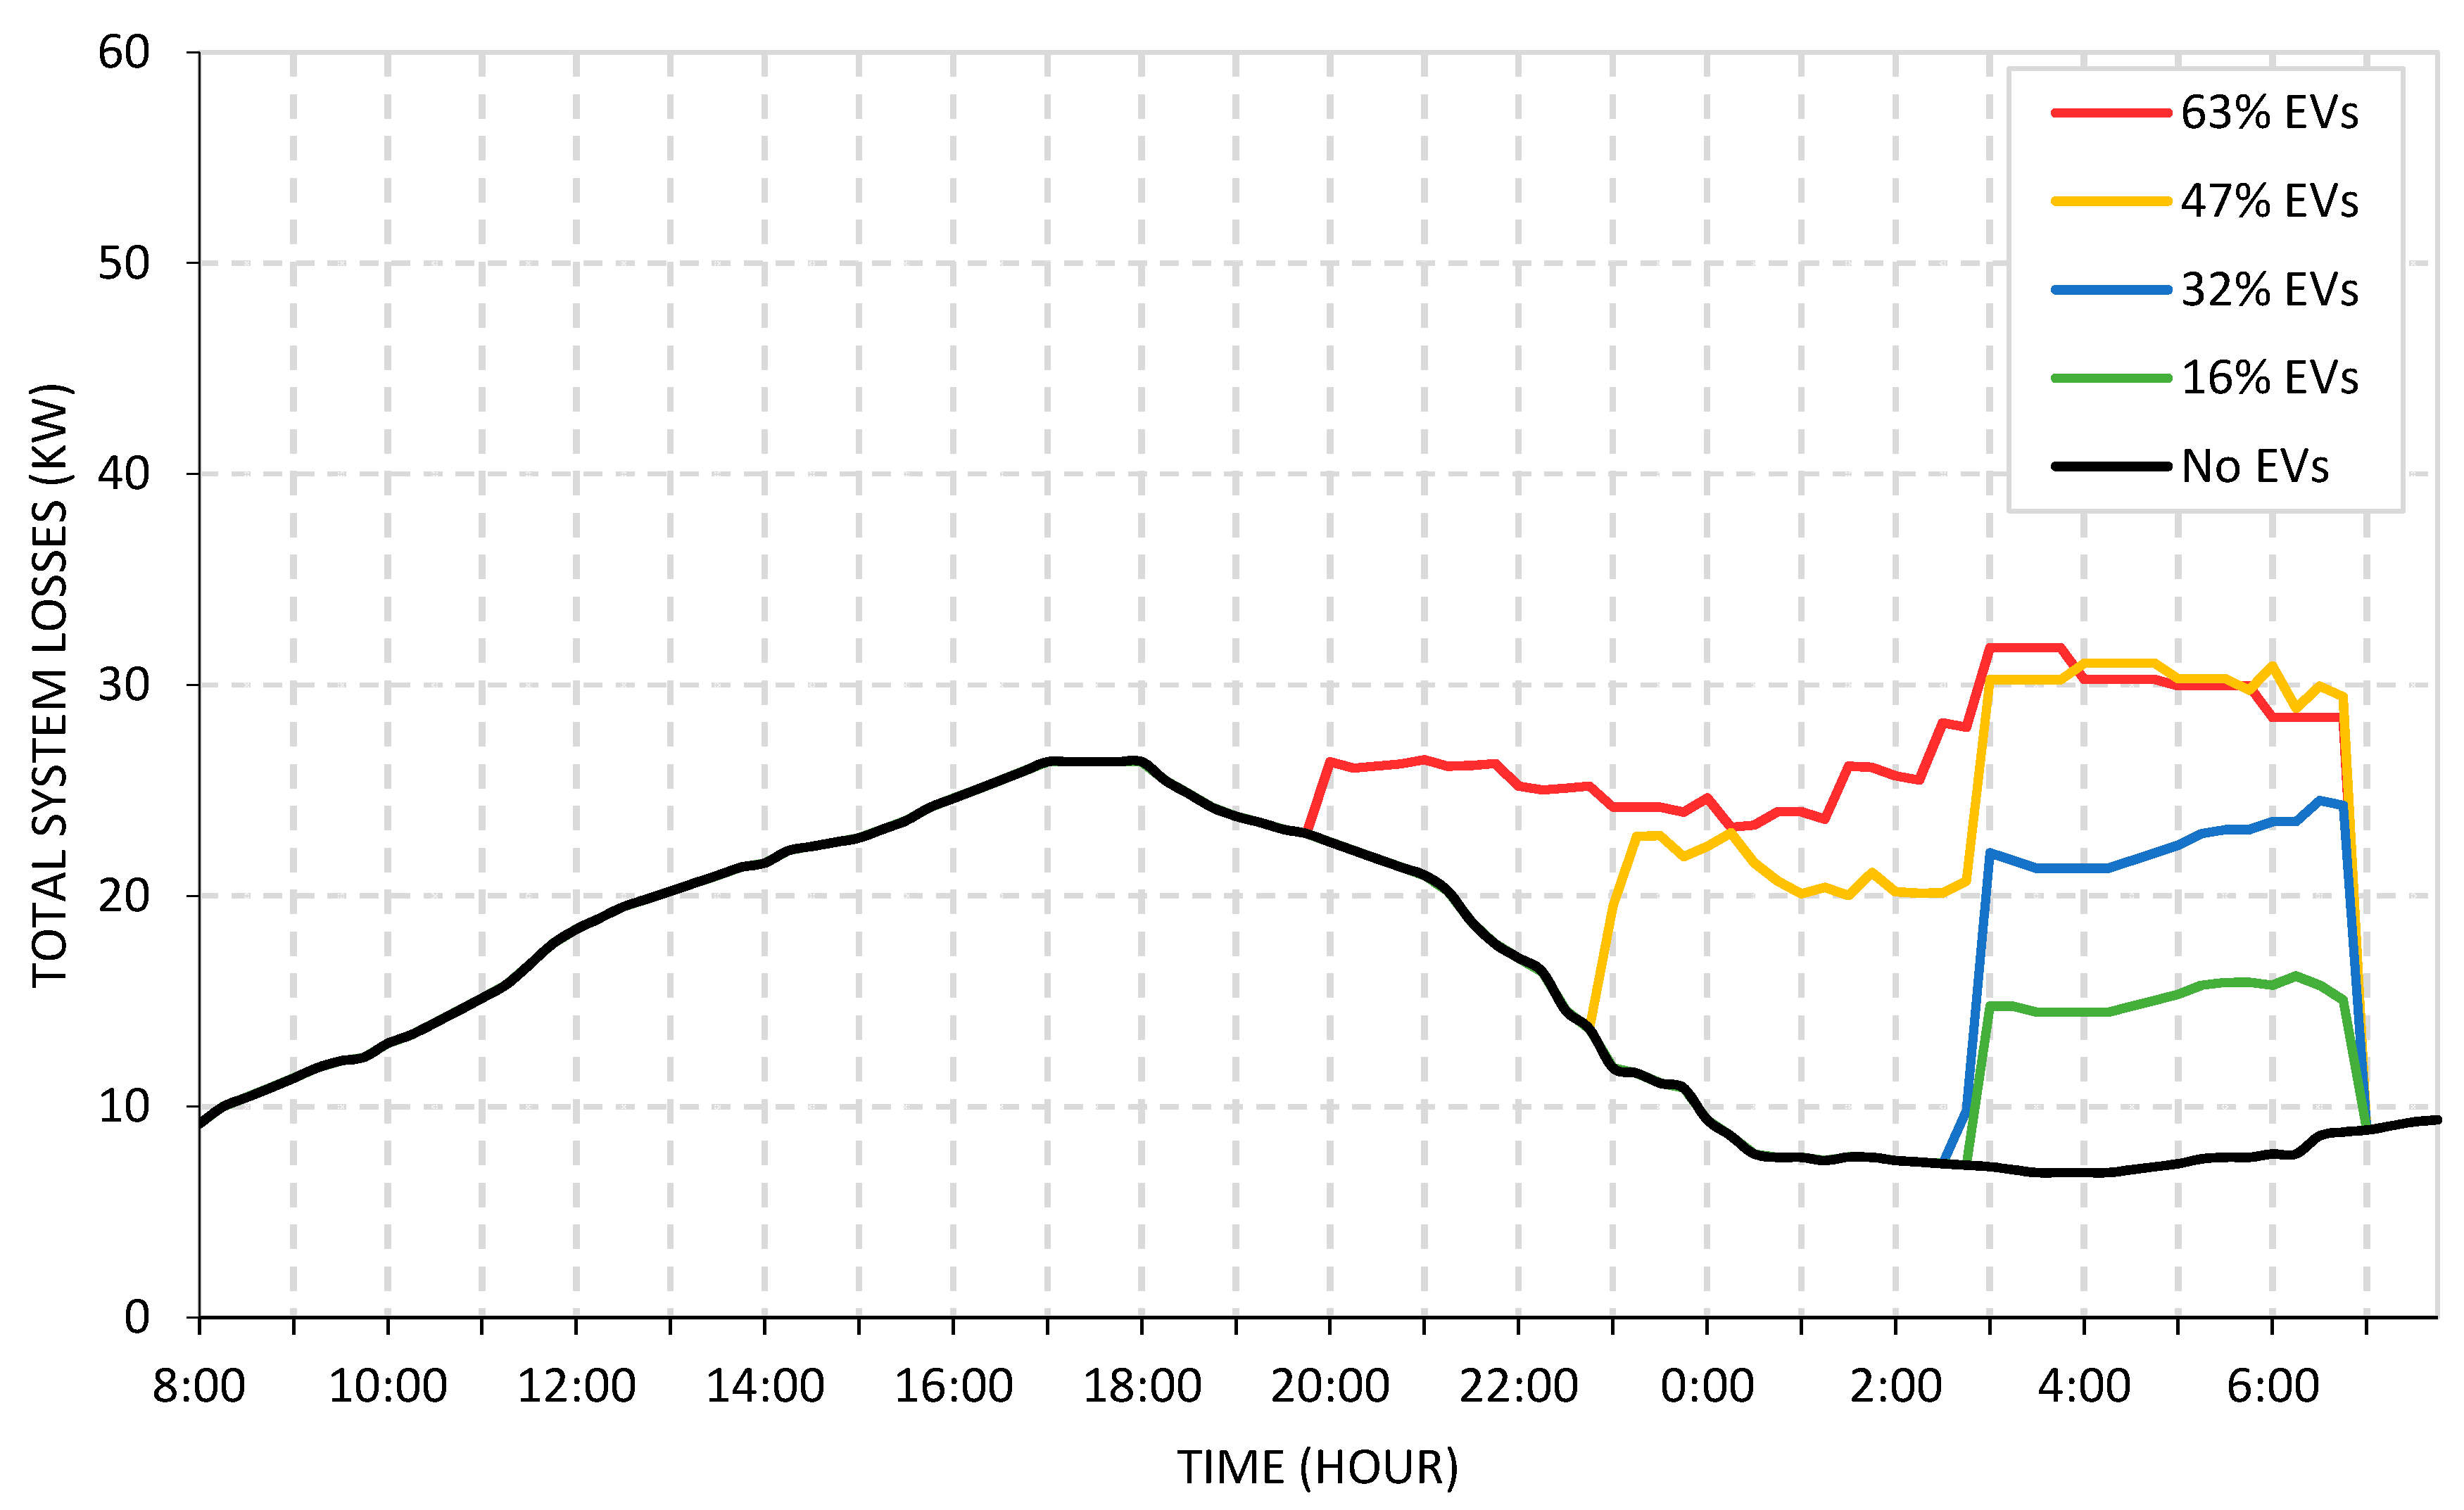
The simulation results for this case are summarized in Table 1. The results show that there is a significant improvement in all the parameters, especially for low penetration levels (e.g., 16% and 32%). For the low penetration, all the EVs have been charged during the green zone (low-tariff zone), resulting in a minimum possible cost of charging. Furthermore, it improves the system voltage profile, loading, and minimizes the power losses. To show the distinctiveness of the proposed optimal charging algorithm, the recorded results are compared with uncoordinated and coordinated charging without optimal charging starting time. For the uncoordinated (random) charging, the increment in total system losses is very high as compared to the coordinated case with OCST. There are excessive voltage drops due to uncoordinated EVs’ charging, resulting in poor power quality, especially for the far-end customers. For coordinated charging with OCST, the voltage deviation is within utility limits resulting in good power quality and customer satisfaction as shown in Figure 13. The minimum voltage for the coordinated charging is 0.9 pu which is within utility standard limits. There is a significant reduction in power system losses due to coordinated charging of EVs as shown in Figure 14. In coordinated charging without OCST, the reduction in losses is 11.24% for high penetration level (e.g., PL = 63%). This reduction is further improved due to coordinated charging with OCST, i.e., 12.13% for the same penetration level, which results in improved economy and efficiency of the power grid. Simulation results of the total reduction in power losses are summarized in Table 2.

6. Conclusions

Large-scale random integration of electric vehicles (EVs) in the distribution network for charging purpose led to degrading the network performance by increasing power losses, violating system voltage, and overloading network assets. Therefore, it is very important to smartly manage this growing charging demand on the supply network. Although there exist numerous charging strategies in the literature which offer coordinated charging to manage the charging demand from EV customers. However, within a coordinated charging framework, the determination of an optimal charging slot for the EVs participating in the charging process is very important and it is not previously outlined. Therefore, this work proposed an Optimal Charging Starting Time (OCST)-based coordinated charging algorithm in a low voltage distribution network to minimize network power losses while acknowledging network and battery constraints. In addition, the ToU tariff policy was adopted to make the charging process less expensive. The developed scheme was tested on IEEE-31 node distribution system linked with low voltage residential ladders. It was observed that compared to coordinated EV charging only, the inclusion of OCST concept further reduced the network power losses and improved system voltage profile. Since the proposed strategy encouraged the customers to charge their vehicle in a low-cost tariff zone, hence it offered more savings in EVs’ charging cost.

Author Contributions

The concept, methodology, and simulations were conceived together by M.U. and A.A.; W.U.K.T. performed result validation; M.U., H.A. and I.B., performed result analysis; A.A., M.S. (Muhammad Sajid) and A.S. completed investigation and data curation; M.U., M.S. (Mehdi Seyedmahmoudian) and A.M. have contributed to writing and reviewing of original draft; project supervision is done by S.M. and funded by A.S. All authors have read and agreed to the published version of the manuscript.

Funding

The authors would like to thank Ministry of Higher Education, Malaysia, under Large Research Grant Scheme (LRGS/1/2019/UKM/01/6/3), University of Malaya, Malaysia.

Acknowledgments

The authors would like to thank the Ministry of Higher Education, Malaysia, for the financial support under the Long-Term Research Grant Scheme (LRGS): LRGS/1/2019/UKM-UM/01/6/3.

Conflicts of Interest

This research received no external funding.

References

  1. Darabi, Z.; Ferdowsi, M. Plug-in hybrid electric vehicles: Charging load profile extraction based on transportation data. In Proceedings of the 2011 IEEE Power and Energy Society General Meeting, Detroit, MI, USA, 24–29 July 2011; Institute of Electrical and Electronics Engineers (IEEE): Piscataway, NJ, USA, 2011; pp. 1–8. [Google Scholar]
  2. Wirasingha, S.G.; Emadi, A. Pihef: Plug-in hybrid electric factor. In Proceedings of the 2009 IEEE Vehicle Power and Propulsion Conference, Dearborn, MI, USA, 7–10 September 2009; Institute of Electrical and Electronics Engineers (IEEE): Piscataway, NJ, USA, 2009; pp. 661–668. [Google Scholar]
  3. Rezaee, S.; Farjah, E.; Khorramdel, B. Probabilistic analysis of plug-in electric vehicles impact on electrical grid through homes and parking lots. IEEE Trans. Sustain. Energy 2013, 4, 1024–1033. [Google Scholar] [CrossRef]
  4. Amin, A.; Tareen, W.U.K.; Usman, M.; Ali, H.; Bari, I.; Horan, B.; Mekhilef, S.; Asif, M.; Ahmed, S.; Mahmood, A.J.S. A review of optimal charging strategy for electric vehicles under dynamic pricing schemes in the distribution charging network. Sustainability 2020, 12, 160. [Google Scholar] [CrossRef]
  5. Amin, A.; Tareen, W.U.K.; Usman, M.; Memon, K.A.; Horan, B.; Mahmood, A.; Mekhilef, S. An integrated approach to optimal charging scheduling of electric vehicles integrated with improved medium-voltage network reconfiguration for power loss minimization. Sustainability 2020, 12, 9211. [Google Scholar] [CrossRef]
  6. Masoum, A.S.; Deilami, S.; Moses, P.S.; Masoum, M.A.; Abu-Siada, A. Smart load management of plug-in electric vehicles in distribution and residential networks with charging stations for peak shaving and loss minimisation considering voltage regulation. IET Gener. Transm. Distrib. 2011, 5, 877–888. [Google Scholar] [CrossRef]
  7. Zhou, C.-B.; Qi, S.-Z.; Zhang, J.-H.; Tang, S.-Y. Potential co-benefit effect analysis of orderly charging and discharging of electric vehicles in China. Energy 2021, 226, 120352. [Google Scholar] [CrossRef]
  8. Alonso, M.; Amaris, H.; Germain, J.G.; Galan, J.M. Optimal charging scheduling of electric vehicles in smart grids by heuristic algorithms. Energies 2014, 7, 2449–2475. [Google Scholar] [CrossRef]
  9. Lyu, L.; Yang, X.; Xiang, Y.; Liu, J.; Jawad, S.; Deng, R. Exploring high-penetration electric vehicles impact on urban power grid based on voltage stability analysis. Energy 2020, 198, 117301. [Google Scholar] [CrossRef]
  10. Clement-Nyns, K.; Haesen, E.; Driesen, J. The impact of vehicle-to-grid on the distribution grid. Electr. Power Syst. Res. 2011, 81, 185–192. [Google Scholar] [CrossRef]
  11. Moghbel, M.; Masoum, M.A.; Shahnia, F.; Moses, P. Distribution transformer loading in unbalanced three-phase residential networks with random charging of plug-in electric vehicles. In Proceedings of the 22nd Australasian Universities Power Engineering Conference (AUPEC), Bali, Indonesia, 26–29 September 2012; Institute of Electrical and Electronics Engineers (IEEE): Piscataway, NJ, USA, 2012; pp. 1–6. [Google Scholar]
  12. Jarvis, R.; Moses, P. Smart grid congestion caused by plug-in electric vehicle charging. In Proceedings of the 2019 IEEE Texas Power and Energy Conference (TPEC), College Station, TX, USA, 7–8 February 2019; Institute of Electrical and Electronics Engineers (IEEE): Piscataway, NJ, USA, 2019; pp. 1–5. [Google Scholar]
  13. Oliveira, D.Q.; de Souza, A.Z.; Delboni, L.F.N. Optimal plug-in hybrid electric vehicles recharge in distribution power systems. Electr. Power Syst. Res. 2013, 98, 77–85. [Google Scholar] [CrossRef]
  14. Zhou, K.; Cheng, L.; Wen, L.; Lu, X.; Ding, T. A coordinated charging scheduling method for electric vehicles considering different charging demands. Energy 2020, 213, 118882. [Google Scholar] [CrossRef]
  15. Suyono, H.; Rahman, M.T.; Mokhlis, H.; Othman, M.; Illias, H.A.; Mohamad, H. Optimal scheduling of plug-in electric vehicle charging including time-of-use tariff to minimize cost and system stress. Energies 2019, 12, 1500. [Google Scholar] [CrossRef] [Green Version]
  16. Ma, Z.; Zou, S.; Ran, L.; Shi, X.; Hiskens, I.A. Efficient decentralized coordination of large-scale plug-in electric vehicle charging. Automatica 2016, 69, 35–47. [Google Scholar] [CrossRef]
  17. Vuelvas, J.; Ruiz, F.; Gruosso, G. A time-of-use pricing strategy for managing electric vehicle clusters. Sustain. Energy Grids Netw. 2021, 25, 100411. [Google Scholar] [CrossRef]
  18. Srithapon, C.; Ghosh, P.; Siritaratiwat, A.; Chatthaworn, R. Optimization of electric vehicle charging scheduling in urban village networks considering energy arbitrage and distribution cost. Energies 2020, 13, 349. [Google Scholar] [CrossRef] [Green Version]
  19. Wu, W.; Lin, B. Benefits of electric vehicles integrating into power grid. Energy 2021, 224, 120108. [Google Scholar] [CrossRef]
  20. Chang, G.; Chu, S.; Wang, H.L. An improved backward/forward sweep load flow algorithm for radial distribution systems. IEEE Trans. Power Syst. 2007, 22, 882–884. [Google Scholar] [CrossRef]
  21. Yao, X.; Liu, Y.; Lin, G. Evolutionary programming made faster. IEEE Trans. Evol. Comput. 1999, 3, 82–102. [Google Scholar]
  22. Sinha, N.; Chakrabarti, R.; Chattopadhyay, P.K. Evolutionary programming techniques for economic load dispatch. IEEE Trans. Evol. Comput. 2003, 7, 83–94. [Google Scholar] [CrossRef]
  23. Cao, Y.J.; Jiang, L.; Wu, Q.H. An evolutionary programming approach to mixed-variable optimization problems. Appl. Math. Model. 2000, 24, 931–942. [Google Scholar] [CrossRef]
  24. Dong, H.; He, J.; Huang, H.; Hou, W. Evolutionary programming using a mixed mutation strategy. Inf. Sci. 2007, 177, 312–327. [Google Scholar] [CrossRef] [Green Version]
  25. Deilami, S.; Masoum, A.S.; Moses, P.S.; Masoum, M.A.S. Real-time coordination of plug-in electric vehicle charging in smart grids to minimize power losses and improve voltage profile. IEEE Trans. Smart Grid 2011, 2, 456–467. [Google Scholar] [CrossRef]
  26. Divya, K.; Østergaard, J. Battery energy storage technology for power systems—An overview. Electr. Power Syst. Res. 2009, 79, 511–520. [Google Scholar] [CrossRef]
Figure 1. Flowchart of proposed coordinated EVs’ charging technique.
Energies 14 05336 g001
Figure 2. General layout of coordinated charging process for an electric vehicle.
Energies 14 05336 g002
Figure 3. The 449-node radial test system comprising of IEEE-31 bus system and 22 LV residential feeders, developed from ref [25].
Energies 14 05336 g003
Figure 4. Daily residential load curve of LV radial distribution system.
Energies 14 05336 g004
Figure 5. Selected nodes of LV feeders for EVs’ connection for different penetration levels: (A) = 16%; (B) = 32%; (C) = 47% and (D) = 63%).
Energies 14 05336 g005
Figure 6. Impact of random uncoordinated EVs’ charging within 18:00–07:00 h on system load.
Energies 14 05336 g006
Figure 7. Impact of random uncoordinated EVs’ charging within 18:00–07:00 h on system voltage.
Energies 14 05336 g007
Figure 8. Impact of random uncoordinated EVs’ charging on system power loss.
Energies 14 05336 g008
Figure 9. Impact of coordinated EVs’ charging on system power consumption.
Energies 14 05336 g009
Figure 10. Impact of coordinated EVs’ charging on voltage at worst nodes.
Energies 14 05336 g010
Figure 11. Impact of coordinated EVs’ charging on power loss of system.
Energies 14 05336 g011
Figure 12. Impact of coordinated EVs’ charging with optimal starting time on system power consumption.
Energies 14 05336 g012
Figure 13. Impact of coordinated EVs’ charging with optimal starting time on voltage at worst nodes.
Energies 14 05336 g013
Figure 14. Impact of coordinated EVs’ charging optimal starting time on power losses of system.
Energies 14 05336 g014
Table 1. A comprehensive comparison of results of all the three cases.
CaseAlgorithmEVs
(%)
Δ V
(%)
Δ l o s s
(%)
IDT,MAX
(p.u)
IST,MAX
(p.u)
Increase in Losses
(%)
07.642.770.440.096-
Uncoordinated EVs’ chargingNone168.062.880.490.1153.97
328.842.980.550.1397.58
4714.203.370.630.17121.66
6315.723.570.730.19928.88
Coordinated EVs’ charging without OCST matrixBEP167.752.810.470.0961.44
327.962.860.480.0963.25
479.923.130.480.09613.00
639.993.170.480.09614.44
Coordinated EVs’ charging considering OCST matrixProposed167.642.780.440.0960.36
327.642.800.440.0981.08
479.993.090.450.09811.55
639.993.140.530.09913.36
Table 2. A comprehensive comparison of results of all the three cases.
Evs
(%)
BEPProposed
Reduction in Losses
(%)
Reduction in Losses
(%)
162.433.47
324.036.04
477.128.31
6311.2412.13
Publisher’s Note: MDPI stays neutral with regard to jurisdictional claims in published maps and institutional affiliations.