Article

Permanent Gas Emission from the Seyakha Crater of Gas Blowout, Yamal Peninsula, Russian Arctic

by
Vasily Bogoyavlensky
1,*,
Igor Bogoyavlensky
1,
Roman Nikonov
1,
Vladimir Yakushev
2 and
Viacheslav Sevastyanov
3
1
Oil and Gas Research Institute, Russian Academy of Sciences (OGRI RAS), 3, Gubkina St., 119333 Moscow, Russia
2
Gas Production Department, Gubkin Russian State University of Oil and Gas, 65, Leninsky Prospekt, 119991 Moscow, Russia
3
Vernadsky Institute of Geochemistry and Analytical Chemistry, Russian Academy of Sciences, 19, Kosygina St., 119334 Moscow, Russia
*
Author to whom correspondence should be addressed.
Energies 2021, 14(17), 5345; https://doi.org/10.3390/en14175345
Submission received: 29 June 2021 / Revised: 9 August 2021 / Accepted: 17 August 2021 / Published: 27 August 2021
(This article belongs to the Section I1: Fuel)

Abstract

:
The article is devoted to the four-year (2017–2020) monitoring of gas emissions from the bottom of the Seyakha Crater, located in the central part of the Yamal Peninsula (north of Western Siberia). The crater was formed on 28 June 2017 due to a powerful blowout, self-ignition and explosion of gas (mainly methane) at the site of a heaving mound in the river channel. On the basis of a comprehensive analysis of expeditionary geological and geophysical data (a set of geophysical equipment, including echo sounders and GPR was used) and remote sensing data (from space and with the use of UAVs), the continuing nature of the gas emissions from the bottom of the crater was proven. It was revealed that the area of gas seeps in 2019 and 2020 increased by about 10 times compared to 2017 and 2018. Gas in the cryolithosphere of the Arctic exists in free and hydrated states, has a predominantly methane composition, whereas this methane is of a biochemical, thermogenic and/or mixed type. It was concluded that the cryolithosphere of Yamal has a high level of gas saturation and is an almost inexhaustible unconventional source of energy resources for the serving of local needs.

1. Introduction

In recent decades, studies of the near-surface gas content (shallow gas—depth of few hundred meters) in the land and offshore areas of the Arctic, as well as gas emissions into the hydrosphere and atmosphere [1,2,3,4,5,6,7,8,9,10,11,12,13,14,15,16,17,18,19,20,21,22,23,24,25,26,27,28,29,30,31,32,33,34,35,36,37,38,39,40,41,42,43,44,45,46,47,48,49,50,51,52,53,54,55,56] have been actively developing. This emission is caused mainly by the climate warming in the postglacial period (the last 15,000 years), having the strongest influence on the Arctic and leading to the degradation of permafrost (PF) [7,18,22,43,44,46,51,57,58]. At the same time, large volumes of gas (mainly methane) are released from or contained within the PF strata, as well as being found under it in a free or hydrated state [3,5,6,7,8,9,10,12,22,27,28,31,38,41,42,43,44,45,46,47,48,49,50,51,52,53,54,55,56,59]. Furthermore, near-surface gas pools pose threats for the drilling of oil and gas prospecting wells—blowouts and fires often lead to the wreckage of drilling rigs and the deaths of personnel [4,5,6,8,9,15,16,17,18,23,34,39,60,61,62]. In addition, the volumes of gas emitted during these blowouts indicate the need to account for a new unconventional potential source of energy for the Arctic territories and offshore areas—near-surface intrapermafrost natural gas pools [11,52]. Their resources can help in the development of hard-to-reach Arctic territories.
The reserves of near-surface free gas pools can contain tens or hundreds of millions, or sometimes even billions, of cubic meters of gas, which can be of significant commercial interest for their development [1,11,16,17,52,62,63,64]. In particular, in 2005 in the northern part of the North Sea in a homogeneous highly porous (on average 33%) Pleistocene sand reservoir at a depth of 210 mbsf (580–594 mbsl), the Peon dry gas field was discovered, with recoverable gas reserves of 27.1 billion m3 [63]. On the Dutch North Sea shelf, more than 150 potentially gas-bearing areas have been identified in poorly consolidated Cenozoic sediments (Miocene-Pleistocene, depths 300–800 m from the bottom) [64]. As a result of drilling, eight dry gas fields were discovered (with a biogenic methane content of more than 99%), with four of them already undergoing commercial production since 2007 [64].
As a result of the CDP seismic data analysis in the Laptev, Bering, Okhotsk, Chukchi and Beaufort seas, 1727 anomalous objects potentially associated with gas saturation of near-bottom deposits were identified along seismic lines, with a total length of about 28,000 km (on average every 16.2 km) [17,21,22]. It has been specified that in the Arctic seas, 75–82% of the uppermost potential gas pools are located at depths of less than 200 m from the bottom [17,21,22]. In addition, near-surface deposits with subaqueous PF have large gas resources in the hydrated state [12,17,21,22,40].
In 2014–2021 the attention of the scientific community was attracted by powerful blowouts, self-ignition and explosions of gas in the north of Western Siberia, which resulted in the formation of giant craters [5,6,8,9,10,13,14,15,16,17,18,19,20,23,24,26,29,30,32,33,35,36,41,42,43,47]. Almost all experts in the field of earth sciences have recognized these events as a new phenomenon in the Russian Arctic, the genesis of which requires serious investigation. There is particular interest in the craters due to the fact that they are located in the South Kara region, which unique in terms of its volume of hydrocarbon (HC) resources and reserves, and which thus has global importance in relation to worldwide energy supplies [65,66,67].
The first and most well-known crater was discovered in 2014 in the central part of the Yamal Peninsula, 30 km south of the Bovanenkovskoye HC field (Figure 1) [8,9,10,41,42]. In the “Arctic and World Ocean” geoinformation system (“AWO” GIS) created by the Oil and Gas Research Institute of the Russian Academy of Sciences (OGRI RAS), it was assigned with the C1 designation [8,9,10]. Afterwards, the scientific community became aware of several other similar craters, including the C2 crater 10 km to the south of the Bovanenkovskoye field (20 km north from the C1 crater) [9,10,16,23]. As of the beginning of 2021, the total number of discovered craters is around 20. According to remote sensing (RS) data, it was determined that before the explosions, there were perennial heaving mounds—pingo-like features (PLFs)—in their places, similar to the pingos, known in the north of Canada and Alaska (in Russia, they are called bulgunnyakhs) [8,9,10,68].
Classic models of pingo formation are based on cryogenic heaving mechanisms due to the formation of an ice core in open and closed systems over tens or even hundreds of years [68]. After many years of growth, pingos can be destroyed, usually by the melting of ice under the influence of solar energy. Powerful blowouts and explosions of gas with the scattering of frozen soil and ice pieces to distances up to 300–400 m (and even up to 900 m) were actually unknown and/or unexplored until 2014. Many experts have admitted that such powerful explosions are caused by gas-dynamic processes inside the heaving mounds—PLFs [6,8,9,10,13,14,15,16,19,20,21,24,26,29,30,32,33,35,36,41,42,43,47,50,55].
Explanations of the genesis of PLFs are given mainly on the basis of various modifications of the classic pingo formation model, in which gas can be squeezed out (extruded) from the freezing soil into its central part, with an ice core formed under the influence of exogenous processes [26,29,30,32,33,35,36,41,42,43,50]. It is worth noting that the formation of such gas accumulations was described in 1959 and 1989 [52,69]. Therefore, almost all of these models are based on a number of early publications [39,52,68,69].
In 2014–2021 we published a number of papers substantiating the formation of gas-filled cavities of endogenous genesis in large bodies of ground ice [8,9,10,13,14,15,16,18,19,20,23,24]. Actually, this phenomenon can be described as the formation of a new type of gas pools with anomalously high reservoir pressures in the cryosphere at depths of several tens of meters. At the same time, PLFs appear on the earth’s surface, growing due to the gas dynamic effect until the critical pressure is exceeded, leading to the rupture of the PF layer and the pneumatic release (blowout) of gas. The available data allow us to speak about many cases of self-ignition and explosion of gas, the main explanation of which is electrification and electrostatic discharges [13,14,15,16,18,19,20,23,24]. In addition, the presence of gas-filled chambers (cavities/voids) in the PF is confirmed by the known drilling tool failures during well construction [39].
The abovementioned information indicates the high level of gas content in near-surface deposits on the Arctic land and on the adjacent shelf with similar geological conditions [1,2,3,4,5,6,27,28]. Due to the wide distribution of gas pools in free and/or hydrated states in the near-surface PF conditions, in total they contain huge energy potential.
On 28 June 2017, a powerful blowout, self-ignition and explosion of gas occurred with the formation of a giant Seyakha Crater (C11 in the GIS “AWO” database) [13,14,19,20,23,35]. A peculiarity of the Seyakha gas blowout was that it occurred after the explosion of a mound that grew in the period from 2013 to 2017, and blocked the channel of the Myudriyakha River. It was witnessed by representatives of the indigenous population, who stated that a gas fountain with a height of about 4 m had been burning for 1–1.5 h. At the site of the blowout a giant crater was formed, which was quickly flooded by river water (Figure 2).
In 2017–2020, we carried out a wide range of geological and geophysical studies of the Seyakha object (C11), the results of which were published in [13,14,19,20]. In addition, a wide range of studies of RS data obtained from space, as well as using unmanned aerial vehicles (UAVs), was carried out [13,14,19,20,23,35].
The aims of this study were to monitor the process of gas emissions from the bottom of the Seyakha Crater in the period 2017–2020, to analyze the genesis and composition of the gas and the possibility of its use as a source of unconventional energy.

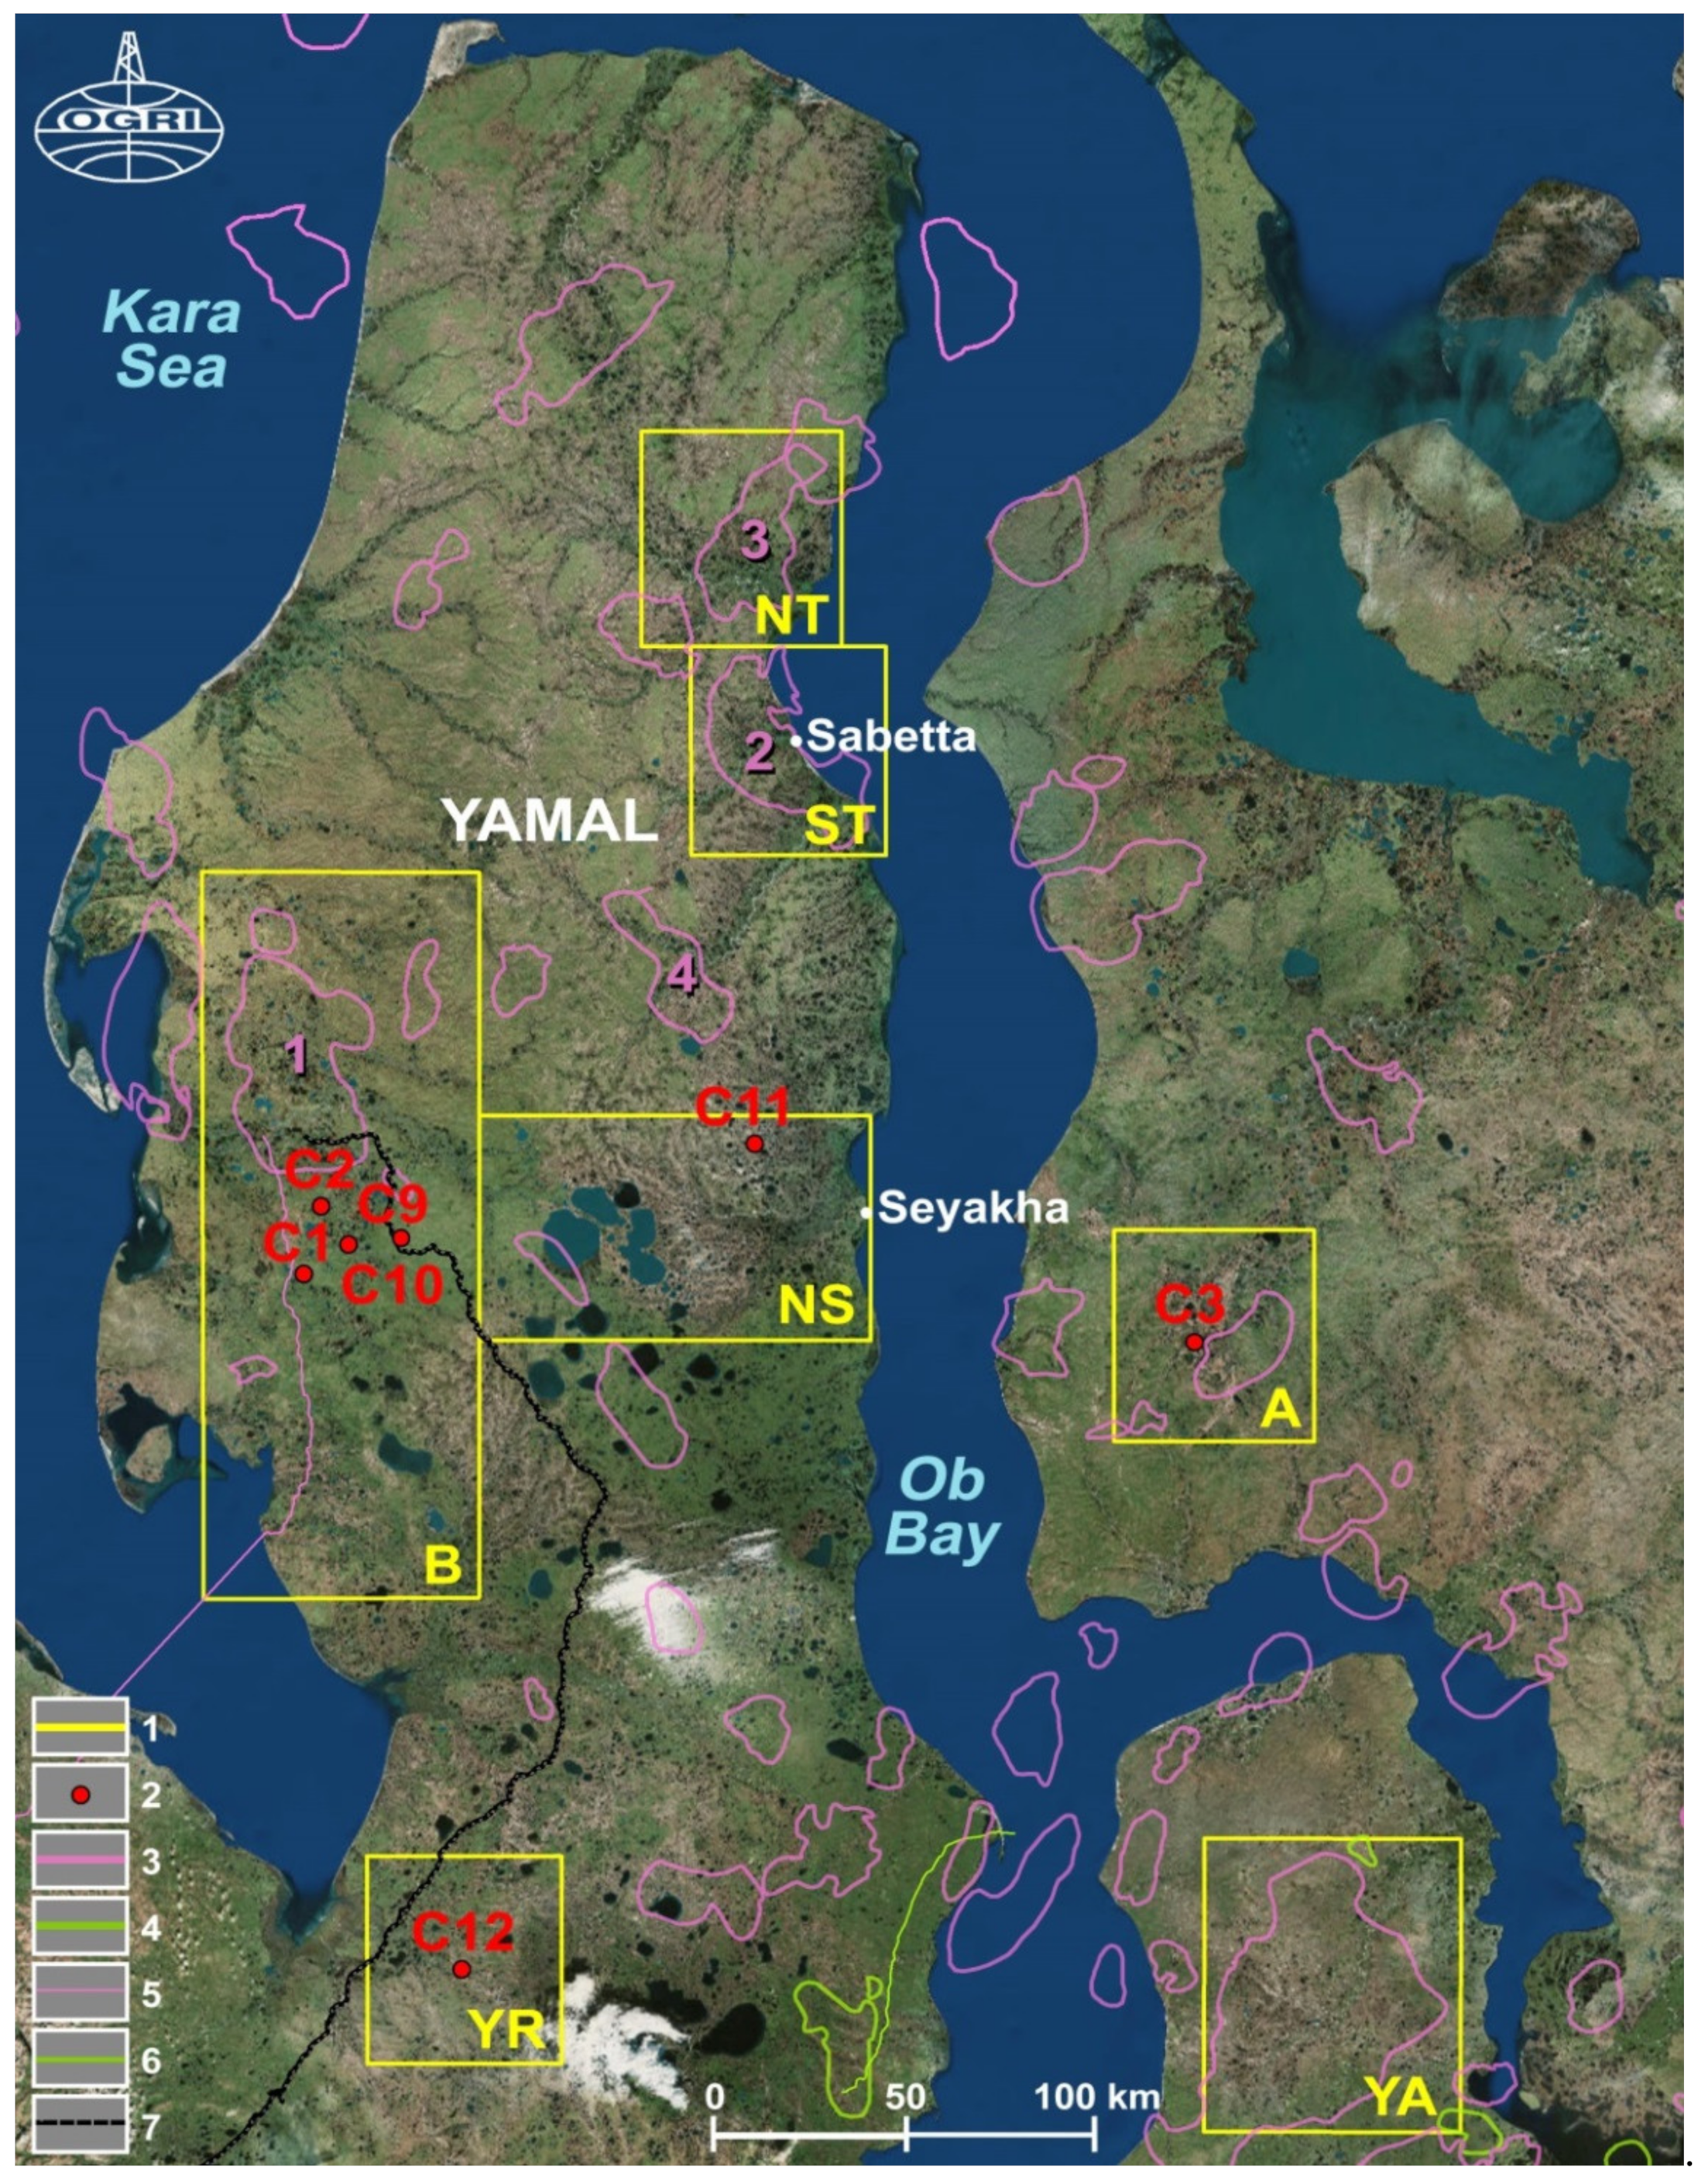
2. Description of the Study Region

Seyakha Crater C11 (coordinates 70.302° N, 71.746° E) is located in the South Kara region in the central part of the Yamal Peninsula in the north of Western Siberia (Figure 1). Gydan and Tazovsky peninsulas and the Kara Sea, with the Ob and Taz bays, are located nearby. During the Soviet era, a number of giant gas fields were discovered in the South Kara region, including the Urengoyskoye, Yamburgskoye, Bovanenkovskoye, Rusanovskoye and Leningradskoye fields, which are included in the list of the largest gas fields in the world. In the last two decades, more than ten new large fields have been discovered on the Kara Sea shelf (Kamennomysskoye-Sea, Severo-Obskoye and others). The main HC pools are confined to the Jurassic-Cretaceous complex of clastic deposits. At the same time, large pools of dry gas (reserves of many tens and hundreds of billion cubic meters) have been discovered in a number of fields at shallow depths (500–900 mbsf) in a regionally gas-bearing highly porous (up to 30–38%) poorly cemented sandstone reservoir of the Cenomanian age (100–700 m thick) [1,9,27,28,54,65,66,67].
Twenty-five HC fields (mainly gas) have been discovered on the Yamal Peninsula, including the two fields with unique gas reserves currently being developed: Bovanenkovskoye (4.9 trillion m3) and Yuzhno-Tambeyskoye (1.3 trillion m3) [65,66,67].
The Yamal Peninsula’s surface is flat with a height varying from 0 to 80–95 m [70]. There is a dense river network on this surface, and the rivers’ flow is oriented mainly in the western and eastern directions to the Kara Sea and the Ob Bay. The territory is very swampy, with widespread thermokarst lakes. The PF thickness varies from 50–150 m in the coastal zones to 300–400 m in the central parts. Ground ice with a registered maximum thickness of up to 30 m and an area of up to 10 km2 is widespread [6,23,27,28]. In the near-surface sandy reservoirs in the PF, there are cryopegs with water salinity up to 20–100 g/L (PF temperature down to –6 °C) [70]. Taliks are widespread under large lakes and rivers, including through taliks under the Ob Bay and large completely non-freezing lakes such as Neito-Malto, Yarroto, etc., “related to zones of large faults” [70].
During the drilling of a number of wells on the Bovanenkovskoye and other HC fields of the South Kara region, the PF often appeared to have a high level of gas saturation in near-surface deposits and frequent gas blowouts were reported [4,5,6,27,28,30,31,48,49,52,53,54,62]. On the Bovanenkovskoye field, PF gas has been shown to be present from depths of 15–220 m (80% from the Poluysk-Salekhard sandy and sandy-loamy Quaternary deposits—mQ1-2). In 40% of cases, gas flow rates exceeded 1000 m3 per day, and the maximum was 14,000 m3 per day [9,27,28,31,53,55]. The main reason for gas blowouts is the fact that the wells can penetrate the gas-bearing near-surface deposits [4,52,53,54,55,56].
Based on the authors’ comprehensive studies in 2014–2020, including the RS data analysis, 7185 PLFs and 1860 zones of active degassing with craters of gas blowouts at the bottoms of 1667 thermokarst lakes, two bays and four rivers were found on the Yamal Peninsula [18]. An unambiguous regional relation was established between the identified degassing zones and areas of increased methane concentration in the atmosphere, recorded by the TROPOMI spectrometer [18]. As a result, it was determined that the eastern part of the Yamal Peninsula is characterized by an increased gas explosion hazard. The most gas-explosive zones are the South-Tambey and Seyakha areas [18].
Locally, the Seyakha Crater C11 is located in the distance of 33 km northwest from the Seyakha village, 25 km to the west of the coast of Ob Bay and within 40 km southeast of the West Seyakhinskoye gas condensate field (Figure 1) [13,14,19,20,23,35]. In the area of 1.7 × 3.0 km with the C11 object in the center (Figure 2), the valley of the Myudriyakha River and a number of thermokarst lakes are situated. The largest of them, which we name Severo-Seyakhinsoye (since no official name has been found), is located 660 m northwest from the crater and has a diameter of about 860 m and area of about 630,000 m2.
The altitudes of the terrain in the area of the research, determined based on the ground measurements using the GPS receiver and data from the digital elevation model (DEM) ArcticDEM [71], vary from 4 to 16 m AMSL (Figure 2).
The first expedition to the Seyakha Crater C11 was carried out on 2 July 2017—four days after the explosion [13]. During the analysis of the situation at the research site, a high water level in the Myudriyakha River was detected, corresponding to the spring flood (Figure 3A). A huge amount of fragments of frozen sandy loam soil and ground ice ejected by the explosion was observed around the crater (Figure 3B). The maximum distance of the ejected pieces from the crater reached 360 m.

3. Materials and Methods

3.1. Remote Sensing (RS) Data Analysis from Space, including the Digital Elevation Model (DEM) ArcticDEM

Space images in the optical frequency range from polar-orbiting WorldView (WV) satellites, including WV-1, WV-2 and WV-3 (DigitalGlobe, Westminster, CO, USA) and the Russian satellite Resurs-P No.1 (SC Roskosmos) were used. These images with a high resolution (up to 0.5 m) also allowed us to determine gas seep zones, because gas bubbles change the light reflectance coefficient (albedo). In this situation, albedo tends to be 1, as for snow [13]. It is also possible to see gas blowout craters (pockmarks) on the bottoms of shallow rivers and lakes on these images [18].
ArcticDEM is a National Geospatial Intelligence Agency and National Science Foundation (NGA-NSF) initiative to create and share a high-resolution DEM of the Arctic zone (up to 2 m) using optical stereo imagery processed with photogrammetry software [71]. This DEM was used with correction by means of the ground GPS measurements and available maps due to its significant vertical displacements.

3.2. RS with the Use of the Russian Helicopter MI-8 and the Unmanned Aerial Vehicle (UAV) “DJI Mavic Pro”

An MI-8 helicopter was used in 2014–2020 for the regional search of degassing objects with photo and video capturing and the determination of coordinates via GPS. The first expedition to the studied object C11 using helicopters was organized to occur on 2 July 2017—four days after notification of the explosion from local residents.
The UAV drone “DJI Mavic Pro” (DJI, Shenzhen, China) has a high-resolution 12.3 MPixel Ultra HD “Mavic Pro” camera with a stabilizer. It has a small weight (ca. 800 g), can fly at speeds of up to 65 km/h and can cover distances up to 13 km at a height of up to 500 m. GPS and GLONASS satellites were used for navigation. For photogrammetric processing and further DEM construction, Pix4Dmapper (Pix4D SA, Switzerland, Prilly) and Agisoft Metashape (Geoscan, Russia, Saint-Petersburg) [72] software were used. The heights from which the photos were taken ranged from 15 to 400 m. The series of the photos from the UAV used in the photogrammetric processing step were taken from a height of 70 m with 70° of camera inclination relative to the earth’s surface.

3.3. Geophysical Studies on Land and Water Areas: Echo Sounding and Ground Penetrating Radar (GPR) Survey

The “Deeper Smart Sonar Pro+” (“Deeper”) and “Garmin Striker Plus 7cv” echo sounders were used in the study. “Deeper” is a small portable wireless echo sounder. Its depth measuring range is from 0.5 to 80 m. Garmin Striker Plus 7cv is a bigger, boat-mounted echo sounder. Echo sounding was used for determining the depth of the water area, as well as for studying bottom degassing. On acoustic echograms, gas bubbles rising in water, called gas flares, are usually clearly visible [2,14,20,22,34]. Apart from echo sounding, depth measurements were conducted from two inflatable boats “Lotsman”, using a rope with a load on its end.
In 2018–2019 the ground penetrating radar (GPR) survey was conducted for radial and circular lines within the water area and also on the land near the C11 crater. The GPR “Oko-3”, developed by Geotekh Company, was used in the study [73]. It is a relatively small GPR which can reach a maximum depth of 12–20 m from the solid ground. The GPR survey was based on the generation of electromagnetic waves using an antenna and recording the reflection waves from boundaries between layers with different dielectric permittivity (two-way travel times of reflected waves from the antenna to subsurface reflecting horizons). GPR has been successfully implemented during engineering studies in zones with PF distribution [74]. During the study of Seyakha Crater C11 the “Oko-3” GPR was placed in the bottom of the rubber boat for surveying of the lake and the river [20].

3.4. Gas Sampling and Geochemical Analysis

Sampling was carried out from a rubber boat at the locations of the seeps where gas escapes the bottom of the crater and enters the water column and, further, enters the atmosphere. Due to the direct escape of gas through the water surface, the gas sampling procedure was as follows. A plastic bottle (500 cm3), filled with water at the place of the gas intake, was submerged in the water upside down. Gas bubbles penetrated the inside of the bottle through the open neck. When the bottle was filled with gas to 2/3 of its volume, it was closed under the surface of the water with a screw cap. Gas samples were stored and transported with the bottoms of the bottles kept upwards, and their tightness was additionally ensured by a layer of water.
Gas sample analysis was conducted in one of the major Institutes of the Russian Academy of Sciences—the Vernadsky Institute of Geochemistry and Analytical Chemistry. The molecular composition of the sampled gas was calculated on a Clarus 500 gas chromatograph (PerkinElmer, Waltham, MA, USA) with an HP-PLOT/Q capillary column (Agilent J&W: 30 m × 0.53 mm × 40 μm) and a flame ionization detector. The carrier gas used was helium 6.0 with a flow rate of 10 mL/min. The injector temperature was 220 °C with a heating isotherm of 80 °C for 1 min, and then programmed heating to 200 °C with the velocity of 10°C/min took place.
A Crystallux-4000M (Russia, RPC “Meta-chrome” and “Biomashpribor” [75]) gas chromatograph with two thermal conductivity detectors (TCD) was also used. The injector temperature was 220 °C. The O2 and N2 analysis was performed with the use of a Ca A 60–80 mesh molecular sieve packed column (TCD-1, injector-1). The column temperature was 40 °C. The carrier gas used was helium 6.0 with a flow rate of 30 mL/min.
The CH4 and CO2 analysis was carried out with the use of capillary column HP-PLOT/Q (Agilent J&W: 30 m × 0.53 mm × 40 μm—TCD-2, injector-2). The column temperature was 40 °C. The carrier gas used was helium 6.0 with a flow rate of 30 mL/min.
The chromatograph calibration was carried out with the use of a standard gas mixture (by JSC Fossen M I E).
To measure the δ13C signature in methane, a Delta Plus mass spectrometer (Thermo Finnigan, Bremen, Germany) connected via a Combustion III interface unit to an HP 6890 gas chromatograph (Agilent, Santa Clara, CA, USA) with an Agilent PoraPLOT Q capillary column (Chrompack: 25 m × 0.32 mm) was used. The carrier gas used was helium 6.0 with a flow rate of 2 mL/min. The injector temperature was 40 °C. The chemical compounds, divided by capillary columns, fell into the oxidizing reactor with oxidized Cu, Ni wires and Pt wire and, at a temperature of 940 °C, were converted into simple gases CO2, N2, nitrous oxide and H2O. After this, nitrous oxide was reduced in the reducer at a temperature of 600 °C on the copper wire. The water was removed through a Nafion semipermeable membrane. Through the interface (open split) the gases fell into the ion source of a mass-spectrometer. The ions were separated by mass/charge in the magnetic field of the analyzer and were then registered by one of three Faraday cylinders, tuned according to the different masses. For example, for CO2+ ions, the isotopes with masses m/z 44, 45, 46 were registered. Using the ion current values, the isotopic composition of carbon in CO2 was counted. The advantage of this unit lies in the possibility of determining the isotopic compositions of gas elements in every component of the complex mixture.
The unit was calibrated in the GC-C-IRMS configuration (gas chromatography and mass-spectrometer of isotopic ratios) on the working standard of CO2 with the carbon isotopic composition δ13CVPDB = −49.98 ± 0.08‰, certified according to international gas standard CO2 TEX-843C with δ13CVPDB = −40.79 ± 0.01‰.
Before the analysis, the unit was conditioned with standard CO2 by multiple gas inlet into the mass spectrometer until the reproducibility of isotopic ratios became 0.05–0.10‰. Then the isotopic analysis was carried out. This was accomplished by means of impulse inflows of standard gas into the mass spectrometer right before the analytic peak. The isotopic composition of gases in the sample was counted by the second peak.
The standard deviation of the results was 0.1‰, the measured isotopic composition of carbon was δ13CVPDB = −76.2‰.

4. Results

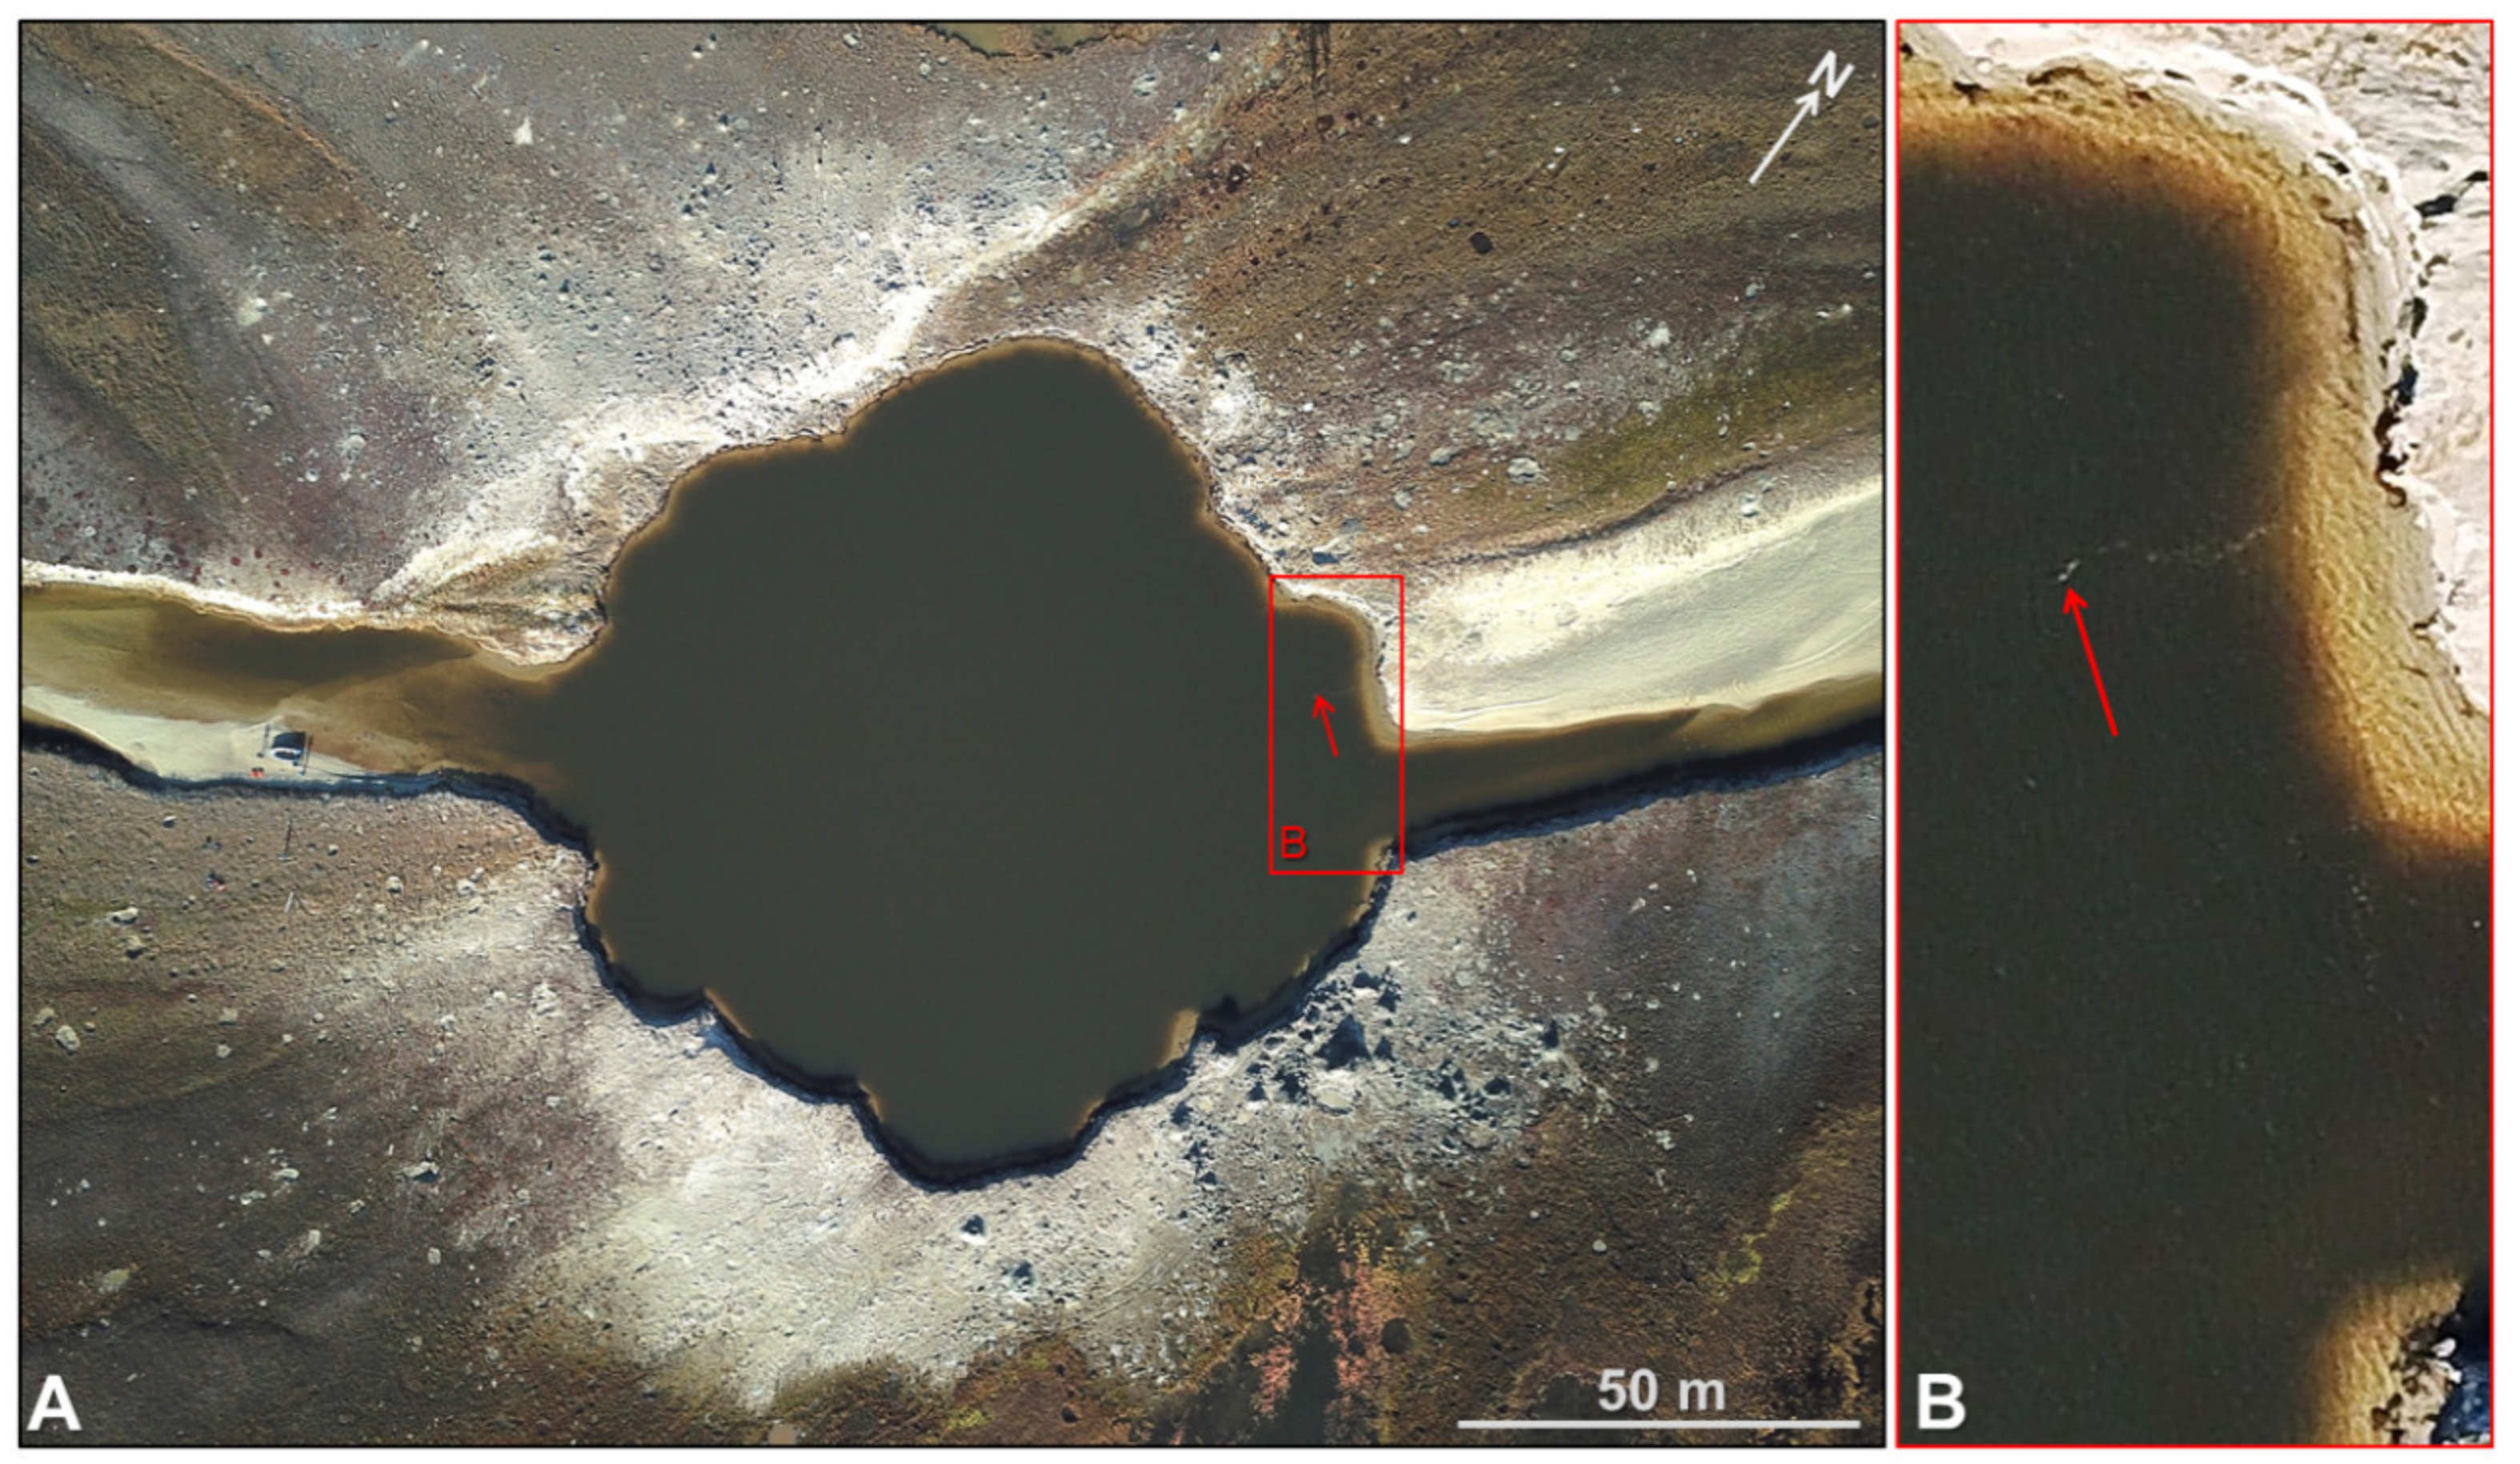
4.1. Gas Seep Zone Location Analysis

During the first expedition to the Seyakha Crater C11 on 2 July 2017 a powerful release of gas into the atmosphere was observed with the effect of “water boiling” and a dome-like uplift due to the flow of rising gas bubbles (Figure 4). The diameter of this zone reached 3 m, and its area was about 7 m2 (Figure 4). The location of this gas emission zone is shown in Figure 5 (yellow star with letter A). The echo sounder failed to measure the depth of the crater vent, apparently due to the strong screening of the generated signal by a powerful flow of gas bubbles. The depth of the C11 crater vent, measured by a rope with a load, was 56 m. A number of other gas release zones, determined using echo sounding and satellite images analysis (Resurs-P, 22 July 2017 and WV-3, 27 July 2017), are also shown in yellow in Figure 5 [13].
In 2018–2020, complex geological and geophysical studies were carried out at the Seyakha Crater of gas blowout [13,14,19,20]. The investigations included echo sounding and GPR studies of the crater bottom, which made it possible to build 3D models of the bottom topography (for example, Figure 5). A bathymetric survey with the Deeper echo sounder was carried out with a narrow beam of 15° at 290 kHz frequency, which made it possible to obtain a reliable display of the bottom topography and confidently detect the gas seeps (flares) (Figure 6). In the bottom topography, numerous landslides from the edges of the crater can be observed (Figure 5), the lengths of which reach 20–40 m.
Figure 7 shows examples of typical gas seeps recorded via above-water and underwater photography in 2018 and 2019. A common feature of all seeps was that the bubbles had an average size of 2–3 cm, with a maximum size up to 4–5 cm and they had various shapes. Figure 5 shows that many seeps were in the same places for 3–4 years. However, there are also areas where seeps were found for only one or two years. Gas seeps were distributed unevenly, mainly in the northern and south-western parts of the crater.
As a result of the use of the UAV DJI Mavic Pro in 2018–2020, high-resolution aerial photographs were obtained, including that taken on 19 September 2018 from 240 m altitude (resolution 8.4 cm/pixel) (Figure 8). In the enlarged fragment (Figure 8B), an arrow indicates the gas, shown on the water surface in the form of a line of gas bubbles which change the albedo of the water surface.
In 2018–2020, despite the limited possibilities of the satellite reference of the UAV in the area of the crater, we managed to take a series of photographs from an altitude of 70 m that were suitable for photogrammetric processing (Pix4Dmapper, Agisoft Metashape) to construct a 3D DEM. One of the results of the obtained complex data processing was a 3D model of the land and the bottom of the crater and the river channel, built in ArcGIS using the results of photogrammetric processing of photos from the UAV flying at 70 m height and echo sounding of the crater’s bottom in 2018 (Figure 5 and Figure 9).
As a result of comprehensive work at the Seyakha object, zones of active gas emission were identified and mapped during four seasons (2017–2020), shown in Figure 5. Table 1 shows the quantitative characteristics of changes in the crater size due to thermal denudation processes over a period of 3.13 years, as well as the number and size of gas emission areas. Analysis of the data obtained allows us to make the following conclusions:
(a)
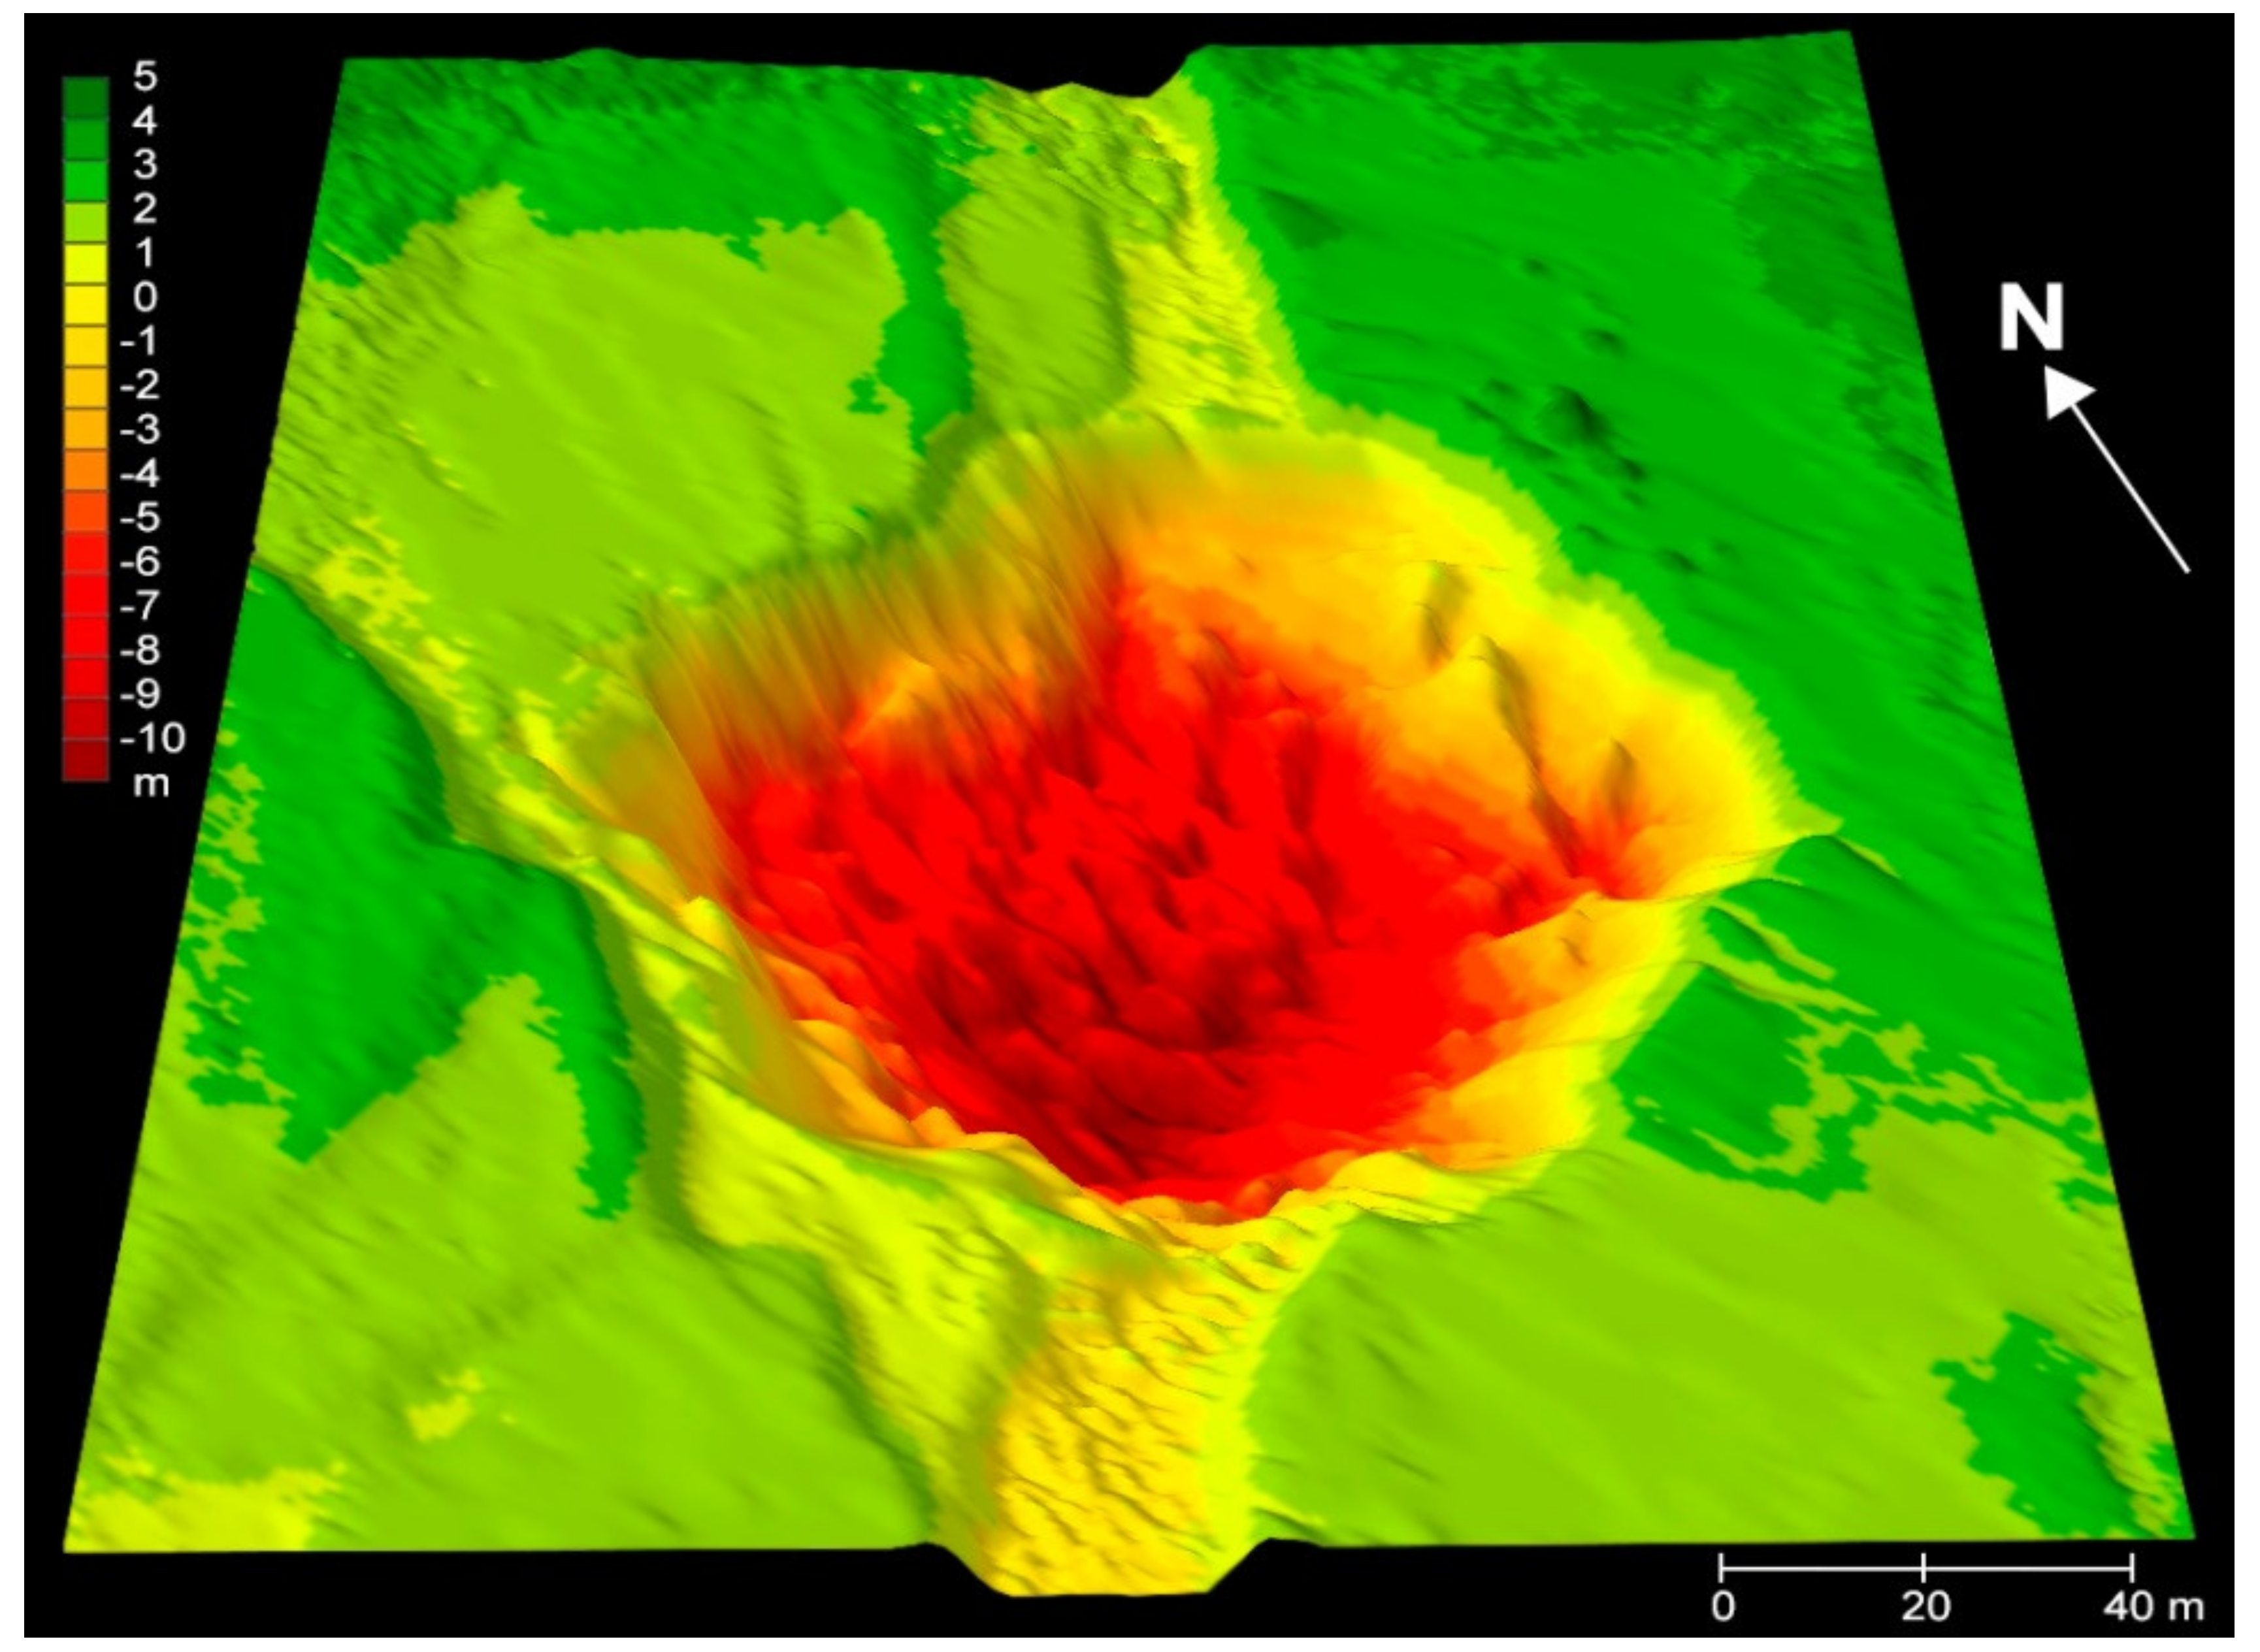
Over the period of 3.13 years, there was a significant (3.36 times) increase in the area of the crater—from 2780 m2 on 2 July 2017 to 9354 m2 on 20 August 2020;
(b)
There was a significant increase in gas emissions in 2019 and 2020. The number of gas emission areas rose from seven and six in 2017 and 2018 to 29 and 27 in 2019 and 2020, and the area covered by gas seeps grew by almost 10 times (9.1–9.8 times). At the same time, the share of the area of gas seeps from the area of the crater increased from 1.1–3.8% to 11.0–11.4%.
(c)
In 2019 and 2020, unified large zones of active gas emission were found, the maximum area of which reached 191–297 m2.
The Severo-Seyakhinskoye Lake was detected 660 m north-east of the C11 crater. On the shallow part of this lake (with a depth from 0 m to 3–4 m), near its western coast, located 130–200 m from the Myudriyakha River, according to RS data from space, a gas emission zone is visible (see Figure 2—yellow polygon). According to the WV-2 satellite image taken on 22 June 2013, it had an area of about 20,000 m2, with 50 underwater gas blowout craters (pockmarks) with diameters of 1–2 to 5–6 m revealed within it (Figure 10A—dark stains). Around many craters there were parapets of thrown-out rock (Figure 10A—light contours). According to the WV-3 satellite image taken on 27 July 2017 (Figure 10B), the number of unambiguously identified craters did not exceed 25, which was two times less than in 2013.

4.2. C11 Crater Seeps Gas Content

The analysis of gas from C11 crater seeps was carried out using the samples taken during field work on 12 August 2019.The results of the gas composition studies with a Clarus 500 chromatograph showed a methane content of 72.99% by volume, and the concentration of other HC gases (C2H4, C2H6, C3H6, C3H8, iso-C4H10, C4H8, n-C4H10) was less than 0.0001% (Table 2). The data from the Crystallux-4000M chromatograph showed close CH4 values, at 72.06%. In addition, the Crystallux-4000M revealed the presence of a small fraction of CO2 (0.04%), as well as a high content of nitrogen (20.17%) and oxygen (7.64%), probably associated with air dissolved in water. After recalculating the gas composition with the elimination of the nitrogen component, the methane content was found to be 96.964%. In this case, the residual O2 content of 2.98% can be explained by mixing (enriching) of the gas while bubbling with oxygen dissolved in water.
The isotopic composition of carbon in methane δ13C (CH4), determined on a Delta Plus isotope mass spectrometer, was −76.2‰ (the error in the analysis results did not exceed 0.1‰). This indicates the predominantly biochemical (microbial) genesis of methane.

5. Discussion

5.1. Discussion of C11 Crater Results

As a result of the research over four seasons in 2017–2020, continuous gas emission was detected (Table 1) at a number of areas on the C11 crater bottom. Moreover, in 2019 and 2020, the share of the gas seep area out of the total area of the crater increased significantly from 1.1–3.8% in 2017 and 2018 up to 11.0–11.4%. Along with an increase in the area of the crater by 3.36 times, the total area of gas seeps increased by 9.1–9.8 times (see Table 1). This indicates a new activation of gas emission processes associated with gas inflow into the crater zone and a new increase in reservoir pressure after its sharp drop during a powerful gas blowout on 28 June 2017.
According to analysis of gas samples taken from the water surface of crater C11 in 2019, the gas has a predominantly methane composition—72.06–72.99% with a high nitrogen content (up to 20.17%). A similar composition of gas was found during the drilling of a number of PF parametric wells on the Bovanenkovskoye field, as well as in some wells in the Yamburgskoye field (see Table 3, paragraphs 2–6, 16 and 17). It is assumed that the gas samples can include air [53]. However, most often the methane content in gas samples in the cryosphere of the Bovanenkovskoye field significantly exceeds 90% and even reaches 99.5% (see Table 3, paragraphs 7–15) [27,53,54]. The only exception is the composition of the gas given in [26,50], presumably contained in PF after the blowout from the Bovanenkovo C1 crater. We attribute these examples to a misunderstanding.
Comparison of the isotopic composition of methane carbon δ13C(CH4) from gas samples taken in the field expedition on the C11 crater in 2019 (−76.2‰, see Table 3—new data) with data from studies of gas samples taken in 2017 by F.M. Rivkin, an employee of PJSC NOVATEK (−80.6‰ [13]), showed their similar characteristics, which make it possible to state that the genesis of methane is predominantly biochemical.
Isotopic analysis of methane in the water of the Bovanenkovo crater C1 showed a wide range of δ13C(CH4), mainly from −59.0‰ to −84.7‰ (Table 4). However, in one sample a value of δ13C(CH4) of about −45.0‰ was obtained [43]. This implies a mixed type of catagenetic and biochemical methane. Cenomanian gases from neighboring areas are characterized by different δ13C(CH4) values: about –48.0‰ for the Bovanenkovskoye oil and gas condensate field (depths from 520 m), from –47.6‰ to –56.5‰ for the Arkcticheskoye, Kharasaveyskoye and Kruzenshternskoye fields [9,23,65,76]. In the Malyginskoye oil and gas condensate fields that are practically undisturbed by faults, whereas the Cenomanian gas (depth from 1070 m) has a δ13C(CH4) value of −65.36‰ [9,23,65,76].
It is worth noting that methane in frozen soil near the C1 crater had a δ13C (CH4) value of −76‰ [26,50]. Similar methane characteristics were previously obtained when analyzing gas samples taken from other objects from the PF strata while drilling wells on the Yamal Peninsula, including the Bovanenkovskoye field, as well as in neighboring regions [38,55]. In particular, at Bovanenkovo wells 51-P-1 and 51-P-2, it varied in the range from −70.0‰ to −74.6‰ (Table 4 [54]. In frozen soils of the western coast of Yamal, δ13C (CH4) varied in the range from −62.0‰ to −74.0‰ (on average, −68.6‰) [48]. When drilling on two PLFs in the oil- and gas-bearing province of the Pur Lowland in West Siberia, δ13C (CH4) varied from −64.4‰ to 86.5‰ (depths of 30.6 and 18 m) [38]. The heavier methane composition of the first PLF was explained by the fact that it is “a mixture of biogenic and thermogenic methane or an oxidized form of biogenic methane” [38,77]. The same situation takes place in Bovanenkovo well 58-P-2 at a depth of 27 m (−59.56‰—see Table 4) [27].
In the gas springs near the well heads of the four explored production gas wells on the Yamburgskoye field (Taz Peninsula) the δ13C(CH4) value varied in a wide range from −44.4‰ to −70.6‰, which indicates the migration of thermogenic gas along the annular space (from −44.4‰ to −46.5‰) in two wells and the output of biochemical gas (−70.6‰) in two other wells (see Table 4) [4].
Comparison of the level of the bottom sediment disturbances by underwater craters in 2013 and 2017 (Figure 10A,B) leads to a number of the conclusions and assumptions. In 2017, a number of craters discovered in 2013 were practically not distinguished, which can be explained by their coverage by the bottom sediments. Some of the craters in 2013 were also clearly visible in 2017, which can be explained by repeated gas emissions. In general, in 2013, the activity of gas emissions was higher than in 2017. It was in 2013 when PLF became visible at the site of the C11 object in the riverbed and on its banks. It is very likely that the decrease in the activity of gas emissions in the Severo-Seyakhinskoye Lake in 2017 was associated with the migration and discharging of gas through other channels, including the Seyakha Crater C11.
While drilling a number of PF parametric wells at the Bovanenkovskoye HC field to depths of about 550 m, gas-saturated intervals were repeatedly encountered in the PF, with gas flow rates varying from 50 to 14,000 m3/day [9,28,31,54]. The flow rates from the Kazantsevskaya formation to a depth of 50 m were usually 50–150 m3/day, and below this they increased to several thousands of m3/day [28,31,54]. The gas was methane (on average 99.5%), with a small nitrogen content.
It should be noted that some samples of intrapermafrost gas in the Bovanenkovskoye HC field contained hydrogen, the content of which varied from 0.07% to 0.15% (well 51-P-1, depths of 28–64 m) and even 1.27–1.5% (51-P-2, 38–44 m) [53,54]. Insufficient attention has been paid to the study of the issue of the content and genesis of hydrogen in permafrost, and this is an important independent direction of research.
Based on the established microbiological genesis of gas, as well as taking into account the great distance of deep wells (more than 15 km) from the C11 object, it was concluded that most likely there had been a natural genesis of gas emissions into the atmosphere due to local gas inflow. At the same time, gas could migrate from highly permeable reservoirs in PF with cryopegs and from deposits below the PF strata. The existence of a gas–hydrodynamic connection between object C11 and Lake Severo-Seyakhinskoye (see Figure 2 and Figure 10) is very likely. It is also possible that gas was released during the dissociation of gas hydrates. It was experimentally proven in [55] that even small temperature changes in the PF can lead to the dissociation of the gas hydrates.

5.2. Generalizing Discussion of Gas Saturation of the Cryolithosphere in the Arctic

The upper part of the section of the Arctic shelf and adjacent land is characterized by a high level of gas saturation [17,21,22]. Gas (mainly methane) can be contained in a free or hydrated state. At the same time, in various regions of the cryolithosphere at depths from 260 to 400–1300 m, there are thermobaric conditions for the formation and preservation of gas hydrates [28,54]. In addition, gas hydrates may exist in a metastable state due to the effect of self-preservation [33,54]. In addition, PF and gas hydrates can act as regional seals contributing to the accumulation of significant volumes of free gas. Climate change leads to the degradation of PF onshore and offshore, the activation of thermokarst processes, the release of large volumes of greenhouse gases (mainly methane) and their emission into the hydro- and atmosphere [44,46].
The high level of gas saturation of the PF poses significant threats of sudden gas blowouts during well drilling (shallow geohazards), which often result in self-ignition, explosion and/or fire. On 17 May 2016, at the Bovanenkovskoye field, when drilling an engineering-geological well with a depth of 100 m from a drilling rig based on a MAZ VP-15A vehicle, gas blew out and self-ignited [61]. The height of the burning fountain reached 15 m, the drilling rig burned down in the fire, and by the end of the day it was self-extinguished. Similar gas blowouts also occurred in the areas of subaqueous PF development on the shelf of the Pechora and Kara seas. In 1995, while drilling engineering-geological well No. 481 from the Bavenit vessel on one of the PLFs, after passing 49.5 m of icy soils, an abnormally high formation pressure zone was penetrated, from which a powerful gas blowout occurred, forming a “boiling pot” with a diameter of 150–200 m [9,16,60]. The gas created an emergency situation, the control of the vessel was disrupted and the string of drill pipes was cut off. The gas release lasted for more than 10 days, with a gradual attenuation. In the Kara Sea, there were gas blowouts during drilling in the areas of the underwater gas pipeline construction in the Baydaratskaya Bay and at the mouth of the Ob Bay, mainly at depths of 11–50 mbsf [16].
Of particular importance for understanding the structure of the PF strata is the catastrophic gas blowout which occurred on 21 June 1984 while drilling prospecting well 118 (total depth 868 m) in the central part of the Bovanenkovskoye field [54]. A giant crater with a diameter of about 230 m was formed at the wellhead, into which all the drilling equipment fell. Gas was also released into the atmosphere through a number of other craters and from the bottoms of lakes at distances of up to several kilometers from the wellhead (according to various sources, up to 1–7 km). This indicates that within the PF (especially at depths of 40–120 m) there are continuous highly permeable sandy layers, in which gas is able to form pools, to migrate over considerable distances and to be released to the surface through taliks that exist under non-freezing lakes and riverbeds.
The estimated reserves of gas contained in the PF deposits in the southern part of the Bovanenkovskoye HC field between the Seyakha and Myudriyakha rivers reach 4.2 million m3/km2 (600 million m3 in an area of 143.35 km2), and about 6.3 million m3/km2 (0.5 million m3 on the area of 80,000 m2) in the area around the 64-P-2 well [15,28,78]. At the same time, abnormally high reservoir pressures are possible in PF gas pools. This is confirmed by the drilling mud blowout with a density of 1.22 g/cm3 from a depth of 131 m during the drilling of the Bovanenkovskaya-26 well. The use of drilling mud with a density of 1.57 g/cm3 did not stop the emission of the gas [1], which indicates the presence of reservoir pressures higher than the hydrostatic pressure by 1.6 times or more.
Gas pools in PF are not of commercial interest for development and subsequent transportation to consumers located at large distances from the place of production. However, the high gas saturation of near-surface PF in areas of intensive human activity may be of independent interest to provide for the local need for energy [11,52,54]. In particular, its production can be commercially justified to provide for settlements on Yamal (Mys Kamenny, Seyakha, etc.) through local low-pressure pipelines, as well as for nomadic indigenous people (compressed gas cylinders) [11].
Gas production with the decrease in reservoir pressures in the cryolithosphere deposits can be compensated by the real-time inflow of gas migrating from free gas pools, as well as gas released during the dissociation of gas hydrates. This has been confirmed through the development of the Messoyakhskoye gas field (69.129° N, 82.51° E), discovered in 1967 in the north of the Krasnoyarsk Territory, 230 km west of the city of Norilsk. The upper part of the gas accumulation of this field is in a hydrated state. In 1982–2011 the average annual gas production was about 120 million m3, whereas the reservoir pressure remained almost constant (about 60 atm), which is explained by the inflow of gas from the gas hydrate reservoir [59].

6. Conclusions

In 2017–2020, active gas-dynamic processes were established to occur in the area of the C11 object, as well as in a number of neighboring thermokarst lakes. After a powerful gas blowout, the self-ignition and the explosion of the gas on 28 June 2017 the C11 crater was formed and flooded by the river. During four expeditions in 2017–2020, a continuous gas emission from its bottom was detected. At the same time, the volume of gas emissions in 2019 and 2020 has grown significantly. In our opinion, this indicates the presence of an open system with a constant flow of gas into the area of the C11 crater along the network of faults and reservoirs.
The most probable explanation is the natural genesis of the gas dynamic processes during the formation of the PLF, the blowout and explosion of the gas and the formation of the C11 crater. At the same time, gas of predominantly biochemical genesis could migrate from free gas pools, located in highly permeable sandy strata inside the PF (reservoirs with cryopegs) and under the PF. It is also possible that gas is supplied from dissociating gas hydrate deposits.
Powerful gas blowouts that have occurred in 2012–2020 in the Arctic areas of active subsurface use lead to the formation of giant craters and are characterized by a high level of threats to human life. Self-ignition and explosions of gas have been recorded, and the spread of pieces of frozen rock and ground ice have reached 300–900 m. During a powerful gas blowout and explosion at the C11 object on 28 June 2017, there was a real threat to the life of indigenous people who were near the explosion epicenter [13].
The cryolithosphere of the Yamal Peninsula and other Arctic regions has a high level of gas saturation and poses a serious threat of gas blowouts and explosions during drilling operations. At the same time, it is a practically inexhaustible unconventional source of energy resources. Cryolithosphere gas exists in free and hydrated states, has a predominantly methane composition, and this methane is of a biochemical, thermogenic and/or mixed type. Near-surface methane pools are of undoubted interest for providing local needs. The use of methane instead of diesel fuel and coal will help improve the environmental situation in the Arctic.

Author Contributions

All the authors conducted field investigations. V.B. developed the methodology, supervised the research, collected and processed 2017–2020 field data, analyzed the data, and wrote the article; I.B. and R.N. collected and processed 2018–2020 field data, worked with RS data (space and UAVs) and prepared DEMs; V.Y. worked with gas geochemical data and participated in writing the article; V.S. performed geochemical studies of gas samples. All authors have read and agreed to the published version of the manuscript.

Funding

The reported study was funded by the “Rational usage of nature and effective development of oil and gas resources of the Arctic and Subarctic zones of the Earth” basic research program of OGRI RAS (No. AAAAA19-119021590079-6) with the support of field studies by the Russian Foundation for Basic Research (grant No. 18-05-70111).

Institutional Review Board Statement

Not Applicable.

Informed Consent Statement

Not Applicable.

Data Availability Statement

Not Applicable.

Acknowledgments

We are grateful to the Government of the Yamal-Nenets Autonomous District and personally to A. Mazharov, Russian Center of the Arctic Development and personally to A.Umnikov, PJSC NOVATEK and JSC Yamal LNG (E.Kot and I.Kolesnikov) for their great help in carrying out expeditionary works.

Conflicts of Interest

The authors declare no conflict of interest.

Abbreviations

PFpermafrost
CDPcommon depth point
HChydrocarbons
GIS “AWO”geoinformation system “Arctic and World Ocean”
OGRI RASOil and Gas Research Institute of the Russian Academy of Sciences
RSremote sensing
PLFpingo-like feature
RCADRussian Center for the Arctic Development
UAVunmanned aerial vehicle
TROPOMItroposheric monitoring instrument
DEMdigital elevation model
WVWorldView satellites
NGANational Geospatial-Intelligence Agency
NSFNational Science Foundation
GPRground penetrating radar
TCDthermal conductivity detectors

References

  1. Agalakov, S.V. Geology and Gas Potential of the Upper Cretaceous Supra-Cenomanian Deposits of Western Siberia. Ph.D. Thesis, LLC Tyumen Oil Research Center, Tyumen, Russia, 2019; 221p. (In Russian). Available online: https://www.tyuiu.ru/wp-content/uploads/2019/12/Dissertatsiya-Agalakova-S.E..pdf (accessed on 25 June 2021).
  2. Andreassen, K.; Nilssen, E.G.; Ødegaard, C.M. Analysis of shallow gas and fluid migration within the Plio-Pleistocene sedimentary succession of the SW Barents Sea continental margin using 3D seismic data. Geo-Mar. Lett. 2007, 27, 155–171. [Google Scholar] [CrossRef]
  3. Are, F.E. The problem of emission of deep gases into the atmosphere. Earth’s Cryosphere 1998, 2, 42–50. (In Russian) [Google Scholar]
  4. Avetov, N.R.; Krasnova, E.A.; Yakushev, V.S. On the possible causes and nature of gas emissions around gas and gas condensate wells on the territory of the Yamburgskoye oil and gas condensate field. Gas Sci. Bull. 2018, 8, 33–40. (In Russian) [Google Scholar]
  5. Badu, Y.B. Gas shows and the nature of Yamal marine deposits cryolithogenesis. Earth’s Cryosphere 2017, XXI, 42–54. (In Russian) [Google Scholar] [CrossRef]
  6. Badu, Y.B. Cryogenic Stratum of Gas-Bearing Structures of Yamal. On the Influence of Gas Deposits on the Formation and Development of a Cryogenic Stratum; Nauchniy MIR: Moscow, Russian, 2018; 232p. (In Russian) [Google Scholar]
  7. Biskaborn, B.K.; Smith, S.L.; Noetzli, J.; Matthes, H.; Vieira, G.; Streletskiy, D.A.; Schoeneich, P.; Romanovsky, V.E.; Lewkowicz, A.G.; Abramov, A.; et al. Permafrost is warming at a global scale. Nat. Commun. 2019, 10, 264. [Google Scholar] [CrossRef] [Green Version]
  8. Bogoyavlensky, V.I. The threat of catastrophic gas blowouts from the Arctic permafrost. Funnels of Yamal and Taymyr. Drill. Oil 2014, 9, 13–18. (In Russian) [Google Scholar]
  9. Bogoyavlensky, V.I. The Arctic and World Ocean: Current state, perspectives and challenges of hydrocarbon production. Monograph. VEO Russ. 2014, 182, 12–175. (In Russian) [Google Scholar]
  10. Bogoyavlensky, V. Gas Blowouts on the Yamal and Gydan Peninsulas. GEOExPro 2015, 12, 74–78. [Google Scholar]
  11. Bogoyavlensky, V.I.; Tupysev, M.K.; Titovskiy, A.L.; Pushkarev, V.A. Rational use of natural resources in the areas of distribution of gas deposits in the upper part of the section. Gas Sci. Bull. 2016, 2, 160–164. (In Russian) [Google Scholar]
  12. Bogoyavlensky, V.; Kishankov, A.; Yanchevskaya, A.; Bogoyavlensky, I. Forecast of Gas Hydrates Distribution Zones in the Arctic Ocean and Adjacent Offshore Areas. Geosciences 2018, 8, 453. [Google Scholar] [CrossRef] [Green Version]
  13. Bogoyavlensky, V.I.; Sizov, O.S.; Mazharov, A.V.; Bogoyavlensky, I.; Nikonov, R.A.; Kishankov, A.V.; Kargina, T.N. Earth degassing in the Arctic: Remote and field studies of the Seyakha catastrophic gas emission on the Yamal Peninsula. Arct. Ecol. Econ. 2019, 80–105. (In Russian) [Google Scholar] [CrossRef]
  14. Bogoyavlensky, V.I.; Sizov, O.S.; Bogoyavlensky, I.V.; Nikonov, R.A.; Kishankov, A.V.; Kargina, T.N. Study of the Seyakha Gas Explosion on the Yamal Peninsula. In Proceedings of the Geomodel 2019, Gelendzhik, Russia, 9–13 September 2019; EAGE: Gelendzhik, Russia, 2019. [Google Scholar] [CrossRef]
  15. Bogoyavlensky, V.I.; Bogoyavlensky, I.V. Formation of shallow hydrocarbon deposits and gas blowout craters. Neftegaz. RU 2019, 1, 48–55. (In Russian) [Google Scholar]
  16. Bogoyavlensky, V.I. Natural and technogenic threats in fossil fuels production in the Earth cryolithosphere. Russ. Min. Ind. 2020, 97–118. (In Russian) [Google Scholar] [CrossRef] [Green Version]
  17. Bogoyavlensky, V.I.; Kishankov, A.V. Dangerous gas-saturated objects in the World Ocean: The Chukchi Sea (Russia and the USA). Arct. Ecol. Econ. 2020, 45–58. (In Russian) [Google Scholar] [CrossRef]
  18. Bogoyavlensky, V.I.; Sizov, O.S.; Bogoyavlensky, I.V.; Nikonov, R.A.; Kargina, T.N. Earth degassing in the Arctic: The genesis of natural and anthropogenic methane emissions. Arct. Ecol. Econ. 2020, 6–22. (In Russian) [Google Scholar] [CrossRef]
  19. Bogoyavlensky, V.I.; Bogoyavlensky, I.V.; Nikonov, R.A.; Kargina, T.N. Digital Technologies For Remote Detection And Monitoring Of The Development Of Heaving Mounds And Craters Of Catastrophic Gas Blowouts In The Arctic. Arct. Ecol. Econ. 2020, 90–105. (In Russian) [Google Scholar] [CrossRef]
  20. Bogoyavlensky, V.I.; Bogoyavlensky, I.V.; Nikonov, R.; Kishankov, A. Complex of Geophysical Studies of the Seyakha Catastrophic Gas Blowout Crater on the Yamal Peninsula, Russian Arctic. Geosciences 2020, 10, 215. [Google Scholar] [CrossRef]
  21. Bogoyavlensky, V.I.; Kishankov, A.V. Features of Potential Free Gas Accumulations Distribution in the Upper Part of Sedimentary Cover of the Arctic and Subarctic Seas. In Proceedings of the 9th International Geological and Geophysical Conference “Saint Petersburg 2020—Converting Knowledge into Resources”, Saint Petersburg, Russia, 16–19 November 2020; EAGE: Saint Petersburg, Russia, 2020; pp. 1–6. [Google Scholar] [CrossRef]
  22. Bogoyavlensky, V.I.; Kazanin, A.G.; Kishankov, A.V.; Kazanin, G.A. Earth degassing in the Arctic: Comprehensive analysis of powerful gas emission in the Laptev Sea. Arct. Ecol. Econ. 2021, 11, 178–194. (In Russian) [Google Scholar] [CrossRef]
  23. Bogoyavlensky, V.I. Fundamental aspects of the catastrophic gas blowout genesis and the formation of giant craters in the Arctic. Arct. Ecol. Econ. 2021, 11, 51–66. (In Russian) [Google Scholar] [CrossRef]
  24. Bogoyavlensky, V.; Bogoyavlensky, I.; Nikonov, R.; Kargina, T.; Chuvilin, E.; Bukhanov, B.; Umnikov, A. New Catastrophic Gas Blowout and Giant Crater on the Yamal Peninsula in 2020: Results of the Expedition and Data Processing. Geosciences 2021, 11, 71. [Google Scholar] [CrossRef]
  25. Bondur, V.G.; Kuznetsova, T.V. Detecting Gas Seeps in Arctic Water Areas Using Remote Sensing Data. Izv. Atmos. Ocean. Phys. 2015, 51, 1060–1072. [Google Scholar] [CrossRef]
  26. Buldovicz, S.N.; Khilimonyuk, V.Z.; Bychkov, A.Y.; Ospennikov, E.N.; Vorobyev, S.A.; Gunar, A.Y.; Gorshkov, E.I.; Chuvilin, E.M.; Cherbunina, M.Y.; Kotov, P.I.; et al. Cryovolcanism on the earth: Origin of a spectacular crater in the Yamal Peninsula (Russia). Sci. Rep. 2018, 8, 13534. [Google Scholar] [CrossRef]
  27. Vasilchuk, Y.K.; Krylov, G.V.; Podborny, E.E. (Eds.) Cryosphere of Kharasaveyskoye gas condensate field. Vol. 1. In Cryosphere of Oil and Gas Condensate Fields of Yamal Peninsula; LLC TyumenNIIgiprogaz, SPb: Nedra, India, 2006; Volume 3, 347p. (In Russian) [Google Scholar]
  28. Badu, Y.B.; Gafarov, N.A.; Podborny, E.E. (Eds.) Cryosphere of Bovanenkovskoye oil and gas condensate field. Vol. 2. In Cryosphere of Oil and Gas Condensate Fields of Yamal Peninsul; OOO Gazprom Expo: Saint Petersburg, Russia, 2013; Volume 3, 424p. (In Russian) [Google Scholar]
  29. Chuvilin, E.; Stanilovskaya, J.; Titovsky, A.; Sinitsky, A.; Sokolova, N.; Bukhanov, B.; Spasennykh, M.; Cheremisin, A.; Grebenkin, S.; Davletshina, D.; et al. A Gas-emission crater in the Erkuta River valley, Yamal Peninsula: Characteristics and potential formation model. Geosciences 2020, 10, 170. [Google Scholar] [CrossRef]
  30. Chuvilin, E.; Sokolova, N.; Davletshina, D.; Bukhanov, B.; Stanilovskaya, J.; Badetz, C.; Spasennykh, M. Conceptual models of gas accumulation in the shallow permafrost of Northern West Siberia and conditions for explosive gas emissions. Geosciences 2020, 10, 195. [Google Scholar] [CrossRef]
  31. Chuvilin, E.M.; Yakushev, V.S.; Perlova, E.V.; Kondakov, V.V. Gas component of Bovanenkovo gas condensate field (Yamal peninsula) frozen rock strata. Dokl. Earth Sci. 1999, 369, 522–524. (In Russian) [Google Scholar]
  32. Dvornikov, Y.A.; Leibman, M.O.; Khomutov, A.V.; Kizyakov, A.I.; Semenov, P.; Bussmann, I.; Babkin, E.M.; Heim, B.; Portnov, A.; Babkina, E.A.; et al. Gas-emission craters of the Yamal and Gydan peninsulas: A proposed mechanism for lake genesis and development of permafrost landscapes. Permafr. Periglac. Process. 2019, 30, 146–162. [Google Scholar] [CrossRef] [Green Version]
  33. Istomin, V.A.; Chuvilin, E.M.; Sergeeva, D.V.; Bukhanov, B.A.; Badetz, C.; Stanilovskaya, Y.V. Thermodynamics of freezing soil closed system saturated with gas and water. Cold Reg. Sci. Technol. 2020, 170, 102901. [Google Scholar] [CrossRef]
  34. Judd, A.; Hovland, M. Seabed Fluid Flow. The Impact on Geology, Biology, and the Marine Environment; Cambridge University Press: Cambridge, UK, 2007; 493p. [Google Scholar]
  35. Kizyakov, A.; Leibman, M.; Zimin, M.; Sonyushkin, A.; Dvornikov, Y.; Khomutov, A.; Dhont, D.; Cauquil, E.; Pushkarev, V.; Stanilovskaya, Y. Gas Emission Craters and Mound-Predecessors in the North of West Siberia, Similarities and Differences. Remote. Sens. 2020, 12, 2182. [Google Scholar] [CrossRef]
  36. Khimenkov, A.N.; Sergeev, D.O.; Vlasov, A.N.; Volkov-Bogorodskii, D.B. Explosive processes in the permafrost zone as a new type of geocryological hazard. Geoecology Eng. Geol. Hydrogeol. Geocryol. 2019, 6, 30–41. (In Russian) [Google Scholar] [CrossRef]
  37. Kraev, G.; Schulze, E.-D.; Yurova, A.; Kholodov, A.; Chuvilin, E.; Rivkina, E. Cryogenic Displacement and Accumulation of Biogenic Methane in Frozen Soils. Atmosphere 2017, 8, 105. [Google Scholar] [CrossRef] [Green Version]
  38. Kraev, G.; Rivkina, E.; Vishnivetskaya, T.; Belonosov, A.; van Huissteden, J.; Kholodov, A.; Smirnov, A.; Kudryavtsev, A.; Teshebaeva, K.; Zamolodchikov, D. Methane in Gas Shows from Boreholes in Epigenetic Permafrost of Siberian Arctic. Geosciences 2019, 9, 67. [Google Scholar] [CrossRef] [Green Version]
  39. Kritsuk, L.N. Ground Ice of West Siberia; Nauchniy Mir: Moscow, Russia, 2010; 352p. (In Russian) [Google Scholar]
  40. Kvenvolden, K.A.; Ginsburg, G.D.; Soloviev, V.A. Worldwide distribution of subaquatic gas hydrates. Geo-Mar. Lett. 1993, 13, 32–40. [Google Scholar] [CrossRef]
  41. Leibman, M.O.; Plekhanov, A.V. Yamal gas emission funnel: Results of preliminary examination. Kholodok 2014, 12, 9–15. (In Russian) [Google Scholar]
  42. Leibman, M.O.; Kizyakov, A.I.; Plekhanov, A.V.; Streletskaya, I.D. New permafrost feature—deep crater in Central Yamal (West Siberia, Russia) as a response to local climate fluctuations. Russian Geographical Society. Geograpy Environ. Sustain. 2014, 7, 68–79. [Google Scholar]
  43. Leibman, M.O.; Dvornikov, Y.A.; Streletskaya, I.D.; Khomutov, A.V. Connection between the gas emission craters formation and methane emission in the north of Western Siberia. In Proceedings of the International Conference “Earth Degazing: Geology and Ecology–2018” Actual Problems of Oil and Gas, Moscow, Russia, 24–25 April 2018. 4p, (In Russian). [Google Scholar] [CrossRef]
  44. Sergiyenko, V.I.; Lobkovskiy, L.I.; Semiletov, I.P.; Dudarev, O.V.; Dmitriyevskiy, N.N.; Shakhova, N.E.; Romanovskiy, N.N.; Kosmach, D.A.; Nikolskiy, D.N.; Nikiforov, S.L.; et al. Subaqeous permafrost degradation and gas hydrates destruction on the shelves of Eastern Arctic seas as a probable reason of “Methane Catastrophe”: Some results of complex studies in 2011. Dokl. Earth Sci. 2012, 446, 330–335. (In Russian) [Google Scholar]
  45. Serov, P.; Portnov, A.; Mienert, J.; Semenov, P.; Ilatovskaya, P. Methane release from pingo-like features across the South Kara Sea shelf, an area of thawing offshore permafrost. J. Geophys. Res. Earth Surf. 2015, 120, 1515–1529. [Google Scholar] [CrossRef] [Green Version]
  46. Shakhova, N.; Semiletov, I.; Sergienko, V.; Lobkovsky, L.; Yusupov, V.; Salyuk, A.; Salomatin, A.; Chernykh, D.; Kosmach, D.; Panteleev, G.; et al. The East Siberian Arctic Shelf: Towards further assessment of permafrost-related methane fluxes and role of sea ice. Philos. Trans. R. Soc. A Math. Phys. Eng. Sci. 2015, 373, 20140451. [Google Scholar] [CrossRef]
  47. Streletskaya, I.D.; Leibman, M.O.; Kizyakov, A.I.; Oblogov, G.E.; Vasiliev, A.A.; Khomutov, A.V.; Dvornikov, Y.A. Ground ice and its role in the formation of gas emission crater in the Yamal peninsula. Mosc. Univ. Bull. Ser. Geogr. 2017, 5, 91–99. (In Russian) [Google Scholar]
  48. Streletskaya, I.D.; Vasiliev, A.A.; Oblogov, G.E.; Streletskiy, D.A. Methane Content in Ground Ice and Sediments of the Kara Sea Coast. Geosciences 2018, 8, 434. [Google Scholar] [CrossRef] [Green Version]
  49. Vasiliev, A.A.; Streletskaya, I.D.; Melnikov, V.P.; Oblogov, G.E. Methane in Ground Ice and Frozen Quaternary Deposits of Western Yamal. Dokl. Earth Sci. 2015, 465, 1289–1292. [Google Scholar] [CrossRef]
  50. Vorobyev, S.; Bychkov, A.; Khilimonyuk, V.; Buldovicz, S.; Ospennikov, E.; Chuvilin, E. Formation of the Yamal Crater in Northern West Siberia: Evidence from Geochemistry. Geosciences 2019, 9, 515. [Google Scholar] [CrossRef] [Green Version]
  51. Walter Anthony, K.M.; Vas, D.A.; Brosius, L.; Stuart Chapin, F., III; Zimov, S.A.; Zhuang, Q. Estimating methane emissions from northern lakes using ice bubble surveys. Limnol. Oceanogr. Methods 2010, 8, 592–609. [Google Scholar] [CrossRef] [Green Version]
  52. Yakushev, V.S. One of possible reasons of gas blowouts from the massifs of permafrost rocks. Oil Gas Geol. 1989, 4, 45–46. (In Russian) [Google Scholar]
  53. Yakushev, V.S.; Chuvilin, E.M. Natural gas and gas hydrate accumulations within permafrost in Russia. Cold Reg. Sci. Technol. 2000, 31, 189–197. [Google Scholar] [CrossRef]
  54. Yakushev, V.S. Natural Gas and Gas Hydrates in the Cryolithozone; VNIIGAZ: Moscow, Russia, 2009; 192p. (In Russian) [Google Scholar]
  55. Yakushev, V.S.; Semenov, A.P.; Bogoyavlensky, V.I.; Medvedev, V.I.; Bogoyavlensky, I.V. Experimental modeling of methane release from intrapermafrost relic gas hydrates when sediment temperature change. Cold Reg. Sci. Technol. 2018, 149, 46–50. [Google Scholar] [CrossRef]
  56. Yakushev, V.S. Natural Gas Liberations around Production Wells at Russian Arctic Gas Fields. Geosciences 2020, 10, 184. [Google Scholar] [CrossRef]
  57. Saunois, M.; Stavert, A.R.; Poulter, B.; Bousquet, P.; Canadell, J.G.; Jackson, R.B.; Raymond, P.A.; Dlugokencky, E.J.; Houweling, S.; Patra, P.K.; et al. The Global Methane Budget 2000–2017. Earth Syst. Sci. Data 2020, 12, 1561–1623. [Google Scholar] [CrossRef]
  58. Dean, J.F. Old methane and modern climate change. Science 2020, 367, 846–848. [Google Scholar] [CrossRef] [PubMed]
  59. Makogon, Y.F.; Omelchenko, R.Y. Messoyakha–the gas hydrate deposit, its role and meaning. Geol. Miner. Resour. World Ocean 2012, 3, 5–19. (In Russian) [Google Scholar]
  60. Melnikov, V.P.; Spesivtsev, V.I.; Kulikov, V.N. About the stream degassing as a source of new ice formations in the Pechora Sea shelf. In Proceedings of the International Conference “The Results of Earth’s Cryolithosphere Fundamental Studies in Arctic and Subarctic”, Pushchino, Russia, 23–26 April 1996; Nauka: Novosibirsk, Russia, 1997; pp. 259–269. (In Russian). [Google Scholar]
  61. Shvabauer, N. The Fire on the Gas Well Was Extinguished on Yamal. Rossiyskaya Gazeta, 17 May 2015 (In Russian). Available online: https://rg.ru/2015/05/17/reg-urfo/skvazhina-anons.html (accessed on 25 June 2021).
  62. Cherepanov, V.V.; Menshikov, S.N.; Varyagov, S.A.; Bondarev, V.L.; Mirotvorskiy, M.Y. The nature of behind the casing gas shows on Bovanenkovskoye oil and gas condensate field. Geol. Geophys. Explor. Oil Gas Fields 2011, 9, 48–54. (In Russian) [Google Scholar]
  63. NPD Factpages. Discovery 35/2-1 (Peon). Available online: https://factpages.npd.no/en/discovery/pageview/all/3465397 (accessed on 25 June 2021).
  64. Boogaard, M.; Gras, R.; Hoetz, G. Shallow Play in the Netherlands—Derisked by Seismic Characterisation. In Proceedings of the EAGE, 75th EAGE Conference & Exhibition Incorporating SPE EUROPEC 2013, London, UK, 10–13 June 2013; p. cp-348-00983. [Google Scholar] [CrossRef]
  65. Milkov, A.V. Methanogenic biodegradation of petroleum in the West Siberian Basin (Russia): Significance for formation of giant Cenomanian gas pools. AAPG Bull. 2010, 94, 1485–1541. [Google Scholar] [CrossRef]
  66. Brekhuntsov, A.M.; Monastyrev, B.V.; Nesterov, I.I.; Skorobogatov, V.A. Oil and Gas Geology of the West Siberian Arctic; OOO MNP Geodata: Tyumen, Russia, 2020; 464p. (In Russian) [Google Scholar]
  67. Skorobogatov, V.A.; Stroganov, L.V.; Kopeev, V.D. Geological Structure and Oil and Gas Potential of Yamal; OOO “Nedra-Biznestsentr”: Moscow, Russia, 2003; 352p. (In Russian) [Google Scholar]
  68. Mackay, J.R. Pingo Growth and collapse, Tuktoyaktuk Peninsula Area, Western Arctic Coast, Canada: A long-term field study. Geogr. Phys. Quat. 1998, 52, 271–323. [Google Scholar] [CrossRef] [Green Version]
  69. Shumskiy, P.A. Ground Ice. In The Basis of Geocryology; The Russian Academy of Sciences Publishing House: Moscow, Russia, 1959; p. 1; ch. IX; pp. 271–327. (In Russian) [Google Scholar]
  70. Shishkin, M.A.; Faybusovich, Y.E.; Shkarubo, S.I.; Nazarov, D.V.; Abakumova, L.A.; Borozdina, Y.A.; Voronin, A.S.; Gerasicheva, A.V.; Gorelina, T.E.; Zavarzina, G.A.; et al. The State Geological Map of Russian Federation. Scale 1:1,000,000 (Third Generation). Western Siberian Series. Sheet R-42-Yamal Peninsula. Explanatory Letter; VSEGEI: Saint Petersburg, Russia, 2015; 366p. (In Russian) [Google Scholar]
  71. ArcticDEM. Available online: https://www.pgc.umn.edu/data/arcticdem (accessed on 29 April 2021).
  72. Agisoft Metashape Professional. Available online: https://www.geoscan.aero/ru/software/agisoft/metashape_pro (accessed on 29 April 2021).
  73. OKO-3 GPR with a Control Unit. Geotech Company Group. Available online: http://geotechru.com/oko-3-gpr-with-control-unit-2 (accessed on 29 April 2021).
  74. Brandt, O.; Langley, K.; Kohler, J.; Hamran, S.-E. Detection of buried ice and sediment layers in permafrost using multi-frequency Ground Penetrating Radar: A case examination on Svalbard. Elsevie. Remote Sens. Environ. 2007, 111, 212–227. [Google Scholar] [CrossRef]
  75. Chromatograph «Crystallux–4000M». Available online: https://www.meta-chrom.ru/catalog/chromatographs/crystallux-4000m (accessed on 29 April 2021).
  76. Dvoretsky, P.I.; Goncharov, V.S.; Esikov, A.D.; Teplinskiy, V.I.; Ilchenko, V.P. Isotopic Composition of Natural Gases in the North of Western Siberia. Ryview; IRTs JSC “Gazprom”: Moscow, Russia, 2000; 80p. (In Russian) [Google Scholar]
  77. Whiticar, M.J. Carbon and hydrogen isotope systematics of bacterial formation and oxidation of methane. Chem. Geol. 1999, 161, 291–314. [Google Scholar] [CrossRef]
  78. Bondarev, V.L.; Mirotvorskiy, M.Y.; Zvereva, V.B.; Oblekov, G.I.; Shaydullin, R.M.; Gudzenko, V.T. Gas chemical characteristic of supra-Cenomanian deposits of Yamal peninsula (on the example of Bovanenkobvskoye oil and gas condensat,e field). Geol. Geophys. Explor. Oil Gas Fields 2008, 5, 22–34. (In Russian) [Google Scholar]
Figure 1. Gas blowout craters on Yamal and Gydan peninsulas. Legend: 1—areas of detailed studies by the Oil and Gas Research Institute of the Russian Academy of Sciences (OGRI RAS) and the Russian Center for Arctic Development (RCAD) (A—Antipayuta, B—Bovanenkovo, ST—South Tambey, NT—North Tambey, NS—Neito-Seyakha, YR—Yerkuta, YA—Yamburg); 2—craters of gas blowouts C1, C2, C3, C9, C10, C11 and C12; 3 and 4—gas, gas condensate (3) and oil (4) fields, including those marked with pink color: Bovanenkovskoye (1), South Tambeyskoye (2), North Tambeyskoye (3) and West Seyakhinskoye (4); 5—gas pipeline Bovanenkovo–Ukhta; 6—oil pipeline; 7—railroad. Basemap—ESRI.
Energies 14 05345 g001
Figure 2. Satellite image from 27 June, 2017 (WorldVeiw-3, ESRI) and the location of Seyakha Crater C11. Legend: 1—surface contour lines (m); 2 and 3—contours of crater on 27 June 2017 and on 11 August 2020; 4—the area at the lake bottom with craters.
Energies 14 05345 g002
Figure 3. Seyakha Crater C11 of gas blowout (A) and massive fragments of ground ice ejected by the explosion (B) 2 July 2017 (photos by Vasily Bogoyavlensky).
Energies 14 05345 g003
Figure 4. Zone of strong gas emission in the flooded crater (a) and enlarged fragment of the central zone of gas release (b), 2 July 2017 (location—see Figure 5A) (photos by Vasily Bogoyavlensky).
Energies 14 05345 g004
Figure 5. Gas emission areas on the Seyakha Crater C11 in 2017 (1), 2018 (2), 2019 (3) and 2020 (4). Comments: (5) and (6)-areas of gas emission examples in Figure 4a in 2017 and Figure 6B,C in 2018; (7)-echo sounding section presented in Figure 6; (8)-isobaths (m) on the bathymetry base map studied by means of echo sounding on 20 August 2020.
Energies 14 05345 g005
Figure 6. Echo sounding section with gas flares B and C on the Seyakha Crater, flooded by river water, 19 September 2019 (for location of section with B and C gas flares—see Figure 5).
Energies 14 05345 g006
Figure 7. Typical examples of gas seeps documented via above-water (A) and underwater (B) video and photography in 2018 and 2019 (scale corresponds to the objects in the foreground).
Energies 14 05345 g007
Figure 8. Aerial photograph of Seyakha Crater area captured using a UAV (A) with an enlarged fragment (B), 19 September 2018 (photo by Igor Bogoyavlensky).
Energies 14 05345 g008
Figure 9. 3D DEM of the Seyakha gas blowout crater and surrounding area based on the data complex of aerial photography from the drone and the echo sounding survey (20 August 2020).
Energies 14 05345 g009
Figure 10. Satellite images of Severo-Seyakhinskoye Lake with craters of gas blowouts on the bottom from WV-2 on 22 June 2013 (A) and WV-3 on 27 July 2017 (B). The location of the area is shown in Figure 2.
Energies 14 05345 g010
Table 1. Generalized characteristics of the C11 crater dimensions, the number and size of the gas emission areas (locations of seeps are shown in Figure 5).
Date (yyyy.mm.dd)Information SourceCrater Area, m2Crater Area, %Number of Areas with SeepsArea of Seeps, m2Total Area of Seeps, m2Area of Seeps, %
MinMax
2017.07.02HC2780100.076.336.7106.13.82
2017.07.22RP4998179.876.336.7106.12.12
2017.07.27WV-35237188.476.336.7106.12.03
2018.07.16RP7740278.465.935.5113.41.47
2018.07.20WV-18468304.665.935.5113.41.14
2018.09.18D9049325.565.935.5113.41.25
2019.08.12D9113327.8293.6296.71036.711.38
2020.08.20D9354336.5272.3191.11027.310.98
Comments: HC—helicopter; WV—WorldView; RP—Resource-P; D—drone.
Table 2. Gas composition in samples from the Seykha C11 crater, according to different chromatographic measurements.
GasChromatographGas Content, % of Volume
InitialRecalculated
CH4Clarus 50072.99181-
C2H4+Clarus 500<0.0001-
CH4“Crystallux-4000 M”72.0696.964
CO2“Crystallux-4000 M”0.04140.056
O2“Crystallux-4000 M”7.6382.98
N2“Crystallux-4000 M”20.170.0
Table 3. Comparison of gas composition in samples from Seykha crater C11 (new data) and PF parametric wells from the Bovanenkovskoye and Yamburgskoye HC fields (according to [27,53]).
S.#Area/WellDepth, mChemical Composition, % VolumeSource of Data
CH4CO2N2O2
1Crater C11>1272.060.041420.177.638New data
2BW. 51-P-238–4474.810.2916.033.27[53]
3BW. 52-P-2114–12077.91n.d.7.33n.d.[27]
4BW. 58-P-1100–10771.320.0521.224.89[27]
5BW. 610-P-354–5865.220.1627.47n.d.[27]
6BW. 610-P-371–7673.200.3320.700.30[27]
7BW. 51-P-128–3395.490.023.510.91[53]
8BW. 51-P-159–6492.800.055.031.15[53]
9BW. 51-P-3150–15197.192.720.09n.d.[53]
10BW. 52-P-1119–12398.020.081.9n.d.[53]
11BW. 52-P-389–9699.790.00.210.0[53]
12BW.56-P-3 60–6897.151.411.43n.d.[27]
13BW. 67-P-365–6893.172.363.461.01[27]
14BW. 67-P-396–16095.780.093.390.74[27]
15BW. 610-P-291–9591.880.066.300.11[27]
16YaW. 150–10078.30.318.43.0[53]
17YaW. 210650–10079.30.1317.3n.d[53]
Note: BW—wells on Bovanenkovskoye field; YaW—wells on Yamburgskoye field; n.d.—no data.
Table 4. Comparison of the stable carbon isotope contents in methane from crater C11 and free gases in the Bovanenkovskoye and Yamburgskoye HC fields (based on [4,13,27,53,78]).
S.#Area/WellDepth, mδ13C(CH4), ‰Source of Data
1Crater C11>12−76.2New data
2Crater C1156?−80.6[13]
3Crater C120–40?−45...−84.7[43]
4BW. 51-P-128–33−73.9[27,53]
5BW. 51-P-159–64−74.6/−75.1[27,53]
6BW. 51-P-238–44−72.2/−73.8[27,53]
7BW. 51-P-362–69−72.3/−74.1[27,53]
8BW. 52-P-163–70−71.0 [53]
9BW. 52-P-1119–123−71.8[27]
10BW. 52-P-246–52−70.4/−71.8[27,53]
11BW. 52-P-2114–120−70.4/−69.8[27,53]
12BW. 55-P-159–64−92.1[27]
13BW. 55-P-3103–113−73.6/−70.0[27,53]
14BW. 56-P-270–80−76.8[27]
15BW. 58-P-1100–107−72.7[27]
16BW. 58-P-227−59.56[27]
17BW. 58-P-2105−90.41[27]
18YaW0−44.4/−46.5[4]
19YaW0−70.5/−70.6[4]
Note: BW—wells on Bovanenkovskoye field; YaW—gas springs near wells on Yamburgskoye field.
Publisher’s Note: MDPI stays neutral with regard to jurisdictional claims in published maps and institutional affiliations.

