1. Introduction
Vehicular ad hoc networks (VANET) [
1,
2] can genuinely be viewed as a game changer in repainting the future of electric vehicles. The incorporation of the concept of 5G communication modes is also being widely discussed. These communication paradigms have opened up a broad spectrum of technological advancements such as VANET [
3,
4], IoV [
5,
6,
7], and industrial automation [
8,
9]–to name a few. The IoV promotes connectivity to achieve communication not only among the vehicles, but also with the road side infrastructure that promotes safety and ease of service on the road. This encourages the advancement in IoT, which focuses on the provision of communication services as well as the better control and security of household and commercial areas, paving the way for concepts such as smart cities and smart grids [
10]. These practices also lead to new ideas in the field of industrial automation, promoting a new generation of robotics and automated control systems for efficient production. These innovations are going to cause a surge in power consumption in the near future, which requires to explore more ways and methods for energy generation. To this end, energy harvesting is a straightforward and elegant approach for powering on-board batteries rather than frequent battery replenishment, in order to maintain a perpetual power supply [
11,
12].
The constantly increasing carbon emissions caused by conventional gas-powered vehicles have led research efforts towards the inception of electric vehicles (EVs) [
13,
14,
15], these being one of the greatest inventions of recent decades. This concept started to take form and become implemented during the early 21st century. The practical concept of the electric vehicle was introduced to the world by Tesla Co. The car runs on electric batteries which turn a motor in the car that rotates the axle shaft of the accelerator wheels. The technology has since modernized the automobile industry, but its range and charging are still issues to be revolutionized. The EVs are charged from static charging ports. These charging ports will receive electricity from the power grids which are already responsible for supplying power to different types of loads in residential, commercial, and industrial set ups. The relayance of EVs upon these power stations could cause a huge increase in electricity demand. There is, therefore, a need for a harvesting system for the EVs to reduce their dependence upon power grids–and if the battery is exhausted, there should be a way of feeding the vehicles with energy as it can help in disaster recovery e.g., connected police, fire-brigade and ambulance services can benefit from connectivity while coordinating their responses and services during a disaster.
Several techniques have been introduced for electricity generation in the form of moving vehicles with fans mounted at different positions, i.e., using a windmill mounted on the trunk and the top of a car or a train, however, some serious issues were highlighted as obstacles to efficient and effective generation. Previously proposed approaches were not quite compatible with all types of vehicles as they directly relied on the fan output power. However, there was limited work has been carried out covering the electrical aspects. Quartey et al. [
16] first presented the concept for charging a mobile car in which a wind turbine is mounted on the top of the car to charge the car’s battery using the wind energy striking on the car. The practical results had drawbacks in terms of the increase in the drag force on the car which affected the efficiency of the car [
17]. Then, another work [
18] highlighted the cause for the increase in the pressure on the car with the help of simulations. The simulation showed that the front and the bonnet of the car are much more reliable locations for mounting the wind turbine than the top [
19].
Another attempt to make a vehicle-mounted wind turbine system was made in [
20] where the authors proposed to mount a miniaturized windmill [
21] on the back of a pickup truck but the design had a problem as it was not applicable to other types of vehicles [
22,
23]. Similarly, an energy-harvesting system was presented in [
24] which exploits the motion of a moving vehicle’s suspension. This system addresses the issues of low energy density, vibration dissipation, and lower energy-harvesting efficiency in current technology. The energy conversion components were introduced with inertial mass and an applied force to establish a dual-mass 2-DOF (degree of freedom) suspension dynamics model. Extending the similar lines, [
25] demonstrated that the maximum power harvested by a vehicle suspension system can reach 738 W and is affected by road roughness.
Moreover, a new dual-mass piezoelectric energy harvester was designed in [
26] to collect effective and practical vibration energy from vehicle tires with a maximum power of 42.08 W. Furthermore, [
27] proposes an electric vehicle with an energy-harvesting system embracing vibration energy via a shock absorber. Maximum power point tracking algorithms and active output control techniques for active power converters were examined in order to determine how the energy-harvesting technique could be used to enhance the shock absorbers in vehicle suspension. An electric vehicle with a hybrid suspension system was proposed in [
28] which caused the rise in EV sales. The concept, design, and idea of the new damper was provided, along with a simulation mainly focusing on the eddy current damper component. According to the authors, multi-mode energy harvesting provides an EV with a promising renewable source to generate surplus energy.
In this paper, a novel approach is presented to achieve electric generation in EVs by mounting a small-scale wind turbine (shown in
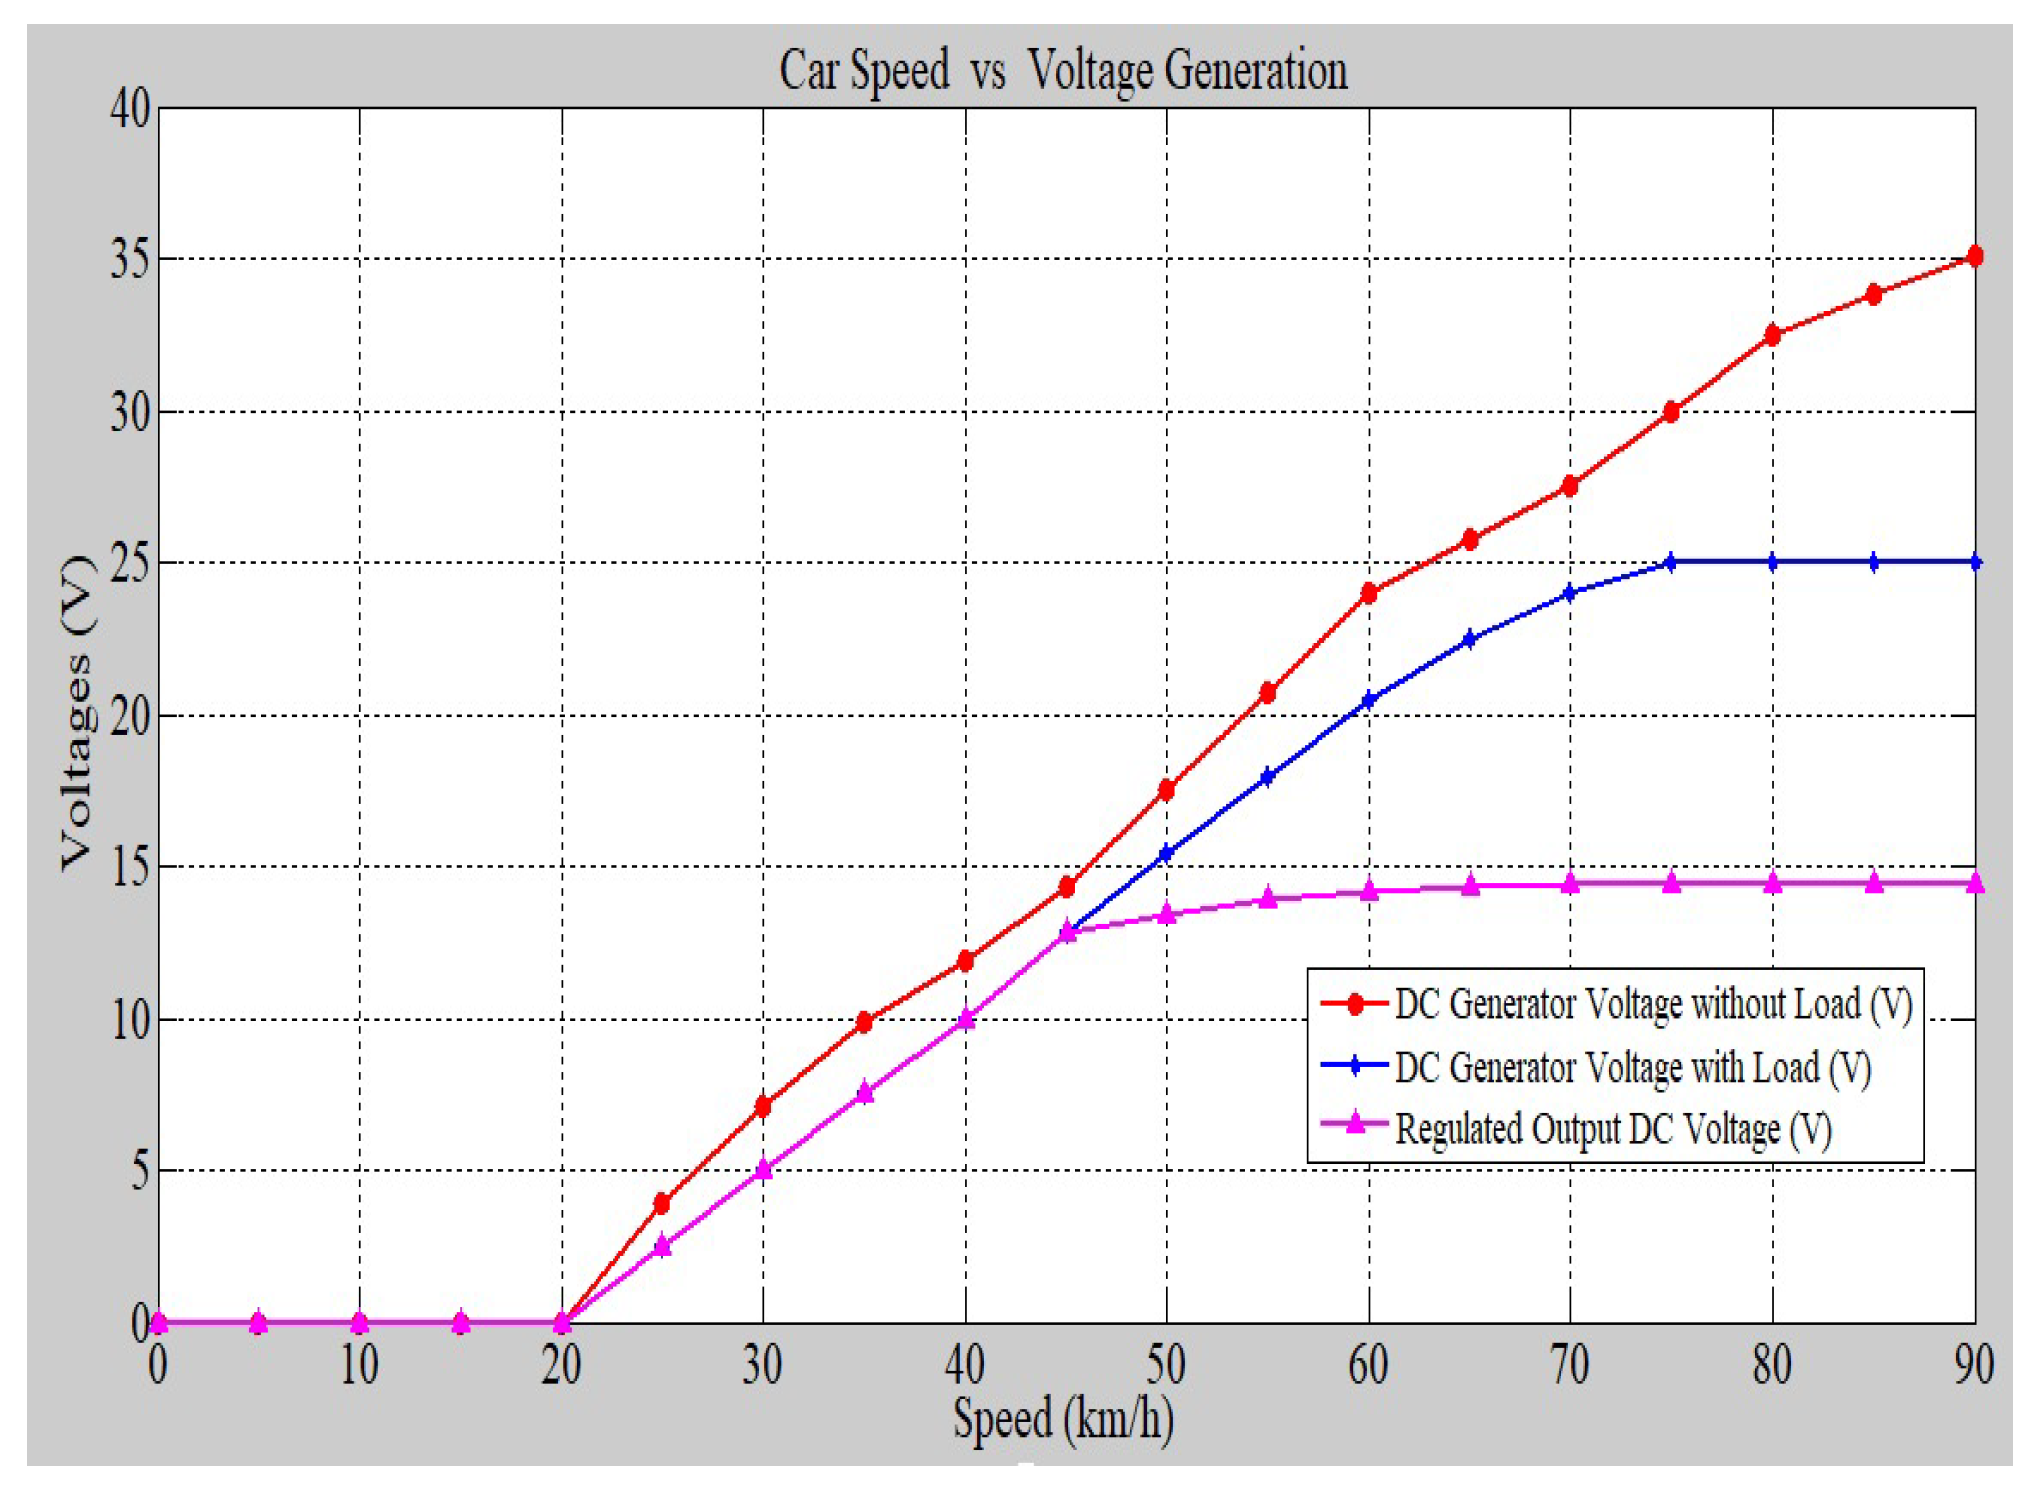
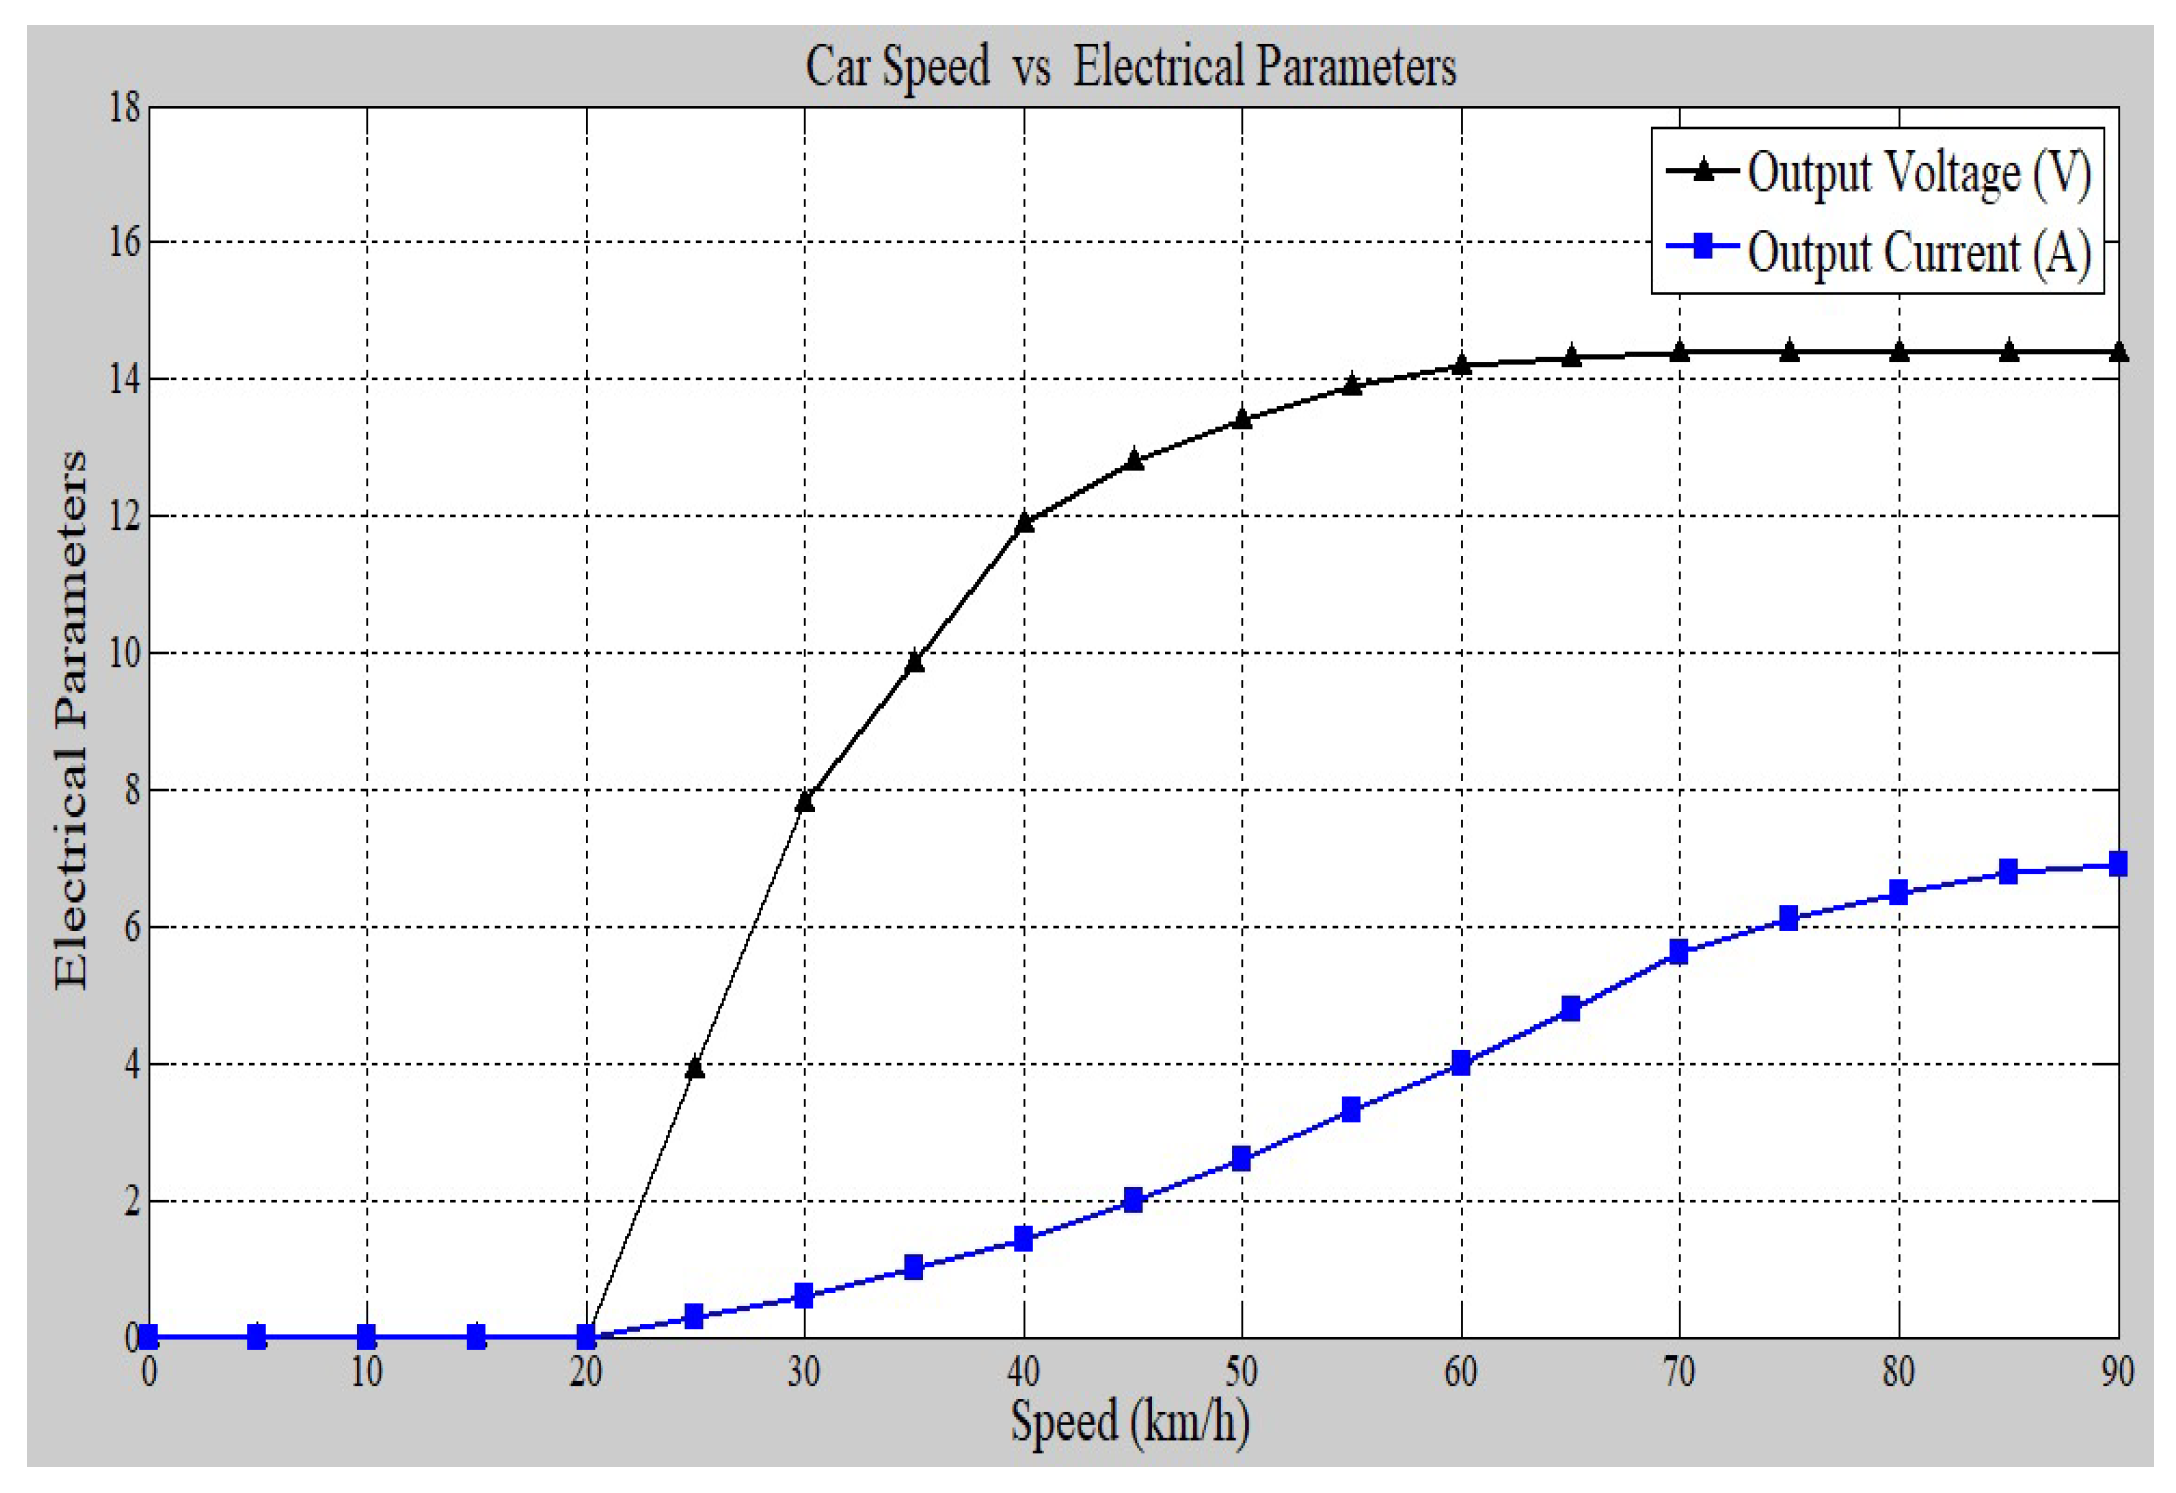
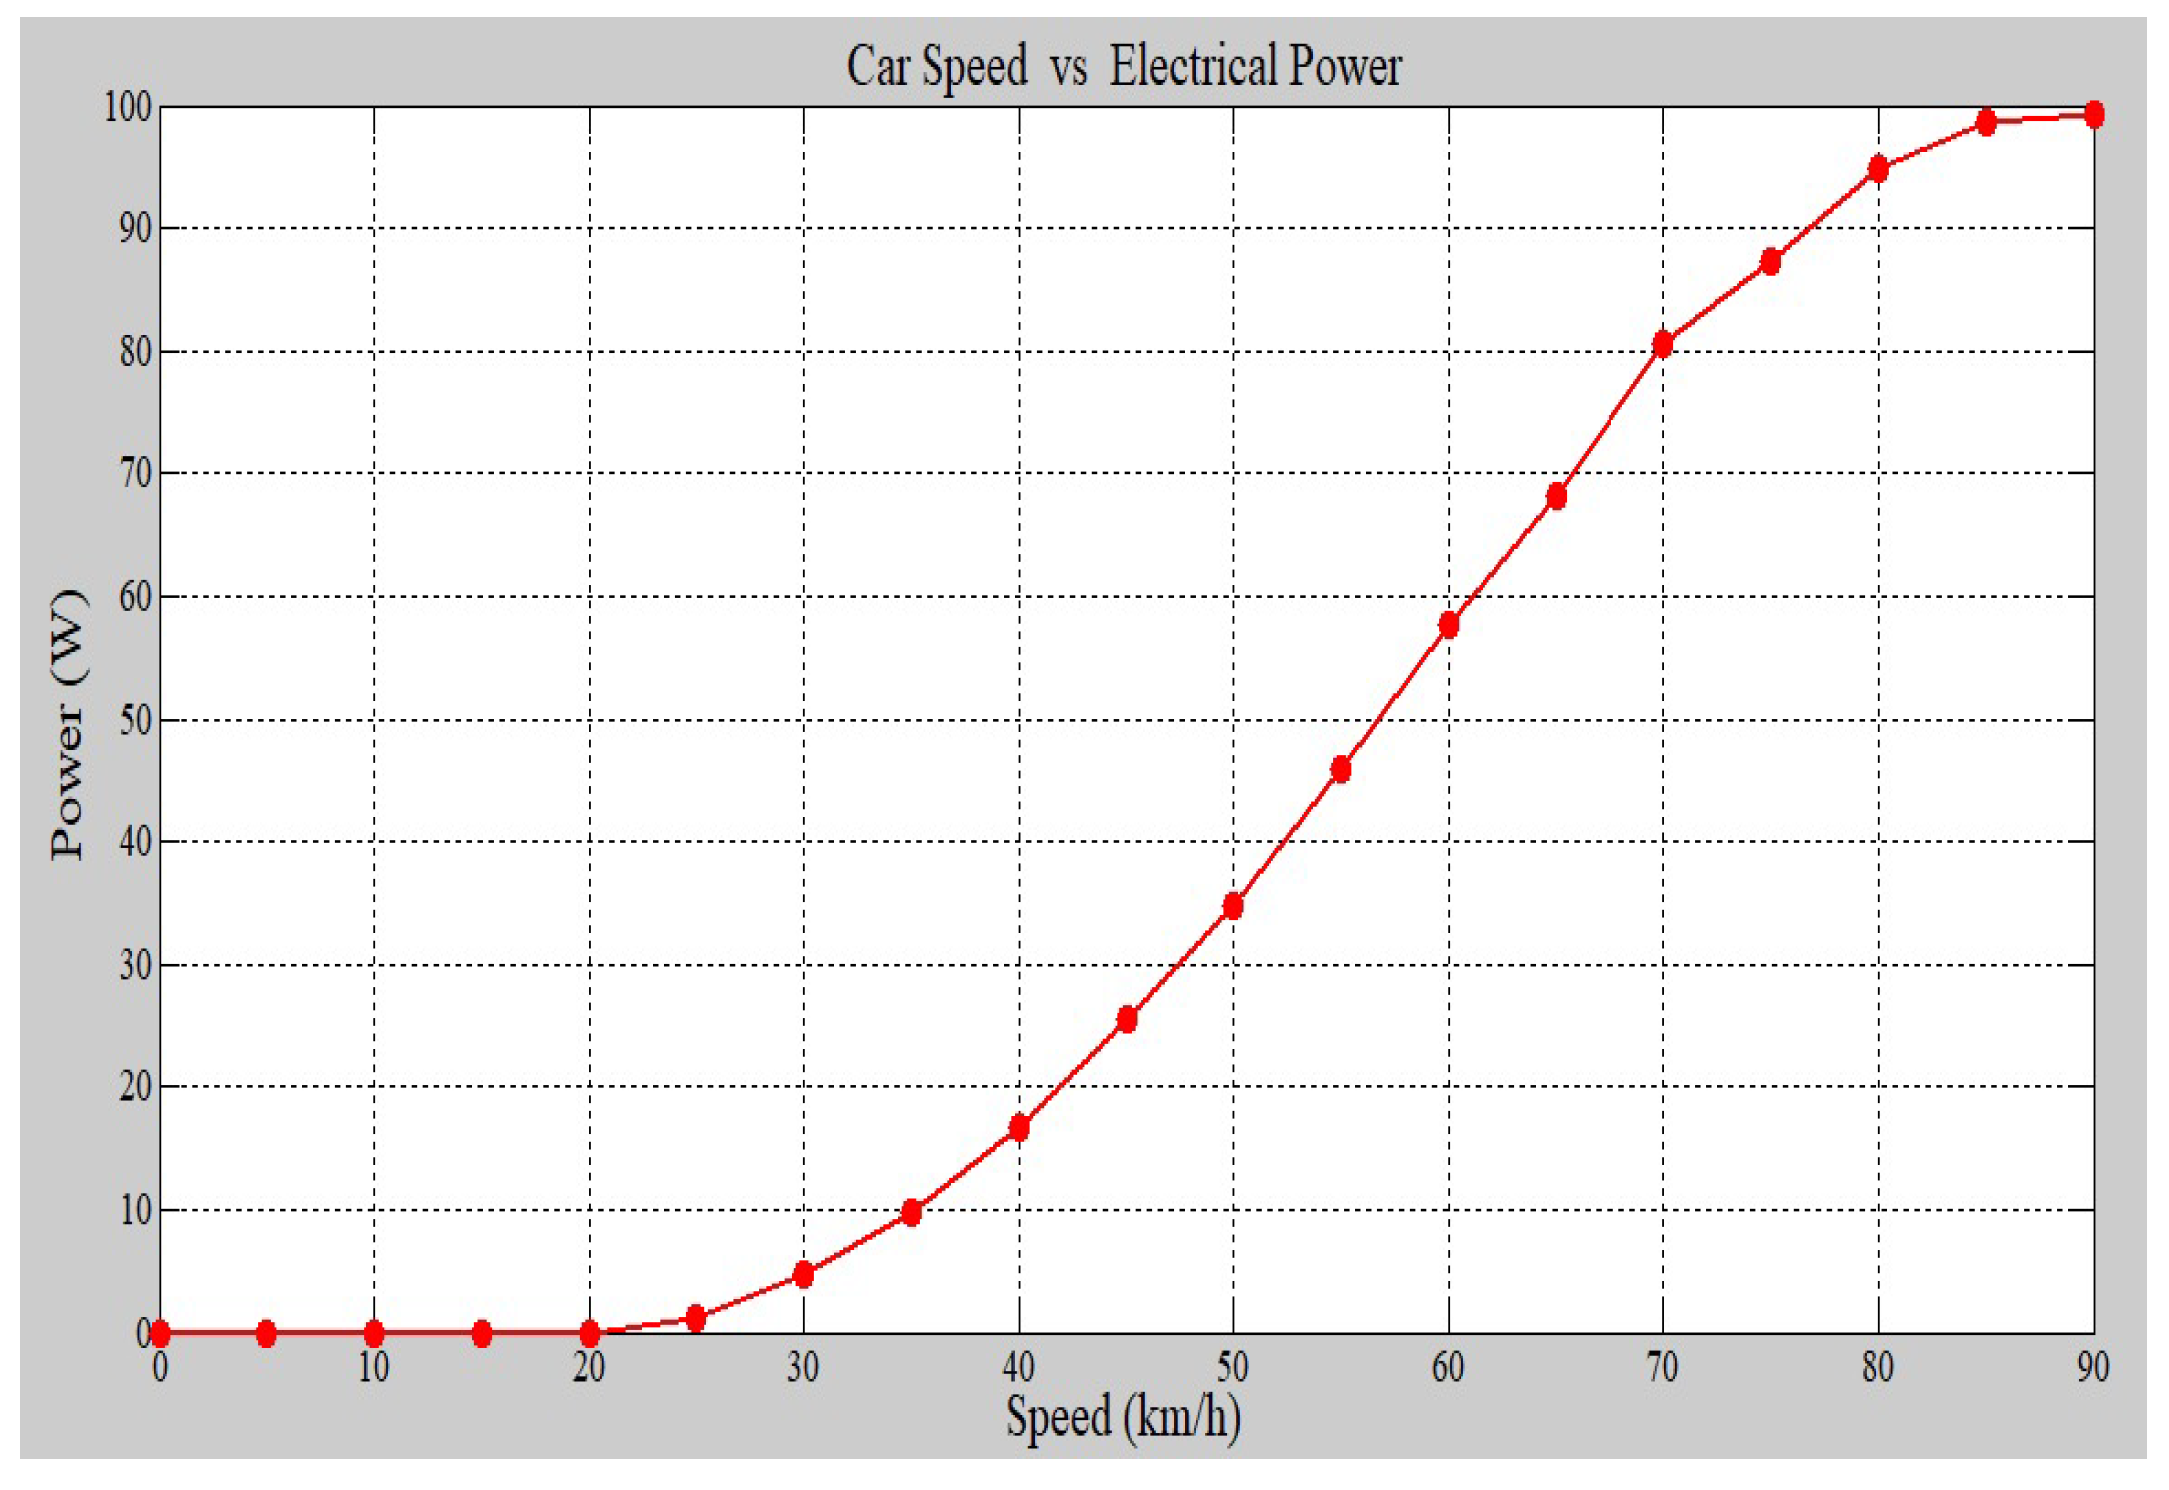
Figure 1) on the top of the vehicle that can support a range of communication primitives, enabling access to plenty of applications for the Internet of Vehicles. Electrical energy is then generated by the onboard DC generator. ANSYS-based aerodynamics analysis is used to determine the optimal power generation orientation. With no load, the voltage induced by the DC generator is 35 V, while when it is fully loaded, it produces 25 V at a rated current of 6.9 A, and generates 100 W (at constant voltage) at 90 mph for nominal battery charging. This study shows interesting results in terms of newly harvested energy, making it a cost-effective solution for a number of futuristic use cases in EVs.
The rest of this work is structured as follows. The overall system design is proposed in
Section 2. The complete methodology as well as system operation and monitoring through the Bluetooth module are presented in
Section 3. The results and a detailed discussion are provided in
Section 4, while
Section 5 demonstrates a complete system efficiency analysis. Finally, the concluding remarks are provided in
Section 6.
2. System Model
A sequential model of the system design is shown in
Figure 2 given below. The basic step is the extraction of wind using fan blades, connected with the Permanent Magnet DC (PMDC) motor which generates electricity upon the rotation of its shaft primarily caused by the collision of wind. The motor is connected with a DC regulator which provides a regulated DC output to the battery. This output is measured using the voltage sensor [
29] and the current sensor connected with Arduino. There is an LCD screen connected with the Arduino to display the electrical parameters of the regulated output. Then, the next phase is the protection circuitry which has two functions. One is the switching of electric power using a relay module [
30] being controlled by Arduino and the decision taken upon the basis of the percentage of the charge ratio of the battery. The other function of protection circuitry is to stop the flow of current from the battery towards the motor by using a power diode [
31]. After this, the electrical power is provided to the battery being charged. There is a Bluetooth module connected with Arduino to display the electrical parameters (voltage and current) on the mobile application.
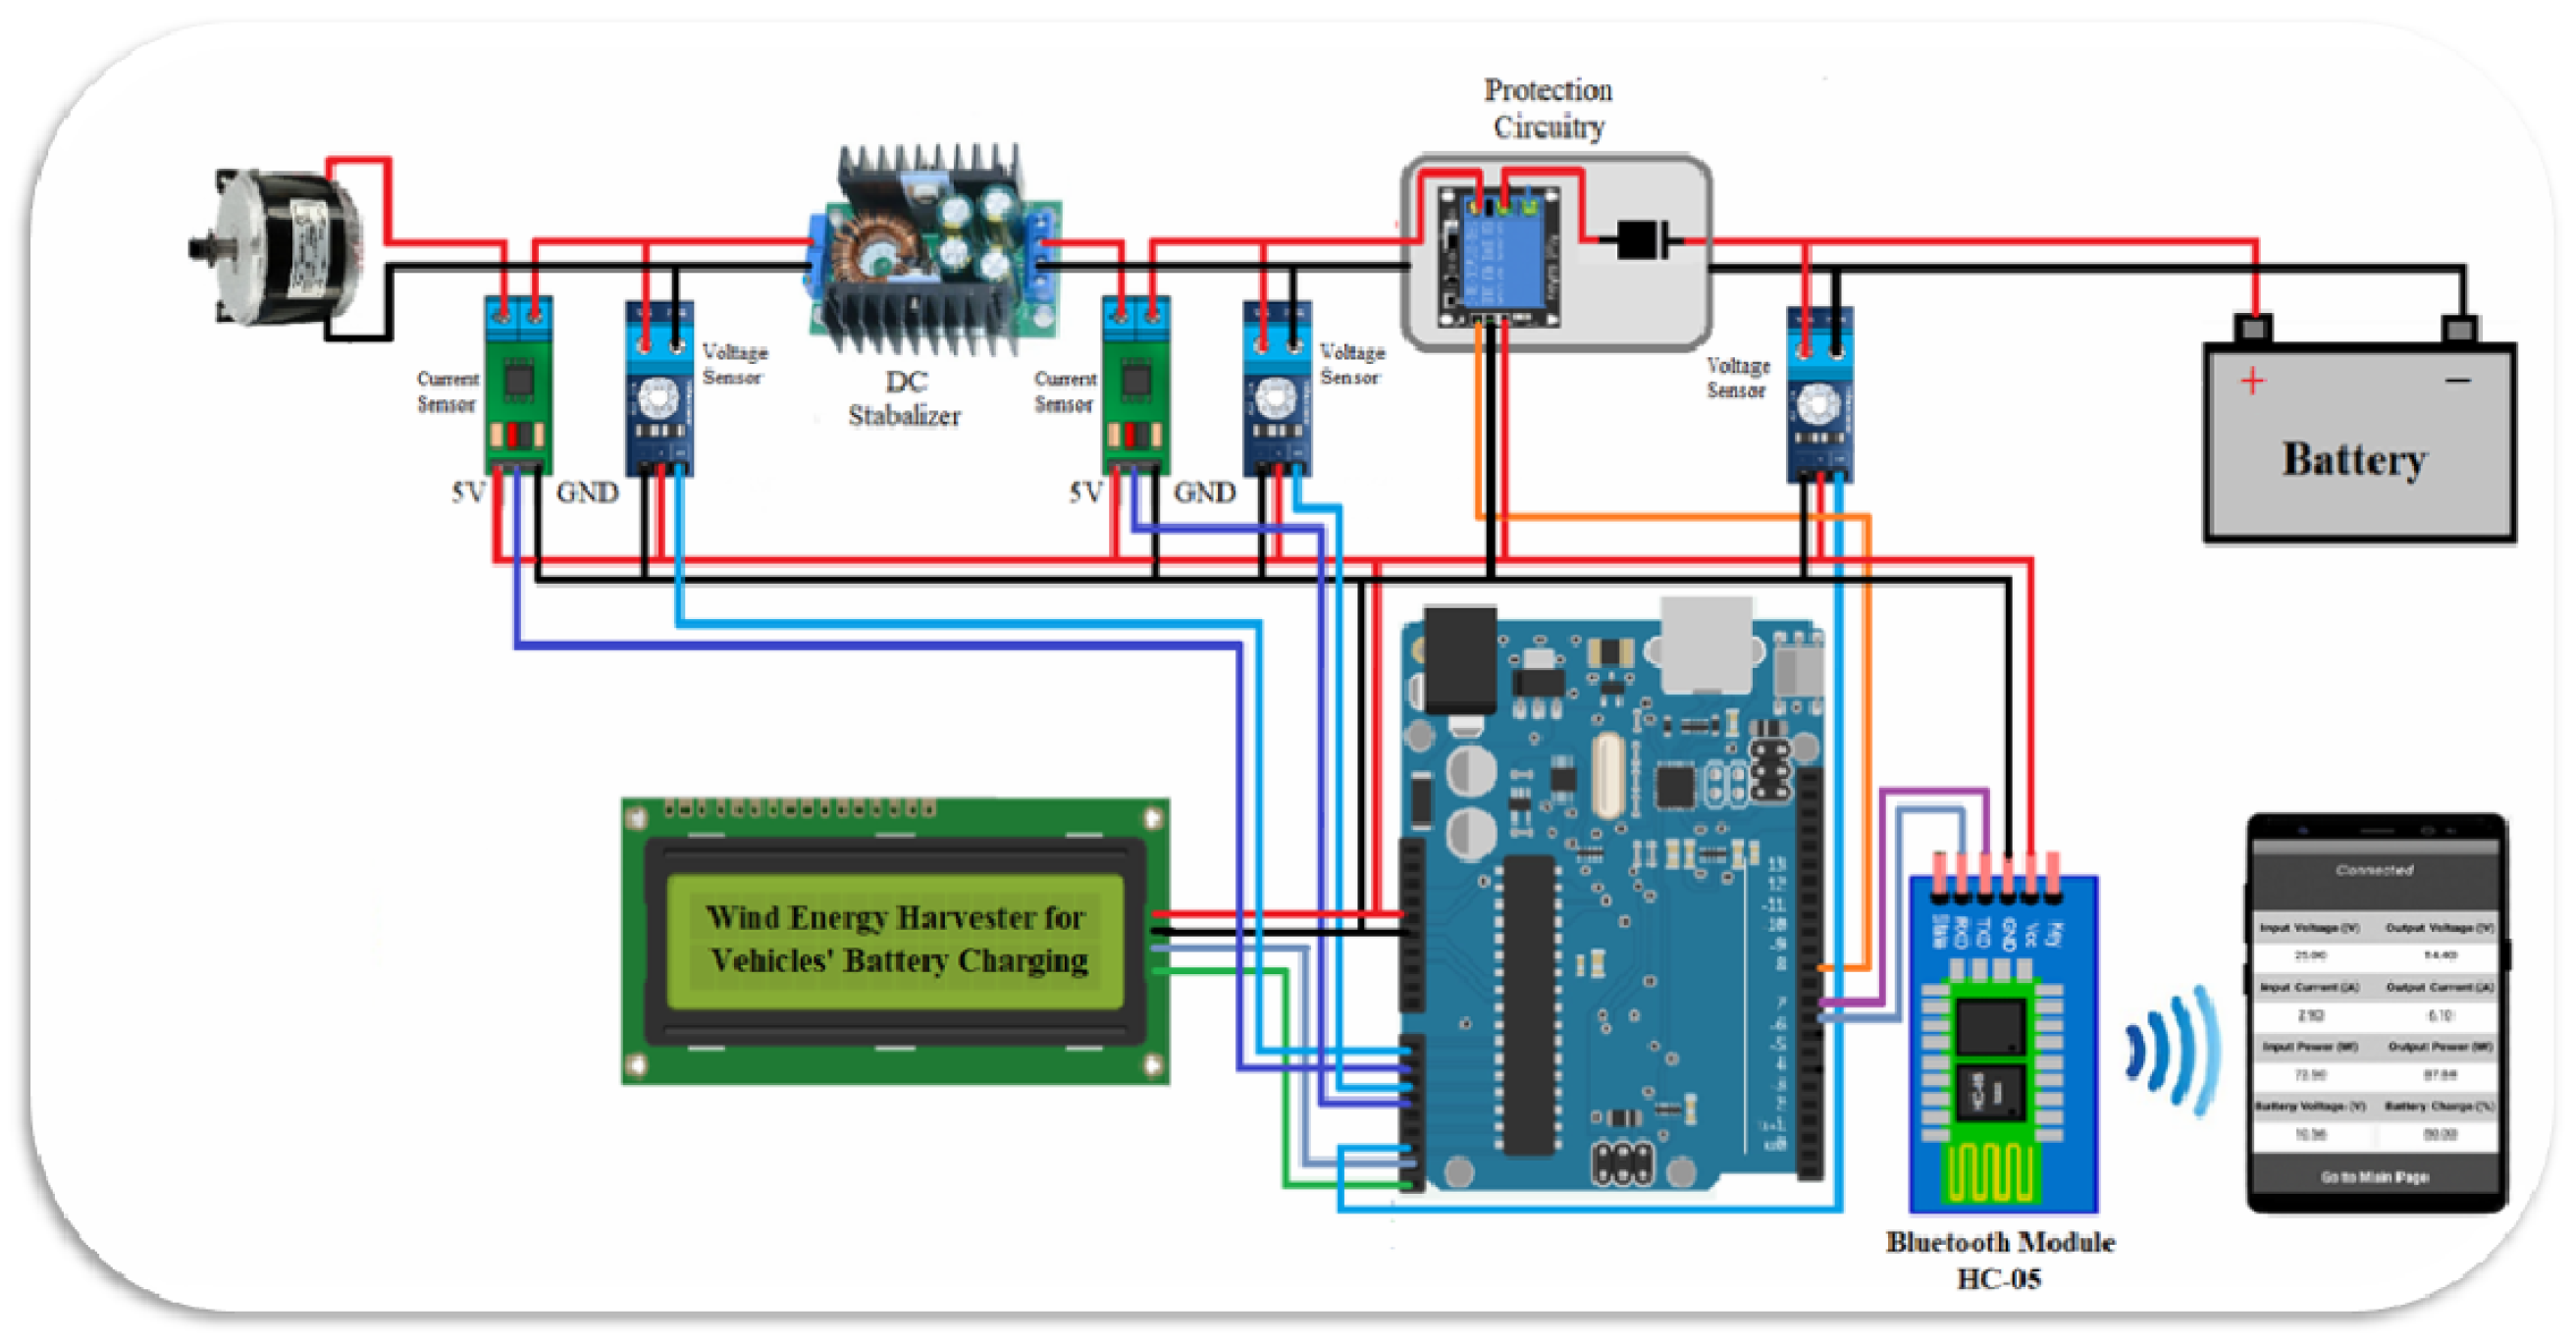
The architecture of the proposed model is demonstrated in
Figure 3. The first part of the system is a fan which is being used to convert the energy of the wind into the kinetic energy of the blades. This fan is connected with the shaft of the PMDC motor which, in turn, will rotate it. The DC motor will act as a generator which will generate electricity upon the rotation of its shaft. This generated electricity will be measured by using voltage and current sensors [
32] in parallel and series, respectively. The output of the DC motor will be fed to the DC regulator which regulates the generated output voltage. The output of the DC regulator is again measured using voltage and current sensors so as to calculate the voltage and current, respectively, and thus power. In this way, the input and output electrical parameters of the DC regulator are used to measure the efficiency of the regulator. After this, there will be a protection circuitry installed which contains a relay module and a diode. Arduino continuously measures the voltage across the battery to calculate the percentage up to which the battery has been charged. Based upon this calculation, the Arduino will decide whether to switch on the relay. If the voltage across the battery is between the minimum and maximum set voltages, the relay will be switched on—otherwise it will be off. From a VANET perspective [
33,
34], a mobile app operated via a Bluetooth module was also designed, which enabled us to obtain the results of the electric generation on the app for easy access to the data. Finally, the diode before the battery will allow the current to flow only towards it and will stop the current moving in the other direction.
2.1. Mathematical Modeling
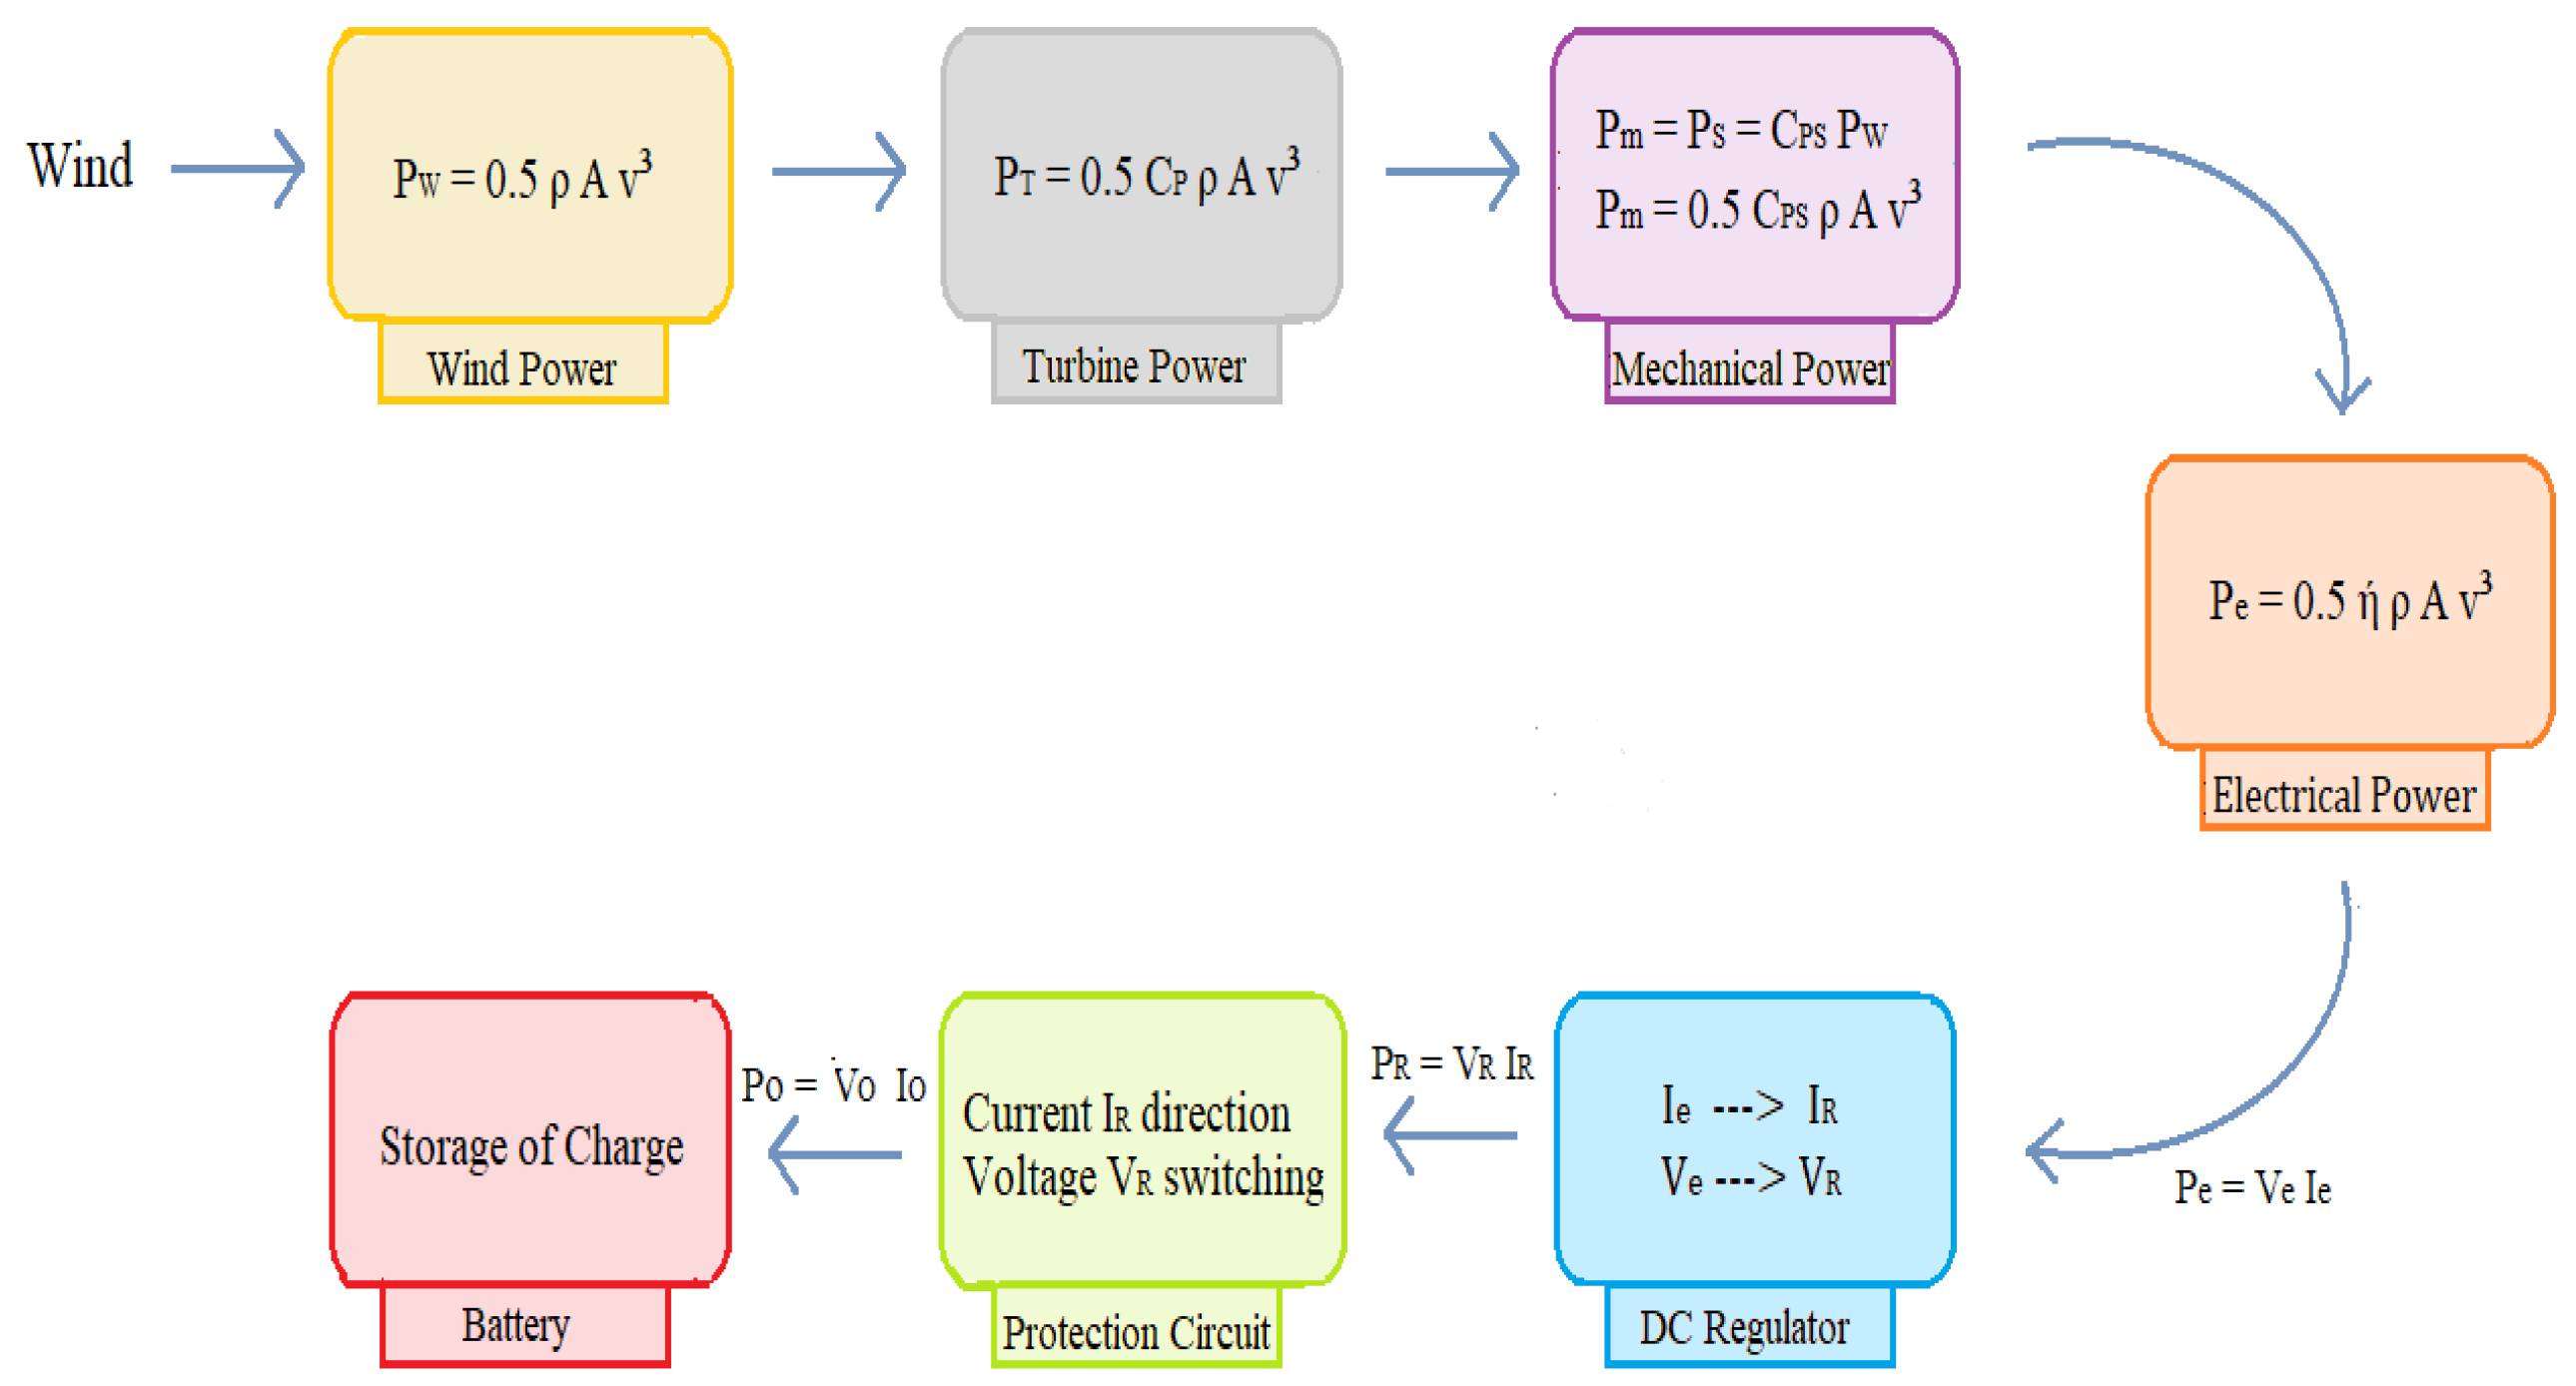
To make a charging system, certain parameters of the car and the electric unit for the production of the charge are required. From the mechanical aspects to the electrical parameters of the car charging system, the complete mathematical modeling of the system is required. The mathematical model of the system can be seen in
Figure 4.
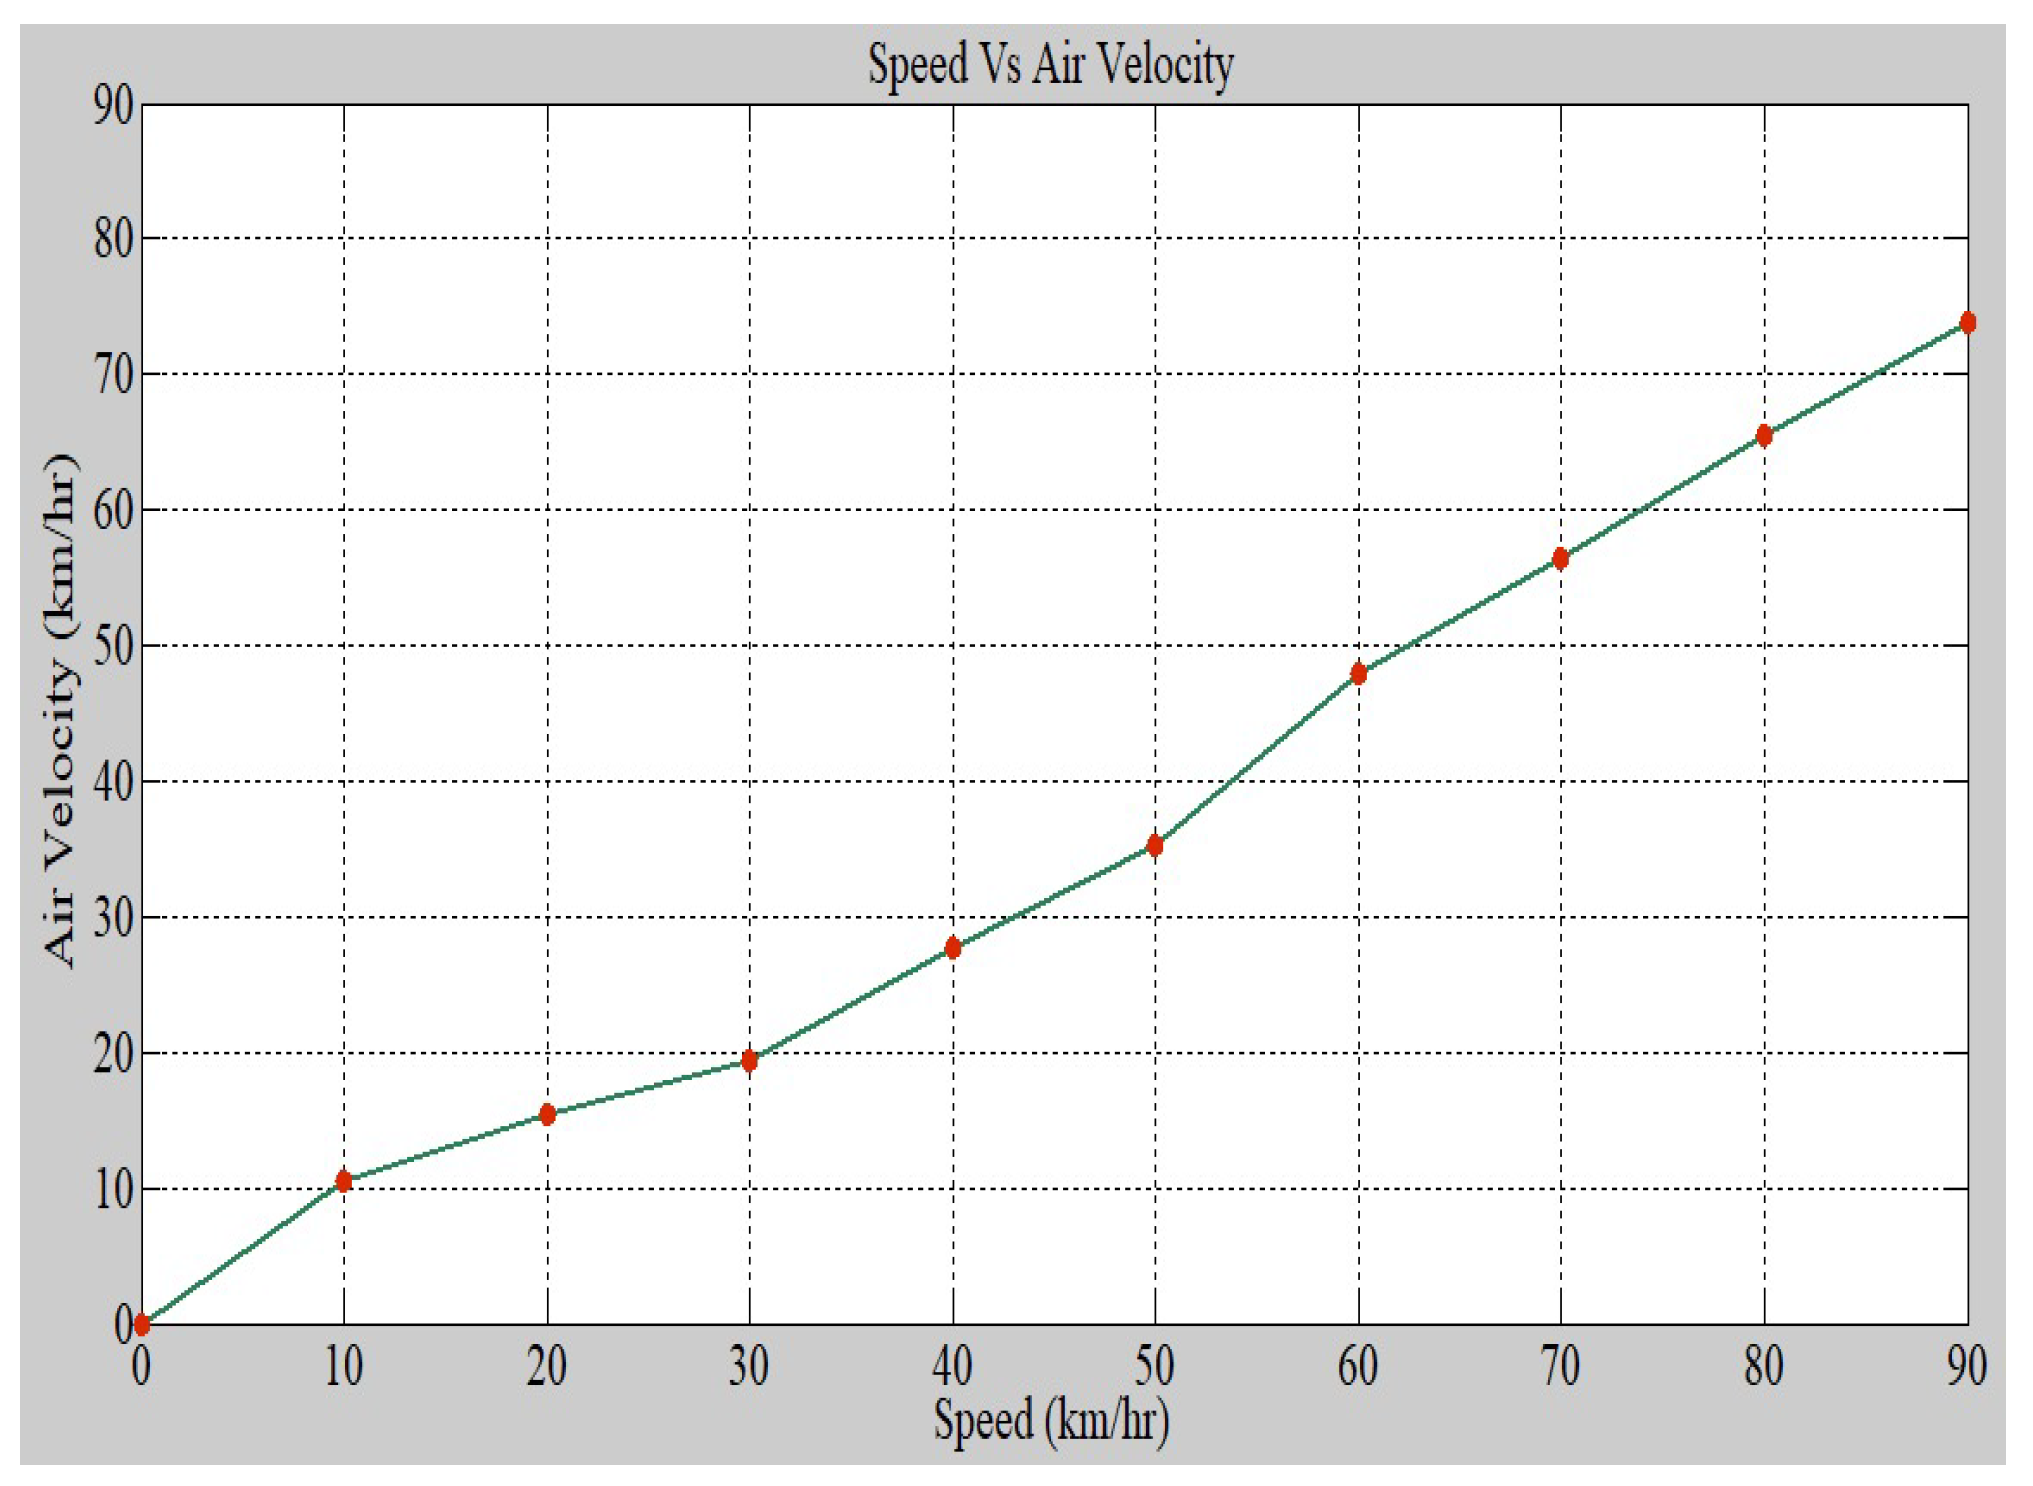
For the calculation of various stages of power generation, the first key parameter required is the cross-sectional area of the fan, which expresses the wind that will act on this surface for turbine rotation. Under the vehicle’s structural limitations, a bigger area means a larger exertion of air pressure. The second one is the air velocity that will be acting on the car due to the change in car speed: a faster car means higher air velocity.
2.1.1. Wind/Turbine Power
The air traveling with some velocity will exert kinetic energy on the turbine. Thus, by using Equation (
1), the kinetic energy (KE) of the system can be calculated, and now the turbine power generated from air depends upon the mass flow rate of air which is expressed in Equation (
2)—where
is the density of air, A is the area of the cross-section of turbine, and vs. is the air velocity [
35]. Now, the turbine power is equal to the kinetic energy exerted by air given in Equation (
3). The formula for the power generated by the turbine via wind power [
36] is given in Equation (
4), where
is the turbine power and
is the power coefficient for the turbine:
2.1.2. Mechanical Power
In order to find the shaft power, the first thing we need to determine is the shaft power coefficient. For this, we first need to determine the tip-to-speed ratio of the shaft which is determined by the formula:
where
B = 7 is the number of blades:
correlates to a power coefficient
.
With an augmentation of 0.2,
= 0.13 + 0.21 = 0.34, where
is the shaft power coefficient. Now, the mechanical power is equal to the shaft power that is:
For the turbine diameter of 0.36 m, the area of the turbine is determined by the formula:
2.1.3. Electrical Power
The shaft power induced in the shaft of the generator is transmitted to the generator for the induction process. This induction is responsible for the generation of electric power. The formula is given in given in Equation (
8), where
is the net efficiency of the generator. As power in corresponds to (speed and torque) and power out is relative to (speed and current), then the torque mechanical applied is relative to the current being drawn by the windmill. The torque on the rotor can be calculated by the formula of Equation (
9), where T is the torque and
is the angular velocity of the rotor. The
can be calculated by the formula given in Equation (
10), where R is the length of the fan blade:
2.1.4. RPMs and Angle of Twist
The blade angle of the twist is the angle at which blades are set to accumulate the maximum air pressure for effective generation, where N is the rotational speed of the rotor given in revolutions per minute (rpm) [
37], which can be calculated through the formula in Equation (
11):
2.1.5. Force Calculation
The force acting on the fan to operate is the difference between the two forces acting on it. One is the lift force (
), exerted by the air to rotate the fan expressed in Equation (
12):
but for every action, an opposite reaction is present. In this case, an opposite force emerges, which tries to restrict the fan from moving. This force is called drag force and is calculated by the following formula in Equation (
13):
where
and
are the lift coefficient and drag coefficient, respectively, and
is the fan surface area. Now, the total force on the fan is the vectorial sum of both forces, meaning that:
3. Methodology
As this research work brought novelty in terms of technology, there was a need to propose its design on the basis of a new analysis to be conducted. Thus, first of all, software-based simulations were used to make decisions regarding the hardware of the system. After this, the complete schematic was designed and the hardware was implemented. The components were connected in accordance with the proposed schematic. First of all, the wind turbine, whose output is given to the DC voltage regulator, has the current and voltage sensors on its input and output. The output of the DC voltage regulator is connected to the battery with a protection circuitry in its way. This protection circuitry is used to protect the battery from over-charging and low charging, by switching the circuit ON and OFF at suitable times. This decision is taken by Arduino. Moreover, this protection circuitry also stops the flow of current back from the battery towards the wind turbine. After this hardware was designed, implemented and tested for its working and it was assured that this hardware is ready to be used practically, it was then implemented on a car.
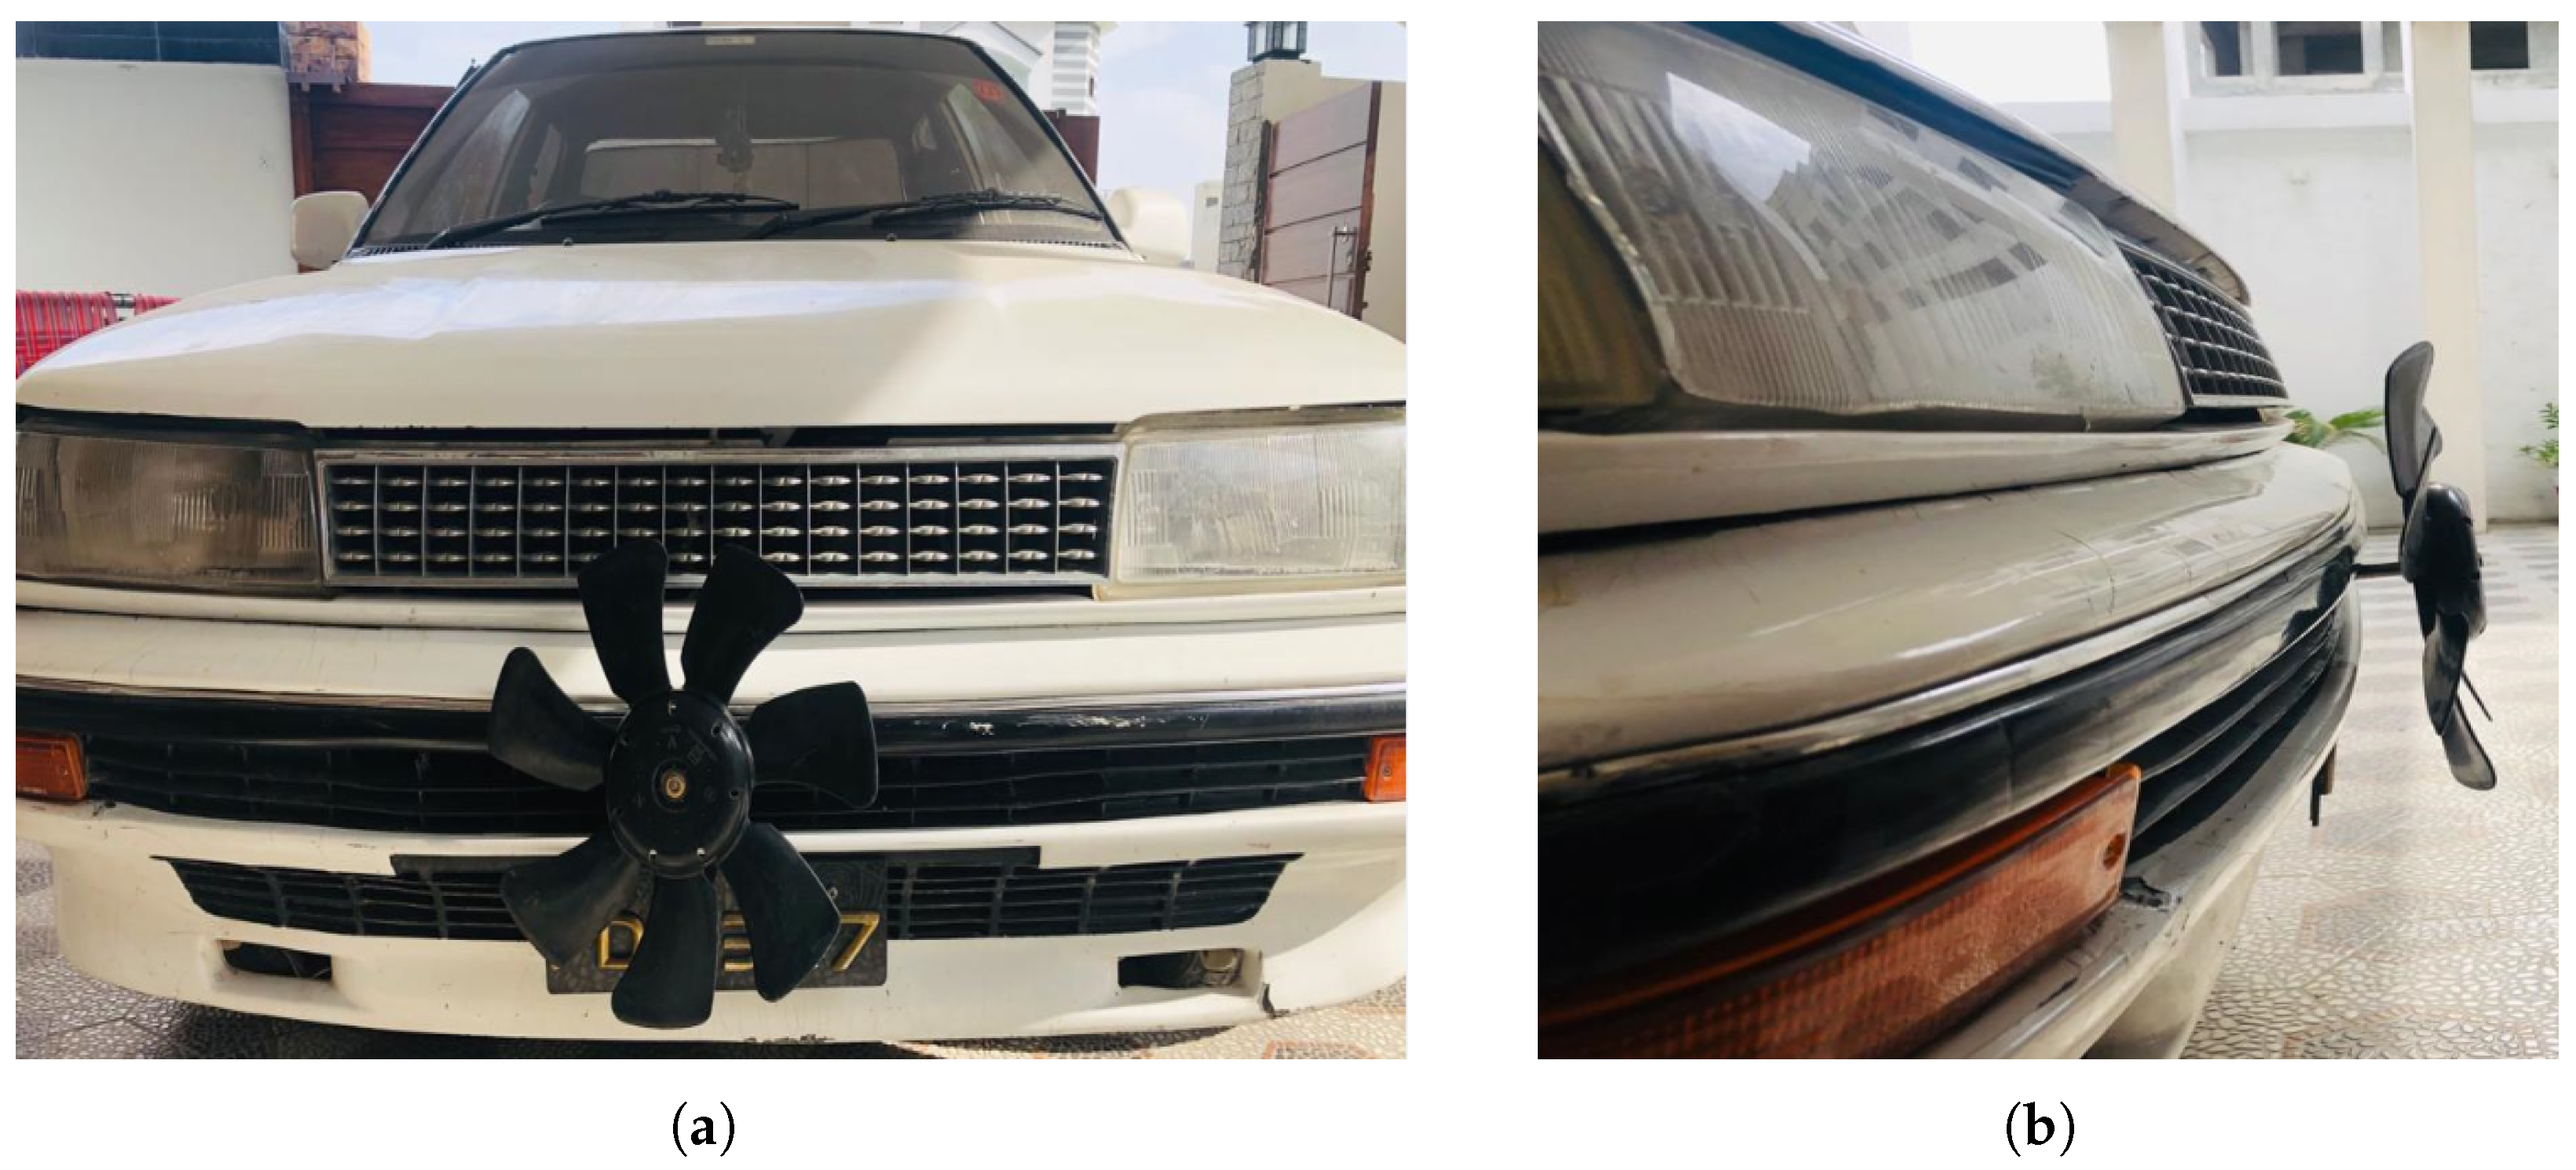
It can be noticed in
Figure 5a that the fan was mounted on the front of the car. Only the fan was out of the car’s body, as the air needs to strike the fan to rotate it and no other component, so it is necessary for the fan to be mounted outside the car body. Contrarily, the Permanent Magnet DC (PMDC) Motor was placed inside the car body as there should neither be any type of weight with a fan outside the car nor any drag force due to the placement of the motor. The output of the DC motor was connected to the rest of the circuit using DC wires, suitable for carrying the current through it from inside the car engine. Another view of the fan, mounted outside the car, can be seen in
Figure 5b.
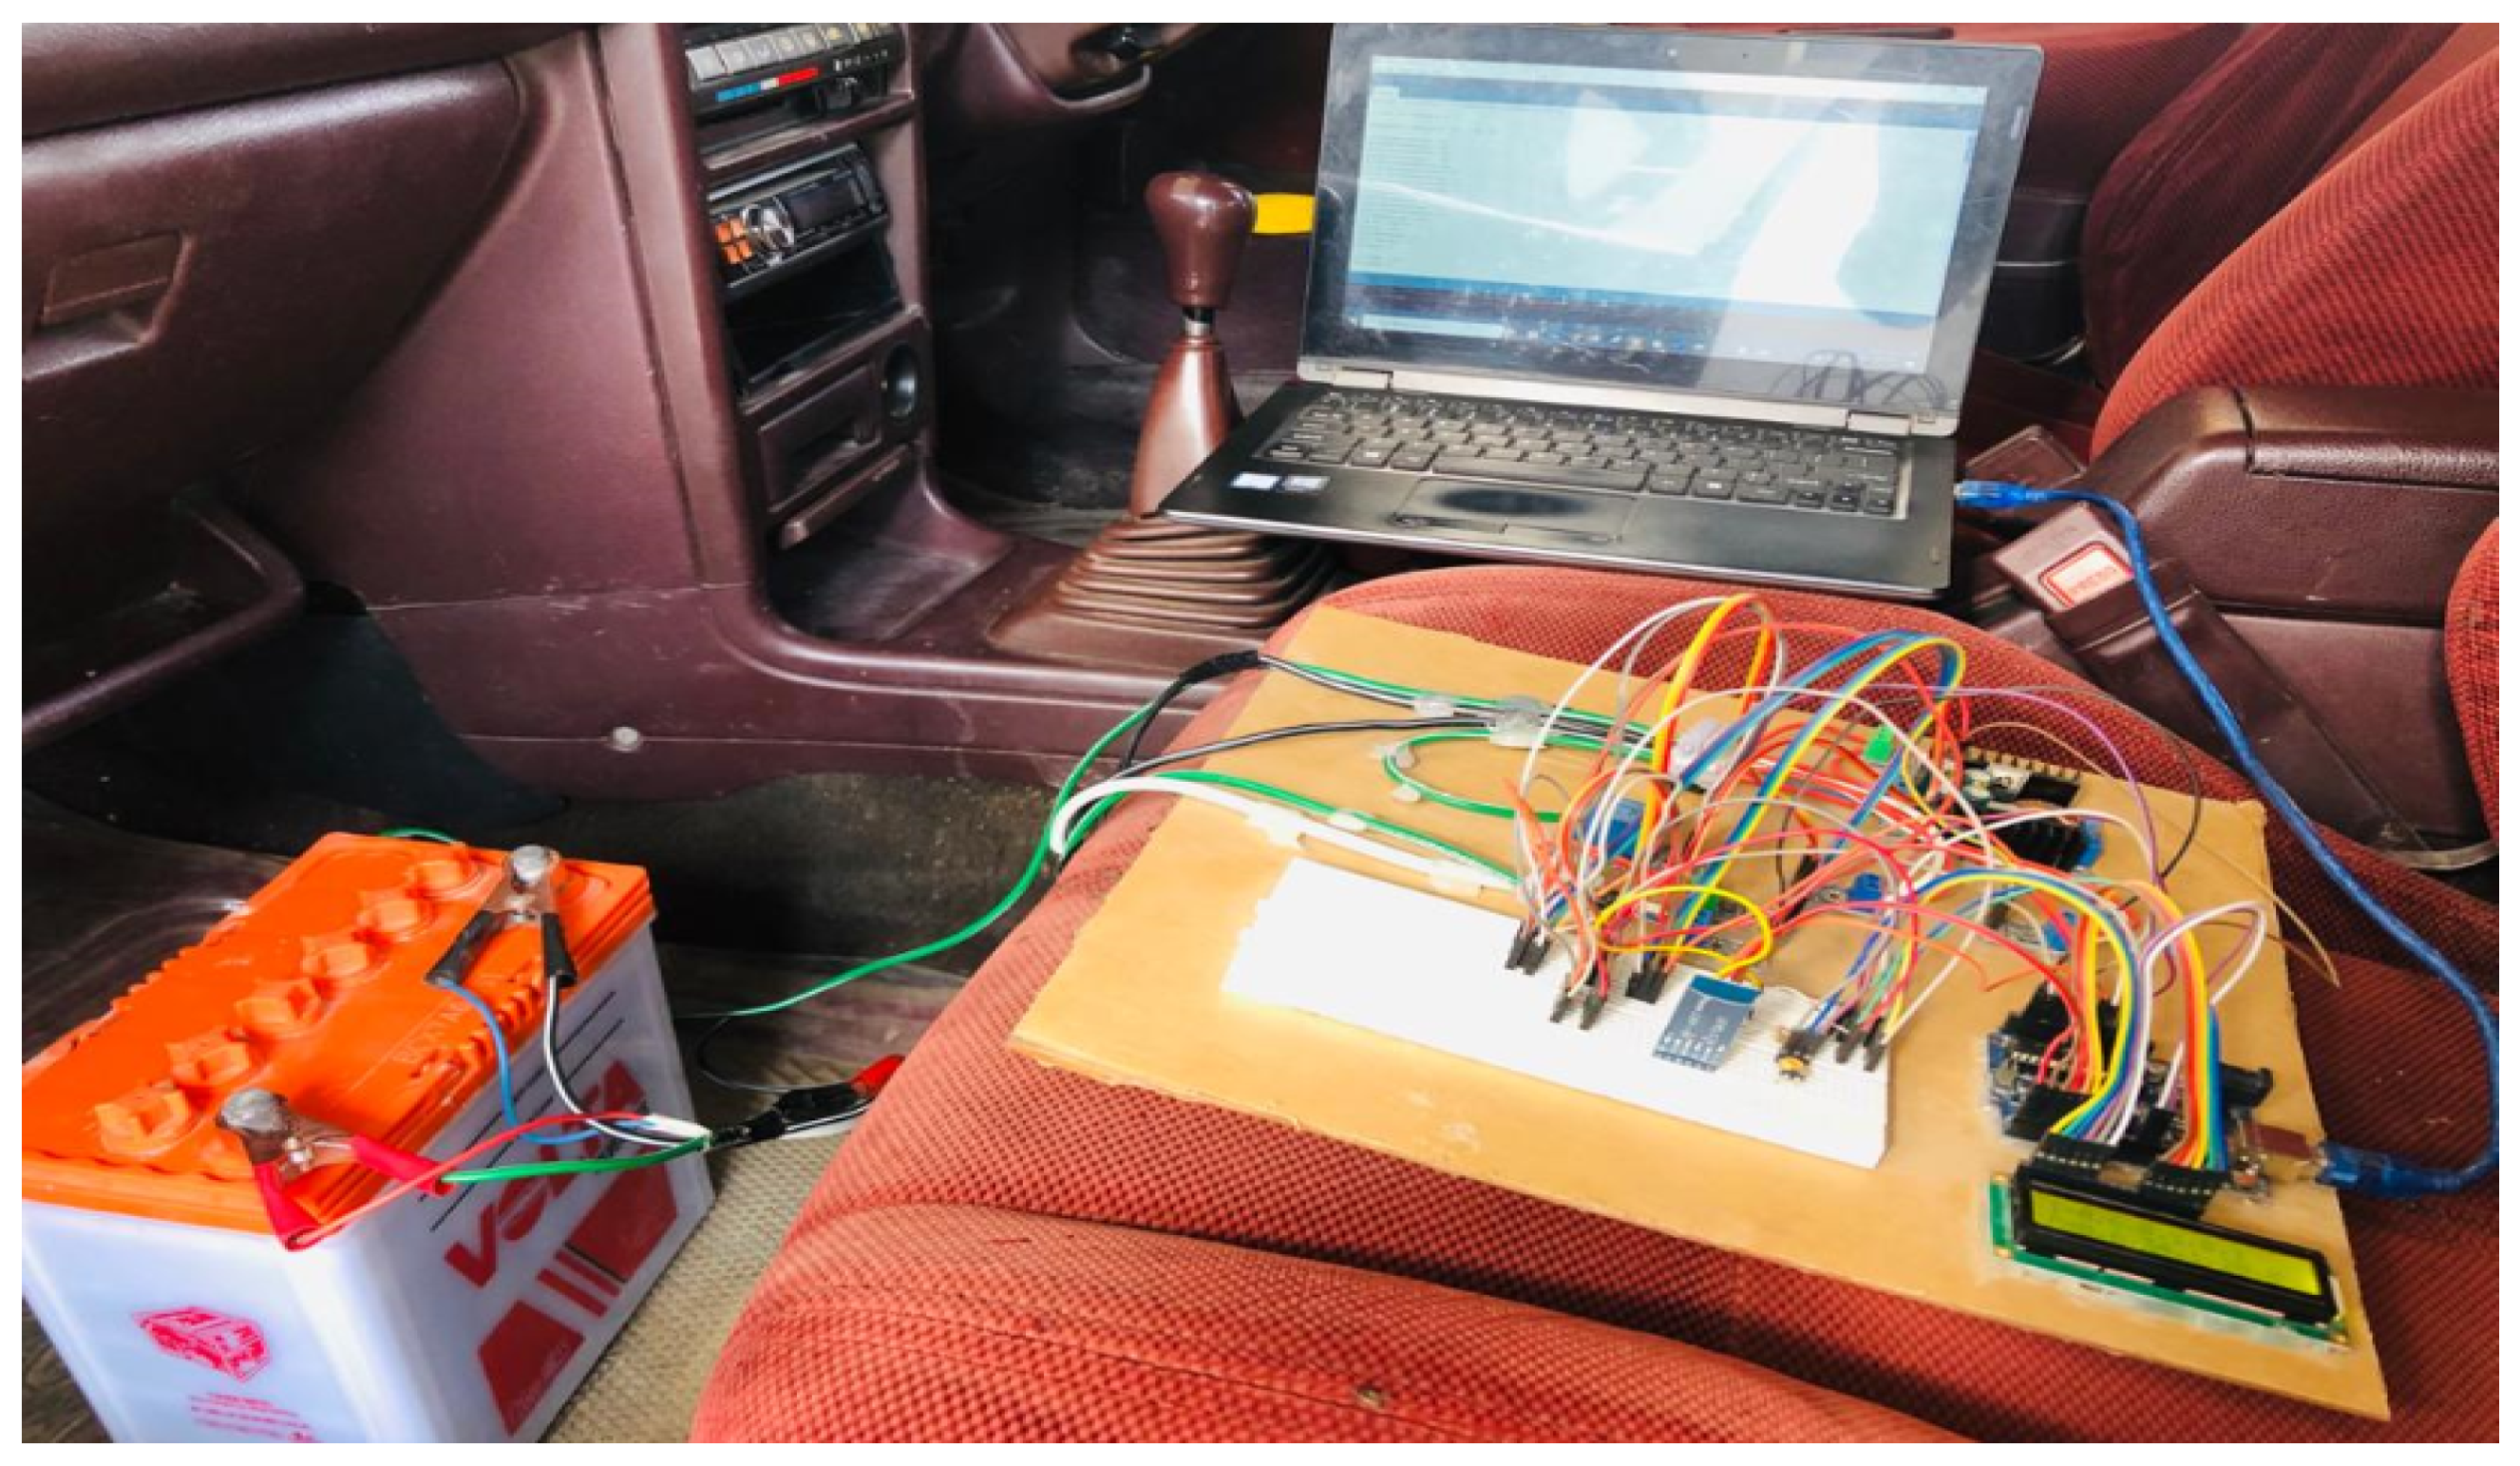
After the generation of electricity from the wind turbine, the output was supplied to the battery once it was stabilized, measured, and the protection was assured. The DC wires will take this electricity towards the rest of the system, which was placed inside the car. In
Figure 6, it is shown that the input is provided to the system for regulation, measurements, and protection work. After this, the output is supplied to the battery so it can be charged:
3.1. Bluetooth Monitoring via Android App
In a research study where something is being measured or calculated, there is a need to display it. As in this research article, the data were displayed in LCD using Arduino. Still, there was a need to have a display that was user friendly. Hence, an Android App was developed using the MIT App Inventor, which would display the input and output electrical parameters as well as the battery percentage. These data were sent to a mobile phone from Arduino via Bluetooth connection using a Bluetooth Module, HC-05. This objective of the research was performed after achieving all the milestones of the article and therefore brings this work to two different technologies:
3.1.1. Mobile Monitoring
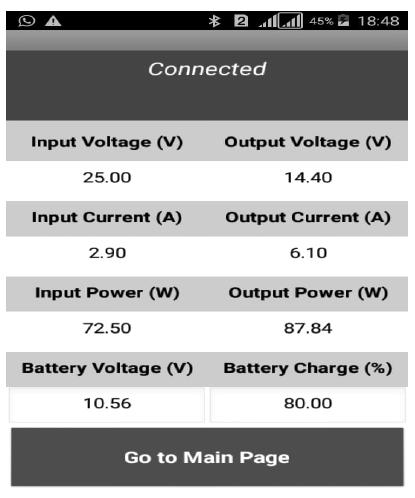
In this research, the car was driven and a wind turbine was used to generate electricity. This electricity was being measured and displayed on an LCD using Arduino. Furthermore, these data were being sent to the mobile phone of the user to be displayed there in an Android App, as shown in
Figure 7. This mobile monitoring was achieved using Bluetooth connection between the Arduino and the mobile phone.
3.1.2. Human–Machine Interface
As the measured data were displayed on the user’s mobile phone, it had to be made user-friendly. In this Android App to be installed on the mobile phone of the user, the user will be able to open the introductory part of the app, in which they will be able to see the author’s team and also watch the Demo Video of the work. Moreover, the user will be able to connect the mobile to Arduino and start receiving the information from Arduino via Bluetooth.
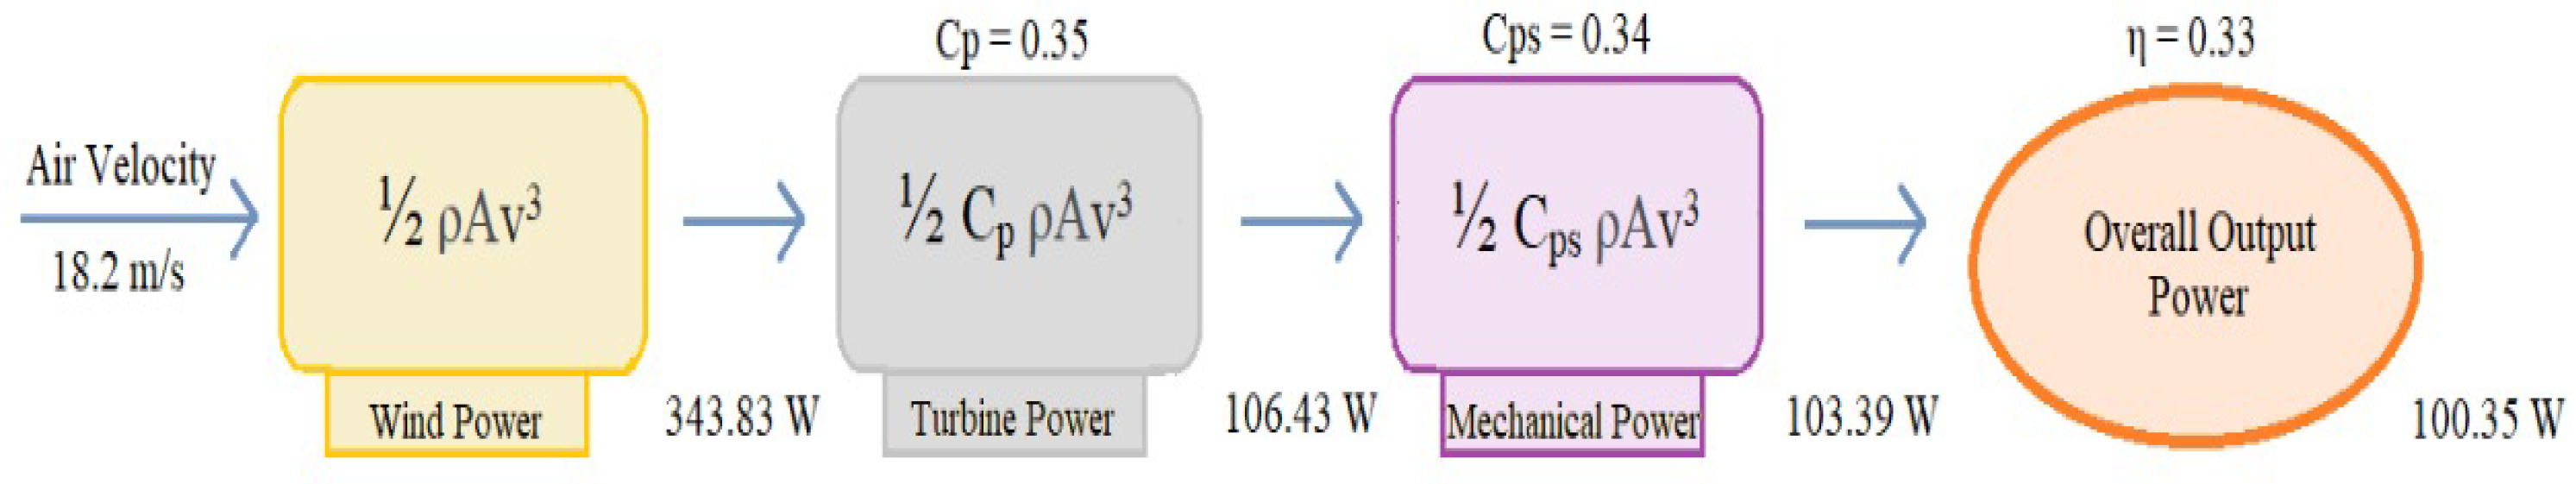
5. System Efficiency Analysis
This system efficiency analysis was performed so as to depict the energy conversion efficiency from wind to electrical form via different transformations. First of all, the air strikes the car with mobility. As the moving car has some velocity, the air also strikes it with some velocity, but the air velocity is less than the speed of car. Thus, the car keeps on moving in the forward direction. This shows that the work being performed by the car is greater than the work performed by the wind on the car. In this research, an approach to harvest an amount of energy is proposed by utilizing the air pressure striking the car.
This power can then become the turbine power after some losses. This power of the turbine is thus called because this is the energy caused by the wind turbine movement. Now, this rotating wind turbine has enough power to be used to do some useful work. Thus, this turbine is attached with a Permanent Magnet DC Motor, which has been used as a DC generator in this article, with the help of a mechanical shaft. This rotating wind turbine power will be transferred to the DC Motor and its rotor will start moving. It is important to note that the process also involves power losses during the transformation of energy from the wind turbine towards the motor.
The power available after all these transformations is the Mechanical Power which gives us an idea of how much work is being done by the generator (more specifically, by the rotor of the DC generator). As in this case, the work is being performed by the DC generator, as it will convert the mechanical power into electrical power. Electrical power is basically the measurement of the flow of current towards the load that is used for some purpose; in this case, it is a 12V lead acid battery. This electrical power, as given below, is directed towards the battery after some adjustments and protections. First of all, the DC voltages are regulated at a desired DC voltage so as to charge the battery at a constant voltage. Then, this electrical power is supplied to the battery to be stored after using protection circuitry so that it can be utilized later to feed a source.
Figure 16 and
Table 1 exhibit system’s efficiency at different stages of the harvesting process.
5.1. Betz Limit Analysis
As per Betz’s law [
40], no turbine can capture more than 16/27 (59.3%) of the kinetic energy in wind. The factor 16/27 is known as Betz’s coefficient. The Betz limit is based on an open-circle actuator. If a diffuser is utilized to gather extra wind stream and direct it through the turbine, more kinetic energy can be separated, however, the limit still applies to the cross-sectional area of the whole structure. According to the conducted analysis, the Betz limit efficiency is 30.3% for the turbine area of 0.0791 m. For a motor of 350 W power, the overall system efficiency is 28.5%. This could be improved by increasing the area of the diffuser, but keeping in mind that the Betz limit constraints are still sufficiently critical to influence the efficiency of the system.
5.2. Drag Coefficient Analysis
In a previous research work, which was based on the effect of a drag coefficient on the car in the presence of a charging device in various locations, the need for low or negligible drag force that would add up in the original drag force due to the charging system installation was emphasized. The results conclude that a harvesting system mounted on the front of a car bumper is a more suitable and promising point for maximum production and minimum drag compared to other positions of the car, as shown in
Table 2.
5.3. Power Generation Analysis
According to the results gathered during analysis, the total power per hour was calculated to be approximately 100 W, which is 28.5% efficient depending on the charging requirements of the battery. As per the motor configuration, the average power that can be produced by it is in between 15% and 35% of the total power. Keeping this information, it can be concluded that the power efficiency that was acquired is among the favorable requirements.
5.4. Battery Discharge Time with Respect to Car Loads
As shown in
Table 3, the more frequently used electrical loads of a car along with their power and current ratings are discussed and on this basis, the rightmost column was determined by driving. This column basically shows the time required to discharge a fully charged 40 Ah battery when each load is connected to it. These loads are of different types. The first one is the lighting loads which include the headlights, back lights, and the hazard lights. Secondly, body electrical loads include the power window and the wiper/washer system. The third type is media which includes video/audio systems, the navigation and GPS systems. Another type is the HVAC loads including the air compressor of the car.
The purpose of this analysis was to verify the capability of the proposed system to overrun the loads of a car on which it is installed. Considering the electricity generation, a statistical approach was used to estimate which loads of a car can be driven on a fully charged 40 Ah battery—charged using the proposed system. Moreover, if each of them is connected to the battery, how much time will be required to use the battery completely? The answer to this is in the rightmost column. Afterwards, a very important analysis was performed. If all the loads excluding the air compressor were left to run on the battery with the specifications mentioned above, then it would keep them running all these loads for approximately half an hour, i.e., 0.52 h (31 min). However, if the air compressor was included in the loads being driven over the battery, it can still keep all these loads running for approximately 0.34 h, i.e., 20 min.
It is also pertinent to see whether a proposed system is capable of supporting the loads mentioned in
Table 3. We covered all these loads one by one to understand each of them. The back lights and the hazard lights are those which could directly be supported by the proposed architecture while leaving some surplus energy. The headlights, power windows, and wiper washer system are the loads that could be supported with the full generated power being utilized, i.e., without leaving any extra energy. As far as the air compressor, the navigation and GPS systems are concerned, the harvested energy is not ample enough to support them with a direct supply. They will require an additional external electric supply as well. Moreover, the available power would be 20% and 40% of the power ratings of the air compressor and navigation/GPS system, respectively. This will help reduce their dependency on the battery or grid power. Hence, it can be concluded that the proposed system generates an ample amount of energy to directly support the frequently used loads of a car, i.e., without needing to employ a battery.
5.5. Design and Cost Analysis
As a major objective of our research, the positioning of the fan was a vital aspect of our analysis. The experimental results have shown a considerably better performance than the procedures used in previous papers. This proves our theory that the front position is the perfect spot for the adjustment of the wind turbine system for maximum utility. The fan used for wind generation worked satisfactorily with the given motor and circuit parameters. As a whole, the complete study including the hardware material for practical analysis was very cost-effective. All the materials required for the testbed work were available in the local market and were cheap to buy, while also ensuring their precision and durability. As a team, it is our strong belief that in the future, if an industrial version is created, the end product will be very user friendly in terms of cost.


 ,
, 


