Article

Shrinking-Core Model Integrating to the Fluid-Dynamic Analysis of Fixed-Bed Adsorption Towers for H2S Removal from Natural Gas

Grupo de Investigación Aplicada en Materiales y Procesos (GIAMP), School of Chemical Sciences and Engineering, Yachay Tech University, Hda. San José s/n y Proyecto Yachay, 100119 Urcuquí, Ecuador
*
Author to whom correspondence should be addressed.
Energies 2021, 14(17), 5576; https://doi.org/10.3390/en14175576
Submission received: 7 July 2021 / Revised: 30 July 2021 / Accepted: 1 August 2021 / Published: 6 September 2021

Abstract

:
Natural gas sweetening is an essential process within hydrocarbon processing operations, enabling compliance with product quality specifications, avoiding corrosion problems, and enabling environmental care. This process aims to remove hydrogen sulfide (H2S), carbon dioxide, or both contaminants. It can be carried out in fixed-bed adsorption towers, where iron oxide-based solid sorbent reacts with the H2S to produce iron sulfides. This study is set out to develop a fluid-dynamic model that allows calculating the pressure drop in the H2S adsorption towers with the novelty to integrate reactivity aspects, through an iron sulfide layer formation on the solid particles’ external skin. As a result of the layer formation, changes in the particle diameter and the bed void fraction of the solid sorbent tend to increase the pressure drop. The shrinking-core model and the H2S adsorption front variation in time support the model development. Experimental data on pressure drop at the laboratory scale and industrial scale allowed validating the proposed model. Moreover, the model estimates the bed replacement frequency, i.e., the time required to saturate the fixed bed, requiring its replacement or regeneration. The model can be used to design and formulate new solid sorbents, analyze adsorption towers already installed, and help maintenance-planning operations.

Graphical Abstract

1. Introduction

Natural gas is a mixture of light hydrocarbons in a gaseous state composed mostly of methane (C1), ethane, propane, butanes, and heavier compounds. It also contains water vapor, carbon dioxide (CO2), hydrogen sulfide (H2S), and nitrogen, which are considered impurities [1]. Hydrogen sulfide is an acid gas, highly corrosive in the presence of water, and a very toxic compound [2]. The H2S presence in natural gas streams or petroleum refinery streams can generate operational problems in pipelines and equipment.
When a natural gas stream contains an unacceptable H2S concentration (>4 mole ppm), it must be subjected to a sweetening process to remove the H2S excess and meet market specifications. Common processes used for H2S removal are chemical absorption, physical absorption, direct conversion, membranes, and adsorption [3,4]. In natural gas production and processing facilities (both onshore and offshore conditions), the usage of adsorption towers for H2S removal has been reported [5,6]. The H2S adsorption towers are vertical vessels containing a fixed bed traversed by a natural gas stream, and which provide solid-gas surface contact where the H2S removal occurs [7].
The most commonly used solid sorbents in the oil and gas industry contain iron oxides due to high H2S adsorption capacity and their significant abundance in nature [8,9,10]. The typical chemical reactions that can occur with hydrogen sulfide at room temperature are as follows:
Fe3O4(s) + 6H2S(g) → 3FeS2(s) + 4H2O(l) + 2H2(g)
Fe2O3(s) + 3H2S(g) → Fe2S3(s) + 3H2O(l)
The above reactions consider only Fe3O4 (magnetite) and Fe2O3 (hematite) as the iron oxides responsible to carry out the displacement reactions in the solid state with hydrogen sulfide. The reactions produce different iron sulfides on the solid sorbent surface with water as a reaction product [11]. Today, the H2S adsorption mechanism on iron oxides is still being studied [12,13,14,15] from the investigation of compilation collections made by Meyer et al. [16]. Some authors agree that the iron sulfides monolayer formation is the determining reaction step [17,18].
The progressive conversion model and the shrinking-core model are commonly used to describe how the non-catalytic heterogeneous reaction processes occur between solid particles and a gaseous fluid; this is the case for the H2S removal process using solid sorbents in fixed-bed adsorption towers [13,19]. The shrinking-core model describes that the chemical reaction occurs first at the solid particles’ external skin. The reaction zone then moves inside the solid, leaving behind completely converted material and inert solids. Thus, at any time, there exists an unreacted core of material that shrinks in size during the chemical reactions [20].
The fluid-dynamic analysis in a fixed-bed adsorption tower agrees to estimate operational aspects, such as the pressure drop across the adsorption tower and the replacement time of the solid sorbent [21]. From an engineering point of view, it is well known that the Ergun equation allows estimating the pressure drop of a gaseous stream passing through a fixed-bed as a function of both the natural gas properties and the solid characteristics [22]. The Ergun equation is as follows:
d P d z = G ρ D p · ( 1 ϕ ϕ 3 ) · [ 150 ( 1 ϕ ) μ φ 3 2 D p + 1.75 G φ 4 3 ]
where P is the pressure, z is the fixed-bed height, G is the natural gas mass velocity per cross-section area, μ and ρ are the viscosity and density of natural gas, D p and φ are the particle diameter and sphericity of the solid sorbent, and ϕ is the bed void fraction. The last one corresponds to the empty volume in a fixed-bed adsorption tower.
The Ergun equation only delineates the gas stream passage across a porous solid bed [23]. Additionally, it does not consider the chemical reactions that could take place between the gas stream and solid particles making up the fixed bed, as occurs in the H2S adsorption towers. To the best of our knowledge, fluid-dynamic analysis studies in this type of adsorption tower considering the solid sorbent’s reactivity aspects have not been reported. The present study is set out to develop a fluid-dynamic model that estimates the pressure drop in adsorption towers for H2S removal from natural gas, with the novelty of integrating reactivity aspects between the H2S and solid sorbents. This model considers the formation of an iron sulfide layer as an engineering application of the shrinking-core model and the H2S adsorption front variation in time. As a result of this layer’s formation, the particle diameter and the bed void fraction of the solid sorbent change; consequently, the pressure drop within the fixed bed increases. A detailed description of the developed reactivity model is carried out. Experimental data from the literature on pressure drop at the laboratory scale and large scale are used to compare and validate the proposed model. Furthermore, case studies are proposed to show how solid sorbent properties influence the pressure drop within the adsorption towers. Additionally, the model allows quantifying the time required to saturate the fixed bed within the adsorption towers (repositioning time).

2. Reactivity Model Development

The H2S removal is carried out in a cylindrical vessel (total height ( L ) and diameter ( D ) are known) in a vertical position, where the natural gas stream enters through the upper part of the tower. The fixed-bed behavior in the adsorption process can be explained as follows (Figure 1). At the beginning, the adsorption tower is thoroughly free of contaminants; the natural gas begins to circulate continuously through it, and the upper layers of the fixed bed start to react with the H2S at point (a). Once these upper layers are saturated, the adsorption process migrates to the layers below them until they are also saturated, and the adsorption zone changes from point (b) to point (c). The adsorption zone moves from the top of the fixed bed to the bottom. At point (d), the adsorption zone reaches the bottom, and the H2S output concentration increases rapidly to equal the inlet concentration. This indicates that the solid sorbent has been saturated and needs to be replaced or regenerated [3,4].
To integrate the shrinking-core model to the fluid-dynamic analysis of fixed-bed adsorption towers for H2S removal from natural gas, the following premises and assumptions were considered:
  • Pressure drop calculations are performed using the Ergun equation (3), considering the sphericity as a factor that describes the particles’ geometry. A completely spherical particle corresponds to perfect sphericity ( φ = 1 ) , while the more irregular that particle is, the lower the sphericity [24,25].
  • The natural gas properties (mole composition ( y i ) , flowrate ( Q ) , temperature ( T ) , and pressure ( P ) allow quantifying its viscosity and density at operating conditions, using the Peng–Robinson [26] equation of state and the Jarrahian and Heidaryan [27] mathematical adjustments, respectively.
  • The solid sorbent is iron oxide-based [17,18], with known physical and chemical characteristics (adsorption capacity ( A C s o r b e n t ) , particle diameter ( D p ) , sphericity ( φ ) , bed void fraction ( ϕ ) , and bed density ( ρ b e d ) . The adsorption capacity refers to the H2S amount that the solid sorbent can remove, i.e., the maximum ratio H2S quantity that the total mass of the sorbent can retain. The H2S composition ( [ H 2 S ] i n ) in the sour gas and the solid sorbent adsorption capacity determine the total amount of sorbent required in an adsorption tower to meet H2S composition ( [ H 2 S ] o u t ) in the sweet gas stream.
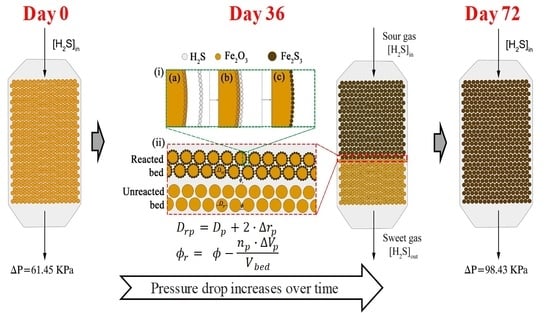
  • The reactivity between hydrogen sulfide and solid sorbent is modeled, taking as a reference the chemical reaction (2) of the hematite (Fe2O3) structure, with the formation of iron sulfide (Fe2S3) and water as reaction products. It is well- known that the hematite structure has a significant affinity to react with H2S. The reaction can occur at room temperature, and it also can be reversible. Due to these characteristics, hematite is commonly used to formulate iron oxide-based solid sorbents for H2S removal [28,29].
  • The shrinking-core model is considered to describe the formation of an iron sulfide monolayer at the solid particles’ external skin. It is considered to be distributed evenly over the entire surface of the particles. As a result of the layer formation, there are changes in the particle diameter and the bed void fraction of the solid sorbent [13,17,30].
  • The reaction water keeps the solid sorbent moist. The produced water favors the H2S removal process since it serves as a vehicle for the acid gas dissolution on the solid sorbent surface, promoting its interaction and chemical reaction with the iron oxides [31].
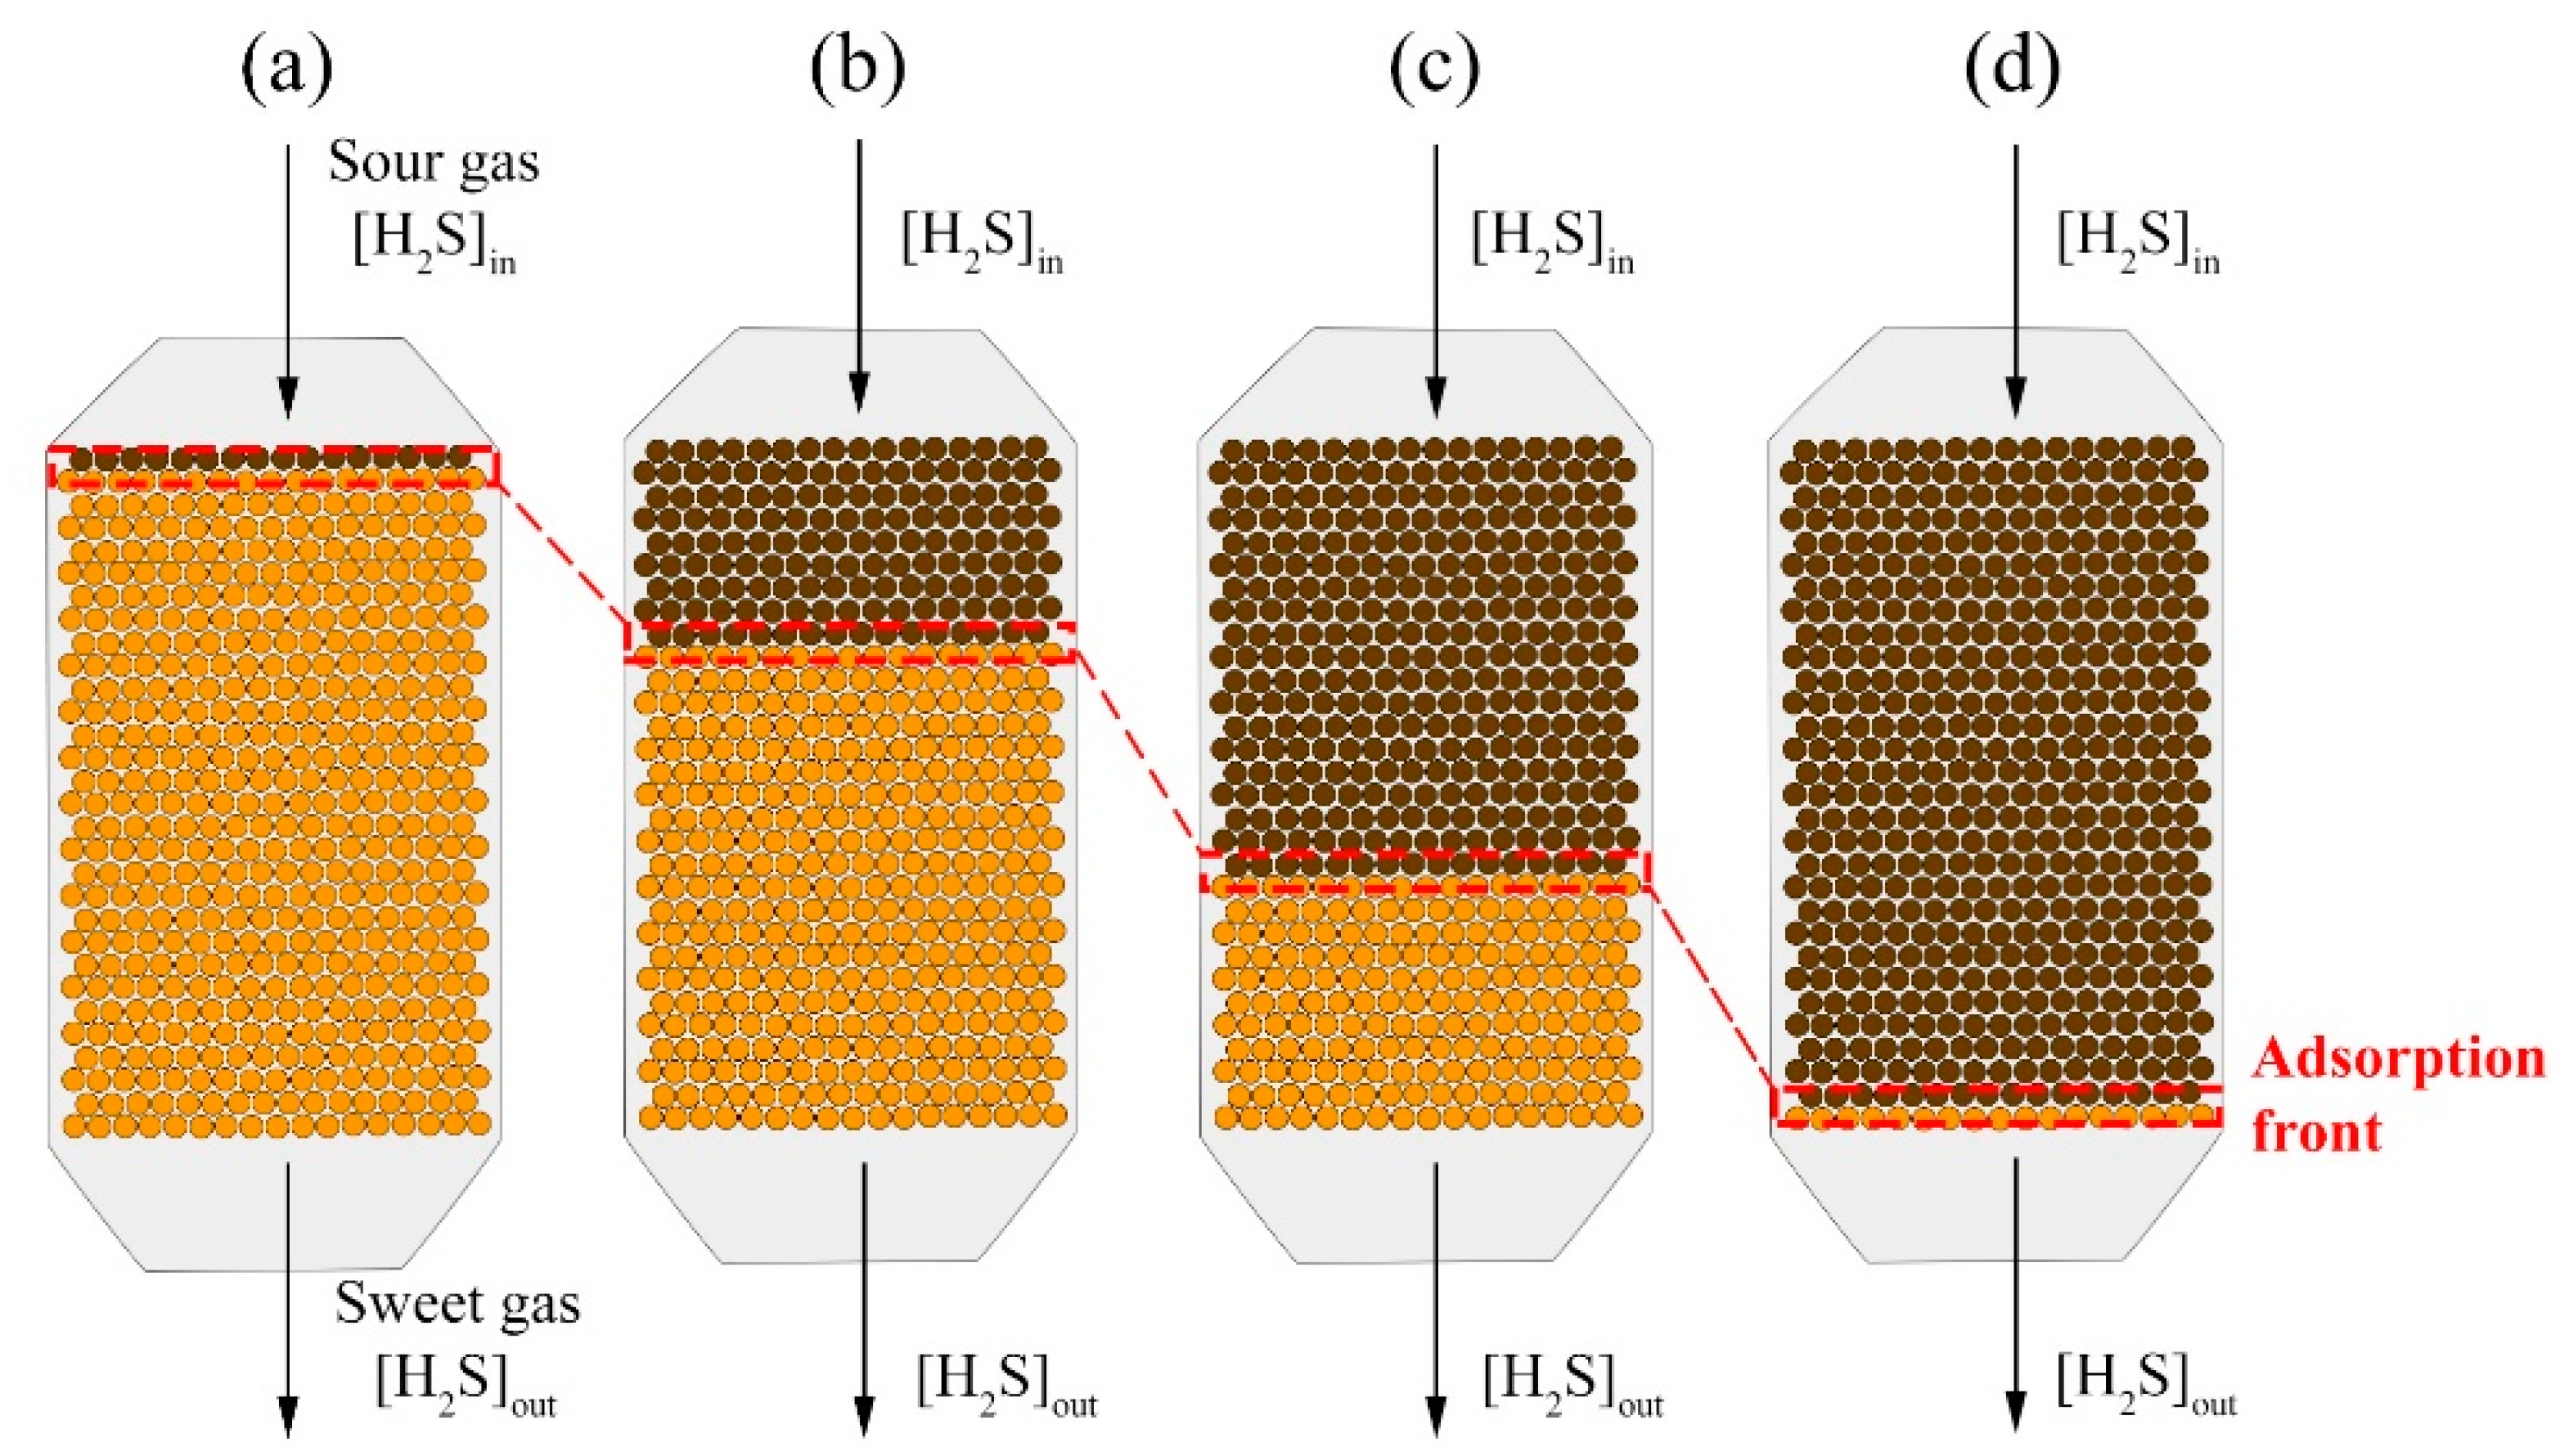
  • The chemical reaction inside the fixed-bed adsorption tower is given by packing sections that progressively become saturated. That is to say, the bed wears out one section at a time (adsorption front).
Next, the proposal of how the solid particles’ volume variation occurs within the H2S adsorption towers is detailed. The volume variation produces changes in the particle diameter and the bed void fraction of the solid sorbent.

2.1. Volume Variation in the Particles of Solid Sorbents

To include the reactivity into the fluid-dynamic analysis, it is necessary to initially contemplate aspects of the reaction between the solid sorbent and the hydrogen sulfide present in the natural gas stream. Analyzing from the engineering point of view, what happens in the fixed bed is shown in Figure 2i. Initially, at point (a) the H2S molecules around the solid sorbent adhere to the sorbent surface (at point (b)). Subsequently, the chemical reaction between iron oxide and H2S takes place at point (c). The presence of liquid water on the sorbent surface favors the H2S adsorption process. Davydov et al. [30], in a study on the reaction mechanism of hydrogen sulfide with ferric oxide and hydroxide surfaces, establish that “initially, almost all the surface sites can interact readily with H2S, to form a layer of iron sulfides”.
The hematite changes to iron sulfide according to the chemical reaction (2). The unit cell volume of hematite ( V F e 2 O 3 | u . c ) and the iron sulfide ( V F e 2 S 3 | u . c ) are 302.72 Å3 [32] and 422.35 Å3 [33], respectively. Knowing the volume of both, it is possible to calculate the ratio between the unit cells ( f Δ V ) , as shown in Equation (4).
f Δ V = V F e 2 S 3 | u . c V F e 2 O 3 | u . c = 1.395
The ratio above indicates that the particles’ volume—in the reacted bed zone—tends to increase in size at the end of the reaction [34,35]. Figure 2ii shows a comparison between the reacted bed and the unreacted bed properties. Due to the iron sulfide deposition on the solid sorbent surface, the particle diameter in the reacted bed ( D r p ) is larger than the particle diameter in the unreacted bed ( D p ) . Further, since the particle diameter increases, the distance between them decreases, and the bed void fraction should become smaller.

2.2. Particle Diameter Variation Calculation

To know the particle diameter variation, first, it is necessary to quantify the hydrogen sulfide mass ( m H 2 S | p ) adsorbed in each particle of the fixed-bed adsorption tower. It is considered that all H2S removed from natural gas ( m H 2 S | t o t a l ) is uniformly distributed among the solid particles total number ( n p ) inside the adsorption tower.
The equations’ sequence that allows calculating the particle diameter variation is detailed below:
m H 2 S | p = m H 2 S | t o t a l n p
where
m H 2 S | t o t a l = V b e d ρ b e d A C s o r b e n t
n p = V b e d ( 1 ϕ ) V p
V b e d = π D 2 L 4
V p is the volume of an individual particle, V b e d is the total fixed-bed volume, and ρ b e d is the bed density, i.e., the amount of solid sorbent per volume unit.
Subsequently, for each particle, the mass of hematite that reacts with sulfur sulfide ( m F e 2 O 3 | p ) and the corresponding volume ( V F e 2 O 3 | p ) are calculated using Equations (9) and (10), respectively:
m F e 2 O 3 | p = 1 3 · M W F e 2 O 3   M W H 2 S   · m H 2 S | p
V F e 2 O 3 | p = m F e 2 O 3 | p ρ F e 2 O 3
where the coefficient 1/3 corresponds to the stoichiometric relationship according to chemical reaction (2).
To obtain the particle volume variation ( Δ V p ) due to the chemical reaction, Equation (11) is used.
Δ V p = V F e 2 O 3 | p · ( f Δ V 1 )
The variation of the particle radius ( Δ r p ) is then calculated using Equation (12) by dividing it by the surface area of the particle ( A s p ) ; finally, the diameter of the reacted particle is obtained using Equation (13).
Δ r p = Δ V p A s p
D r p = D p + 2 · Δ r p
Noting that, the solid sorbent sphericity is used in the Ergun equation (Equation (3)) to consider the solid particles’ geometric irregularity.

2.3. Bed Void Fraction Changing Calculation

The calculation of the bed void fraction after the chemical reaction ( ϕ r ) is carried out using Equation (14):
ϕ r = 1 V r p | t o t a l V b e d
where V r p | t o t a l corresponds to the total volume of bed particles after the reaction. Considering the particles’ total volume after chemical reaction is equal to the particles’ total volume before the reaction plus the particle volume variation.
V r p | t o t a l = V p | t o t a l + n p · Δ V p
Therefore,
ϕ r = 1 V p | t o t a l + n p · Δ V p V b e d
The equation above can be rearranged to obtain:
ϕ r = ( 1 V p | t o t a l V   b e d ) n p · Δ V p V b e d
where ( 1 V p | t o t a l V   b e d ) is the bed void fraction before the reaction ( ϕ ) [36]. Therefore,
ϕ r = ϕ n p · Δ V p V b e d

2.4. Integration of the Reactivity Model to the Fluid-Dynamic Analysis

To integrate the reactivity model to the fluid-dynamic analysis, it is required to divide the H2S adsorption tower into three main sections: reacted bed zone, adsorption front, and unreacted bed zone. Each of these sections has different characteristics, as shown in Figure 2.
  • Reacted bed zone: the reaction between the natural gas and the solid sorbent is already considered to have been carried out. Therefore, the Ergun equation calculations consider:
    The particle diameter ( D r p ) and the bed void fraction ( ϕ r ) are calculated using Equations (13) and (18), respectively.
    The H2S concentration in the natural gas stream remain the same in comparison to the input ( [ H 2 S ] i n ) since no chemical reaction occurs in the reacted bed zone.
  • Adsorption front: in this tower zone, the H2S removal takes place. The calculations consider the following aspects:
    The H2S moles are reduced to the natural gas output specification ( [ H 2 S ] o u t ) .
    The H2S removed from natural gas ( Δ [ H 2 S ] ) is calculated using Equation (19).
    Δ [ H 2 S ] = [ H 2 S ] i n [ H 2 S ] o u t
    The change in pressure drop is entirely due to the fact that the natural gas moles decrease by the chemical reaction between the H2S and the solid sorbent. The pressure drop is calculated from the Peng–Robinson equation of state [26] by:
    Δ P r = f ( Δ [ H 2 S ] ,   Q , P , T , Z )
    where Z is the compressibility factor.
  • Unreacted bed zone: it is contemplated that the reaction between the gas and the solid has not yet occurred. Therefore, the Ergun equation calculations consider:
    The particle diameter ( D p ) and the bed void fraction ( ϕ ) remain at the initial values for the solid sorbent.
    The H2S moles remain constant to the output specifications.

2.5. Complementary Calculations

  • Repositioning time: refers to the time (expressed in days) required to spend out the fixed bed within the H2S adsorption towers, requiring the replacement or regeneration of the sorbent. The repositioning time ( t r ) is calculated from the total amount of H2S removed from the gas phase ( m H 2 S | t o t a l ) and the H2S mass flowrate ( m ˙ H 2 S ) using the following equation:
    t r = m H 2 S | t o t a l m ˙ H 2 S
    where:
    m ˙ H 2 S = Q · Δ H 2 S · M W H 2 S V m
  • Absorption front height: at a given time ( t t r ) , the adsorption front height ( h r ) is calculated as:
    h r = t · L t r
    where L is the fixed-bed total height.
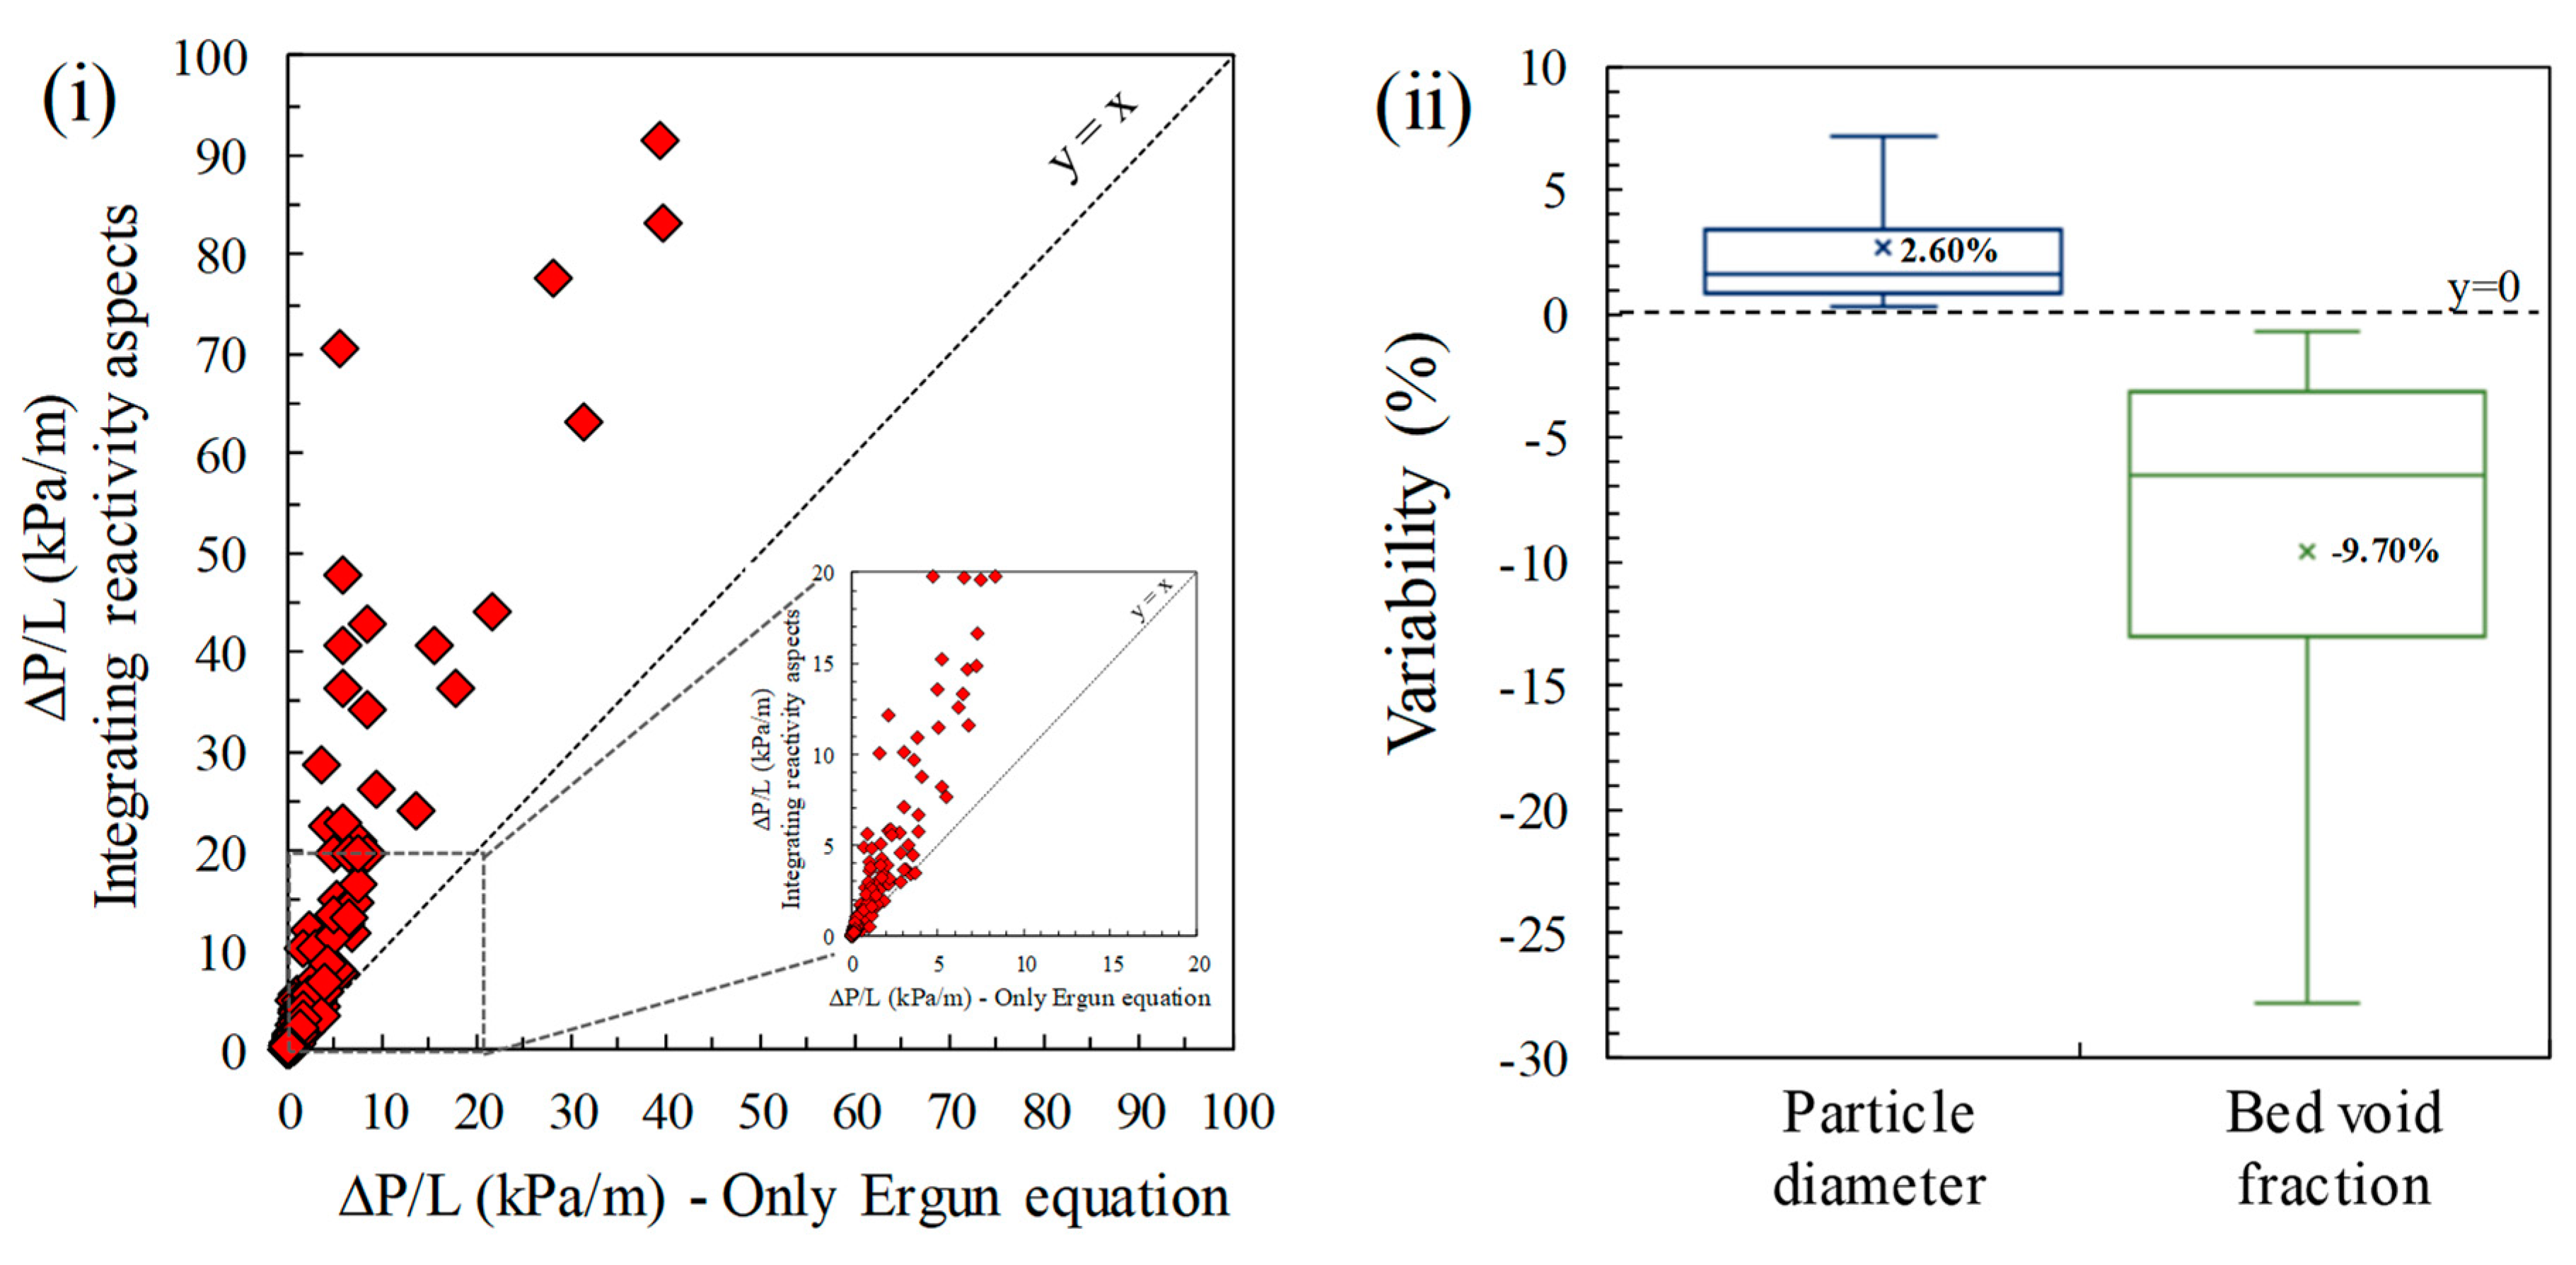
  • Percent variability: for statistical purposes, the variability from the original solid sorbent properties in particle size increase ( α ) and in bed void fraction decrease ( β ) are calculated using Equations (24) and (25), respectively.
    α = ( D r p D p 1 ) · 100
    β = ( ϕ r ϕ 1 ) · 100

3. Methods

Figure 3 illustrates the procedure established to integrate the reactivity model proposed in this study to the fluid-dynamic analysis of fixed-bed adsorption towers for H2S removal from natural gas. The first stage consisted of coding the Ergun equation for calculating the pressure drop across the fixed bed without taking reactivity aspects into account. The second stage incorporated the reactivity aspects, i.e., increases in the particle diameter and bed void fraction decreases, based on the chemical reaction between hematite and H2S and the shrinking-core model, as described in Section 2.
The differential equations system resulting from incorporating the reactivity aspects to the Ergun equation cannot be solved analytically. The pressure and the H2S concentration of the natural gas stream vary across the adsorption tower, as do the particle diameter and the void bed fraction change in each tower zone (as seen in Figure 2). Numerical analysis is an alternative method for solving these systems of equations. The Runge–Kutta fourth-order method is commonly used to solve differential equations [37], but it requires the implementation of computational procedures. In this study, an Excel spreadsheet with a Visual Basic code was developed to simultaneously resolve the differential equations system by discretizing the fixed-bed height in hundreds of small differentials ( d z ) . Figure 4 depicts the model computation strategy. The input data are natural gas properties, sorbent solid properties, and fixed-bed vessel characteristics. The calculation was started from the adsorption tower top, considering that the natural gas stream also enters through the upper part and descends across the vessel. The main output data are the pressure drop, the amount of H2S removed, the vessel loading, and the repositioning time.
The results obtained from the model computation strategy can be represented graphically with the pressure drop values as a function of the adsorption tower height. Since the particle size increases and the bed void fraction decreases in the reacted zone, a greater friction between the natural gas stream and the reacted solid sorbent takes place inside the adsorption tower. Hence, an increase in pressure drop is expected when reactivity aspects in the fluid-dynamic analysis are considered.
Table 1 shows the H2S removal process data using solid sorbents selected as a base case to demonstrate the applicability of the model proposed in this study. Subsequently, the model validation was carried out using data available from the literature regarding the dynamic evaluation of fixed-bed breakthrough curves for H2S adsorption, both at the laboratory scale and large scale. Finally, more than 250 theoretical case studies were raised beginning with the base case and from the typical natural gas streams at processing conditions, the solid sorbent properties defined from commercial solids and developing solids reported in the literature, and the fixed-bed vessel characteristics with the dimensions often used for the adsorption towers. The case studies were proposed using the combinatorial applications of parameters from Table 1 (with variations between the maximum and minimum values) as hypothetical conditions of H2S removal processes using solid sorbents. A comparison of the pressure drops without reactivity (only the Ergun equation) and integrating the reactivity aspects was carried out to demonstrate the robustness of the developed model in the face of solid sorbent properties and fixed-bed vessel characteristics variability.

4. Results and Discussion

4.1. Base Case Analysis

Figure 5 shows the relationship between pressure drop and time due to integrating reactivity aspects to the fluid-dynamic analysis of fixed-bed adsorption towers for H2S removal from natural gas. The relationship is directly proportional due to the chemical reaction between the acid gas and iron oxide. At the initial time (Day 0), the reacted bed section is negligible, and the pressure drop corresponds to the passage of the natural gas being described only by the Ergun equation. In time, the pressure drop rises mainly due to the reacted bed zone increases, resulting in a change in the solid sorbent characteristics, i.e., increases in particle diameter and decreases in bed void fraction [34,35]. Finally, in the latter time (Day 72), the bed is completely reacted. This time corresponds to the repositioning time in which the solid sorbent must be regenerated or replaced.
The pressure drop variability over time shows the reactivity aspects’ influence in the adsorption tower’s fluid-dynamics behavior, reaching an increase of up to ~60% concerning the initial values. The Ergun equation by itself does not consider changes over time in the particle diameter and the bed void fraction, as occurs in the H2S capture process using solid sorbents. These two parameters notably influence the increase in pressure drop, as depicted in Figure 5; specifically, the particle diameter increases by 1.95% while the bed void fraction reduces by −13.66% compared to the original solid sorbent properties (see Table 1).

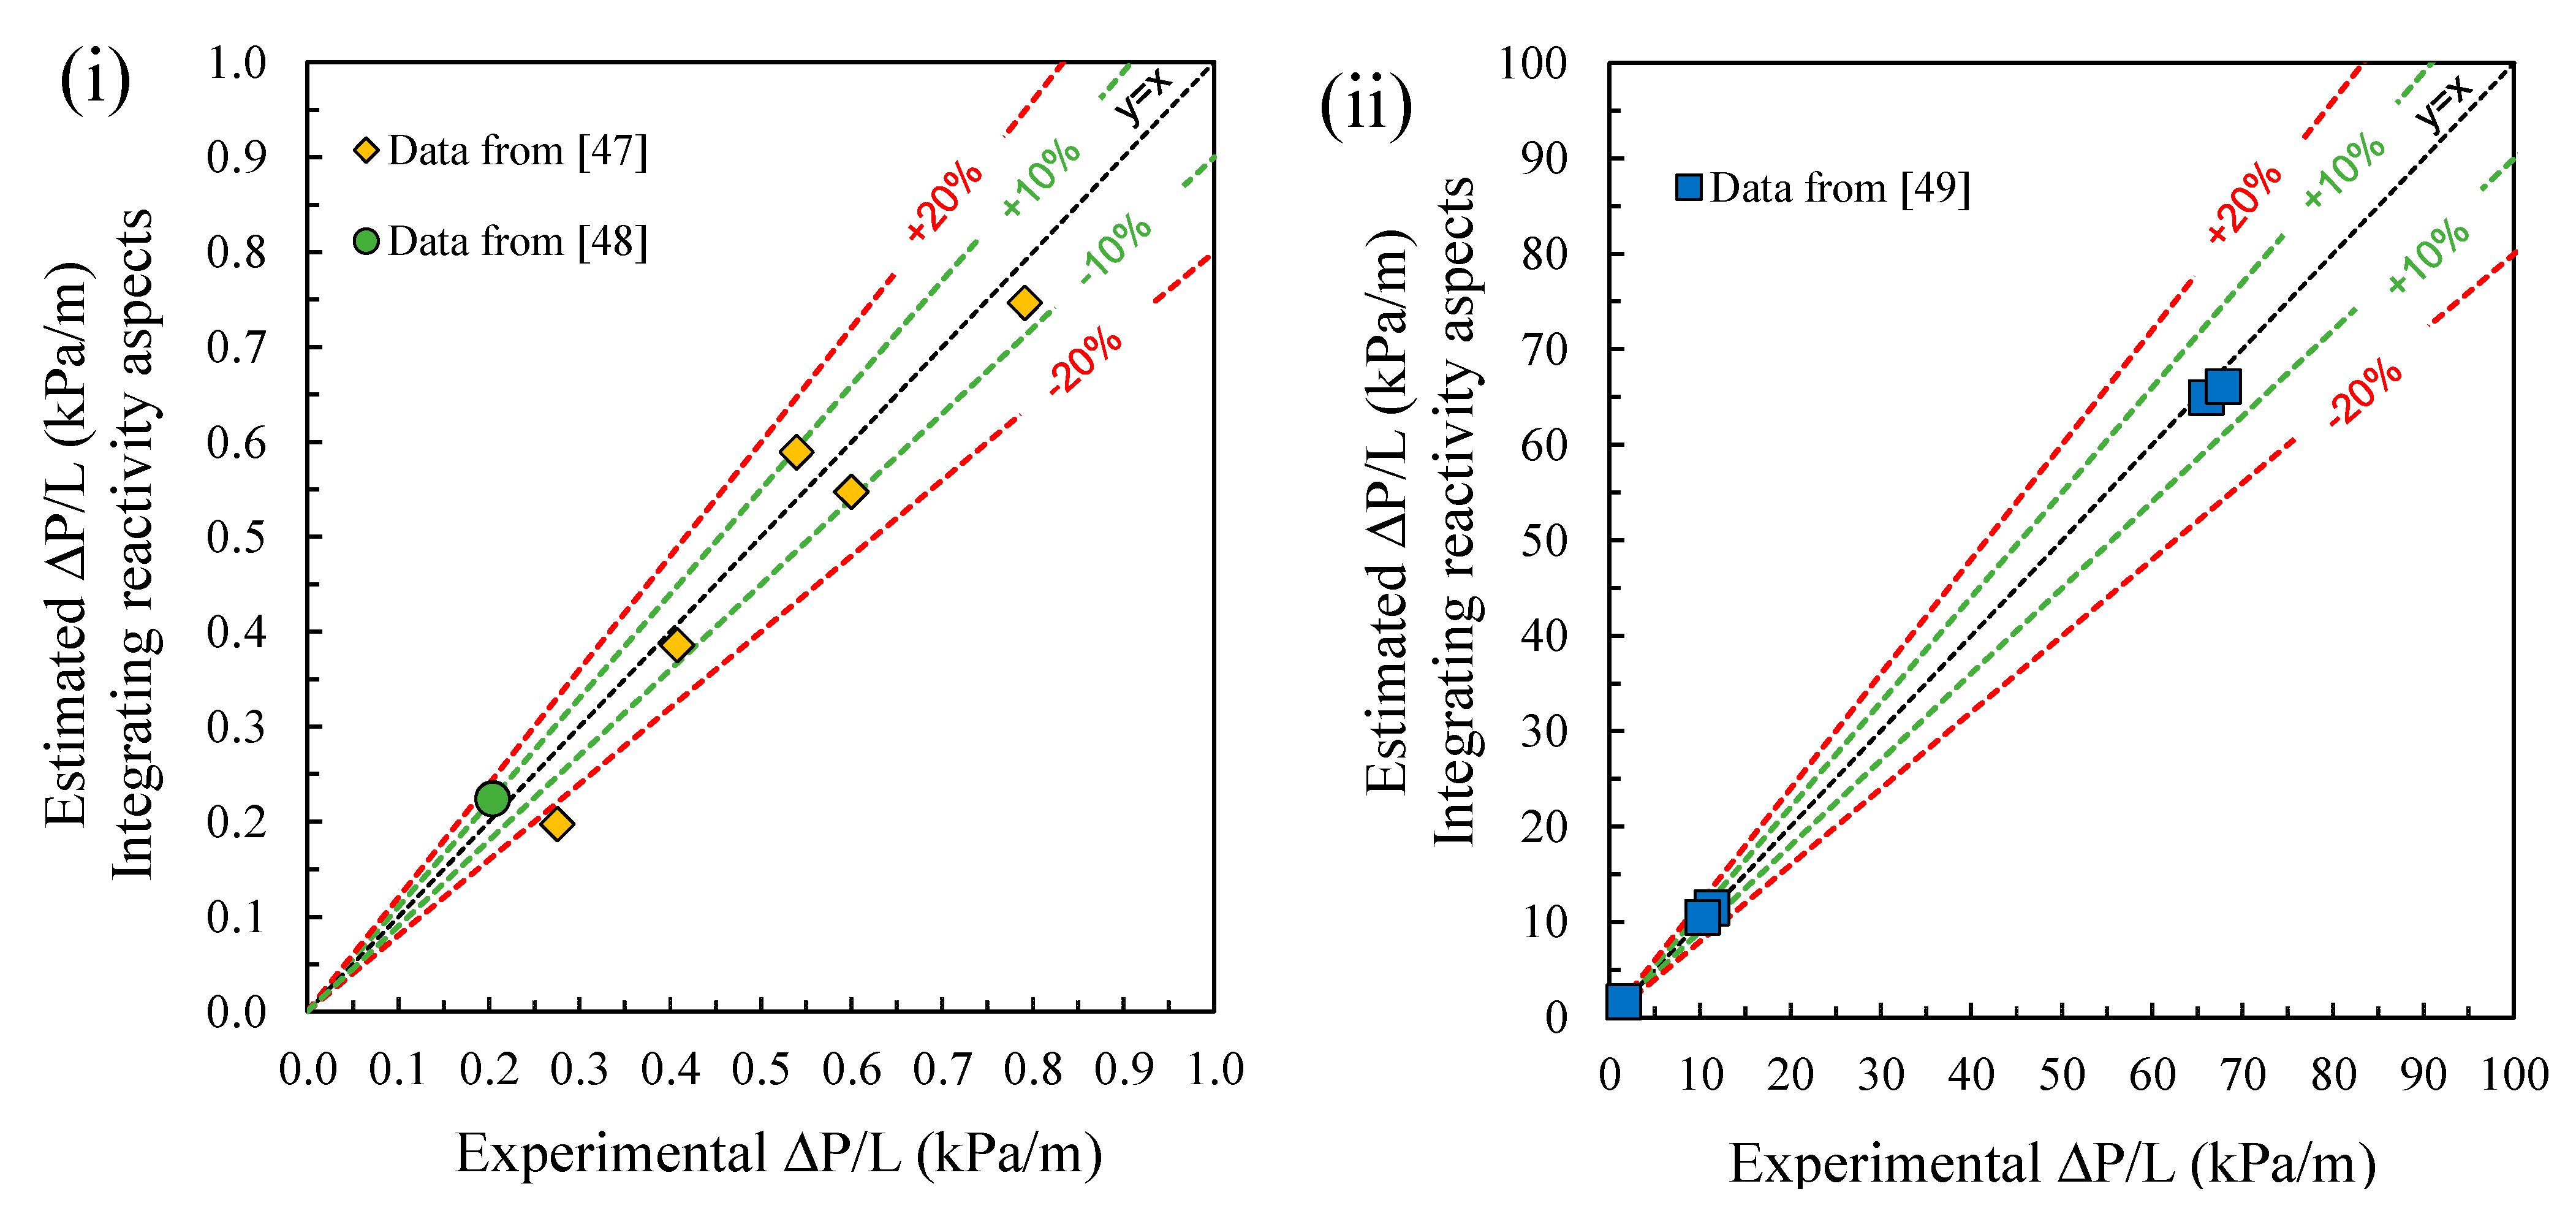
4.2. Validation: Laboratory-Scale and Large-Scale

The model validation was carried out using data from the literature (Figure 6), both at laboratory-scale testing [47,48] ( Δ P / L < 1   kPa / m ) and at large-scale testing [49] ( Δ P / L > 1   kPa / m ) .
The laboratory-scale data (Figure 6i) are compared with the drop pressure estimated by the model. Most data fall within an average absolute deviation of <10%, and only one value deviates from this trend. Regarding the large scale (Figure 6ii), all data are below an average absolute deviation of 10%. Therefore, the model fits with accuracy to the data from laboratory-scale and large-scale testing for the fluid-dynamic analysis of fixed-bed adsorption towers for H2S removal from natural gas.

4.3. Case Studies

More than 250 hypothetical cases were run using both the reactivity aspects and no-reactivity conditions (only the Ergun equation) in order to compare their results (Figure 7i). In all cases, a greater pressure drop is observed when reactivity aspects are included. It indicates that the integration of the shrinking-core model to the fluid-dynamic analysis of fixed-bed adsorption towers results in an increase in the pressure drop values. These greater pressure-drop values are consequences of the changes in the particle diameter and the bed void fraction of the solid sorbent [34,35].
Figure 7ii shows the percent variability of particle diameter and bed void fraction for the different pressure drops in the case studies. From the original solid sorbent’s properties, the particle diameter increments are ranged (0.20%; 7.15%), with an average value of 2.60%, while the bed void fraction decreases are ranged (−0.66%; −28.13%) with an average of −9.70%. The statistical analysis above demonstrates that the bed void fraction decrease is a highly influential variable on pressure drop since the available void space for natural gas passage inside the adsorption towers is reduced as the H2S adsorption front advances.

5. Summary and Conclusions

In this study, a fluid-dynamic model was developed to estimate the pressure drop in adsorption towers for H2S removal from natural gas. The model integrates reactivity aspects considering the formation of an iron sulfide layer, according to the shrinking-core model and the H2S adsorption front variation in time. The reactivity integration considers a variation in particle size (with an increment factor of 1.395 in the solid particles’ external skin), resulting in particle diameter increases and bed void fraction decreases. A detailed description of the developed reactivity model proposal was carried out. Experimental data on pressure drop at the laboratory scale and large scale is consistent with the proposed model, with an average absolute deviation of <10%, demonstrating its accuracy. The case studies analysis showed how the solid sorbent properties influence the pressure drop within the adsorption towers. Additionally, the model allows quantifying the repositioning time, i.e., the time required to saturate the fixed bed within the adsorption towers, requiring the replacement or regeneration of the sorbent.
This model can be used to:
  • Design and formulate new solid sorbents at laboratory-scale testing, e.g., determining the solid sorbent’s physical properties that establish the best compromise between a high H2S reactivity and a low-pressure drop-in fluid-dynamic tests).
  • Analyze adsorption towers already installed at the large scale, e.g., identifying operational problems, such as higher or lower pressure drop values than expected.
  • Help plan maintenance operations., e.g., solid sorbent replacement frequency or solid sorbent quantity required.

Author Contributions

Conceptualization, B.C. and M.R.; methodology, B.C. and M.R.; software, B.C. and M.R.; validation, B.C., E.Á. and M.R.; formal analysis, B.C., E.Á., A.V. and M.R.; writing—original draft preparation, B.C. and M.R.; writing—review and editing, B.C., E.Á., A.V. and M.R.; visualization, A.V. and M.R.; funding acquisition, A.V. All authors have read and agreed to the published version of the manuscript.

Funding

This research was funded by SENESCYT, Ecuador (grant number PIC-18-INE-YACHAY-001) and the Yachay Tech University (project number CHEM19-02).

Institutional Review Board Statement

Not applicable.

Informed Consent Statement

Not applicable.

Data Availability Statement

The data presented in this study are openly available in http://repositorio.yachaytech.edu.ec/handle/123456789/219 (accessed on 1 July 2021).

Acknowledgments

The support of Andrew Nelson (English instructor at Yachay Tech University) is appreciated.

Conflicts of Interest

The authors declare no conflict of interest.

Nomenclature

a , b , c cell parameters (Å)
A C sorbent solid sorbent adsorption capacity ( kg H 2 S   kg sorbent 1 )
A s p surface area of an individual solid particle ( m 2 )
C 1 methane
D fixed-bed diameter ( m )
D p solid sorbent particle diameter ( m )
D r p solid sorbent particle diameter in the reacted bed ( m )
d z fixed-bed height differential ( kg H 2 S   kg sorbent 1 )
f Δ V ratio of volume variation
G natural gas mass velocity per cross-section area ( kg   s 1   m 2 )
h r adsorption front height ( m )
[ H 2 S ] i n inlet H2S concentration ( mole   ppm )
[ H 2 S ] o u t outlet H2S concentration ( mole   ppm )
L fixed-bed total height ( m )
m F e 2 O 3 | p mass of an individual solid particle ( kg )
m ˙ H 2 S H2S mass flowrate bed ( kg   d 1 )
m H 2 S | p H2S mass adsorbed per individual solid particle ( kg )
m H 2 S | t o t a l H2S total mass adsorbed ( kg )
M W F e 2 O 3 hematite molecular weight ( kg   kmol 1 )
M W H 2 S   H2S molecular weight ( kg   kmol 1 )
n p solid particles total number
P natural gas pressure ( kPa )
Q natural gas flowrate ( MSm 3   d 1 )
T temperature ( K )
t time ( d )
t r repositioning time ( d )
V F e 2 O 3 | u . c hematite unit cell volume ( 3 )
V F e 2 S 3 | u . c iron sulfide unit cell volume ( 3 )
V b e d fix-bed volume ( m 3 )
V F e 2 O 3 | p volume of an individual solid particle ( m 3 )
V   m molar volume ( 22.4   m 3   kmol 1 )
V r p | t o t a l total volume of particles in reacted bed ( m 3 )
V p volume of an individual particle in unreacted bed ( m 3 )
V r p volume of an individual particle in reacted bed ( m 3 )
V p | t o t a l total volume of particles in unreacted bed ( m 3 )
V b e d fixed-bed volume ( m 3 )
y i natural gas composition ( mole   % )
z fixed-bed height ( m )
Z compressibility factor
Greek symbols
α particle size increase ( % )
β bed void fraction decrease ( % )
Δ [ H 2 S ] H2S removed from natural gas ( mole   ppm )
Δ P pressure drop ( kPa )
Δ P / L pressure drop per fixed-bed height ( kPa   m 1 )
Δ P r pressure drop due to the chemical reaction ( kPa )
Δ r p solid particle radius variation ( m )
Δ V p solid particle volume variation ( m 3 )
μnatural gas viscosity ( kg   m 1   s 1 )
ρnatural gas density ( kg   m 3 )
ρ F e 2 O 3 hematite density ( kg   m 3 )
ρ b e d fixed-bed density ( kg   m 3 )
ϕ bed void fraction in unreacted bed
ϕ r bed void fraction in reacted bed
φsolid sorbent sphericity

References

  1. Ricaurte, M.; Fernández, J.; Viloria, A. An improved method for calculating critical temperatures and critical pressures in natural gas mixtures with up to nC11 hydrocarbons. Oil Gas Sci. Technol. Rev. IFP Energ. Nouv. 2019, 74, 53. [Google Scholar] [CrossRef] [Green Version]
  2. Ayala, L.; Morgan, E. Natural gas production engineering. In Exploration and Production of Petroleum and Natural Gas, 17th ed.; Riazi, M., Ed.; ASTM International: West Conshohocken, PA, USA, 2016; pp. 395–428. [Google Scholar] [CrossRef]
  3. Bahadori, A. Natural Gas Processing. Technology and Engineering Design, 1st ed.; Gulf Professional Publishing: Waltham, MA, USA, 2014; pp. 483–546. [Google Scholar] [CrossRef]
  4. Kohl, A.; Nielsen, R. Chapter 2–Alkanolamines for hydrogen sulfide and carbon dioxide removal. In Gas Purification, 5th ed.; Gulf Professional Publishing: Houston, TX, USA, 1997; pp. 40–186. [Google Scholar] [CrossRef]
  5. Gupta, M.; Sukanandan, J.; Singh, V.; Pawar, A.; Deuri, B. A holistic approach for mitigation of H2S from crude oil and gas in an offshore/remote environment. In Proceedings of the SPE Oil and Gas India Conference and Exhibition, Mumbai, India, 9–11 April 2019. [Google Scholar] [CrossRef]
  6. Pollitt, I.; Conde, J. Novel approaches to sour gas treatment in oil and gas—Onshore and offshore facilities. In Proceedings of the Abu Dhabi International Petroleum Exhibition & Conference, Abu Dhabi, UAE, 12–15 November 2018. [Google Scholar] [CrossRef]
  7. Mokhatab, S.; Poe, W.; Mak, J. Chapter 8–Sulfur recovery and handling. In Handbook of Natural Gas Transmission and Processing, 4th ed.; Gulf Professional Publishing: Cambridge, MA, USA, 2019; pp. 271–305. [Google Scholar] [CrossRef]
  8. Ahmad, W.; Sethupathi, S.; Kanadasan, G.; Lau, L.; Kanthasamy, R. A review on the removal of hydrogen sulfide from biogas by adsorption using sorbents derived from waste. Rev. Chem. Eng. 2021, 37, 407–431. [Google Scholar] [CrossRef]
  9. Georgiadis, A.; Charisiou, N.; Goula, M. Removal of hydrogen sulfide from various industrial gases: A review of the most promising adsorbing materials. Catalysts 2020, 10, 521. [Google Scholar] [CrossRef]
  10. Liu, D.; Li, B.; Wu, J.; Liu, Y. Sorbents for hydrogen sulfide capture from biogas at low temperature: A review. Environ. Chem. Lett. 2020, 18, 113–128. [Google Scholar] [CrossRef]
  11. Speight, J. Natural Gas. A Basic Handbook, 2nd ed.; Gulf Professional Publishing: Cambridge, MA, USA, 2019; pp. 277–324. [Google Scholar] [CrossRef]
  12. Gao, S.; Brown, B.; Young, D.; Singer, M. Formation of iron oxide and iron sulfide at high temperature and their effects on corrosion. Corros. Sci. 2018, 135, 167–176. [Google Scholar] [CrossRef]
  13. Feng, Y.; Wen, J.; Hu, Y.; Wu, B.; Wu, M.; Mi, J. Evaluation of the cycling performance of a sorbent for H2S removal and simulation of desulfurization-regeneration processes. Chem. Eng. J. 2017, 326, 1255–1265. [Google Scholar] [CrossRef]
  14. Ning, J.; Zheng, Y.; Brown, B.; Young, D.; Nešić, S. The role of iron sulfide polymorphism in localized H2S corrosion of mild steel. Corrosion 2017, 73, 155–168. [Google Scholar] [CrossRef]
  15. Zhang, X.; Tang, Y.; Qu, S.; Da, J.; Hao, Z. H2S-selective catalytic oxidation: Catalysts and processes. ACS Catal. 2015, 5, 1053–1067. [Google Scholar] [CrossRef]
  16. Meyer, F.; Riggs, O.; McGlasson, R.; Sudbury, J. Corrosion products of mild steel in hydrogen sulfide environments. Corrosion 1958, 14, 69–75. [Google Scholar] [CrossRef]
  17. Watanabe, S. Chemistry of H2S over the surface of common solid sorbents in industrial natural gas desulfurization. Catal. Today 2021, 371, 204–220. [Google Scholar] [CrossRef]
  18. Raabe, T.; Mehne, M.; Rasser, H.; Krause, H.; Hureti, S. Study on iron-based adsorbents for alternating removal of H2S and O2 from natural gas and biogas. Chem. Eng. J. 2019, 371, 738–749. [Google Scholar] [CrossRef]
  19. Skerman, A.; Heubeck, S.; Batstone, D.; Tait, S. Low-cost filter media for removal of hydrogen sulphide from piggery biogas. Process Saf. Environ. Prot. 2017, 105, 117–126. [Google Scholar] [CrossRef] [Green Version]
  20. Ishida, M.; Wen, C. Comparison of zone-reaction model and unreacted-core shrinking model in solid-gas-reactions—I Isothermal analysis. Chem. Eng. Sci. 1971, 26, 103–1041. [Google Scholar] [CrossRef]
  21. Lim, S.; Jenkins, A.; Barbuto, K.; Crawshaw, M.; Brundick, W.; Juncker, M. Liquid Scavenger vs. Fixed Bed H2S Adsorbent. Working in Harmony or against Each Other for H2S Removal. In Proceedings of the CORROSION 2021, Virtual, 19-30 April 2021; Available online: https://onepetro.org/NACECORR/proceedings-abstract/CORR21/8-CORR21/D081S030R010/464031 (accessed on 1 July 2021).
  22. Todd, R.; Webley, P. Pressure drop in a packed bed under nonadsorbing and adsorbing conditions. Ind. Eng. Chem. Res. 2005, 44, 7234–7241. [Google Scholar] [CrossRef]
  23. Mao, D.; Karanikas, J.; Fair, P.; Prodan, I.; George, W. A different perspective on the Forchheimer and Ergun equations. SPE J. 2016, 21, 1501–1507. [Google Scholar] [CrossRef]
  24. Mayerhofer, M.; Govaerts, J.; Parmentier, N.; Jeanmart, H.; Helsen, L. Experimental investigation of pressure drop in packed beds of irregular shaped wood particles. Powder Technol. 2011, 205, 30–35. [Google Scholar] [CrossRef]
  25. Ozahi, E.; Gundogdu, M.; Carpinlioglu, M. A modification on Ergun’s correlation for use in cylindrical packed beds with non-spherical particles. Adv. Powder Technol. 2008, 19, 369–381. [Google Scholar] [CrossRef]
  26. Peng, D.; Robinson, D. A new two-constant equation of state. Ind. Eng. Chem. Fundam. 1976, 15, 59–64. [Google Scholar] [CrossRef]
  27. Jarrahian, A.; Heidaryan, E. A simple correlation to estimate natural gas viscosity. J. Nat. Gas Sci. Eng. 2014, 20, 50–57. [Google Scholar] [CrossRef]
  28. Huertas, J.; Quipuzco, L.; Hassanein, A.; Lansing, S. Comparing hydrogen sulfide removal eficiency in a field-scale digester using microaeration and iron filters. Energies 2020, 13, 4793. [Google Scholar] [CrossRef]
  29. Huang, G.; He, E.; Wang, Z.; Fan, H.; Shangguan, J.; Croiset, E.; Chen, Z. Synthesis and characterization of γ-Fe2O3 for H2S removal at low temperature. Ind. Eng. Chem. Res. 2015, 54, 8469–8478. [Google Scholar] [CrossRef]
  30. Davydov, A.; Chuang, K.; Sanger, A. Mechanism of H2S oxidation by ferric oxide and hydroxide surfaces. J. Phys. Chem. B 1998, 102, 4745–4752. [Google Scholar] [CrossRef]
  31. Ramirez, M.; Mendez, M.; Viloria, A. Effects of the water content on the performance of H2S scavengers. In Proceedings of the CORROSION 2004, New Orleans, LA, USA, 22 March 2004; Available online: https://onepetro.org/NACECORR/proceedings-abstract/CORR04/All-CORR04/NACE-04479/115844 (accessed on 1 July 2021).
  32. Kelm, K.; Mader, W. Synthesis and structural analysis of ϵ-Fe2O3. Z. Anorg. Allg. Chem. 2005, 631, 2383–2389. [Google Scholar] [CrossRef]
  33. Yamaguchi, S.; Wada, H. Formation de Fe2S3 cubique. Bull. Mineral. 1973, 96, 213–214. [Google Scholar] [CrossRef]
  34. Sadegh-Vaziri, R.; Babler, M. Removal of hydrogen sulfide with metal oxides in packed bed reactors—a review from a modeling perspective with practical implications. Appl. Sci. 2019, 9, 5316. [Google Scholar] [CrossRef] [Green Version]
  35. Zhang, R.; Wang, B.; Wei, L. Sulfidation growth and characterization of nanocrystalline ZnS thin films. Vacuum 2008, 82, 1208–1211. [Google Scholar] [CrossRef]
  36. Fogler, S. Elements of Chemical Reaction Engineering, 3rd ed.; Prentice-Hall India: New Delhi, India, 2004; ISBN 81-203-2234-7. [Google Scholar]
  37. Hussain, K.; Ismail, F.; Senu, N. Solving directly special fourth-order ordinary differential equations using Runge–Kutta type method. J. Comput. Appl. Math. 2016, 306, 179–199. [Google Scholar] [CrossRef]
  38. de Angelis, A. Natural gas removal of hydrogen sulphide and mercaptans. Appl. Catal. B: Environ. 2012, 113–114, 37–42. [Google Scholar] [CrossRef]
  39. Di Felice, R.; Pagliai, P. Prediction of the early breakthrough of a diluted H2S and dry gas mixture when treated by Sulfatreat commercial sorbent. Biomass Bioenergy 2015, 74, 244–252. [Google Scholar] [CrossRef]
  40. Papadias, D.; Ahmed, S.; Kumar, R. Fuel quality issues with biogas energy—An economic analysis for a stationary fuel cell system. Energy 2012, 44, 257–277. [Google Scholar] [CrossRef]
  41. Cherosky, P.; Li, Y. Hydrogen sulfide removal from biogas by bio-based iron sponge. Biosyst. Eng. 2013, 114, 55–59. [Google Scholar] [CrossRef]
  42. Green, D.; Perry, R. Perry’s Chemical Engineers’ Handbook, 8th ed.; McGraw-Hill Professionals: New York, NY, USA, 2008; ISBN 978-0-0714-294-9. [Google Scholar]
  43. Koekemoer, A.; Luckos, A. Effect of material type and particle size distribution on pressure drop in packed beds of large particles: Extending the Ergun equation. Fuel 2015, 158, 232–238. [Google Scholar] [CrossRef]
  44. Aguilera, P.; Gutiérrez, F. Prediction of fixed-bed breakthrough curves for H2S adsorption from biogas: Importance of axial dispersion for design. Chem. Eng. J. 2016, 289, 93–98. [Google Scholar] [CrossRef]
  45. Couper, J.; Penney, W.; Fair, J.; Walas, S. Chemical Process Equipment. Selection and Design, 3rd ed.; Butterworth-Heinemann: Waltham, MA, USA, 2012. [Google Scholar] [CrossRef]
  46. Martín, M. Industrial Chemical Process Analysis and Design, 1st ed.; Elsevier: Amsterdam, The Netherlands, 2016. [Google Scholar] [CrossRef]
  47. Wang, H.; Wang, D.; Chuang, K. A sulfur removal and disposal process through H2S adsorption and regeneration: Breakthrough behavior investigation. Process Saf. Environ. Prot. 2011, 89, 53–60. [Google Scholar] [CrossRef]
  48. Zicari, S. Removal of Hydrogen Sulfide from Biogas Using Cow-Manure Compost. Master’s Thesis, Master of Science Program. Cornell University, Ithaca, NY, USA, 2003. Available online: https://citeseerx.ist.psu.edu/viewdoc/download?doi=10.1.1.470.2484&rep=rep1&type=pdf (accessed on 1 July 2021).
  49. Anerousis, J.; Whitman, S. An updated examination of gas sweetening by the iron sponge process. In Proceedings of the 59th Annual Technical Conference and Exhibition, Houston, TX, USA, 16–19 September 1984. [Google Scholar] [CrossRef]
Figure 1. Evolution of H2S removal process into fixed-bed adsorption towers.
Energies 14 05576 g001
Figure 2. Absorption front: (i) H2S adsorption in the solid sorbent surface and the chemical reaction with hematite, (ii) reacted and unreacted bed property comparison.
Energies 14 05576 g002
Figure 3. Schematic representation for integrating the shrinking-core model to the fluid-dynamic analysis of fixed-bed adsorption towers procedure.
Energies 14 05576 g003
Figure 4. Model computation strategy: flow diagram.
Energies 14 05576 g004
Figure 5. Base case: pressure drop dependence on time.
Energies 14 05576 g005
Figure 6. Validation: (i) laboratory-scale testing, (ii) large-scale testing.
Energies 14 05576 g006
Figure 7. Case studies comparison: (i) pressure drop—with and without reactivity aspects, (ii) block plot—variability in solid sorbent properties.
Energies 14 05576 g007
Table 1. Base case and case studies parameters.
PropertiesBase CaseCase studiesReferences
MinimumMaximum
Natural gas streamC1 content (mole %)52.5639.5964.21[1]
H2S content (mole ppm)300150450[7]
Pressure (kPa)3447.38344.745171.07[4]
Temperature (K)310.93288.15323.15[11]
Flowrate (*) (MMSCFD)252.5100[17,38]
H2S specification (mole ppm)4210[7]
Solid sorbentAdsorption capacity
(Kg H2S/Kg Solid)
0.240.050.80[39,40]
Particle diameter (cm)0.330.11.5[41,42]
Sphericity0.70.51[43]
Bed void fraction0.30.20.7[43,44]
Bed density (Kg/m3)1491.16800.931601.85[39,40]
Fixed-bed vesselDiameter (m)3.050.313.35[45,46]
Length/diameter ratio324[36,45]
(*) conversion factor to SI units (1 MMSCFD = 0.028 MSm3/d).
Publisher’s Note: MDPI stays neutral with regard to jurisdictional claims in published maps and institutional affiliations.

