Article

Model Development and Transient Analysis of the WCLL BB BOP DEMO Configuration Using the Apros System Code

VTT Technical Research Centre of Finland Ltd., 02044 Espoo, Finland
*
Author to whom correspondence should be addressed.
Energies 2021, 14(18), 5593; https://doi.org/10.3390/en14185593
Submission received: 26 July 2021 / Revised: 26 August 2021 / Accepted: 27 August 2021 / Published: 7 September 2021
(This article belongs to the Special Issue Thermal-Hydraulics in Nuclear Fusion Technology: R&D and Applications)

Abstract

:
Extensive modelling and analytical work has been carried out considering the water-cooled lithium–lead breeding blanket (WCLL BB) balance of plant (BOP) configuration of the demonstration power plant (DEMO) using the Apros system code, developed by VTT Technical Research Centre of Finland Ltd. and Fortum. Contributing to the BOP work package of the EUROfusion Consortium, the integral plant model for dynamic analyses of the WCLL BB configuration has been updated with special attention to primary system components. Following trends of relevant neutronics modelling, a new BB model has been implemented in 2020 with the aim to obtain higher resolution output data and a more realistic thermalhydraulic feedback from the primary system. Once-through steam generator user components have been built based on CAD models conceived by BOP partners. Transient analyses have been performed providing a better picture regarding the behaviour of main components, e.g., the BB and the OTSGs, whilst highlighting possible ways to optimise the control scheme of the plant.

1. Introduction

The balance of plant (BOP) work package of the EUROfusion Consortium is responsible for the development of cooling systems comprising the primary heat transfer system (PHTS), the intermediate heat transfer system (IHTS), and the power conversion system (PCS) concerning their technical description and control logics. Equipment and layouts of systems rely on designs used in conventional power plants albeit a stark departure can be highlighted with respect to the fusion power plant’s normal operation. The initial break-down of hydrogen into plasma, afterwards the plasma current in the tokamak (Acronym for toroidal chamber with magnetic coils, Rus.: ТОрoидальная КАмера с МАгнитными Катушками) are driven by the discharge of the central solenoid (located in the bore of the torus), until the plasma current reaches its opposite peak current. This means that the tokamak has to operate in pulsed mode, where a pulse period is followed by a dwell time when only decay heat is produced (∼1–3% P n o m ). The pulsed operation brought forth challenges in the design for producing electricity in a commercially and technically viable way.
Activities of the work package have been organised around two candidate blankets during the pre-conceptual design phase of DEMO, namely the helium-cooled pebble bed (HCPB) and the water-cooled lithium–lead (WCLL) breeding blanket (BB) configurations [1,2]. The various blanket concepts offer different benefits and challenges compared to one another, thus several plant configurations have been developed in order to explore the various aspects of primary-secondary system coupling.
Depending on the PHTS and PCS interface one can separate direct and indirect coupling schemes, in case of the direct layout the PHTS is directly connected to the PCS via steam generators (SGs) whereas the indirect adjective implies that PHTS-PCS coupling is realised by an IHTS [3]. Such an intermediate system utilises molten salt energy storage technology in a similar fashion as solar power plants and other large scale applications of the chemical industry.
The direct coupling branch has two further variants, one operating an auxiliary boiler (AUXB) and another adopting a small energy storage system (ESS). A former variant represented a benchmark case, with the purpose to verify the feasibility of the pulsed operation regime of the DEMO plant using a gas-fired boiler during dwell periods [4]. AUXB studies confirmed that the envisaged operation scheme can be implemented, although results underlined the necessity to develop further, e.g., SG and feedwater inventory management. In the small ESS configuration, the auxiliary boiler was replaced by a molten salt steam generator (MSSG) as the interface between the salt loop and the PCS.
VTT has been taken part in the development of the mentioned plant variants using the Apros system code [5], present article will report the results of the modelling and analytical work related to the WCLL BB small ESS configuration. Section 2 will introduce the architecture of the PHTS (§2.1), the PCS with an emphasis on the true OTSGs and corresponding control logics (§2.2) setting out the general small ESS design as well in §2.3. Section 3 will give a depiction of the integral Apros model detailing the main subsystems in a similar manner as Section 2 with more focus on the mentioned key components (§3.1–3.4). The results of the transient analysis are outlined in Section 4, finally, leading the reader to the conclusions and outlook of the work within Section 5 and Section 6, respectively.

2. WCLL Small ESS BOP Configuration

The WCLL small ESS BOP features a pressurised water-cooled primary system with two separate loops representing the first wall (FW) and the breeding zone (BZ) cooling circuits. Both loops are connected to the PCS via two OTSGs giving four steam generators in total. Secondary power sources, namely the divertor casette (DIV-CAS), divertor plasma facing unit (DIV-PFU), and the vacuum vessel (VV) coolant loops have been connected to the PCS via three pairs of heat exchangers, where the DIV-PFU units are located on the low-pressure (LP), the DIV-CAS and VV units are placed on the high-pressure (HP) feedwater preheater line. The fresh steam is fed via the main steam line (MSL) to the steam turbine (ST) that consists of two high- and four low-pressure stages. Ultimately, the exhaust steam is condensed in the main condenser, closing the imperfect Rankine cycle of the power conversion system. The small ESS and the MSSG with their auxiliary systems are installed in between the tokamak and turbine islands. The CAD layout of the facility is depicted in Figure 1 highlighting the enlisted subsystems.
Transient scenarios enveloped two consecutive pulse-dwell phases where the pulse ( P f u s = 100%, P M S E H = 100% (molten salt electrical heater), P M S S G 5%) and dwell periods ( P f u s = 1%, P M S E H 40%, P M S S G = 100%) lasted 7200 and 600 s, respectively. The plasma ramps represent asymptotic time-dependent power functions describing the reactor’s thermal power variation between 1–100% under 100 s.
Prior to the plasma ramp-down the unloading of the turbine is initiated 500 s before the reactor rundown in order to achieve a permissible power gradient on the machine around −10%/min. As dwell commences the power load rapidly decreases in the blanket and secondary power sources. In order to compensate the diminishing enthalpy difference between primary and secondary systems, the small ESS discharge line is activated loading the molten salt SG. The synchronisation of the OTSG and turbine unloading with MSSG control is a crucial aspect of successful pulse-dwell transition, where numerous safety requirements have to be fulfilled simultaneously, e.g., pressure restrictions in feedwater heat exchanger (FWHX) shells and the deaerator (DEA), hot leg (HL) temperature limitations in the PHTS ( T w , m a x T s a t , H L ). On the top of these requirements, various goals pose challenges as well, for instance a 10% load has to be maintained on the turbine throughout dwell by a suitable re-alignment of the whole PCS.

2.1. Primary Heat Transfer System

The primary system is responsible for the cooling of the BB, divertor, and VV components of the reactor. The coolant enters the FW and BZ inlet collectors at ∼295 °C, 155 bar, hereafter the flow is distributed among 16 sectors via the cold fingers that connect the segments’ inlet ports and the collectors. As the 1/16 flow reaches the cold manifolds, the coolant is redistributed further among two inboard (IB) and three outboard (OB) segments. The cold water enters the segment at the top (IB) or ∼2/3 height (OB) of the segment, then the coolant passes downward via the FW and BZ spinal cords. In the lower section of each segment the flow path takes a U-turn, filling the FW and BZ inlet manifolds. As the coolant rises in the segments the inlet manifold flow rates gradually decrease in subsequent breeding units (BUs) whilst the outlet manifold flow rates increase correspondingly. In the head of the IB segments, the total segment inlet flow appears at the FW and BZ outlet ports, for OB segments the coolant takes another U-turn in the upper mixing volume, reverting finally to the water port at ∼2/3 height. The outlet flow enters the outlet manifolds at ∼328 °C eventually mixing the IB and OB loops’ coolant inventory in the hot collectors. The hot leg piping connects these collectors to the steam generators’ inlet junction on the top of the SGs at 152 bar. In the BZ loop each OTSG has a pair of pumps, while on the FW side one SG has one pump. Considering both loops, the pumps are running at a constant 100% speed during the entire operation. Relevant thermalhydraulic properties are tabulated in Table 1 with respect to pulse and dwell phase values.
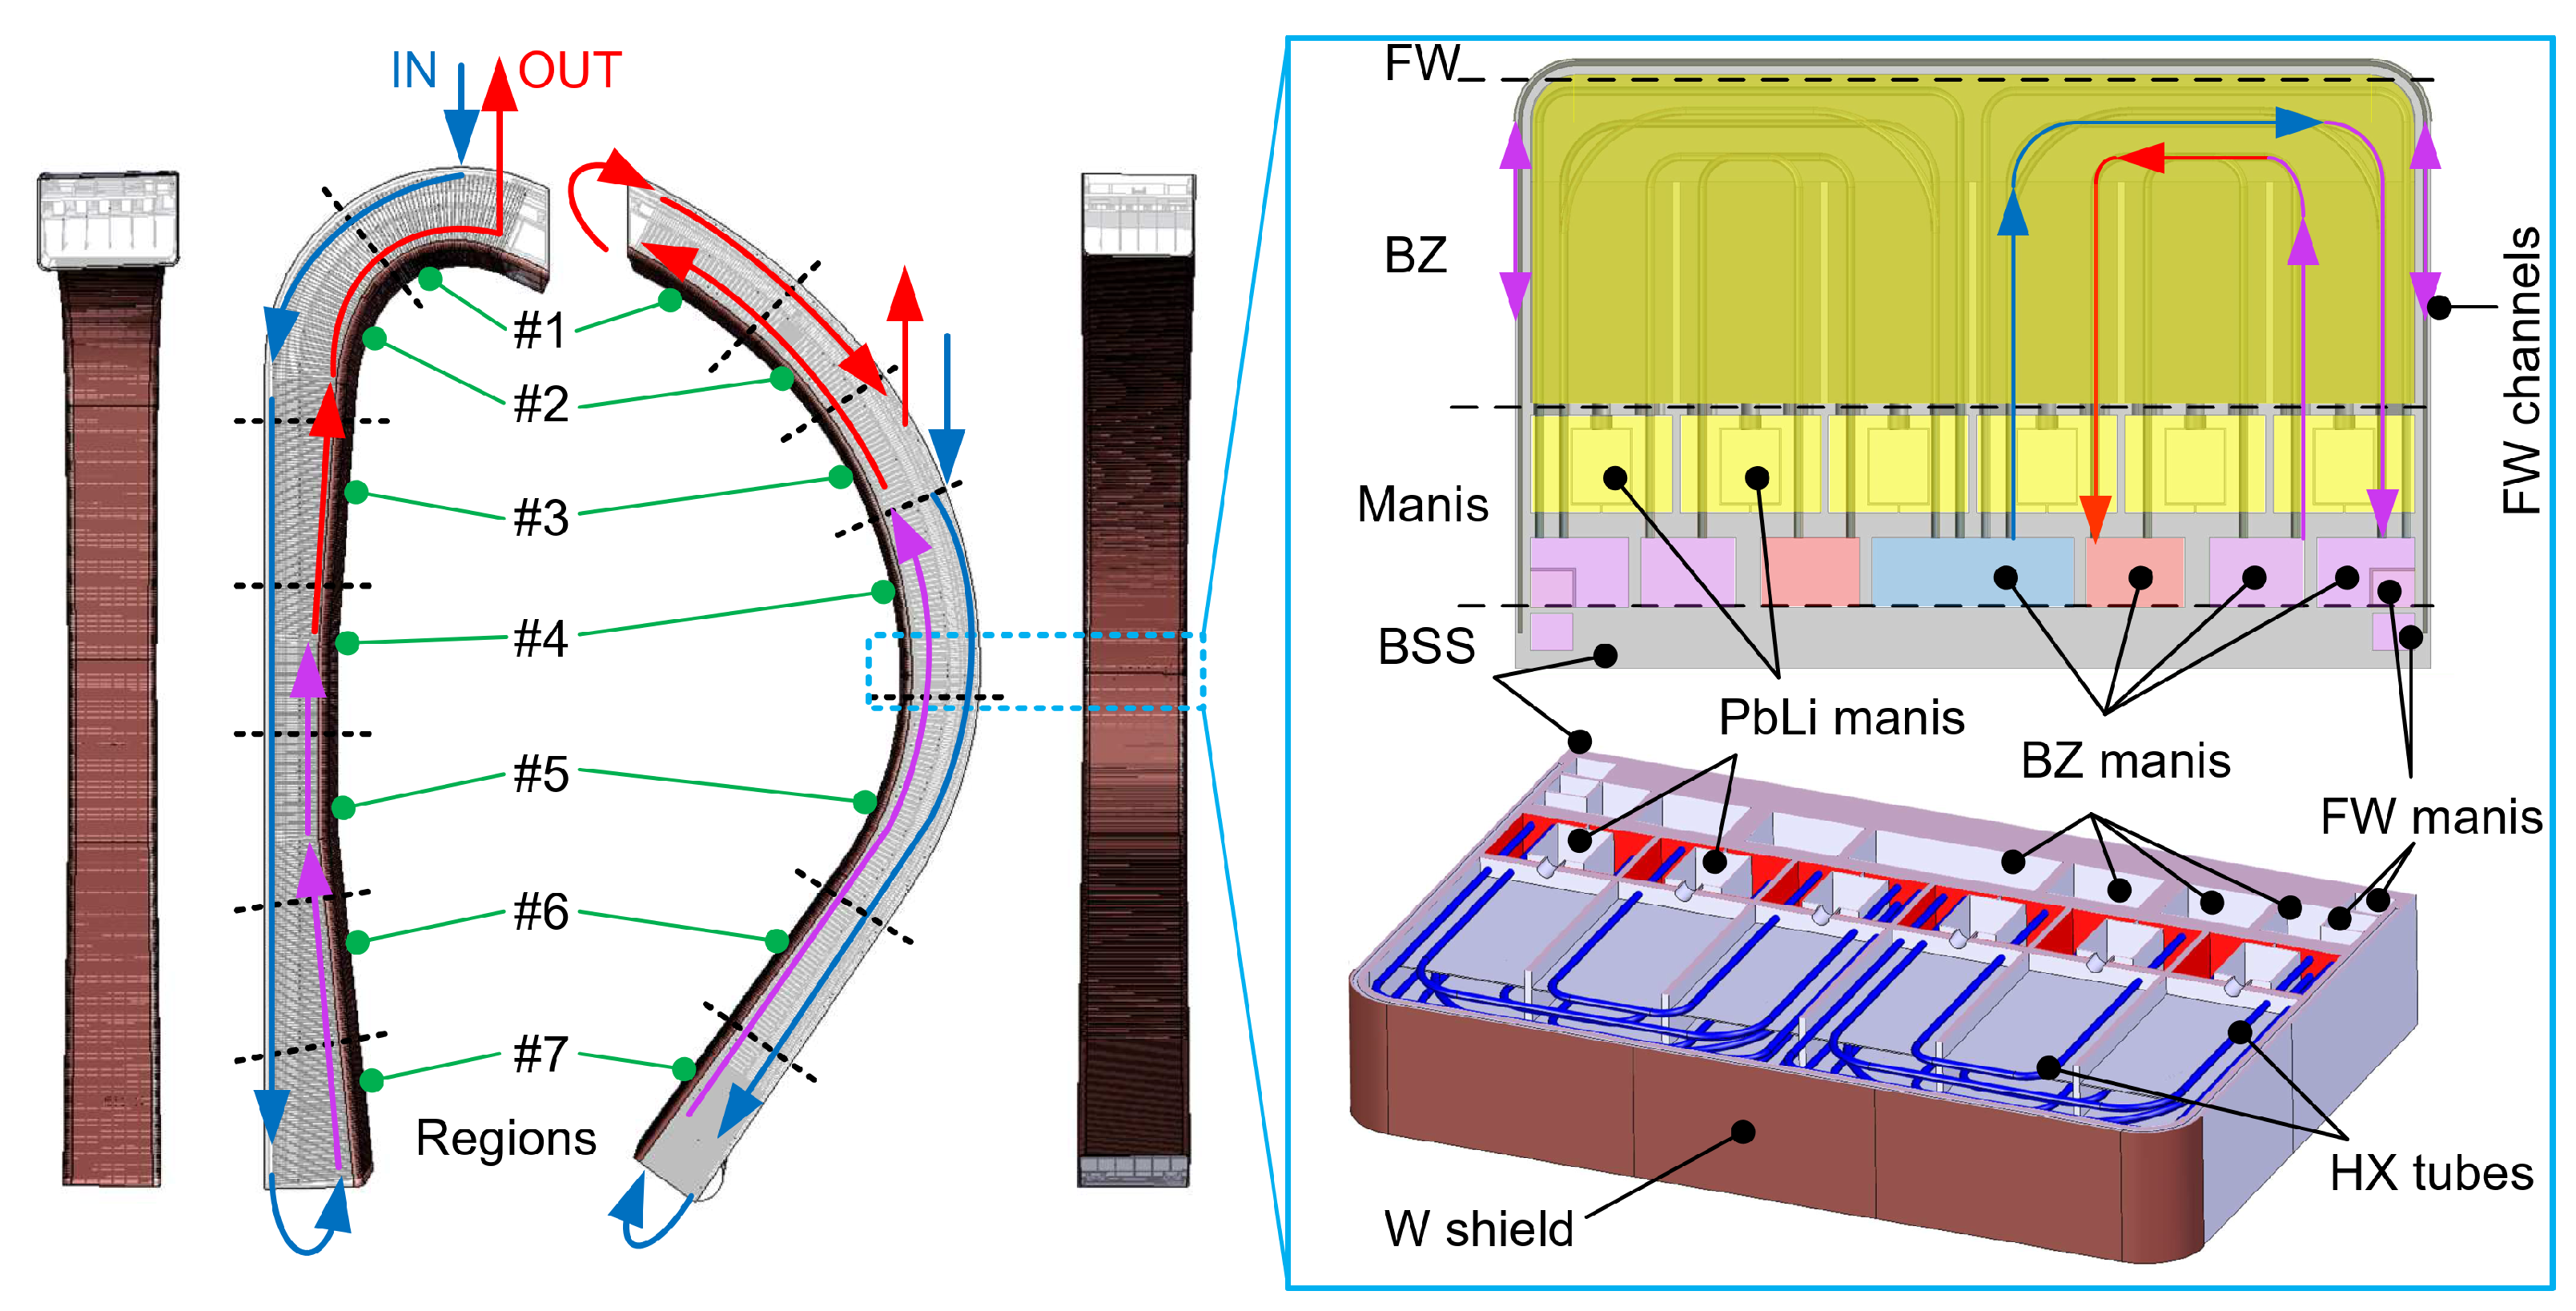
Each 22.5° sector accommodates two, nearly identical left and right IB segments (left-LIB, right-RIB) and three, more distinct outboard segments (left-LOB, center-COB, right-ROB). In addition to upfront differences in waterport arrangements and structures, the breeding units also show noticeable variation in terms of material inventories, i.e., geometry, power loads, and TH conditions. The current 2020 design is depicted in Figure 2 below, where the left side was dedicated to the IB design while the right side to the COB segment, featuring the layout of the equatorial BU (region #4). Volumes marked with yellow contain PbLi eutectic, the blue, purple and red manifolds refer to water junctions with increasing temperature. All manifolds are enclosed by the back support structure (BSS), made of Eurofer alloy.
Depending on the location, each segment contains 94–106 BUs stacked over each other between the lower mixing volume and the top of the segment. The layout of the equatorial COB unit is shown in Figure 2 featuring three arrays of coolant tubes ( Σ 22), the FW coolant channels ( Σ 20), the BZ filled with PbLi17 (90 at.% 6Li) and the coolant manifolds with the Eurofer skeleton. The PbLi coolant (yellow in Figure 2) enters the BZ via oval perforations in the manifold wall, the heated alloy exits the BZ via the outlet manifolds. Considering BZ loops, the cold water enters the inlet manifold (blue in Figure 2) before passing through the Eurofer heat exchanger tubes which lay across the PbLi manifolds and the BZ, leading the hot coolant to the outlet manifolds (red in Figure 2).

2.2. Power Conversion System

As mentioned before the PCS design was strongly influenced by commercial nuclear power plant architecture, where a two-stage feedwater preheater line supplies the boiler section with 228 °C water at 75 bar (see layout in Figure 3). The first stage incorporates the two LP heat exchangers (fed by the LP ST stages) and the twin DIV-PFU HXs. The coolant is collected in the DEA at ∼140 °C with a tank fill level at 45%.
Apart from a major role in coolant inventory management a proper DEA pressure control is also capable of preventing undesired transients in the secondary system. The feedwater pump (FWP) delivers the coolant to the SG collectors via the two HP heat exchangers (fed by the HP ST stages and the reheaters) and the DIV-CAS and VV HX pairs. Bypass lines were also installed on the HP preheater section in order to achieve better temperature and flow rate control during dwell. The feedwater collectors divide the total flow into three branches: (1) MSSG line, (2) FAR, and (3) NEAR collectors. Two latter lines are connected to the OTSG chains, the designation of the branches is a reminder of the 168 m difference in length. The main steam line gathers the fresh steam (67–70 bar, 300–330 °C) from the SG collectors supplying the turbine and the bleed lines. During ST (un)loading the bleed lines pressurise the feedwater preheaters’ shells in order to maintain the nominal feedwater temperature at the end of the preheater line throughout the entire operation.

2.3. Small Energy Storage System

As mentioned earlier, the small ESS design was conceived based on the principles of large scale industrial molten salt storage system technology, the current configuration’s coolant is HITEC®, an eutectic mixture of water-soluble, inorganic salts composed of NaNO3–NaNO2–KNO3 [6]. Since the small ESS has no connection to the PHTS a molten salt electrical heater increases the enthalpy of the salt, this heater receives electricity from the plant as an onsite consumer, alike coolant pumps. The pulse phase operation principle is as follows: the charging pump delivers the coolant of the cold tank (282 °C) to the electrical heater, after the heating of the salt (to 330 °C) the coolant arrives at the hot tank. The discharge pump supplies the MSSG with fresh hot salt, after passing through the SG the salt is collected in the cold tank. For the depiction of the system the reader is advised to return to Figure 1 and Figure 3.

3. Apros Model

The advanced process simulation (Apros) system code has been developed by VTT Technical Research Centre of Finland Ltd. and Fortum since 1986. The code provides three- and six-equation solutions for one-dimensional thermalhydraulic problems utilising a staggered space discretisation scheme. State variables are calculated in the center of the mesh cells (nodes), flow related variables are derived at the border of adjacent cells. Considering heat transfer modelling, a vast array of analytical and empirical correlations is available, in addition new formula can be implemented using Simantics Constraint Language (SCL) scripts. As a result of the EUROfusion-related work, nested user components were developed on top of the basic process component library of Apros, providing higher-fidelity solution with respect to the WCLL blanket and OTSGs. The homogeneous model has been applied considering nodes of the small ESS while the six-equation solution has been used in every other node filled with water or steam.
The general structure of the integral model can be seen in Figure 3 featuring some complementary elements compared to Figure 1, such elements were necessities to obtain satisfying plant control (e.g., steam dump line, make-up and let-down piping and steam bleed lines).
In order to provide basis for further comparison with other plant configurations the cycle net efficiency ( η c y ) has been derived for pulse and dwell phase, as given in [3] by:
η c y = W g r o s s W P C S , p u m p P B B + P D I V + P V V + P M S S G
where W g r o s s is the gross power on the ST shaft, W P C S , p u m p is the total pumping power of the PCS, P B B , P D I V , P V V and P M S S G are heat inputs from the BB, DIV (PFU and CAS), VV, HXs, and MSSG, respectively. Furthermore the overall plant net average efficiency ( η o ) was also calculated as:
η o = 0 t c y ( W g r o s s W p l a n t ) d t 0 t c y ( P B B + P D I V + P V V + P M S S G ) d t
where t c y is the length of a full cycle (7800 s), W p l a n t is the total power of onsite consumers (total pumping power and MSEH).

3.1. Primary Heat Transfer System

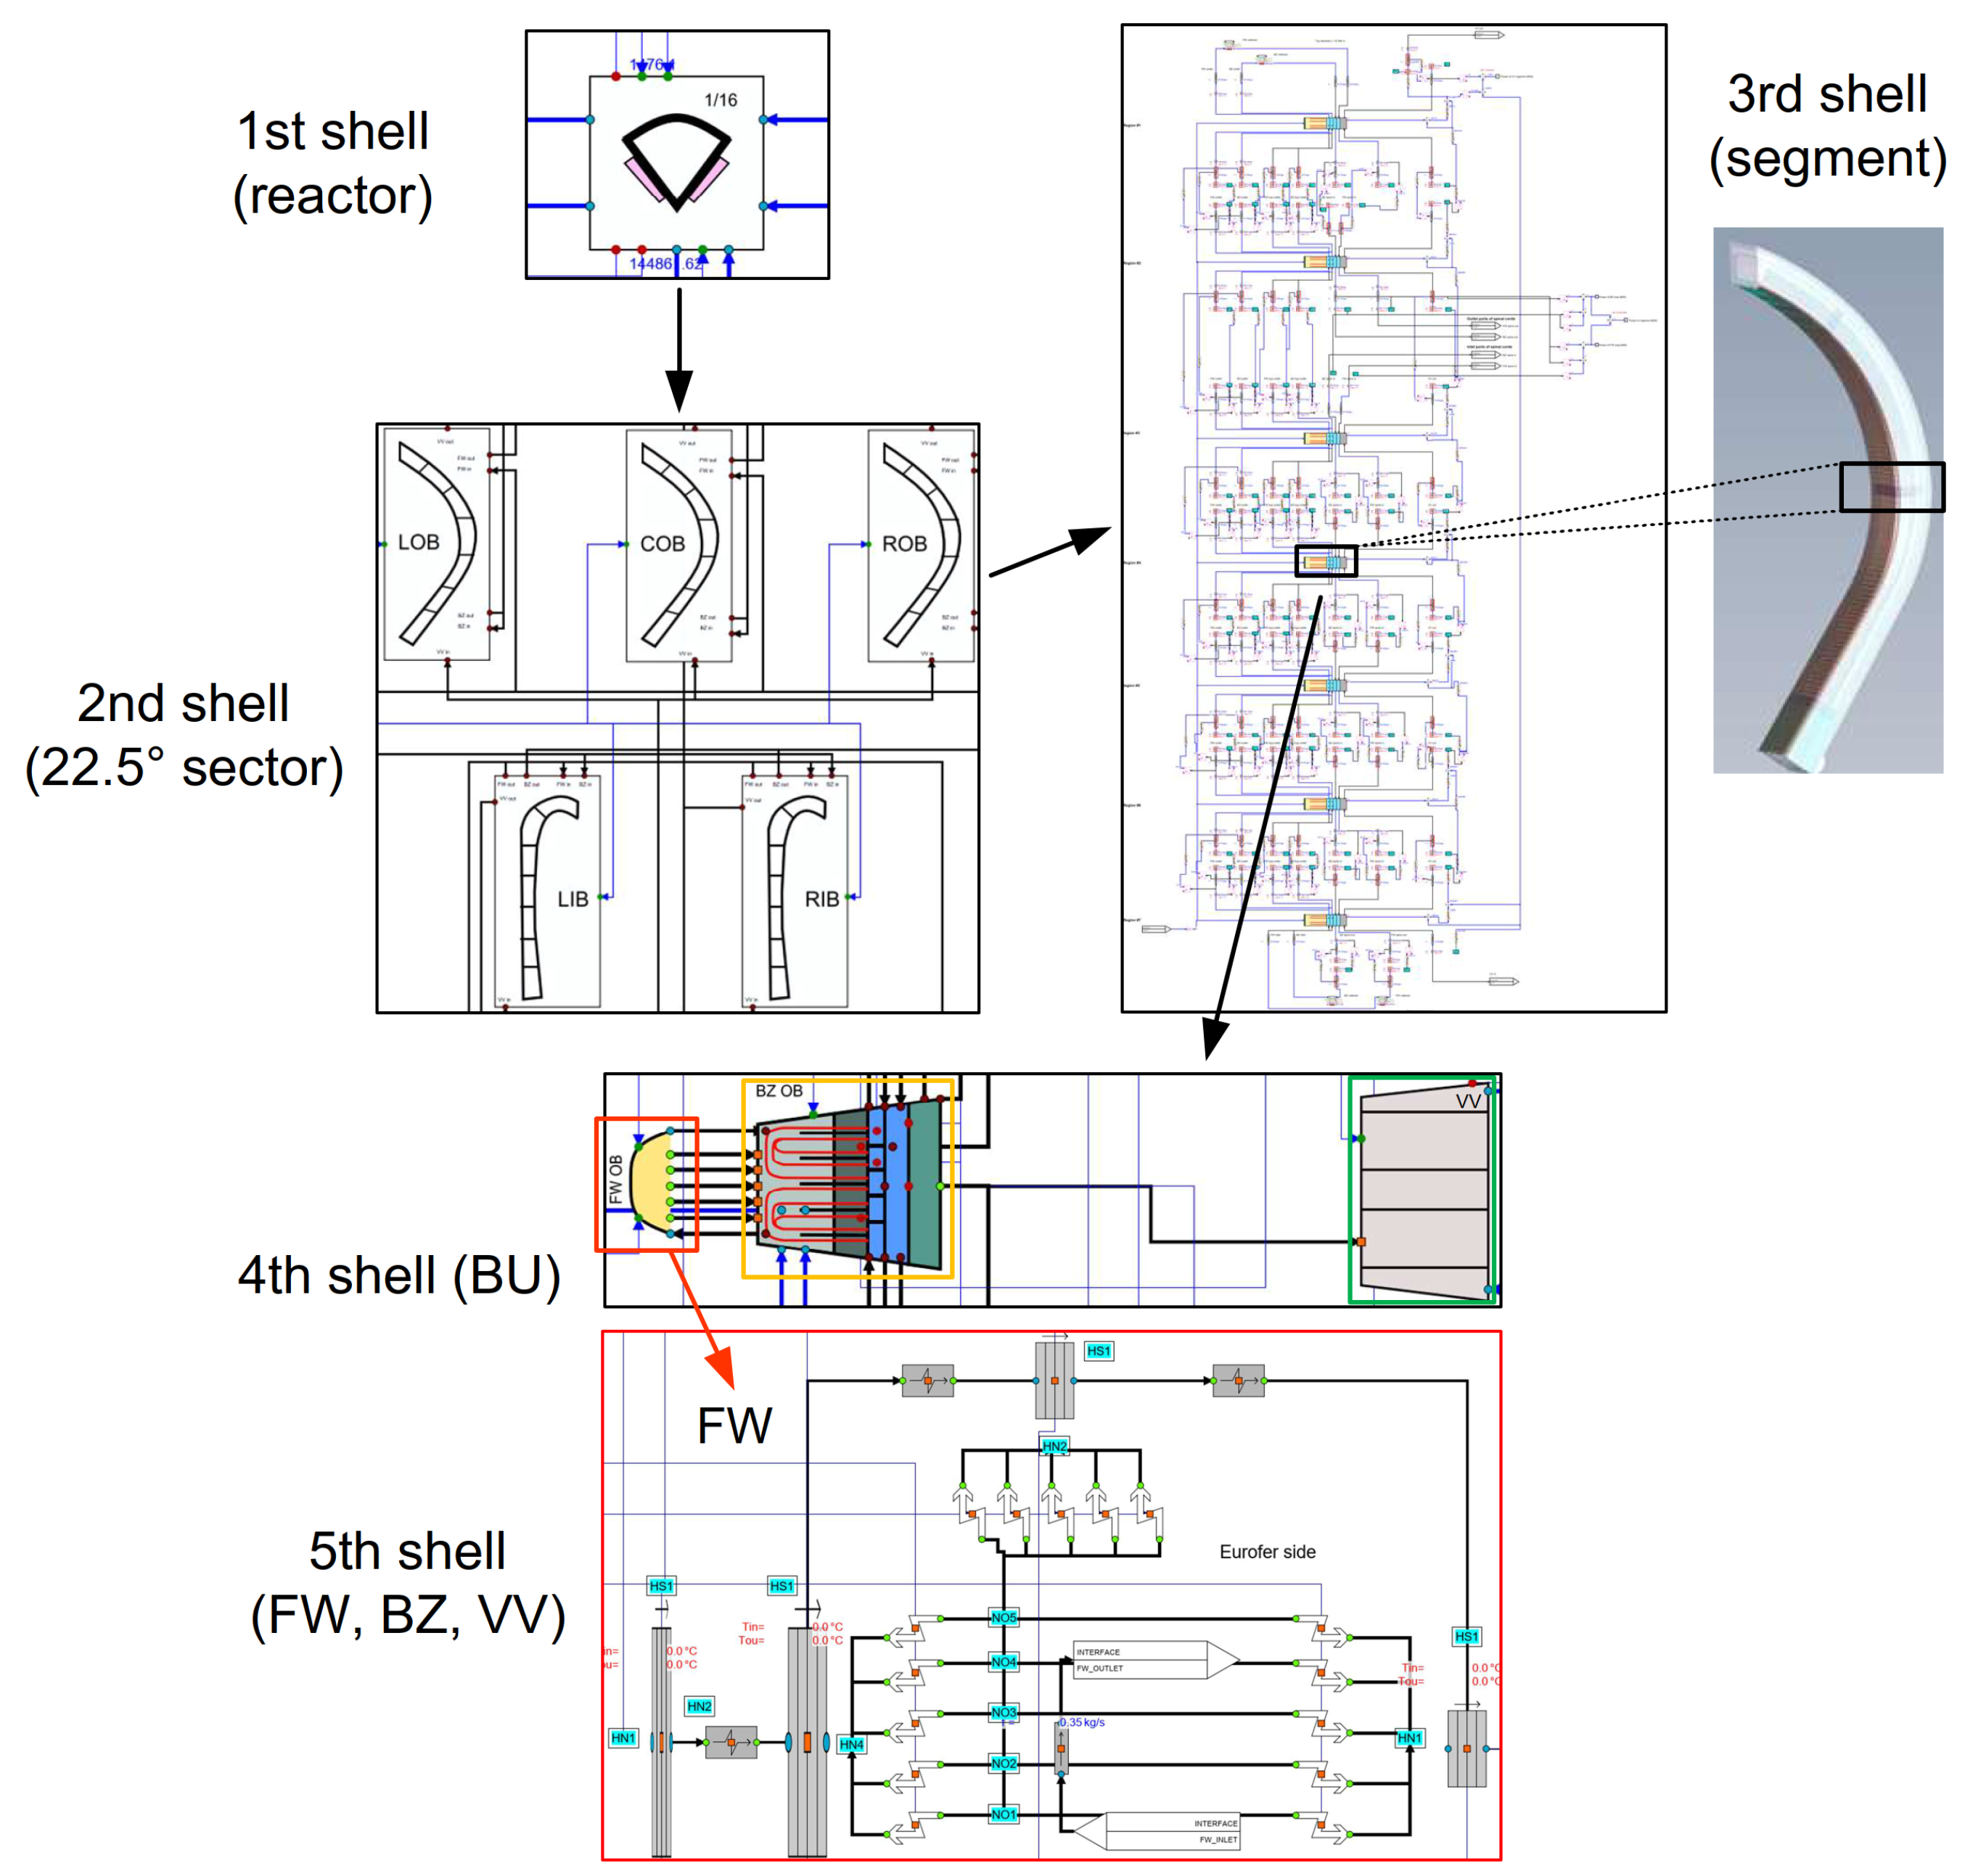
The blanket model was rebuilt in 2020 following the spatial discretisation principles of relevant plasma physics and neutronics models, also taking into account given CAD specifications. The complexity of the structure had to be tackled on a system code level whilst preserving the novelty of certain aspects, e.g., power deposition schemes, coolant, and dry mass inventories. In order to fulfil such requirements nested process components were created, with respect to the aforementioned factors, representing an interface between boundary conditions (BCs) and the thermalhydraulic model of the PHTS. The underlying algorithm of this BB model can be characterised as a non-linear onion scheme where the outermost shell is the interface between the PHTS/BC modules and the segments. Unlike in classical onion structures, process components on the lowest level receive information from the top (e.g., power) bypassing all the shells in between, thus the output information is directly affected by the input. As §2.1 pointed out, in total 5 segments compose one 22.5° sector, thus the reactor model contains 5 segment components (2nd shell). Each segment accommodates 7 BU components, corresponding mixing volumes, water ports, and interfaces between the BUs (3rd shell).
The poloidal power distribution has been defined for 7 regions, separately for IB and OB segments (uniform for OBs), thus the breeding units of these regions have been collapsed into 7 representative BUs, each corresponding to the average BU of its region. Inside the BU model three further user components have been placed: (1) FW (2) BZ, and the (3) VV components with their dependent interfaces (4th shell). These modules contain the heat structures (HSs), piping and power boundary conditions. The general structure can be seen in Figure 4 opening up the information flow and the shells of the reactor. Such an approach made it possible to customise FW, BZ, and VV compartments, independently from one another, in terms of nodalisation and power deposition. The radiative power distribution was derived by EUROfusion partners using the ASTRA transport code [7] developed by IPP for core radiative flux, the SOLPS code [8] for the scrape-off-layer radiative flux and the CHERAB code [9] developed by Culham Centre for Fusion Energy (CCFE). Nuclear heating deposition schemes were obtained with Monte Carlo N-particle analyses [10,11] concerning W, PbLi, water, Eurofer, and SS316L (VV) domains.

3.2. Power Conversion System

The secondary system was built using basic Apros process components, such as heat exchangers, various valves, pumps, tanks, and turbine elements. Concerning the once-through steam generators, two new user components were dedicated to the coupling of the FW and BZ loops to the PCS. The BZ OTSG design was set up by the University of Napoli, as a member of the BOP work package, utilising a modified Babcock and Wilcox layout as a template while incorporating Westinghouse-type tubesheets. The SG is modified in the sense that no recirculation takes place between the downcomer annuli and riser volume, unlike in the generic layout. The development of the component is still in progress exploring alternatives as an attempt to find the most suitable configuration for the needs of the primary system, nonetheless present paper will discuss the behaviour of the first prototype. Taking into account foreseeable limitations in terms of geometry and TH parameters the BZ OTSG was scaled down by VTT to derive the FW OTSG. Since DEMO de jure represents a nuclear power plant, the ASME boiler and pressure vessel code standard’s class 1 relevant section was applied during the sizing of both components [12].
The cross section of the BZ OTSG can be seen in Figure 5 also depicting the Apros component, note that FW and BZ OTSG components share their topology. The feedwater enters the riser volume via the downcomer annuli, the coolant is heated to its boiling point, evaporated, and superheated while rising through the 15 broached tube plates. The fresh steam leaves the SG via the outlet manifold connecting the OTSGs to the steam collectors (NEAR and FAR). General properties of the SGs are given in Table 2 with respect to nominal values, dwell phase powers, and flow rates are reduced to 1%.

3.3. Small Energy Storage System

The small ESS has been modelled explicitly featuring the elements described in §2.3. Earlier it was found that a recirculation line, installed on the discharge line, could enhance control quality significantly, thus an additional pipeline was connected to the discharge and suction points of the discharge salt pump. During pulse phase the control valve (CV) of this line is in fully open position, as for dwell the recirculation line closes, i.e., the full flow is directed to the MSSG. This control scheme was proven to be very reliable in terms of TH parameters throughout the pulse-dwell cycle. Referring back to Section 3, the molten salt loop used a homogeneous solution for its TH nodes filled with salt. Nonetheless due to uncertainties of auxiliary systems (pressure control), the salt tanks have been modelled by boundary conditions where dynamic enthalpy calculations have ensured that the tanks’ proper transient behaviour is accounted for. The pressure of these tanks was set to 8 bar in order to provide a sufficiently high back pressure for salt pumps. General parameters of the small ESS model can be found in Table 3 where m disch . refers to the cold pump flow rate (cold tank→MSEH/hot tank) and m ch . denotes the hot pump flow rate (hot tank→recirc. line/MSSG/cold tank).

3.4. Logics

The control scheme of the plant revolves around the needs of the blanket, i.e., the main goal of the PHTS and PCS logics is to ensure the cooling of the BB at all times. In the current arrangement the PHTS pumps are running at full speed also in dwell according to design specification. The design objective, to maintain a constant average temperature on the SGs primary side ( T S G , p ), has been simplified in the simulation with the requirement to preserve a ∼17 °C subcooling in hot legs until a comprehensive regulation scheme is realised. Whilst providing a robust heat sink, a secondary objective of PCS logics is to keep the PCS in a low-load regime during dwell, ready for the subsequent plasma ramp-up. Due to the large, periodic displacement of the coolant inventory the DEA pressure is controlled, in this model, by a bleed line (maintaining 3.5 bar), FWHX shell pressures are also controlled from the bleed line since turbine extractions close down at the beginning of turbine unloading and open up only after reaching nominal conditions on the MSL.

4. Results

The transient analysis entails two consecutive pulse-dwell cycles with a 1200 s pulse phase at the beginning. The complete pulse phase is 7200 s including two plasma ramps before and after the flat-top period (100 s + 7000 s + 100 s), the dwell phase lasts 600 s thus one full cycle is 7800 s. Figures in Section 4.1, Section 4.2, Section 4.3 follow this sequence of events where grey rectangles mark the two dwell periods. The reported results were recorded after driving several cycles and adjusting parameters, e.g., molten salt tank levels, valve driving times, and controller characteristics.

4.1. Primary System Behaviour

Power trends are depicted in Figure 6 featuring the blanket, secondary power sources and the molten salt SG. As the reactor power decreases from 100 to 1% the small ESS discharge line activates increasing the salt flow rate on the primary side of the MSSG, thus bringing its power up to 271 MW. As an improvement the MSSG loading time was shortened by 10 s (to 90 s) in order to achieve a smoother feed-transition on the MSL. Due to PHTS thermal inertia and OTSG behaviour, the MSSG unloading process had to be extended in order to supply the turbine for some extra time after dwell. As a solution, the discharge line CV followed a 200 s long asymptotic flow rate curve.
Regarding BB coolant loops and the primary side of DIV-VV loops, pressure deviations were in the range of 1 to 2 bar, illustrated in Figure 7, thus no significant perturbation was observed while BZ and FW loop trends practically overlapped. Therefore, it was concluded that the continuous pump operation and the pressurisers of the mentioned systems effectively damped perturbations coming from the reactor chamber and the PCS.
FW and BZ coolant temperatures are given in Figure 8 with respect to hot and cold collector temperatures, i.e., SG inlet and outlet temperatures of the OTSGs where three distinct sections can be defined according to governing control logics. During turbine unloading temperatures varied by 1–2 °C, however, as plasma ramp-down commenced, HL temperatures (OTSG inlet) started to drop significantly. As the secondary coolant inventory of the SGs was reduced substantially, this cool-down trend constituted section #1 (1700–2000 s). Shortly after the beginning of dwell SG feedwater inventories stabilised as flow rates on the PCS-side feedwater collectors reached their dwell phase set-points, i.e., heat transfer rates saturated as primary side Δ T values nearly halved in both FW and BZ loops.
In section #2 (2000–2400 s), hot leg temperatures continued to fall as OTSG water levels gradually recovered, nonetheless the primary FW OTSG Δ T did not change noticeably compared to #1 due to tranquil TH conditions in the SGs. In section #3 (2400–3000 s), the OTSG feedwater flow rates were briefly decreased in order to increase primary Δ T prior to SG reload, thus the SG feedwater logic does not overcool the primary system while flooding the heat exchangers. After the short decrease, the feedwater flow rates were once again increased following the average primary loop temperatures until reaching nominal conditions around the end of the ST reload. The hereby outlined protocol highlighted that PHTS primary control was mainly realised by OTSG feedwater control, more light will be shed on the reason of such practice and its further consequences in §4.2 where the OTSG operation will be discussed in detail.

4.2. Secondary System Behaviour

Using Equation (1) the cycle net efficiency for the PCS ( η c y ) in pulse and dwell was calculated as 30.3% and 25.6%, respectively, while Equation (2) yielded an overall plant net average efficiency ( η o ) of 26.7%.
To some degree, pulse phase control schemes have relied on the output of preliminary (steady state) heat balance analyses, e.g., with respect to MSEH power, FWHX shell pressures, etc., while in other cases logics had to be tailored to meet the requirements of both phases. The OTSG feedwater control valves directly controlled PHTS coolant temperatures as described earlier, during pulse the average primary coolant temperature of the given OTSG was the control variable for the SG feedwater control valves. If negative discrepancy appeared ( T ¯ S G , p < 311.5 °C) the valves decreased flow rates, otherwise vice versa.
This method was a simple and robust solution to mitigate smaller anticipated perturbations during pulse, yet the challenges posed by plasma ramps had to be tackled using a more thorough approach that takes into account the following three main interdependent factors, affecting general system stability: (1) PHTS hot leg temperature has to remain well below saturation ( T H L T s a t , H L ), (2) the collapsed water level in OTSG risers has to be maintained above the upper rim of the waterports to avoid serious downcomer voiding ( L c o l l > L w p —see in Figure 5), and (3) the steam quality in the MSL has to be kept as high as possible in order to prevent erosive damage on the turbine blades ( q M S L > 99 % ). One can see that the enlisted variables can oppose one another, for instance a higher HL coolant temperature would induce flow rate increase on the SG secondary side, albeit process could lower steam qualities or even flood the SG under far-out operating conditions. Considering another scenario, one can assume that low HL temperatures would force the SG control valves to close, ultimately decreasing collapsed water levels in the riser. This action could lower the water level below the waterports’ upper rim leading to rapid downcomer voiding further propagating and amplifying an initially minor perturbation (It has to be noted though that the process and automation design of the BOP model does not yet account for possible safety feature design aspects, thus the hereby considered factors represent a preliminary and conservative take on future safety criteria).
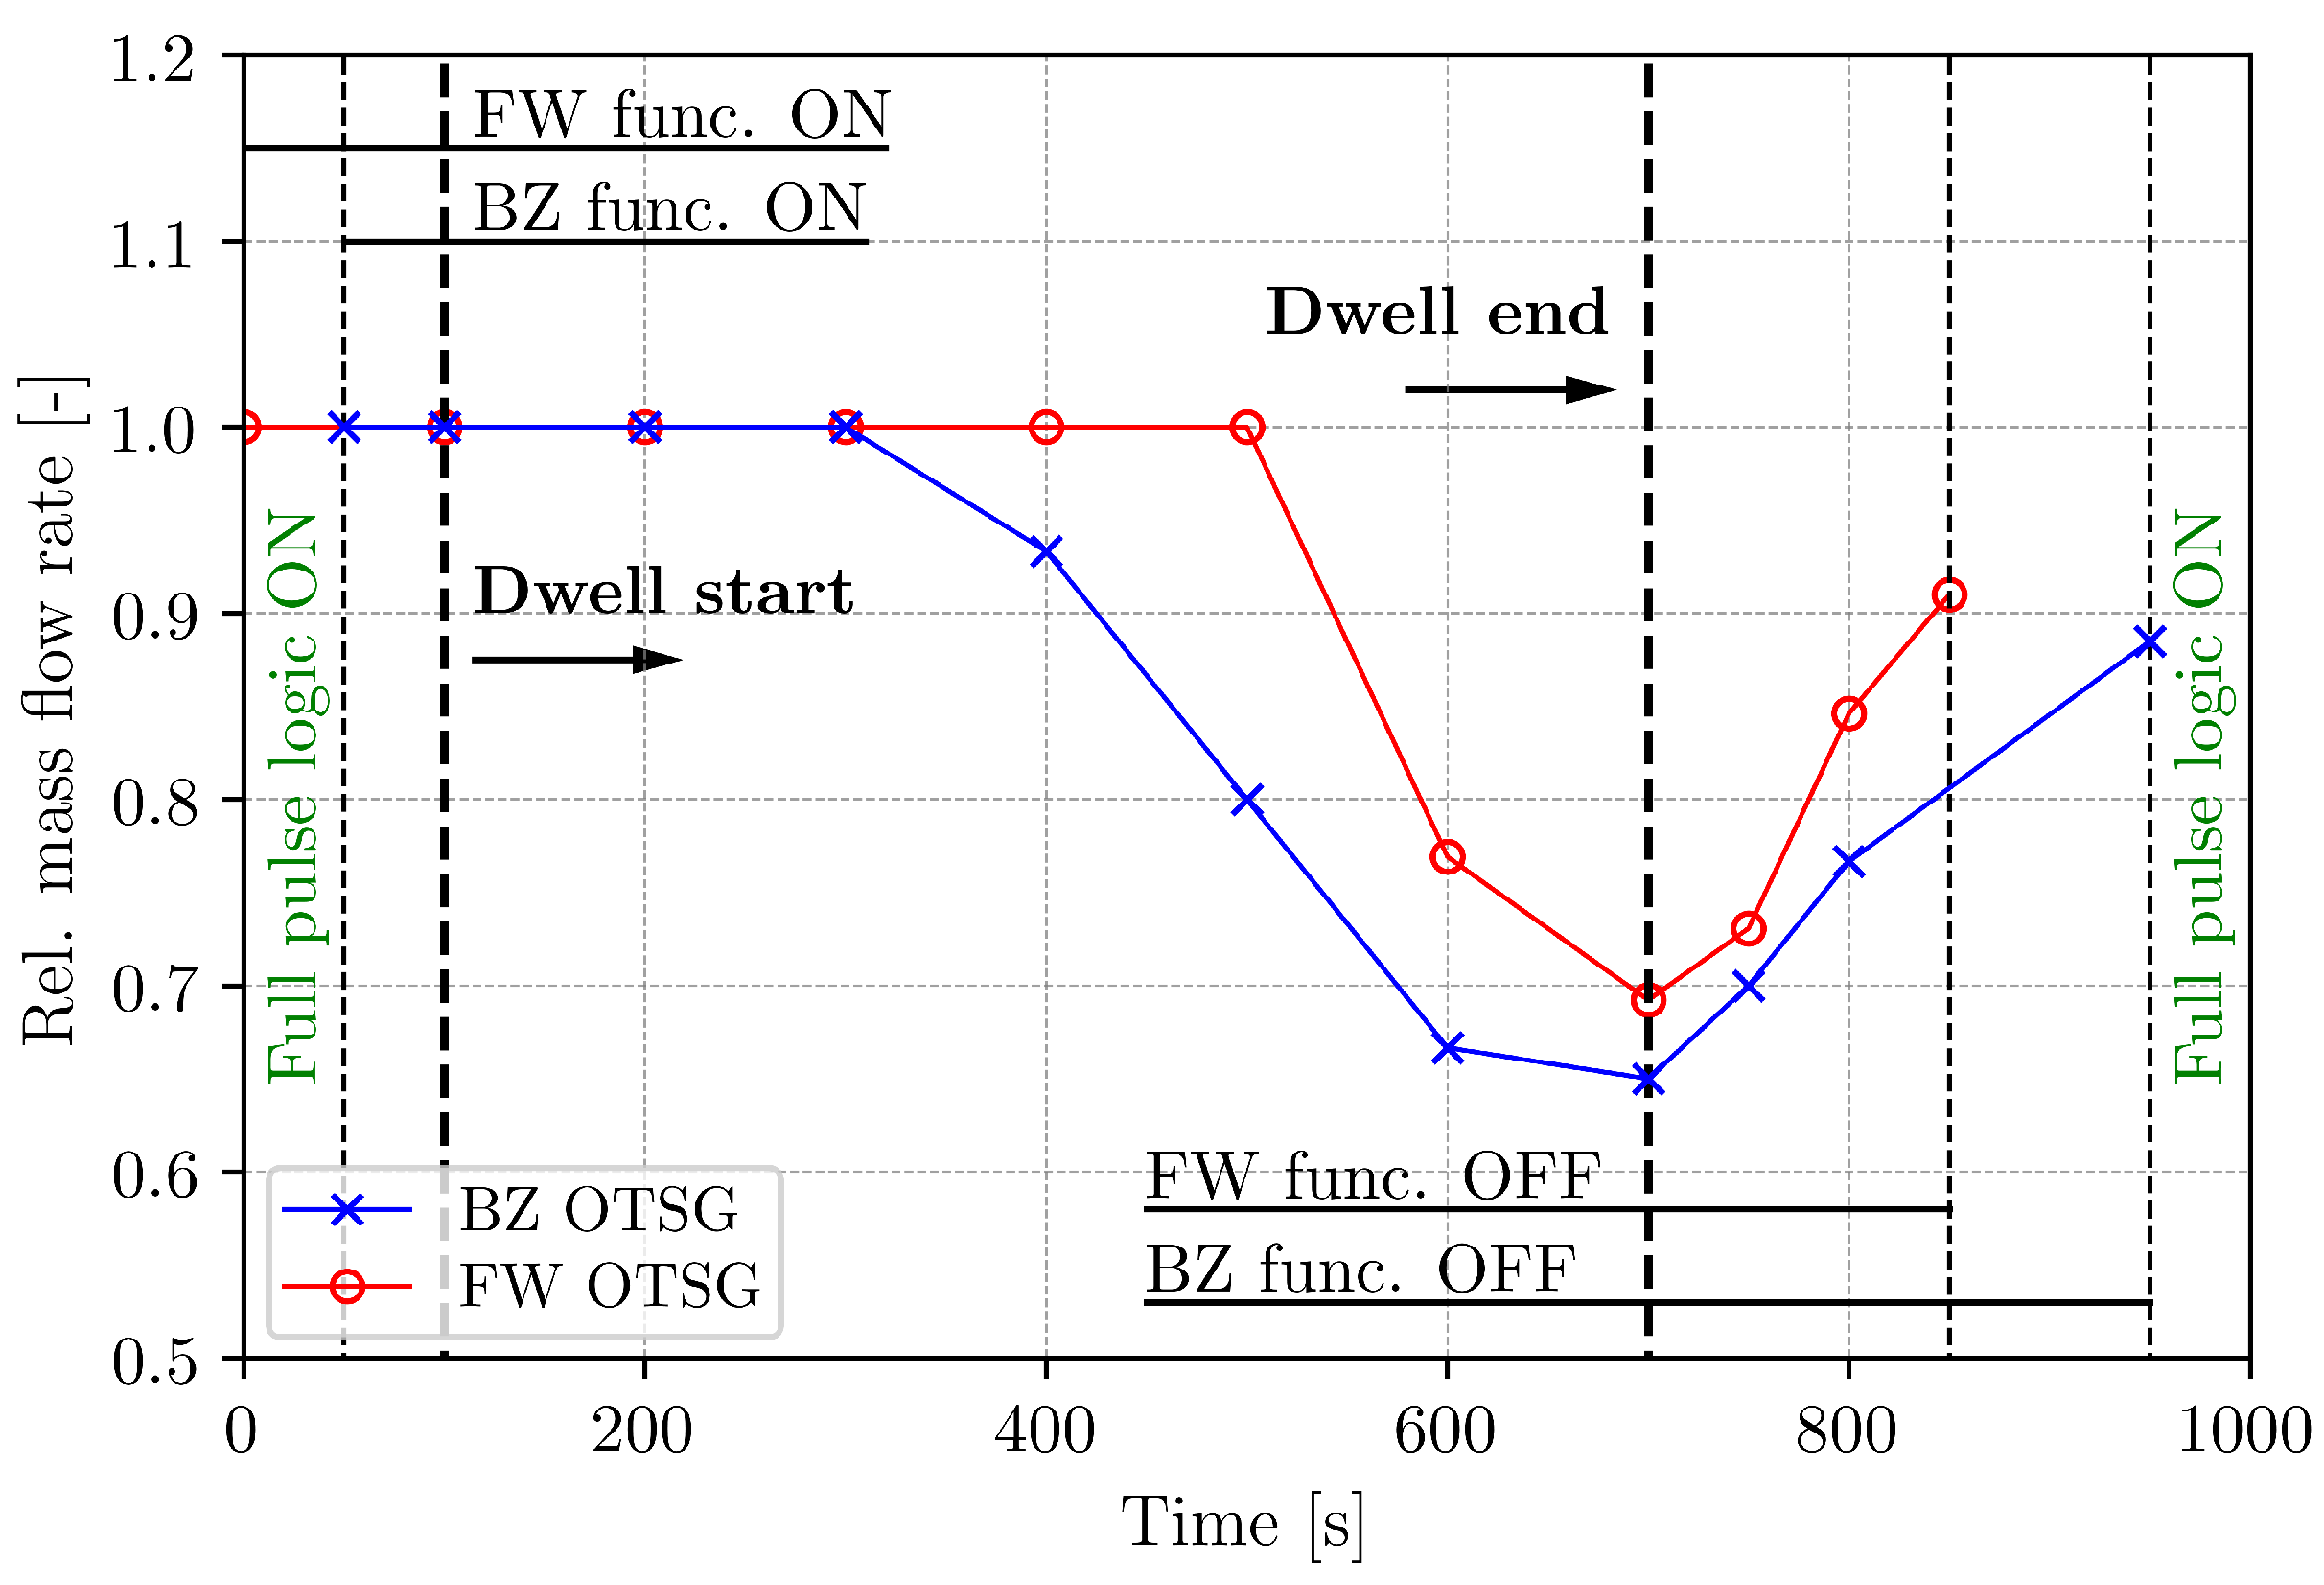
In order to avoid unintentional transients and optimisation pitfalls of such a complex system, a workbench solution was conceived offering a helping hand to developers of the WCLL plant and control systems during the upcoming conceptual development phase of DEMO. The solution is based on a steam generator feedwater CV logic, following a flow rate function, hence decoupling primary and secondary side response from the OTSGs during plasma ramps and dwell. The normalised flow rate function is depicted in Figure 9 below with respect to FW and BZ OTSG control loops.
The motivation behind the functions can be understood best by studying OTSG collapsed water levels, Figure 10 depicts OTSG-averaged riser and DC water levels. At 0 s the reactor rundown initiates and the dwell phase FW OTSG logic takes over, however pulse phase flow rates are maintained for an additional 50 s on the BZ branches in order to compensate PHTS inertia. At 50 s in the plasma ramp the dwell phase logic seizes control on both FW and BZ control branches, setting a constant flow rate on every OTSG feedwater CV. At 400 s after the start of dwell the flow rates are decreased on each SG reducing the cooling of the PHTS. Such action was necessary to decrease the difference between the after-dwell and pulse phase value of the average primary coolant temperature (311.5 °C).
At the end of dwell feedwater flow rates are increased as plasma power rises between 700 and 800 s, ensuring also that collapsed water levels remain above the waterports’ upper rim. This post-dwell protocol is enabled for 150 s in case of FW OTSGs and 250 s for BZ OTSGs, where the difference is due to the different inertia of the two loops. By maintaining acceptable water levels in the risers the primary coolant temperature inevitable decreases by the end of dwell to some extent. Lowering flow rates, then gradually increasing them at a lower gradient leaves time for the blanket to warm up the hot legs and approach pulse phase primary side coolant Δ T. At 850 s the FW OTSG dwell logic is disabled, the FW OTSG feedwater control valves are driven only by the pulse phase logic afterwards. Correspondingly at 950 s (250 s after dwell end) the BZ OTSG dwell logic hands over the control to the pulse phase logic. The closer the primary side Δ T and hot leg temperature to their nominal values the smoother the transition into the period where pulse phase logics have full control over OTSG CVs.
Steam flow rates are depicted in Figure 11 with respect to HP, LP stages, and the steam dump line (DL). At the beginning of the unloading process (600 s before dwell) extraction lines close along the shaft, thus the steam flow rate at the 4th LP stage (LP4) outlet converges to the value taken at HP1 inlet. As dwell is reached ( Δ p M S L = 4.5 bar) the steam dump-line remains open to divert the excess flow to the main condenser while the thermal inertia of the BB provides some surplus steam in addition to the molten salt SG. In Figure 11, the LP2 flow rate is identical to LP1, this is due to the fact that earlier the LP1 extraction was used as primary feed for deaerator pressure control. Preliminary calculations showed that the periodic turbine operation posed challenges on the mentioned control loop, thus the extraction line was closed and the DEA bleed line was activated for pulse, consequently simplifying and improving control.
Considering the main condenser the observed pressure transient was in close agreement with heat balance analysis where shell pressure varied between 27.2 to 50.0 mbar. In addition to incorporating the flow of the dump line, the condenser served also as a pressure buffer of the DEA. Originally the DEA was pressurised by an LP1 extraction however as turbine operation had been tested, such arrangement was not deemed to be feasible during transients thus the DEA feed was moved to the MSL, where no significant pressure transient was postulated. Since DEA inventory shows substantial change (±39 t between pulse-dwell) a stable steam source (MSL) and a reliable low-pressure point (main condenser) are essential for a firm DEA pressure control. DEA collapsed water level and pressure trends are shown in Figure 12. It can be seen that the current system handled the DEA pressure with a margin of ±0.08 bar despite the 0.7 m level variation.
Preheater line temperatures were adjusted via preheater HX shell pressures, considering FH1HX the pulse phase pressure was maintained in dwell, as for FH2HX the pressure was increased by 50%. Moving onto the high-pressure stage larger relative pressure corrections had to be made due to the order of HXs in the preheater chain. Since secondary power sources ramped down, their bypass lines opened up meaning that the pulse phase Δ T had to be preserved only by FH(3,4)HXs, hence the FH3HX shell pressure was increased by 45%, while maintaining pulse phase pressure in FH4HX. The feedwater temperature trends are depicted in Figure 13 indicating a ±5 °C variation in FH4HX outlet temperature.

4.3. Small ESS Behaviour

Considering the periodic, high amplitude variation in salt flow rates, as shown in Figure 14a, concerns might be raised regarding mechanical stresses of components located on the discharge line. Comparing flow rate gradients ( F g [kg/s2] = [N/m]) to weight forces ( F w [N/m]) on the unit length it was found that the induced stresses were negligible. Corresponding tank levels are depicted in Figure 14b, where a ∼5.5 m (∼2300 t) displacement can be seen between charge and discharge periods. Such a trend implies that the current 1362 m3 salt inventory was mostly depleted leaving a residual salt reserve of ∼440 t per tank per period. Note that in this configuration the cover gas volume was not taken into consideration, such parameters will be defined later on during the conceptual development phase.

5. Synopsis

Development and analytical work, carried out for the DEMO WCLL small ESS integral Apros thermalhydraulic model has been discussed. A new blanket concept was introduced utilising a layered structure where the segments’ spatial discretisation and power deposition schemes follow the trends of neutronics models. Once-through steam generators have been implemented in Apros using a similar, nested architecture as the breeding blanket model. The transient simulations outlined the complexity of the challenges facing the control logics, where engineering solutions have to be derived respecting all safety criteria. In order to provide a reference case for future development a simplified OTSG control scheme was obtained highlighting the narrow operating margins of both PHTS and PCS.

6. Outlook

Carrying on with the development of the BB model the power deposition schemes have to be refined. In the current setup each material compartment has a homogeneous volumetric power distribution that is adjusted only in the toroidal direction, neglecting radial gradients. As the BU design matures, with respect to certain components, e.g., FW, BSS or in a broader context on segment level, the blanket model shall follow the specifications in any case. The OTSG design is still under development where alternative options are being considered, e.g., allowing internal circulation between riser and DC volumes. Model performance will be benchmarked during 2021–2022 and additional finite element method analyses will support the system code results. Keeping in mind the dimensions of the PHTS and PCS, where the total piping length yields ∼6.9 km and ∼2.1 km for primary and secondary systems, respectively, the issues of heat and pressure losses will have to be tackled as well. Aside from mitigating such losses, energy can still be recovered in various aspects, e.g., from dumped steam via recuperative heat exchangers (FHd(1,2)) on the condenser-deaerator let-down line, where the dumped steam heats the cold condensate before it enters the DEA (see Figure 3). This small system recycles only a portion of the total enthalpy loss on the steam dump valves, ≈168 kWh/cycle is still being ejected from the PCS via the main condenser. In recent Apros 6.11 release a new iteration scheme, dedicated to molten salt-inert gas systems will be available, thus the small ESS model will be refined accordingly, removing obsolete boundary conditions.

Author Contributions

Data curation, M.S.; Validation, S.N.; Writing—review & editing, M.S. All authors have read and agreed to the published version of the manuscript.

Funding

This research was funded by the Euratom research and training programme 2014–2018 and 2019–2020 under grant agreement No 633053.

Acknowledgments

This work has been carried out within the framework of the EUROfusion Consortium and has received funding from the Euratom research and training programme 2014–2018 and 2019–2020 under grant agreement No 633053. The views and opinions expressed herein do not necessarily reflect those of the European Commission.

Conflicts of Interest

The authors declare no conflict of interest.

Abbreviations

The following abbreviations are used in this manuscript:
AprosAdvanced Process SimulationIBInboard
AUXBAuxiliary BoilerIHTSIntermediate Heat Transfer System
BBBreeding BlanketLIBLeft Inboard
BCBoundary ConditionLOBLeft Outboard
BOPBalance Of PlantLPLow-pressure
BSSBack Support StructureMSMoisture Separator
BUBreeding UnitMSEHMolten Salt Electrical Heater
BZBreeding ZoneMSLMain Steam Line
CLCold legMSSGMolten Salt Steam Generator
COBCentral OutboardOBOutboard
CVControl ValveOTSGOnce-Through Steam Generator
DCDowncomerPCSPower Conversion System
DEADeaeratorPHTSPrimary Heat Transfer System
DEMODemonstration Power PlantRHReheater
DIV-CASDivertor CasetteRIBRight Inboard
DIV-PFUDivertor Plasma Facing UnitROBRight Outboard
DLDump LineSCLSimantics Constraint Language
ESSEnergy Storage SystemSGSteam Generator
FHFeedheaterSTSteam Turbine
FWFirst WallTHThermalhydraulic
FWHXFeedwater Heat ExchangerUCUser Component
HCPBHelium-Cooled Pebble BedVVVacuum Vessel
HLHot legWCLLWater-Cooled Lithium-Lead
HPHigh-pressure
Variables
Δ p M S L MSL pressure loss P M S E H MSEH power
η c y Cycle efficiency P M S S G MSSG power
η o Overall efficiency P n o m Nominal power
A H T Heat transfer area P S G SG power
F g / F w Gravitational/weight force q M S L Steam quality in MSL
L c o l l Collector water leveltTime
L w p Waterport elevation t c y Cycle length
m B Z BZ loop primary flow rate T c o l d , t a n k Cold salt tank temperature
m d i s c h . / m c h . Discharge/charge salt flow rate T H L Hot leg temperature
m F W FW loop primary flow rate T h o t , t a n k Hot salt tank temperature
m s e c SG steam flow rate T o u t SG steam temperature
p H L Hot leg pressure T s a t , H L Saturation temp. in HL
p o u t SG steam pressure T S G , p Primary side SG temperature
P B B BB power T w , m a x Max. water temperature in PHTS
P D I V DIV power W g r o s s Gross power
P V V VV power W P C S , p u m p Pumping power of the PCS
P f u s Fusion power W p l a n t Plant power

References

  1. Hernández, F.; Pereslavtsev, P.; Kang, Q.; Norajitra, P.; Kiss, B.; Nádasi, G.; Bitz, O. A new HCPB breeding blanket for the EU DEMO: Evolution, rationale and preliminary performances. Fusion Eng. Des. 2017, 124, 882–886. [Google Scholar] [CrossRef]
  2. Nevo, A.D.; Arena, P.; Caruso, G.; Chiovaro, P.; Maio, P.; Eboli, M.; Edemetti, F.; Forgione, N.; Forte, R.; Froio, A.; et al. Recent progress in developing a feasible and integrated conceptual design of the WCLL BB in EUROfusion project. Fusion Eng. Des. 2019, 146, 1805–1809. [Google Scholar] [CrossRef] [Green Version]
  3. Barucca, L.; Bubelis, E.; Ciattaglia, S.; D’Alessandro, A.; Nevo, A.D.; Giannetti, F.; Hering, W.; Lorusso, P.; Martelli, E.; Moscato, I.; et al. Pre-conceptual design of the EU DEMO balance of plant systems: Objectives and challenges. Fusion Eng. Des. 2021, 169, 112504. [Google Scholar] [CrossRef]
  4. Szogradi, M.; Norrman, S.; Bubelis, E. Dynamic modelling of the helium-cooled DEMO fusion power plant with an auxiliary boiler in Apros. Fusion Eng. Des. 2020, 160, 111970. [Google Scholar] [CrossRef]
  5. Official Apros Website. Available online: https://www.apros.fi/ (accessed on 25 May 2021).
  6. Sohal, M.S.; Ebner, M.A.; Sabharwall, P.; Sharpe, P.B. Engineering Database of Liquid Salt Thermophysical and Thermochemical Properties; INL/EXT-10-18297 Rev. 1; Idaho National Laboratory: Idaho Falls, ID, USA, 2013; p. 24. [Google Scholar]
  7. Janky, F.; Fable, E.; Treutterer, W.; Zohm, H. Simulation of burn control for DEMO using ASTRA coupled with Simulink. Fusion Eng. Des. 2017, 123, 555–558. [Google Scholar] [CrossRef]
  8. Wouter, X.B.D.; Richard, P.A.; David, C.; Sergey, V.; Sven, W. Presentation of the New SOLPS-ITER Code Package for Tokamak Plasma Edge Modelling. Plasma Fusion Res. 2016, 11, 1403102. [Google Scholar]
  9. Moscheni, M.; Carr, M.; Dulla, S.; Maviglia, F.; Meakins, A.; Nallo, G.F.; Subba, F.; Zanino, R. Radiative heat load distribution on the EU-DEMO first wall due to mitigated disruptions. Nucl. Mater. Energy 2020, 25, 100824. [Google Scholar] [CrossRef]
  10. Moro, F.; Colangeli, A.; Nevo, A.D.; Flammini, D.; Mariano, G.; Martelli, E.; Mozzillo, R.; Noce, S.; Villari, R. Nuclear analysis of the Water cooled lithium lead DEMO reactor. Fusion Eng. Des. 2020, 160, 111833. [Google Scholar] [CrossRef]
  11. Moro, F.; Arena, P.; Catanzaro, I.; Colangeli, A.; Nevo, A.D.; Flammini, D.; Fonnesu, N.; Forte, R.; Imbriani, V.; Mariano, G.; et al. Nuclear performances of the water-cooled lithium lead DEMO reactor: Neutronic analysis on a fully heterogeneous model. Fusion Eng. Des. 2021, 168, 112514. [Google Scholar] [CrossRef]
  12. American Society of Mechanical Engineers. ASME Boiler & Pressure Vessel Code, Section III-Rules for Construction of Nuclear Facility Components, Division 1-Subsection NB for Class 1 Components; ASME: New York, NY, USA, 2019. [Google Scholar]
Figure 1. CAD layout of the WCLL small ESS DEMO.
Energies 14 05593 g001
Figure 2. The CAD layout of the IB (left) and the COB segments (right) with flow paths.
Energies 14 05593 g002
Figure 3. Power conversion system of the WCLL small ESS DEMO plant.
Energies 14 05593 g003
Figure 4. Structure of the BB sector user component.
Energies 14 05593 g004
Figure 5. OTSG layout with Westinghouse-type broached plates.
Energies 14 05593 g005
Figure 6. Power trends.
Energies 14 05593 g006
Figure 7. BB, DIV, and VV coolant loops’ primary pressure trends.
Energies 14 05593 g007
Figure 8. OTSG primary side inlet and outlet coolant temperatures.
Energies 14 05593 g008
Figure 9. OTSG secondary side flow rate function.
Energies 14 05593 g009
Figure 10. Averaged collapsed water levels in riser and DC volumes.
Energies 14 05593 g010
Figure 11. Steam flow rates on the ST and dump line.
Energies 14 05593 g011
Figure 12. Deaerator collapsed water level and pressure.
Energies 14 05593 g012
Figure 13. Feedwater temperatures along the preheater line.
Energies 14 05593 g013
Figure 14. Flow rates in the small ESS (a) and molten salt tank levels (b).
Energies 14 05593 g014
Table 1. Main parameters of the WCLL PHTS.
Param. P BB [MWth] P DIV + VV [MWth] Σ m BZ / Σ m FW [kg/s] * p HL [bar]
Phase
Pulse2019.8337.02 × 3830.0/2 × 1124.0155.0
Dwell20.23.37
* The values refer to loop-wise flow rates hence the multiplication by a factor of two.
Table 2. Characteristics of the OTSG UCs in pulse phase.
Param. P SG [MWth] p out [bar] T out [°C] A HT [m2] m sec [kg/s]
UC
BZ OTSG74270.0320–33049043830
FW OTSG22013881137
Table 3. Main parameters of the small ESS in Apros.
PhasePulseDwell
Param.
P M S E H [MWe]∼41.2∼15.7
P M S S G [MWth]14.21270.11
T h o t , t a n k [°C]330.0330.0
T c o l d , t a n k [°C]282.4282.4
m d i s c h . [kg/s]189.93590.0
m c h . [kg/s]522.1210.9
Publisher’s Note: MDPI stays neutral with regard to jurisdictional claims in published maps and institutional affiliations.