Abstract
Experimental and field observations evidence the effects of capillarity in narrow pores on inhibiting the thermodynamic stability of gas hydrates and controlling their saturation. Thus, precise estimates of the gas hydrate global inventory require models that accurately describe gas hydrate stability in sediments. Here, an equilibrium model for hydrate formation in sediments that accounts for capillary inhibition effects is developed and validated against experimental data. Analogous to water freezing in pores, the model assumes that hydrate formation is controlled by the sediment pore size distribution and the balance of capillary forces at the hydrate–liquid interface. To build the formulation, we first derive the Clausius–Clapeyron equation for the thermodynamic equilibrium of methane and water chemical potentials. Then, this equation is combined with the van Genuchten’s capillary pressure to relate the thermodynamic properties of the system to the sediment pore size distribution and hydrate saturation. The model examines the influence of the sediment pore size distribution on hydrate saturation through the simulation of hydrate formation in sand, silt, and clays, under equilibrium conditions and without mass transfer limitations. The results show that at pressure–temperature conditions typically found in the seabed, capillary effects in very fine-grained clays can limit the maximum hydrate saturation below 20% of the host sediment porosity.
1. Introduction
Gas hydrates are naturally occurring crystalline compounds that contain low molecular weight gases (commonly methane) in excess of saturation, within a lattice of hydrogen-bonded water molecules. Whether gas hydrates exist as a stable phase in nature depends, i.a., on the system’s pressure (P), temperature (T), and salinity (S); gas abundance and water activity; and the pore size distribution of the host sediment [1]. In particular, gas hydrates forming in confined pores are affected by capillary effects, which may disturb their thermodynamic stability. Several experimental tests, e.g., [2,3,4,5,6,7], and theoretical models, e.g., [8,9,10], have examined the control exerted by capillarity on the stability of hydrates. Their results suggest that in narrow pores (i.e., pore diameters < 100 nm), capillary pressure decreases the pore water activity and increases the gas solubility, therefore inhibiting the stability of the hydrate phase and hindering its formation. At the pore scale, this inhibition effect translates into a shift of the hydrate phase boundary (i.e., P-T equilibrium conditions for gas hydrate formation) towards lower temperatures and/or higher pressures than those predicted in bulk conditions (i.e., no sediment structure), with the same shift direction as that from adding a chemical inhibitor such as salt (Figure 1). Field observations in sites such as the Cascadia margin (offshore Vancouver–Oregon), Kumano Basin (offshore Japan), or the Blake Ridge (offshore Carolina) also evidence the influence of the sediment pore size distribution at controlling gas hydrate stability beneath the seafloor. The discrepancies observed in these sites between the depth of the bottom simulating reflector (BSR), indicating the actual base of the gas hydrate stability zone (GHSZ), and its theoretically predicted depth under bulk conditions have been in part attributed to capillary effects [8,11,12].
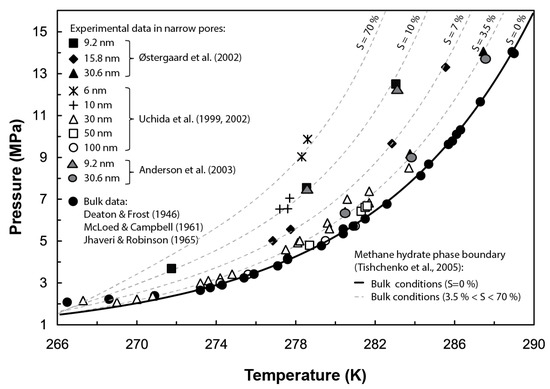
Figure 1.
Effect of capillary pressure at shifting the equilibrium Pressure-Temperature (P-T) conditions for methane hydrate stability in narrow pores. For comparison purposes, grey dotted lines show a similar effect on the hydrate phase boundary caused by an increase of salinity (S) using Tishchenko’s formulation [13]. Experimental data from methane hydrate dissociation tests performed by [5,6,14,15,16,17,18]. Figure modified from [5].
A detailed understanding of the factors controlling the stability of gas hydrates in sediments, such as capillary pressure, is key to precisely estimate the thickness of the GHSZ and the total amount of gas hydrates within a reservoir. In particular, an accurate assessment of gas hydrate saturation in sediments plays a key role in predicting the potential impact of gas hydrate in climate [19,20], ocean chemistry [21], and slope instability [22], as well as in the development of strategies for gas hydrate exploitation as an energy supply [23]. Current techniques employed to measure in situ gas hydrate saturations are generally based on either elastic properties or electrical resistivity of the porous medium and may yield uncertain values of gas hydrate saturation due to their high dependence on empirical correlations and/or poorly constrained physical parameters, e.g., [24,25]. To better understand the relation between gas hydrate saturation and distribution and the physical properties of the hosting sediment, several fluid flow models have been developed over the last two decades, e.g., [22,26,27,28,29,30,31]. These models account for capillary effects on the thermodynamic stability of gas hydrates through the decrease in water activity with decreasing the pore size of the sediment. However, most of those use a mean pore radius to characterize the pore size distribution of the porous medium and therefore ignore the complex pore networks characterizing natural sediments, e.g., [32,33].
To date, only a few models have considered capillary effects for a continuous pore size distribution of the sediment when simulating gas hydrate stability. For instance, Klauda and Sandler (2001) [27] multiply the activity of water in a pore of a given radius by an appropriate pore size probability density function integrated over all pore sizes of the sediment. Alternatively, Henry et al. (1999) [9] and Liu and Flemings (2011) [28] use the soil water retention curve expression (WRC) to link the capillary pressure and the gas hydrate saturation.
Here, we develop a new equilibrium formulation to model methane hydrate formation in sediments that accounts for capillary inhibition effects through the WRC of the hosting sediment. The formulation builds on the model presented by Nishimura et al. (2009) [34] to simulate the behaviour of water freezing in soils. Here, we assume that analogous to water freezing behaviour in pores, methane hydrate formation is controlled by the sediment pore size distribution and the capillary forces developed at the fluid–solid interface. To build our formulation, we first derive the Clausius–Clapeyron equation for the thermodynamic equilibrium of methane and water chemical potentials in hydrate systems. Then, this equation is combined with the van Genuchten’s capillary pressure to relate the thermodynamic properties of the system to the host sediment pore size distribution and hydrate saturation. Finally, the formulation is implemented on the finite element simulator Code_Bright extended to methane hydrate systems [35]. In this paper, the Clausius–Clapeyron equation for the methane hydrate system is validated against experimental data at predicting the P-T conditions required to form and dissociate methane hydrates in narrow pores. Then, the model is applied to simulate methane hydrate formation in sand, silt, and clays (with different contents of fines), under equilibrium conditions and without mass transfer limitations. This is, to the best of our knowledge, the first attempt to compare quantitatively the effect of the host sediment pore size distribution on inhibiting the maximum methane hydrate saturation expected in natural sediments at a given P-T-S combination due to capillary effects. The results show that at thermodynamic conditions typically found at the seabed, capillary effects can limit the maximum hydrate saturation found in fine and very fine-grained sediments to approximately 60 to 20% of the host sediment porosity, respectively.
Our model establishes sediment pore size distribution as a proxy for hydrate saturation. This could allow constraining better global scale estimations of the maximum inventory of methane stored in hydrates, in which hydrate saturations are usually assumed independent on capillary effects related to the sediment type hosting the hydrates. Furthermore, in a regional scale, our model allows providing an initial quick estimation of the potential methane stored in a given hydrate reservoir without the need for a full set of mass and energy balance equations, as the formulation presented here only requires information about the pressure, temperature and salinity of the system and the pore size distribution of the host sediment. Hence, our model can be used to complement geophysical-based approaches for hydrate saturation estimation. Finally, the use of the van Genuchten’s model in our formulation, which is a standard model used in well-established numerical simulators for hydrate–bearing sediments to compute the gas–liquid capillary pressure, e.g., [36], can facilitate the implementation of our formulation in such codes. Thus, offering the opportunity to enhance their ability to predict the maximum hydrate saturation that any lithology can have accounting for capillary effects on hydrate formation.
2. Equilibrium Model for Gas Hydrate Formation in Pores
Given the similarity between gas hydrate formation/dissociation and ice freezing/melting processes [8], we adapt the formulation developed by Nishimura et al. (2009) [34] to couple the thermal, hydraulic, and mechanical processes interacting during freezing and thawing of pore water in sediments, in order to build an equilibrium model for methane hydrate phase change in pores. Important differences between methane hydrate and ice, mainly the need of methane gas to form methane hydrates (unlike air in ice), are considered by assuming dissolved methane concentrations at or above saturation value. The following subsections describe the model assumptions, derive the thermodynamic equilibrium of the g-h-l (g, gas; h, hydrate; l, liquid) three-phase system, and couple it with the van Genuchten model [37].
2.1. Phase Distribution in Pores
Methane hydrate-bearing sediments are represented here as a multicomponent and multiphase porous system formed by three different components, mineral grains (gr), methane (m), and water (w), which can be partitioned among four possible phases: solid matrix (s), hydrate (h), gas (g), and liquid (l). Note that chemical inhibitors, such as salt, are not considered as components of the system, but their effect on inhibiting the stability of methane hydrates is accounted for in the expression used to determine the methane hydrate phase boundary in bulk conditions (see Section 2.3.1).
The mineral grains form the solid continuum that provides the skeletal structure to the porous medium. Within the pores, methane hydrate can grow as a solid phase. The gas phase is a mono-component phase of methane, and the liquid phase consists of liquid water saturated with dissolved methane. The mineral surface is assumed to be hydrophilic so that the pore liquid is the wetting phase. Similar to ice [34], the hydrate is considered to behave as a completely non-wetting phase with and [8], where is the surface tension between the phases indicated in the subscripts. As a result, the equilibrium distribution of phases in pores is arranged so that water forms a continuous film on the mineral grain [38,39,40] and the hydrate crystal [41].
2.2. Methane Hydrate Thermodynamic Equilibrium
The Gibbs–Duhem equation is a thermodynamic relationship expressing changes in the chemical potential of a component, or a mixture of components, in terms of changes in the temperature and pressure of the system, so that
where is the number of moles of component ; is the infinitesimal increase of the chemical potential of this component; is the total number of components of the system; S and V are the specific entropy and volume, respectively; P is the pressure; and T is the absolute temperature of the system. All nomenclature used in this formulation is listed and described in Table A1 (see Appendix A).
In the same manner as in [34], the Gibbs–Duhem equation is written here for each of the phases considered in the system. Thus, for the hydrate phase, this relation reads
Dividing Equation (2) by the moles of hydrate () and considering the stoichiometry of the component ( and ), this equation can be rewritten as
where and are the molar entropy and volume of the methane hydrate phase, respectively, and is the hydration number. Similarly, by considering temperature equilibrium between all phases, for the liquid phase, this relation reads
where () and () are the molar fraction of the methane and water components in the liquid phase, respectively. Finally, the Gibbs–Duhem relation for the gas phase is obtained as
where can be isolated as
2.3. Clausius–Clapeyron Equation for the Methane-Water System
The thermodynamic equilibrium suggests that changes to the chemical potential of each component of the system in any of the coexisting phases should be equal at constant P-T conditions. Thus, under equilibrium conditions, it is assumed that:
Replacing Equations (6) and (10) in Equation (3), and rearranging terms, the following expression of the Clausius–Clapeyron equation for the methane–water system can be obtained (see Appendix B):
with:
where is the methane hydrate molar mass (0.124 kg/mol), and is the methane hydrate mass density (), considering a liquid density () that is dependent on the system temperature. The terms and are used to simplify the mathematical expression and refer to the molar relation between gas hydrate and liquid hydrate phases, respectively. Finally, is the molar latent heat of methane hydrate dissociation (53.2 KJ/mol, after [14]) and is considered constant over the P-T conditions examined in this work.
2.3.1. Capillary Pressure at the Methane Hydrate–Liquid Interface
The differential Equation (11) can be integrated as:
where , and are considered unknown reference values for methane hydrate, liquid and gas pressures, and temperature, respectively.
Considering an arbitrary state characterized by null hydrate saturation (), and (i.e., arbitrary state on top of the phase boundary in Figure 2) and assuming , Equation (16) can be written as:
where is determined by the intersection of with the methane hydrate phase boundary in bulk conditions (Figure 2).
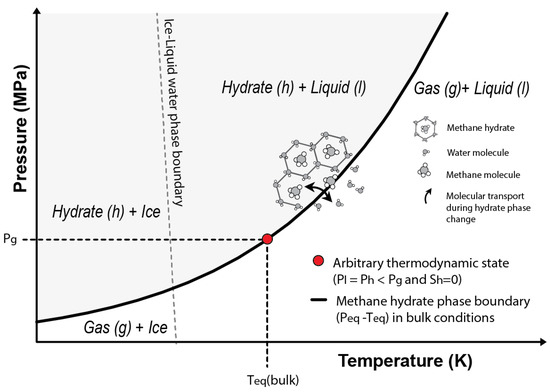
Figure 2.
Phase stability diagram for the methane hydrate system. The grey area shows the P-T combinations at which methane hydrates are stable considering bulk conditions. The red circle indicates the arbitrary thermodynamic state used to derive the present formulation (Equation (18)) and that is characterized by no hydrate saturation () and dissolved methane concentrations above saturation.
From Equation (17), the term can be isolated as:
Replacing , which is assumed equal to , in Equation (16), and rearranging terms, the pressure at the hydrate phase can be obtained as a function of the liquid pressure and the absolute temperature of the system (see Appendix C):
Passing the term to the left side of Equation (19), the capillary pressure at the methane hydrate–liquid interface can be expressed as:
2.4. Capillary Effects and Equilibrium Pressure Relation
In bulk conditions and for a given temperature and salinity, the hydrate equilibrium pore pressure (), which describes the hydrate phase boundary and guarantees the stability of the hydrate phase, can be expressed empirically as (after [42]):
where 0.55 is assumed as the slope of the temperature salinity curve, and is the salinity expressed in %.
To incorporate the inhibition effects of capillary pressure in the computation of , we modify Equation (21) by adding the term , which corresponds to the equilibrium temperature () depression observed in narrow pores due to capillary pressure:
where is derived from the Clausius–Clapeyron equation (Equation (20)) as:
Note that the value of 8860 in Equation (21) is modified here to 8870 to better adjust the experimental data measured in bulk conditions in the range of pressures examined in the following sections.
2.5. Capillary Effects and Methane Hydrate Saturation Relation
The sediment WRC describes the relationship between the capillary pressure developed at the gas–liquid interface () and the liquid content existing in the pores. This function is inherently determined by pore scale characteristics of the sediment, e.g., [43,44], and can be obtained experimentally from mercury intrusion porosimetry tests. WRCs measured experimentally can be fitted with functions of two or three parameters including the non-wetting phase entry pressure (, minimum pressure required for the non-wetting phase to invade a pore saturated with a wetting phase) and shape parameters (e.g., m) that capture changes in the effective liquid saturation () with changes in . The van Genuchten model [37] (Equation (24)) has been extensively used in the literature to fit the shape of WRCs:
Due to the similarity between water freezing/thawing and water air drying/wetting behaviours in sediments, the role of the WRC in controlling liquid–solid transformations in frozen soils has been widely investigated, e.g., [45,46,47]. Nishimura et al. (2009) [34] uses the van Genuchten model [37] to represent the capillary curve relating the amount of unfrozen water (1 − ) and the capillary pressure developed at the ice–liquid interface, so that:
where is the ice saturation in pores, and is the ice pressure described by the Clausius–Clapeyron equation derived from the equilibrium of the chemical potential of water between ice and liquid phases.
Following the approach of [34], we use the capillary pressure developed at the hydrate–liquid interface (Equation (20)) to estimate methane hydrate saturation () in pores as follows:
3. Results and Discussion
In this section, the ability of the Clausius–Clapeyron equation at capturing variations in the methane hydrate equilibrium temperature during hydrate phase transformations in narrow pores is validated against experimental data. The data used for the validation correspond to the P-T combinations observed experimentally during hydrate formation and dissociation tests performed in synthetic samples of 30.6, 15.8, and 9.2 nm nominal pore diameters. These data have been selected because of their wide use in the literature to evidence the effects of capillarity on inhibiting methane hydrate stability in pores, as well as to validate the performance of similar formulations to that presented here, e.g., [5]. In addition, this section presents several thermo-hydraulic tests that are performed to simulate hydrate formation in sand, silt, and clayey sediments (with different percentages of fines). The simulations examine the influence of the host sediment pore size distribution on inhibiting methane hydrate stability and controlling its saturation. Note that our simulations do not consider phase change kinetics or mass transfer limitations; therefore, capillarity is the only factor limiting methane hydrate formation in pores.
3.1. Hydrate Stability in Discrete Pores
If a cylindrical liquid-saturated pore with radius r is filled with methane hydrates, the capillary pressure developed at the hydrate–liquid interface can be computed using the Young–Laplace equation as:
where F is the shape factor of the solid–liquid interface (considered 1 for methane hydrate dissociation and 2 for formation, after [48]), is the interfacial energy per unit area (32 mJ/m, after [14]), and is the contact angle between the methane hydrate interface and the grain surface (, after [8]).
In this section, Equation (27) is used to estimate the required experimentally to dissociate methane hydrate in narrow pores of 30.6, 15.8, and 9.2 nm nominal pore diameters (Figure 3). Then, Equations (22) and (23) are used to determine the equilibrium pressure corresponding to those pore sizes.
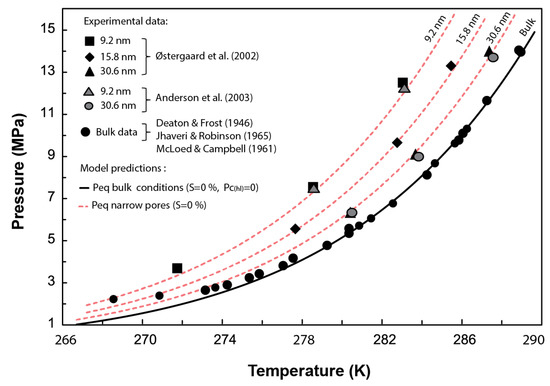
Figure 3.
Comparison between the experimental methane hydrate P-T data obtained from dissociation tests performed in synthetic pores with diameters ranging from 9.2 to 30.6 nm and the predicted phase boundaries using the current model. Experimental data from [5,14,15,16,17]. Figure modified from [5].
Figure 3 compares the phase boundaries or combinations predicted by our model for methane hydrate stability in narrow pores against experimental data. Our results agree with the experimental data within the pressure range of 14 to 4 MPa, which covers a sensible pressure range for natural marine environments with methane hydrates. These results validate the Clausius–Clapeyron expression derived here (Equation (20)) at capturing the depression of the methane hydrate equilibrium temperature due to capillary effects. Note that the misfit between the expression adopted to characterize the hydrate phase boundary in bulk conditions (Equation (21)) below 4 MPa prevents capturing the experimental results at such low pressures. Nevertheless, our model (Equation (23)) is indeed valid, in principle, for pressures below this 4 MPa.
Hydrate Phase Change Hysteresis Loop
Numerous studies show hysteresis between the freezing point (on cooling) and melting point (on heating) of liquids in confined pores, e.g., [49,50,51].
Hysteresis loops have also been observed in experimental tests of methane hydrate formation/dissociation in pores (Figure 4). This effect has been commonly attributed to the difference in the methane hydrate–liquid interface curvature during the melting/freezing processes. To validate the ability of our formulation at capturing hysteresis, the F parameter in Equation (27) is assumed to vary from 1 to 2 for hydrate dissociation and formation, respectively [48,52]. In Figure 4, the inflection point of the experimental curves (horizontal grey dashed line) indicates the peak of hydrate dissociation/formation in pores with sizes around the mean pore size of the distribution (i.e., 30.6 nm). In the case of methane hydrate dissociation (F = 1), the model predicts similar conditions to that observed experimentally around the inflection point. However, for methane hydrate formation (theoretically characterized by F = 2), the model slightly overestimates the temperature depression required at equilibrium. The experimental temperature for hydrate formation could be better fitted by the model either by assuming F = 1.7 or by setting 27 mJ/m rather than 32 mJ/m, which corresponds to the specific surface energy of ice–water interface [8] and is also generally adopted to simulate methane hydrate formation in pores, e.g., [9,26].
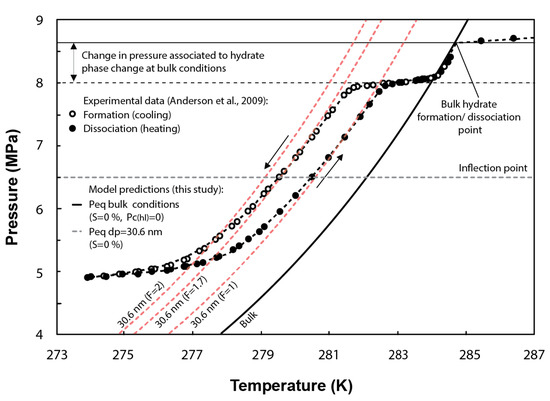
Figure 4.
Comparison between the experimental methane hydrate P-T data obtained from methane hydrate formation and dissociation tests performed in synthetic silica with a mean pore diameter of 30.6 nm and the predicted phase boundaries using the current model (note that shape factors F = 2 and F = 1.7 are used to simulate hydrate formation, while F = 1 is used for hydrate dissociation). Figure modified from [2].
3.2. Modelling Hydrate Formation in Natural Sediments
Several experimental studies and geophysical core logging data evidence a link between methane hydrate saturation in pores and the particle size and clay content of the hosting sediment, e.g., [53,54]. They show that coarse-grained sediments generally host larger hydrate saturations than fine-grained sediments, e.g., [55,56]. In this section, four different WRCs characterizing the pore size distribution of natural sand, silt, and clays (with a distinct fraction of fines) (Figure 5) are used to examine capillary effects on inhibiting methane hydrate formation in pores and controlling its maximum saturation. Note that the WRCs are corrected in this study by a factor of 0.44 () to account for the differences between the surface tension at the gas–liquid interface ( = 72 mJ/m), which is used to transform the mercury porosimetry data into WRCs, and that at the methane hydrate–liquid interface ( = 32 mJ/m).
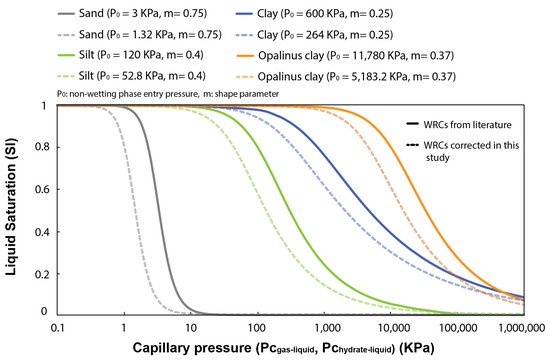
Figure 5.
Typical water retention curves (WRCs) for sand, silt, and clays, reported by [57,58] and fitted using the van Genuchten model [37]. In bold lines, WRCs derived from mercury porosimetry data ( vs. ); in dashed lines, these same WRCs corrected for hydrate intrusion in pores ( vs. ).
For the simulations we use the version of Code_Bright extended to methane hydrate systems [35]. These simulations consider an axisymmetric computational domain of 10 cm × 2.5 cm. The hydrate formation is simulated via thermal cooling, which is imposed as a boundary condition on the top, base, and right-hand side of the computational domain. These boundary conditions are kept until a homogeneous temperature of 277 K is reached in the whole domain. Model parameters used in the simulation are listed in Table 1 and Figure 5.

Table 1.
Test conditions adopted in the simulations. The fitting parameters for the water retention curves (WRCs) appear in Figure 5. Note that permeability and porosity are not changed regardless of the hosting sediment as equilibrium conditions are imposed.
Figure 6b presents the evolution of hydrate saturation in pores for each of the sediments tested with decreasing the system temperature. The results show that capillary effects in sand are negligible on inhibiting methane hydrate formation. The low entry pressure of the WRC characterizing these sediments allows reaching 100% of hydrate saturation in pores as soon as the thermodynamic conditions of the system reach the bulk methane hydrate phase boundary. Capillary effects only start to be slightly noticeable in silts, which even at the end of the simulation (277 K), are not fully saturated in hydrates (open green circle in Figure 6b). However, capillary inhibition is particularly efficient in fine-grain sediments. At the end of the simulation, the maximum saturation in clays is limited above 70% of the host sediment porosity (open blue circle in Figure 6b). This value reduces below 50% with increasing the content of fine particles (open orange circle in Figure 6b). Thus, our model predicts that even under ideal conditions for hydrate formation (i.e., disregarding inhibition effects caused by chemical kinetics, lack of methane and water availability, fracture generation, etc.), and for a range of P-T-S conditions typically found in the seabed, fine grained sediments cannot be fully saturated in hydrates because of capillary effects.
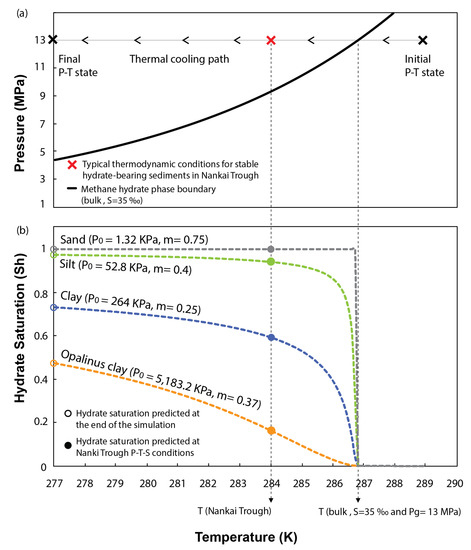
Figure 6.
(a) Thermal cooling path followed to simulate hydrate formation. (b) Effect of the sediment pore size distribution on inhibiting hydrate stability and controlling hydrate saturation in pores.
Figure 6 also examines the effects of capillary pressure at a specific P-T-S combination (red cross in Figure 6a), previously used by [59] to characterize the thermodynamic state of stable MHBS found in the Eastern Nankai Trough, Japan. The geological formation of interest at this location is characterized by inter bedding of clayey and sandy units, where the clays show null content of hydrate [60]. Our model predicts that at this particular P-T-S condition, pore size distribution in clays alone can already inhibit more than 40 or 80% of the hydrate saturation in pores (filled blue and orange circles in Figure 6b, respectively). If accounting for other competing processes governing the formation of methane hydrate in natural environments (which have been ignored in this study to isolate the effects of pore size distribution), a complete inhibition of hydrate stability in these sediments could be expected.
4. Conclusions
A new equilibrium model for methane hydrate stability in porous media is presented here to examine the importance of the capillary pressure developed at the hydrate–liquid interface on inhibiting hydrate formation in pores and controlling its saturation. Capillary effects in the thermodynamic equilibrium of methane hydrates are accounted for in the formulation through the Clausius–Clapeyron equation of the methane–water system. This equation is derived from the equilibrium of methane and water chemical potentials and captures the depression of the equilibrium temperature observed experimentally during hydrate formation/dissociation tests performed in narrow pores. The Clausius–Clapeyron equation is also combined here with the van Genuchten’s capillary pressure to relate capillary effects in porous media with hydrate saturation. The formulation is tested here at simulating hydrate formation in different sediment types (ranging from sand to clays with a different fraction of fines) under equilibrium conditions and without mass transfer limitations. Although the hypothetical conditions considered here to simulate the formation of hydrate in the porous media are unlikely in natural environments, they allow us to isolate the effect of the sediment pore size distribution on inhibiting hydrate formation. The simulations evidence that under favourable conditions for hydrate formation, capillary effects are negligible in sand and almost negligible in silty sediments. In contrast, they exert a key control in the stability of methane hydrates and its saturation in fine-grained sediments. In particular, our results show that at thermodynamic conditions typically found in the seabed, capillary pressure can reduce the maximum hydrate saturation expected in clays with a high content of fines below 20% of the host sediment porosity. This supports field and experimental observations on fine-grained sediments generally having low hydrate saturations under favourable thermodynamic and methane transport conditions.
Author Contributions
Conceptualization, M.D.L.F. and J.V.; methodology, M.D.L.F. and J.V.; software, M.D.L.F. and J.V.; validation, M.D.L.F.; formal analysis, M.D.L.F.; investigation, M.D.L.F., J.V., and H.M.-M.; resources, M.D.L.F. and J.V.; data curation, M.D.L.F.; writing—original draft preparation, M.D.L.F.; writing—review and editing, M.D.L.F., J.V. and H.M.-M.; visualization, M.D.L.F.; supervision, J.V. and H.M.-M.; project administration, M.D.L.F., J.V. and H.M.-M.; funding acquisition, M.D.L.F. All authors have read and agreed to the published version of the manuscript.
Funding
This research was funded by the Graduate School of the National Oceanography Centre Southampton and the FNRS research project FIESTA (ID: 9617).
Institutional Review Board Statement
Not applicable.
Informed Consent Statement
Not applicable.
Data Availability Statement
Not applicable.
Conflicts of Interest
The authors declare no conflict of interest. The funders had no role in the design of the study; in the collection, analyses, or interpretation of data; in the writing of the manuscript; or in the decision to publish the results.
Abbreviations
The following abbreviations are used in this manuscript:
| P | Pressure |
| T | Temperature |
| S | Salinity |
| GHSZ | Gas Hydrate Stability Zone |
| WRC | Water Retention Curve |
| s | Solid Matrix |
| g | Gas Phase |
| h | Hydrate Phase |
| l | Liquid Phase |
| gr | Mineral Grains |
| m | Methane |
| w | Water |
Appendix A
Table A1.
Description of the nomenclature used in the formulation. Symbols are listed in the order of their appearance within the text.
Table A1.
Description of the nomenclature used in the formulation. Symbols are listed in the order of their appearance within the text.
| Symbols | |
|---|---|
| S | Specific entropy |
| d | Infinitesimal increment |
| T | Absolute temperature |
| V | Specific volume |
| P | System pressure |
| Total number of components | |
| N | Number of moles |
| Chemical potential | |
| n | Hydration number |
| Phase pressure | |
| s | Molar entropy |
| v | Molar volume |
| x | Molar fraction |
| Symbol used to grouping terms | |
| Molar latent heat of dissociation | |
| M | Molar mass |
| Phase density | |
| Unknown phase reference pressure | |
| Unknown reference temperature | |
| Phase saturation | |
| Equilibrium temperature in bulk conditions | |
| Capillary pressure between phases in subscripts | |
| Equilibrium pore pressure | |
| Salinity | |
| Depression of | |
| Effective liquid saturation | |
| Non-wetting phase entry pressure | |
| m | WRC shape parameter |
| Phase saturation | |
| F | Shape factor of the solid–liquid interface |
| Inter-facial energy between phases in subscripts | |
| Contact angle between phases in subscripts | |
| r | Pore radius |
| Subscripts and Superscripts | |
| Specific component | |
| h | Hydrate phase |
| w | Water component |
| m | Methane component |
| l | Liquid phase |
| g | Gas phase |
Appendix B
Rearranging Equation (A1), we obtain
Using the terms and , Equation (A2) reduces to
where is equal to .
Finally, isolating from Equation (A3), the Clausius–Clapeyron equation for the methane–water system is obtained as
Appendix C
Replacing in Equation (17), the following is obtained:
Developing the right side of the equation,
where both terms of the equation are self-cancelling, and so Equation (A8) can be rewritten as
Isolating and simplifying terms related to the temperature, the following is obtained:
Finally, subtracting the logarithms, the reference temperature () disappears from the expression and the methane hydrate pressure reads as follows:
References
- Sloan, E.D.; Koh, C.A. Clathrate Hydrates of Natural Gases, 3rd ed.; Chemical Industries Series; CRC Press: Boca Raton, FL, USA, 2007; Volume 119. [Google Scholar]
- Anderson, R.; Tohidi, B.; Webber, J.B.W. Gas hydrate growth and dissociation in narrow pore networks: Capillary inhibition and hysteresis phenomena. Geol. Soc. Spec. Publ. 2009, 319, 145–159. [Google Scholar] [CrossRef]
- Chuvilin, E.; Kozlova, E.V.; Makhonina, N.A.; Yakushev, V. Experimental Investigation of Gas Hydrate and Ice Formation in Methane-Saturated Sediments. In Proceedings of the 8th International Conference on Permafrost, Zurich, Switzerland, 21–25 July 2005; pp. 145–150. [Google Scholar]
- Handa, Y.P.; Stupin, D. Thermodynamic properties and dissociation characteristics of methane and propane hydrates in 70-Åradius silica gel pores. J. Phys. Chem. 1992, 96, 8599–8603. [Google Scholar] [CrossRef]
- Østergaard, K.; Anderson, R.; Llamedo, M.; Tohidi, B. Hydrate phase equilibria in porous media: Effect of pore size and salinity. Terra Nova 2002, 14, 307–312. [Google Scholar] [CrossRef]
- Uchida, T.; Ebinuma, T.; Ishizaki, T. Dissociation condition measurements of methane hydrate in confined small pores of porous glass. J. Phys. Chem. 1999, 103, 3659–3662. [Google Scholar] [CrossRef]
- Uchida, T.; Takeya, S.; Chuvilin, E.M.; Ohmura, R.; Nagao, J.; Yakushev, V.S.; Istomin, V.A.; Minagawa, H.; Ebinuma, T.; Narita, H. Decomposition of methane hydrates in sand, sandstone, clays, and glass beads. J. Geophys. Res. 2004, 109, B05206. [Google Scholar] [CrossRef]
- Clennell, M.; Hovl, M.; Booth, J.S.; Henry, P.; Winters, W.J. Formation of natural gas hydrates in marine sediments: Conceptual model of gas hydrate growth conditioned by host sediment properties. J. Geophys. Res. 1999, 104, 22985–23003. [Google Scholar] [CrossRef]
- Henry, P.; Thomas, M.; Clennell, M.B. Formation of natural gas hydrates in marine sediments: Thermodynamic calculations of stability conditions in porous sediments. J. Geophys. Res. 1999, 104, 23005–23022. [Google Scholar] [CrossRef]
- Sun, R.; Duan, Z. An accurate model to predict the thermodynamic stability of methane hydrate and methane solubility in marine environments. Chem. Geol. 2007, 244, 248–262. [Google Scholar] [CrossRef]
- Daigle, H.; Dugan, B. Pore size controls on the base of the methane hydrate stability zone in the Kumano Basin, offshore Japan. Geophys. Res. Lett. 2014, 41, 8021–8028. [Google Scholar] [CrossRef]
- Ruppel, C. Anomalously cold temperature observed at the base of the gas hydrate stability zone on the U.S. Atlantic passive margin. Geology 1997, 25, 699–702. [Google Scholar] [CrossRef]
- Tishchenko, P.; Hensen, C.; Wallmann, K.; Wong, C.S. Calculation of the stability and solubility of methane hydrate in seawater. Chem. Geol. 2005, 219, 37–52. [Google Scholar] [CrossRef]
- Anderson, R.; Llamedo, M.; Tohidi, B.; Burgass, R.W. Experimental measurement of methane and carbon dioxide clathrate hydrate equilibria in mesoporous silica. J. Phys. Chem. 2003, 107, 3507–3514. [Google Scholar] [CrossRef]
- Deaton, W.M.; Frost, E.M. Clathrate Hydrates and Their Relation to the Operation of Natural Gas Pipe Lines; BM-Mon-8; US Bureau of Mines Monograph: Washington, DC, USA, 1946. Available online: https://www.osti.gov/biblio/7278165 (accessed on 7 September 2021).
- Jhaveri, J.; Robinson, D.B. Hydrates in the methane-nitrogen system. Can. J. Chem. Eng. 1965, 43, 75–78. [Google Scholar] [CrossRef]
- McLeod, H.O.; Campbell, J.M. Natural gas hydrates at pressures to 10,000 psia. J. Petroleum Technol. 1961, 222, 590–594. [Google Scholar] [CrossRef]
- Uchida, T.; Ebinuma, T.; Takeya, S.; Nagao, J.; Narita, H. Effects of pore sizes on dissociation temperatures and pressures of methane, carbon dioxide, and propane hydrates in porous media. J. Phys. Chem. 2002, B106, 820–826. [Google Scholar] [CrossRef]
- Kretschmer, K.; Biastoch, A.; Rüpke, L.; Burwicz, E. Modeling the fate of methane hydrates under global warming. Glob. Biogeochem. 2015, 29, 610–625. [Google Scholar] [CrossRef]
- Ruppel, C.D.; Kessler, J.D. The interaction of climate change and methane hydrates. Rev. Geophys. 2017, 55, 126–168. [Google Scholar] [CrossRef]
- Boudreau, B.P.; Luo, Y.; Meysman, F.J.R.; Middelburg, J.J.; Dickens, G.R. Gas hydrate dissociation prolongs acidification of the Anthropocene oceans. Geophys. Res. Lett. 2015, 42, 9337A–9344A. [Google Scholar] [CrossRef]
- Sultan, N.; Cochonat, P.; Foucher, J.P.; Mienert, J. Effect of gas hydrates melting on seafloor slope instability. Mar. Geol. 2004, 213, 379–401. [Google Scholar] [CrossRef]
- Boswell, R.; Hancock, S.; Yamamoto, K.; Collett, T.; Pratap, M.; Lee, S. Natural Gas Hydrates: Status of Potential as an Energy Resource. In Future Energy, 3rd ed.; Letcher, T.M., Ed.; Elsevier: Amsterdam, The Netherlands, 2020; pp. 111–131. [Google Scholar]
- Marín-Moreno, H.; Sahoo, S.K.; Best, A.I. Theoretical modeling insights into elastic wave attenuation mechanisms in marine sediments with pore-filling methane hydrate. J. Geophys. Res. 2017, 122, 1835–1847. [Google Scholar] [CrossRef]
- Malinverno, A.; Kastner, M.; Torres, M.; Wortmann, G. Gas Hydrate Saturations and Their Uncertainties From Chlorinity and Well Log Data at IODP Site U1325 (Exp. 311, Cascadia Margin). J. Geophys. Res. 2008, 113, B08103. [Google Scholar]
- Daigle, H.; Dugan, B. Capillary controls on methane hydrate distribution and fracturing in advective systems. Geochem. Geophys. Geosyst. 2011, 12. [Google Scholar] [CrossRef]
- Klauda, J.B.; Sandler, S.I. Modeling Gas Hydrate Phase Equilibria in Laboratory and Natural Porous Media. Ind. Eng. Chem. Res. 2001, 40, 4197–4208. [Google Scholar] [CrossRef]
- Liu, X.; Flemings, P.B. Capillary effects on hydrate stability in marine sediments. J. Geophys. Res. 2011, 116, B07102. [Google Scholar] [CrossRef]
- Malinverno, A. Marine gas hydrates in thin sand layers that soak up microbial methane. Earth Planet. Sci. Lett. 2010, 292, 399–408. [Google Scholar] [CrossRef]
- Pesaran, A.; Shariati, A. Effect of capillary term parameters on the thermodynamic modeling of methane hydrate formation in porous media. J. Nat. Gas Sci. Eng. 2013, 14, 192–203. [Google Scholar] [CrossRef]
- Saw, V.; Udayabhanu, G.; Mandal, A.; Laik, S. Methane Hydrate Formation and Dissociation in the Presence of Silica Sand and Bentonite Clay. Oil Gas Sci. Technol. 2014, 70, 1087–1099. [Google Scholar]
- Johnson, D.L.; Koplik, J.; Schwartz, L.M. New Pore-Size Parameter Characterizing Transport in Porous Media. Phys. Rev. Lett. 1986, 57, 2564–2567. [Google Scholar] [CrossRef]
- Xiong, Q.; Todor, G.B.; Andrey, P.J. Review of pore network modelling of porous media: Experimental characterisations, network constructions and applications to reactive transport. J. Contam. Hydrol. 2016, 192, 101–117. [Google Scholar] [CrossRef]
- Nishimura, S.; Gens, A.; Jardine, R.J.; Olivella, S. THM-coupled finite element analysis of frozen soil: Formulation and application. Géotechnique 2009, 59, 159–171. [Google Scholar] [CrossRef]
- De La Fuente, M.; Vaunat, J.; Marín-Moreno, H. Thermo-Hydro-Mechanical Coupled Modeling of Methane Hydrate-Bearing Sediments: Formulation and Application. Energies 2019, 12, 2178. [Google Scholar] [CrossRef]
- White, M.D.; Kneafsey, T.J.; Seol, Y.; Waite, W.F.; Uchida, S.; Lin, J.S.; Myshakin, E.M.; Gai, X.; Gupta, S.; Reagan, M.T.; et al. An international code comparison study on coupled thermal, hydrologic and geomechanical processes of natural gas hydrate-bearing sediments. Mar. Petrol. Geol. 2020, 120, 104566. [Google Scholar] [CrossRef]
- Van Genuchten, M.T. A closed-form equation for predicting the hydraulic conductivity of unsaturated soils. Soil Sci. Soc. Am. J. 1980, 44, 892–898. [Google Scholar] [CrossRef]
- Sahoo, S.K.; Madhusudhan, B.N.; Marin-Moreno, H.; North, L.J.; Ahmed, S.; Falcon-Suarez, I.; Best, A. Laboratory insights into the effect of sediment-hosted methane hydrate morphology on elastic wave velocity from time-lapse 4D synchrotron X-ray computed tomography. Geochem. Geophys. Geosyst. 2018, 19, 4502–4521. [Google Scholar] [CrossRef]
- Tohidim, B.; Andersonm, R.; Clennell, M.B.; Burgass, R.W.; Biderkab, A.B. Visual observation of gas-hydrate formation and dissociation in synthetic porous media by means of glass micromodels. Geology 2001, 29, 867–870. [Google Scholar] [CrossRef]
- Chaouachi, M.; Falenty, A.; Sell, K.; Enzmann, F.; Kersten, M.; Haberthür, D.; Kuhs, W.F. Microstructural evolution of gas hydrates in sedimentary matrices observed with synchrotron x-ray computed tomographic microscopy. Geochem. Geophys. Geosyst. 2015, 16, 1711–1722. [Google Scholar] [CrossRef]
- Duan, Z.; Li, D.; Chen, Y.; Sun, R.V. The influence of temperature, pressure, salinity and capillary force on the formation of methane hydrate. Coord. Chem. Rev. 2011, 2, 125–135. [Google Scholar] [CrossRef]
- Sánchez, M.; Santamarina, C.; Teymouri, M.; Gai, X. Coupled numerical modeling of gas hydrate bearing sediments: From laboratory to field-scale analyses. J. Geophys. Res. 2018, 123, 10–326. [Google Scholar] [CrossRef]
- Aubertin, M.; Mbonimpa, M.; Bussière, B.; Chapuis, R. A model to predict the water retention curve from basic geotechnical properties. Can. Geotech. J. 2003, 40, 1104–1122. [Google Scholar] [CrossRef]
- Perrier, E.; Rieu, M.; Sposito, G.; Marsily, G. Models of the water retention curve for soils with a fractal pore size distribution. Water Resour. Res. 1996, 32, 3025–3031. [Google Scholar] [CrossRef]
- Bittelli, M.; Flury, M.; Campbell, G.S. A thermodielectric analyzer to measure the freezing and moisture characteristic of porous media. Water Resour. Res. 2003, 39, 1041. [Google Scholar] [CrossRef]
- Wang, C.; Lai, Y.; Zhang, Y. Estimating soil freezing characteristic curve based on pore-size distribution. Appl. Therm. Eng. 2017, 124, 1049–1060. [Google Scholar] [CrossRef]
- Watanabe, K.; Wake, T. Measurement of unfrozen water content and relative permitivity of frozen unsaturated soil using NMR and TDR. Cold Reg. Sci. Technol. 2009, 83–84, 103–109. [Google Scholar]
- Anderson, R.; Llamedo, M.; Tohidi, B.; Burgass, R.W. Characteristics of Clathrate Hydrate Equilibria in Mesopores and Interpretation of Experimental Data. J. Phys. Chem. 2003, 107, 3500–3506. [Google Scholar] [CrossRef]
- Faivre, C.; Bellet, D.; Dolino, G. Phase transitions of fluids confined in porous silicon: A differential calorimetry investigation. Eur. Phys. J.—Condens. Matter Complex Syst. 1999, 7, 19–36. [Google Scholar] [CrossRef]
- Handa, Y.P.; Zakrzewski, M.; Fairbridge, C. Effect of restricted geometries on the structure and thermodynamic properties of ice. J. Phys. Chem. 1992, 96, 8594–8599. [Google Scholar] [CrossRef]
- Ishikiriyama, K.; Todoki, M.; Motomura, K. Pore Size Distribution (PSD) Measurements of Silica Gels by Means of Differential Scanning Calorimetry: I. Optimization for Determination of PSD. J. Colloid Interface Sci. 1995, 171, 92–102. [Google Scholar] [CrossRef]
- Llamedo, M.; Anderson, R.; Tohidi, B. Thermodynamic prediction of clathrate hydrate dissociation conditions in mesoporous media. Am. Mineral. 2004, 89, 1264–1270. [Google Scholar] [CrossRef]
- Kawasaki, T.; Fujii, T.; Nakamizu, M. Experimental Studies of the Saturation Level of Methane Hydrate in the Easter Nankai Trough Sediments. In Proceedings of the 6th International Conference on Gas Hydrates (ICGH 2008), Vancouver, BC, Canada, 6–10 July 2008. [Google Scholar]
- Kawasaki, T.; Lu, H.; Fujii, T.; Ripmeester, J. Investigations of Particle Size and Clay Mineral Effect on Gas Hydrate Formation in Natural Sediment. J. Geogr. 2009, 118, 872–882. [Google Scholar] [CrossRef][Green Version]
- Boswell, R.; Collett, T.S. Current perspectives on gas hydrate resources. Energy Environ. Sci. 2011, 4, 1206–1215. [Google Scholar] [CrossRef]
- Tréhu, A.; Long, P.; Torres, M.; Bohrmann, G.; Rack, F.; Collett, T.; Goldberg, D.S.; Milkov, A.V.; Riedel, M.; Schultheiss, P.; et al. Three-dimensional distribution of gas hydrate beneath southern Hydrate Ridge: Constraints from ODP Leg 204. Earth Planet. Sci. Lett. 2004, 222, 845–862. [Google Scholar] [CrossRef]
- Fredlund, D.G.; Xing, A. Equations for the Soil-Water Characteristic Curve. Can. Geotech. J. 1994, 31, 521–532. [Google Scholar] [CrossRef]
- Villar, M.; Romero, J.F. Water Retention Curves of Opalinus Clay; Technical Report; Ciemat: Madrid, Spain, 2012. [Google Scholar]
- Uchida, S. Numerical investigation of Geomechanical behaviour of hydrate-bearing sediments. Can. Geotech. J. 2012, 31, 521–532. [Google Scholar]
- Suzuki, K.; Ebinuma, T.; Narita, H. Estimation of the in-situ permeabilities of Nankai trough hydrate bearing sediments from pressure temperature core sampler (PTCS) core measurements. In Offshore Technology Conference; Society of Petroleum Engineers: Houston, TX, USA, 2008. [Google Scholar]


Publisher’s Note: MDPI stays neutral with regard to jurisdictional claims in published maps and institutional affiliations. |
© 2021 by the authors. Licensee MDPI, Basel, Switzerland. This article is an open access article distributed under the terms and conditions of the Creative Commons Attribution (CC BY) license (https://creativecommons.org/licenses/by/4.0/).