1. Introduction
Creating ideal working conditions increases workers’ performance, productivity, and attitudes to work [
1]. Those doing office work spend almost 90% of their working time indoors [
2]. Roelofsen investigated the connection between comfort parameters and office productivity in [
2]. He found that improving the indoor environment can improve workers’ performance by up to 15 percent. This research aimed to explore how overall satisfaction can be improved among the employees of large office spaces. This can be achieved if the room users are familiar with the office space’s internal comfort parameters (i.e., heat, natural light, noise, and air quality) and have the opportunity to choose the most suitable place for themselves. This is feasible if there are no personally dedicated workstations, but desks can be chosen freely according to the activity’s nature (shared desk, hot desk).
Comfort parameters should be straightforwardly presented to the employees. Regarding thermal comfort parameters, several examples can be found in the relevant literature, including Fanger, who represented thermal comfort parameters in the form of iso-PMV (predicted mean vote) trends in his research [
3]. Examples about computing or simulating thermal comfort parameters from a small number of measurements in large spaces can be also found in the literature [
4,
5,
6]. In [
4,
6], comfort parameters were investigated in healthcare facilities with strict air conditioning and clothing constraints. A common remark is the difficulty of creating an environment which is widely comfortable for staff members with different thermal requirements. In contrast with most of these studies, we did not aim to improve comfort by tuning thermal conditions, but to guide office staff members in choosing workstations with respect to their individual comfort needs. By our assumption, this might improve overall comfort satisfaction without interfering with the HVAC settings. In recent years, due to the emergence of simulation tools, it has become possible to determine thermal comfort parameters by CFD (computational fluid dynamics) simulation and to display them in the form of fields. One of the suitable software programs for this is SimScale [
7]. The examples listed above represent only one comfort parameter.
The tool presented here was developed by the research group and displays comfort parameters in the form of fields and scales, so several comfort parameters can be presented simultaneously (visual comfort, acoustic comfort, thermal comfort, air quality), which will be referred to later as a comfort map. In a previous work [
8], we introduced the concept a comfort map and investigated its subjective aspects with a questionnaire-based study. Comfort maps were created in a standardized, measurable way, using the PMV-PPD (predicted mean vote–predicted percentage dissatisfied) method set in ISO 7730 for thermal comfort. The recently developed comfort map displays the data measured, simulations, or a combination of them. When creating comfort maps by measurement, the resolution depends largely on the number of samples taken. Creating a comfort map by simulation requires a high degree of parameterization and can usually be run in a highly parallelized computer environment [
9]. The computational cost means a simulation drawback in environments where we process a large amount of thermal parameters. However, in an ideal case, simulation costs would be reduced to negligible levels with spatially high enough resolution measurements, but this would lead to impractical or even impossible measurement settings in crowded spaces that are already in use.
To deal with this trade-off and to keep computational costs and the number of measurements within limits, we aimed to provide interpolation-based solutions to comfort map generation, where the balance between the two can be set via optimization. As a result, our goal was to provide a recommendation system to aid office planning with respect to thermal comfort parameters. Designing office layouts with thermal comfort considerations can lead to more efficient energy usage in our assumption.
2. Materials and Methods
2.1. Thermal-Sensation Classification
Several methods [
10] are known for the classification of thermal sensation; in the present research, the PMV-PPD method was used, which was developed through the research by Povl Ole Fanger. Based on the method, the PMV (expected thermal sensation value) and PPD (expected percentage probability of unfavorable thermal sensation) values can be determined. In the research, the ASHRAE 55 and ISO 7730 standards were applied, which describe the analytical determination of thermal comfort and the procedure for calculating the PMV and PPD index. The ASHRAE 55 standard is based on the ISO 7730 standard, and the former has taken over many requirements of the latter, but it does not use comfort categories [
11,
12].
PMV-PPD measurements take into account the heat radiation from the environment, the ambient air temperature, the speed of movement, its variability (turbulence), and the ambient air humidity. Thus, the measurement determines thermal comfort objectively. PMV is a value expressing the average thermal heat sensation of a large group of people. Based on the expected thermal sensation value (PMV), the space under review can be classified into hot, warm, slightly warm, neutral, slightly cool, cool, and cold classes.
The equation describing the function is as follows [
11]:
PPD is the percentage of people dissatisfied with the determined environmental conditions.
Figure 1, given as a percentage, does not fall below 5% (dissatisfaction rate), as due to the fundamental differences between people, it is impossible to create environmental conditions that are suitable for everyone. The minimum of the chart is at PPD value of 5%. Here, there is a 5% probability for unfavorable heat sensation to develop at a point in the space concerned. PMV has an acceptable value up to ±0.5, an unfavorable feeling of heat occurs with a 10% probability; this is still a state that can be classified as neutral. Beyond this limit (i.e., if the expected thermal sensitivity value is greater than or less than ±0.5), the percentage of people being dissatisfied with the thermal environment continues to increase [
11]. The procedure of comfort classification of rooms is detailed in standard ISO 7730. To perform the relevant calculation, the following initial data are required [
13]:
- -
M—metabolic heat production [met].
- -
W—mechanic work [met].
- -
Icl—Insulation of clothing assemble [clo].
- -
ti—indoor air temperature [°C].
- -
tr—mean radiant temperature [°C].
- -
ϕi—indoor air relative humidity [%].
- -
v—indoor air velocity [m/s].
2.2. Measurement Procedure, Measuring Instruments Used
All measurements were performed with factory-calibrated equipments.
Table 1. contains the physical quantities and the corresponding measurement devices.
Thermal comfort factors were measured with a TESTO 480 multifunctional HVAC measuring instrument. The instrument measures the parameters required to calculate the air temperature and the effective (ET) and corrected effective temperature (CET) with high accuracy and calculates the PMV and PPD values according to ISO 7730, which are determined by the ambient or radiant temperature, automatically calculated from humidity, airs velocity, and clothing values. The TESTO 480 multifunction measuring instrument has three main sensors, which are outlined below.
The first sensor is a globe thermometer, a 150 mm diameter copper sphere painted black on the outside, with the temperature sensor (type K thermocouple) in the center. The globe thermometer must be located at the point in the space where the mean radiation temperature is to be determined. Due to radiant heat exchange and partly convective heat exchange, an equilibrium temperature is formed in the globe, called globe temperature [
14].
Based on the globe temperature, the average radiation temperature can be calculated for a standard sphere, D = 150 mm in diameter, painted black, with an emission factor of εg = 0.95; in the case of forced flow the following correlation can be formulated:
where:
- -
tg—globe temperature [°C].
- -
ta—ambient air temperature [°C].
- -
va—air velocity [m/s].
An isotropic air velocity meter, which is suitable for measuring air velocity as well as air temperature, can be used to calculate the degree of turbulence. The device is a thermal-wire air velocity meter that provides the resulting air velocity from the current required to keep a heated heating wire at a constant temperature. Air temperature and humidity sensors are suitable for measuring air temperature and relative humidity.
Figure 2 shows the measuring fixture used for PMV-PPD measurement in a measurement installation. The measurement procedure is described in ISO 7726 and ISO 7730 [
15].
2.3. Creating a Comfort Map
The key assumption of the research is that using the PMV-PPD method, a so-called comfort map can be created, which represents the expected thermal sensation at several points in the space. When creating the comfort map, the space under review is partitioned into cells considering the workstations and other environmental conditions, such as surfaces with remarkably different temperatures. The comfort parameters are measured at each point of the resulting raster or determined by other methods. Comfort parameters can be determined by a large number of measurements, by a simulation validated through a small number of measurements, or by extending a limited number of measurements with interpolation and extrapolation techniques. In this research, we chose the interpolation option. There are remarkable differences in the methods presented, both in terms of measurements and computational requirements.
2.3.1. Creating a Comfort Map with a Large Number of Measurements
When the parameters concerned are determined purely by measurements, the measurements are performed at every point of the raster created. Thus, the comfort map can be created by displaying the measured results. The method is extremely time-consuming, with approximately 30 min of measurement per measurement point and an additional 30 min of data processing. However, it provides more accurate results than the analytical method used for creating a comfort map. The method can only be used if the space tested is already built and is used as intended. A further disadvantage of this method compared to other means for creating a comfort map is that its resolution is much worse.
Simulation modelling methods, as well as the interpolation-based methods we developed paired with modern computer tools, enabled us to determine the comfort parameters even on an infinitesimal raster, displaying results in a much more homogeneous picture of the comfort parameters of the space concerned and its spatial distribution (see
Figure 3).
2.3.2. Creating a Comfort Map with a Simulation Validated with a Small Number of Measurements
During the creation of a comfort map with a simulation validated by a small number of measurements, measurements are performed at some points of the formed raster. The measured values are used to validate a simulation performed on a constructed model. The model must be created taking into account the building structures and the built-in building engineering system, which must be able to determine the comfort parameters at several points. During the validation, measurements must be performed at some specific points of interest in terms of thermal comfort in the space chosen; the location of the measurements must be chosen according to the following aspects: position and proportion of cooling surfaces, position of HVAC services systems, and spots of remarkably different temperatures [
16]. The PMV-PPD value can be determined at several heights; the distance from the floor must be determined depending on the function of the room. In the case of office-type work performed in a seated position, the head height of the seated person shall be determined to be 1.1 m. Simultaneously with the PMV-PPD measurements, the outdoor air temperature must be recorded in order to calculate the internal surface temperature of the delimiting structures. Having all these data at one’s disposal, the created model must be validated using the measurement results. During the validation, the initial data requirements of the model must be filled with the measured values (temperature, humidity, air temperature, air velocity, etc.). If the deviation of the thermal comfort parameters determined by the simulation and measurement is acceptable, the simulation can be considered valid. After validation, the PMV-PPD value can be determined for each point of the space with the help of the simulation. As a result of the validation, the accuracy of the method approaches the accuracy of the comfort map created with the measurement, but the resolution is much better and it requires less on-site measurements. The drawback of the procedure is that the parameterization of the simulation model is extremely time-consuming and running the simulation concerned requires a large computational capacity.
2.3.3. Creating a Comfort Map with Simulation
During the procedures for model creation and simulation, the comfort map is created at all points of the space under review with analytical methods. In this case, however, as no measurement is made, the conditions of the air must be recorded in accordance with the standards in force. In this case, standard EN 16798 can be used. Having the necessary information on the building structures, the internal surface temperature and the average radiation temperature to be calculated from it can be determined. Creating a comfort map with simulation or a model validated with a small number of measurements requires a large amount of calculation. In recent years, with the advent of engineering simulation tools, it has become possible to perform these calculations quickly and efficiently, and test and optimize specific spaces for thermal comfort. One such software is, for example SimScale, which helps display the data in the form of PMV and PPD fields [
6]. SimScale is able to simulate comfort parameters in a space with a procedure based on the computational fluid dynamics (CFD) model. The algorithm implements the lattice Boltzmann method (LBM) in a highly parallelized computing environment. The LBM results in an approximate solution of the Boltzmann equation in a discrete phase space with a linearized collision operator [
9]. According to the manufacturer’s recommendation, SimScale can be run efficiently on a workstation with multiple GPUs, so it cannot be performed with PCs found in most offices. The outstanding advantage of the method, in all respects, is that it can be parameterized to a great depth and the boundary conditions can be easily adapted in the model. The two procedures presented below have been developed because our goal is for the comfort map to gain ground in practice. The comfort map can be created with a PC meant for general office purposes; it does not require a workstation with a high computing capacity and the number of measuring points can be greatly reduced through the method, as well as the actual live work on site.
2.3.4. Creating a Comfort Map by Extending the Measuring Points by Interpolation
The essence of the method is to perform a small number of measurements in the space under review at points with extremely different comfort parameters. The interpolation procedure can be used to approximate the thermal comfort parameters at the points of the space examined where no measurements have been made. The simplest way to do this is to use linear or two-dimensional bilinear interpolation, which is a frequently used tool for image processing. To apply interpolation, the comfort map must be recorded in a rectilinear two-dimensional grid. Each cell in the grid represents the points of the space concerned, and the comfort parameters from the measurements are recorded in the corresponding cells. The value of empty cells between measuring points can be determined from the following equation:
where
v (
i,
j) is the value of the cell with index (
i,
j) and the set
N contains the indices of the adjacent cells of the cell to be determined.
Applying the interpolation formula to the unmeasured cells of the grid iteratively, the approximate comfort map of the space under review is obtained. The Algorithm 1 performing this is as follows:
| Algorithm 1: Iterative interpolation algorithm. |
Result: Interpolated comfort map
GRID: = Measurement data;
M_INDICES: = Measurement indices;
SIZE_X: = GRID size in dimension X;
SIZE_Y: = GRID size in dimension Y;
NEIGHBORS: = [(0,−1), (0,1), (−1,0), (1,0)];
NB_RUNS: = Number of consecutive interpolation runs;
for r: = 1 to NB_RUNS do
for i: = 1 to SIZE_X do
for j: = 1 to SIZE_Y do
if (i,j) is in M_INDICES then
skip;
else
value: = 0;
foreach (m,n) in NEIGHBORS do
value: = value + GRID(i + m,j + n);
end
GRID(i,j): = value/4;
end
end
end
end |
The method requires utmost care as the accuracy of the comfort map is extremely sensitive to the measuring points, as no other parameters can be assigned to the points of the space with the procedure. Therefore, in the case of extreme boundary conditions, a result within the acceptable error limit can only be obtained by increasing the number of measurements. In our research, we were trying to find tools that could solve the problem presented above; that is, in addition to creating a comfort map from a small number of measurements, it can handle several parameters, even native measurement data such as air temperature measured, mean surface radiation temperature, internal relative humidity, and air velocity measured at the point concerned.
2.3.5. Extending Measurement Points by Means of Artificial Intelligence Tools
The interpolation algorithm was formulated in the Torch artificial intelligence system [
17]. Torch can be used through an interface written in Python programming language and, in essence, is a high-performance numeric mathematical and optimization function library. As a first step in the procedure, the measurement data are loaded into a matrix M in proportion to the space measured. The matrix is loaded with data, the values measured are transferred to the cells where they belong, while the missing values are replaced by the average of all measured values. Thus, the matrix M is a two-dimensional discrete representation of the physical quantities measured and calculated. This uploaded matrix can be treated as a digital image, where each cell will be the pixels. In this form, the matrix can be processed with neural network devices used for image processing. In the next step, the value of the averaged cells in the vicinity of the measured values is modified so that the transition between the cells can be as continuous as possible. This is achieved by formulating it as an optimization problem, the function of which to be minimized is structured as follows. The discrete convolution of matrix M loaded with data is taken with the Sobel operator used for the edge search in image processing in both the x and y directions. The result of the convolution is the derivative taken in the direction concerned. The square mean of the derivatives in different directions is the approximation of the gradient. Obviously, if there is a large difference in value between two adjacent elements, the gradient will be large there.
where · denotes a discrete convolution, and
- -
Sx and Sy—directional Sobel operators.
- -
Mx and My—directional derivatives of the comfort map.
- -
Mxy—gradient approximation of the comfort map.
The convolution above is performed by a layer of the Torch convolutional neural network. The error function to be minimized in the neural network is the sum of the elements of the above gradient approximation matrix
Mxy, and the minimization variables are those elements of matrix
Mxy that are not obtained from measurement. During the procedure, the following relationship is iterated until the value of the error decreases.
Thus, in the optimization task overall, the differences between the adjacent elements of the matrix M converge to a specific, initially unknown value by changing the elements between the measurement points. As a result, the transition between cells will show a continuous image.
3. Results
During our research, we visited a multinational IT company that we have been cooperating with for several years. The office building under review houses more than 2000 employers in large open-plan offices with a desk-sharing solution. We applied for ethical permission for our research from the Scientific and Research Ethics Committee of the Scientific Council for Health-(ETT TUKEB), which was granted (case number: 49506-2/2018/EKU).
During the research, we performed measurements in several large offices and, based on the measurements performed, a room most suitable for detecting the application possibilities of the comfort map was selected, where a large number of additional measurements were performed. The office building involved in this field study is a property that is being rented, the term of the lease has been running for 3 years. The investigated office building consists of two wings, one of which is rented entirely by the company under investigation, which has a patio of 17,700 m
2 and has 7200 m
2. The building has seven floors with a total of 11 lounges, 114 meeting rooms, 2300 workspaces, and three levels of underground parking (400 parking spaces). The measurements were conducted in an open office with a base area of 183 m
2, which can contain 46 workstations at maximum. The investigated office is located on the third floor of the building and has fully windowed south- and west-facing walls. In
Figure 4, the longer windowed side is the south facing one. Measurements were carried out at the workstations shown in
Figure 4.
During the project, the following comfort parameters were established: lighting, noise level, CO2 (carbon dioxide) concentration, and thermal comfort factors (air temperature, radiant temperature of surrounding surfaces, and air velocity, humidity). All measurements were performed with a calibrated meter.
In the present case, the measurement was made at a height of 1.1 m, considered to be the height of the seated person doing office work. Prior to the actual measurement, the acclimatization time (approximately 20–30 min) of the measuring instruments must be considered, especially the high-inertia globe thermometer. On-site measurements were performed twice, in December 2019 and March 2020. During the measurements, the office concerned was divided and 45 measurement points were set. Measurements of 5 min each were performed at these sites after the acclimatization time of the globe thermometer had elapsed. Data were recorded every second. This meant 300 samples per measurement point, which was sufficient to filter out measurement errors, disturbing characteristics of the measurement (see
Figure 5), and to average the results to obtain thermal comfort parameters characterizing the actual microclimate of the site concerned. The chart below shows a series of measurement data. It can be concluded from the plotted measurement data that the visible fluctuations were not significant, so they were not evaluated. Measurement data were evaluated automatically, but all data sets were reviewed.
The measurements were performed during operation and during office hours; an average number of employees were present on the day examined.
Due to the restrictions introduced to handle the COVID-19 pandemic, we only had the possibility to carry out the physical and engineering measurements needed to calculate the comfort parameters. We were able to design our comfort map methodology based on these measurements. It is planned to continue the data acquisition, as we describe in the Conclusions section.
We used the large number of measurements to produce the comfort map for the most accurate result. Taking the huge amount of data into account,
Table 2 shows the results of the measurements for only one workstation.
Table 3 shows the measured ranges and the reference values for each measured quantity.
By extending the measurement data by interpolation, we created a comfort map of the space reviewed.
Figure 6 shows the main steps of the iteration process. As shown in the figure, in this case, the measured and calculated results for the thermal comfort parameters were displayed as fields.
3.1. Bringing Comfort Factors to a Common Scale, Representative for Lay People as Well
The primary purpose of the comfort map is to allow users to choose the optimal location for themselves and, where possible, the combination of comfort parameters is optimal for them, or at least acceptable, so it should be easy to understand for lay people as well. As not only the thermal comfort parameters, but also the most influential comfort parameters are displayed on the comfort map, plotting them on the scale makes them much more comprehensible. Obviously, each comfort parameter, i.e., lighting, noise, thermal comfort, etc., has different weight in judging total comfort. In order to implement the comfort map, for the sake of simplicity, all comfort factors are displayed on the same 10-point scale. The common identical-scale thermal comfort scale is referred to below as the TCS (thermal comfort scale). In the case of thermal comfort, the starting point is the percentage of dissatisfied users (PPD), as it was pointed out above, the value can be between 5% and 100%, where 5% is neutral heat sensation, while 100% is the expected percentage of the dissatisfied referring to too cold or too hot heat sensations. Based on this, the scaling system had to be designed in a way where 5% PPD means the 10th best rating on the common scale, while 100% PPD corresponds to the 0th, i.e., the worst rating. The function describing this was mapped by function matching, so the resulting equation was as follows:
3.2. Displaying Measured and Calculated Results—Visualization of Comfort Maps
The results obtained by the methods presented above can be represented by displaying the parameters in the form of fields or by plotting the parameters on a scale, as well as by a combination of the two. If several comfort parameters are to be displayed on the comfort map, it is advisable to represent them with a combination of fields and scales to make it straightforward for everyone. Then, a certain color is assigned to the value of the comfort parameter concerned in each part of the field, so that the difference between the different points of the space can be illustrated. In the comfort map created this way, scales can be assigned to each point, which in turn show the development of other comfort parameters representatively. It is important to emphasize that the limits and steps of these scales are not exact, but rather ordinal values, because of the subjective nature of PMV.
The current research was conducted in an office building where a booking system is used to choose workstations, so an obvious solution is to display the comfort parameters in the booking system to help users make their choice (see
Figure 7).
Regarding the information content, information is provided about thermal sensation (PMV), the level of natural light, and the comfort level related to noise at the workstation concerned. Having all this information, workstations can even be allocated and reserved by using a filter.
When booking a desk, users are requested to provide parameters for which a relevant answer can possibly be given. They include thermal sensation, level of illumination, and level of noise (see
Figure 8). If the booking is made individually at user level, everyone chooses the most convenient place for themselves. As a result, the number of extreme dissatisfactions is greatly reduced, and global satisfaction is increased.
4. Discussion
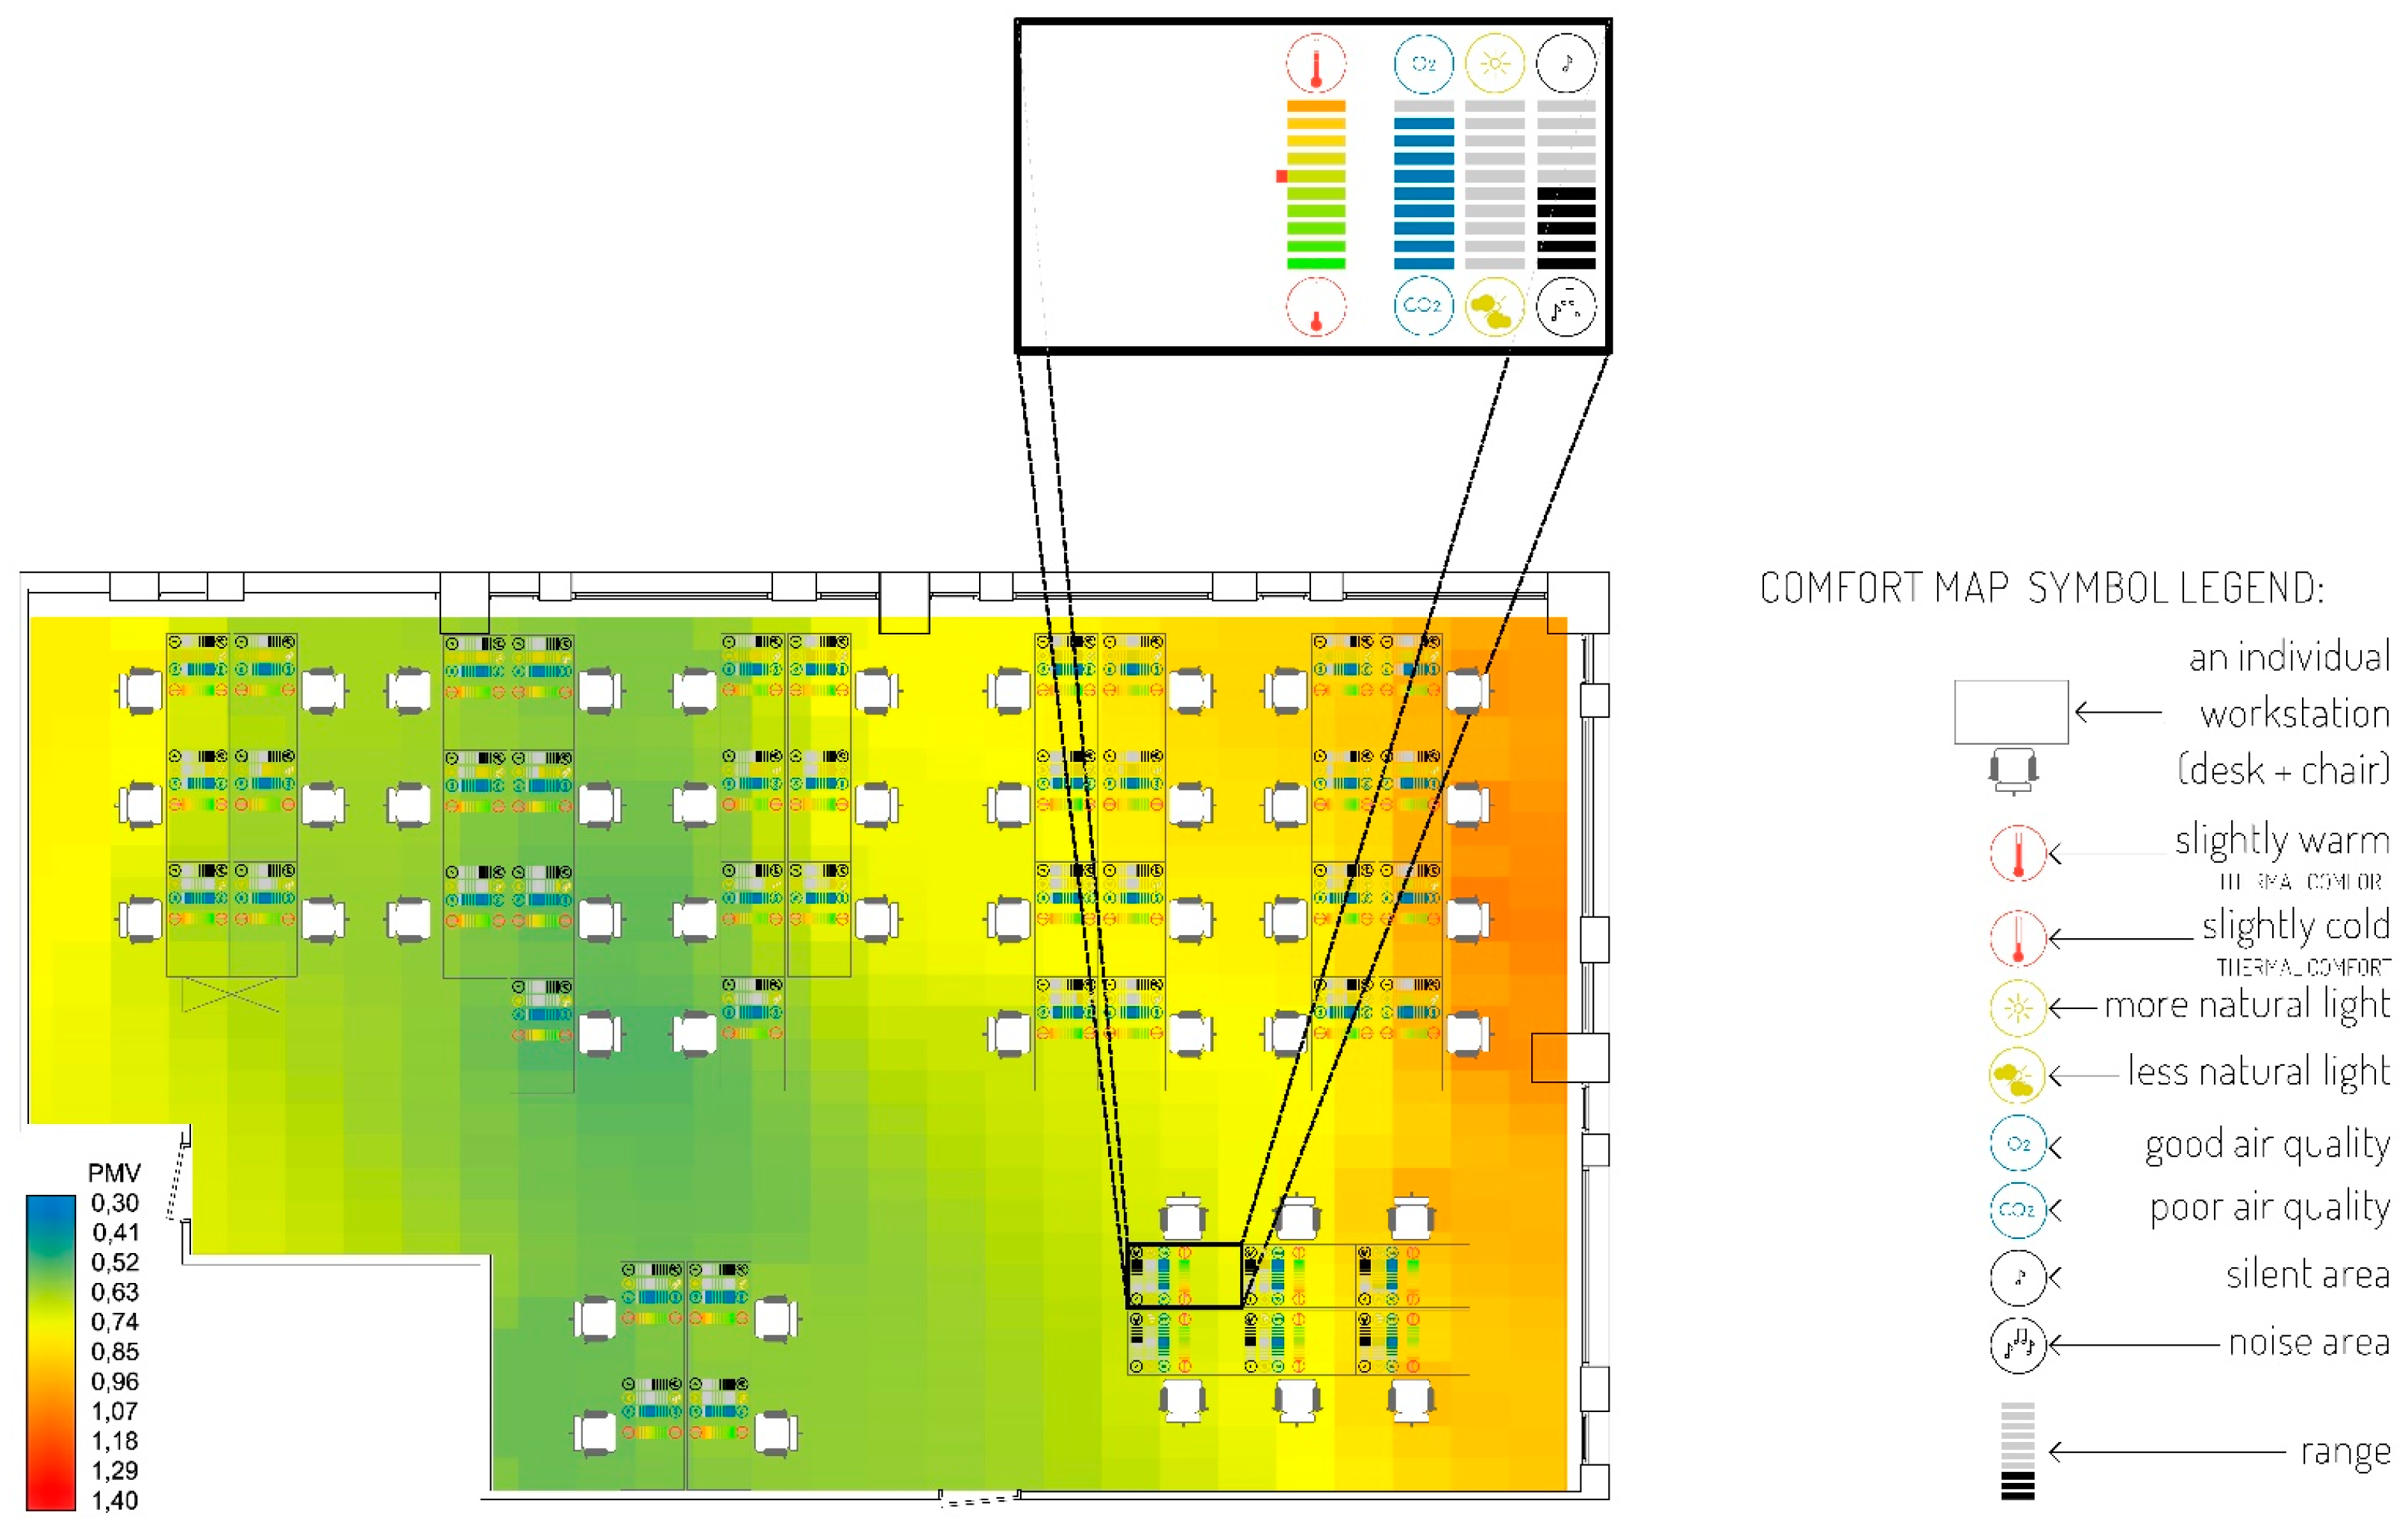
The comfort map created during the research provides an opportunity to represent the comfort parameters at all points in the space concerned. The comfort map shows the points of the space with different thermal sensitivity classifications, as well as other comfort parameters intended to be displayed, which enables each user to choose the optimal workstation for himself or herself. In addition to the thermal sensation values displayed in the form of a field, the measured comfort parameters, such as the expected noise level, natural lighting, and carbon dioxide concentration, are also indicated for the workstations. Regarding thermal comfort (PMV), a thermal sensation value of 0.51–1.08 can be predicted, which means neutral and slightly warm thermal sensation.
A slightly warm thermal sensation is expected in the vicinity of the radiators, while a little further away from these, a neutral feeling of heat develops.
The main result of the research is that a comfort map was created that represented the comfort parameters of the studied space, as well as the differences between discrete points in the space. These were presented in a clear, user-friendly way. We found a solution for how to select the location of workstations (or rooms for inpatients in the case of hospitals), in terms of comfort, in facilities using large spaces. The research shows that the most accurate result is provided by creating a comfort map by measurement. In the research, two methods have been developed for extending the measurement data, which provide an opportunity to create a comfort map with a small number of measurements. This greatly reduces the time spent as well as the computational capacity required to create a comfort map. Comparison of methods with measurement and validated simulation is still in progress. The comfort map is created with measuring tools easily available and measurement procedures that can be performed in a standardized way, so that it can be widely applied in practice.
Figure 9 shows a complete Comfort Map example.
5. Conclusions
When using the comfort map, satisfaction is expected to increase among those working in large offices. The PMV-PPD method, in accordance with ISO 7730, can be used to create comfort maps. A convenient way to produce a comfort map is to extend the data obtained from a small number of measurements. It is advisable to present the results through breaking down the comfort parameters, so that users can choose the optimal location in all respects more easily. If a certain point is to be characterized, it is recommended to display the results on the same scale in the form of fields.
The research began before the current COVID-19 epidemiological situation unfolded, and the multi-national IT company involved, in line with the relevant Hungarian regulations, is now employing its colleagues in a work-from-home system, thus the actual application of the comfort map and subjective questionnaire validation of research results is possible only after returning to the previous work schedule, which is expected by the end of this year. Further measurements will be complemented with post-occupancy data and subjective well-being ratings from the employees.


 ,
, 


