At what Pressure Shall CO2 Be Transported by Ship? An in-Depth Cost Comparison of 7 and 15 Barg Shipping
Abstract
:1. Introduction
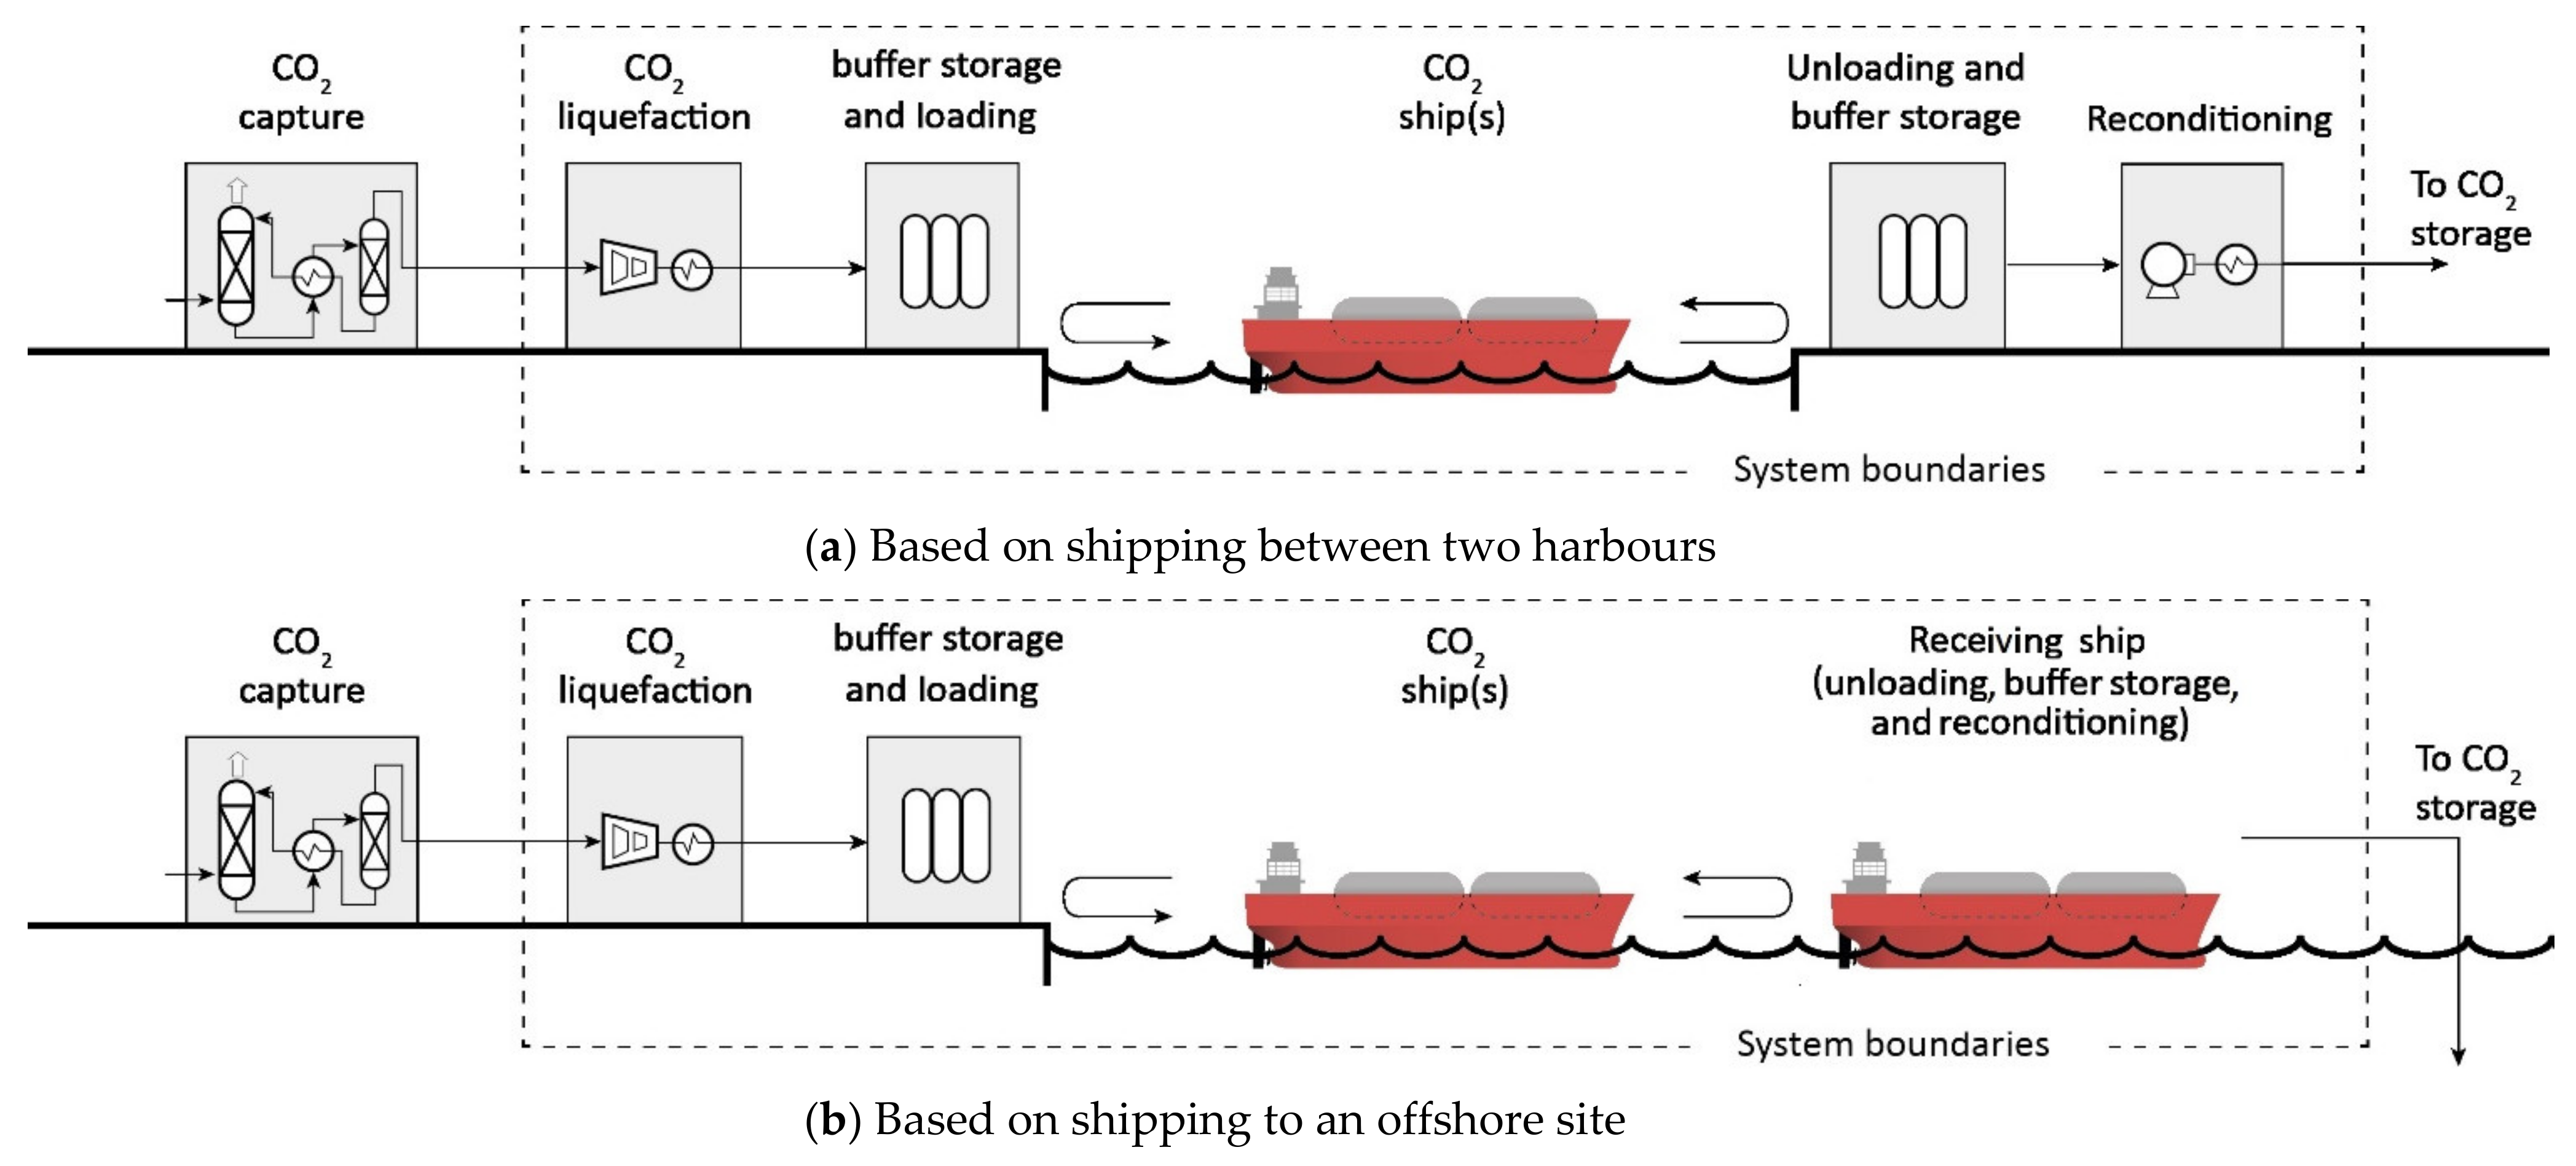
2. Study Concept and System Boundaries
- The assumption in the base cases is that CO2 is liquefied directly after capture as in the Longship project. However, this may not be representative of all cases. For example, CO2 from inland emitters and industrial clusters would typically be transported at high pressure via pipeline prior to liquefaction and ship transport. In such cases, the CO2 would be expected to be available at 90 bara [18] prior to its liquefaction and shipping. This corresponds to the outlet pressure of an onshore pipeline prior to liquefaction. For this reason, two scenarios (3 and 4) seek to understand if and how optimal transport conditions are impacted if the CO2 to be transported is available at 90 bara prior to its liquefaction.
- Since the presence of impurities in the CO2 stream after capture, and possible purity constraints after liquefaction, have been shown to have an impact on CO2 transport design and costs [20,21,43], five scenarios (5 to 9) seek to understand the impact of these effects on the comparison between shipping pressures. The first three scenarios (5 to 7) investigate the impact of different types and levels of impurities presented in Table 1. In addition, stricter purity constraints may be imposed on the CO2 after the liquefaction due to potential requirements set by the buffer storages, ships or storage. For this reason, the impact of purity constraints after CO2 liquefaction is explored, for the membrane case, through two sets of purity requirements (scenarios 8 and 9): Industrial-grade (≥99% purity) and food-grade (≥99.9% purity).
- Since uncertainties exist in the investment costs of CO2 ships [40], two scenarios (10 and 11) investigate the impact of these uncertainties on the comparison of the 7 and 15 barg options. Since investment costs of 7 barg shipping are thought to be considerably lower than the ones of 15 barg shipping for a given ship capacity [40], the uncertainty scenarios will consider the possibility that the costs of building 7 barg shipping have been underestimated and that the costs of 15 barg shipping have been overestimated.
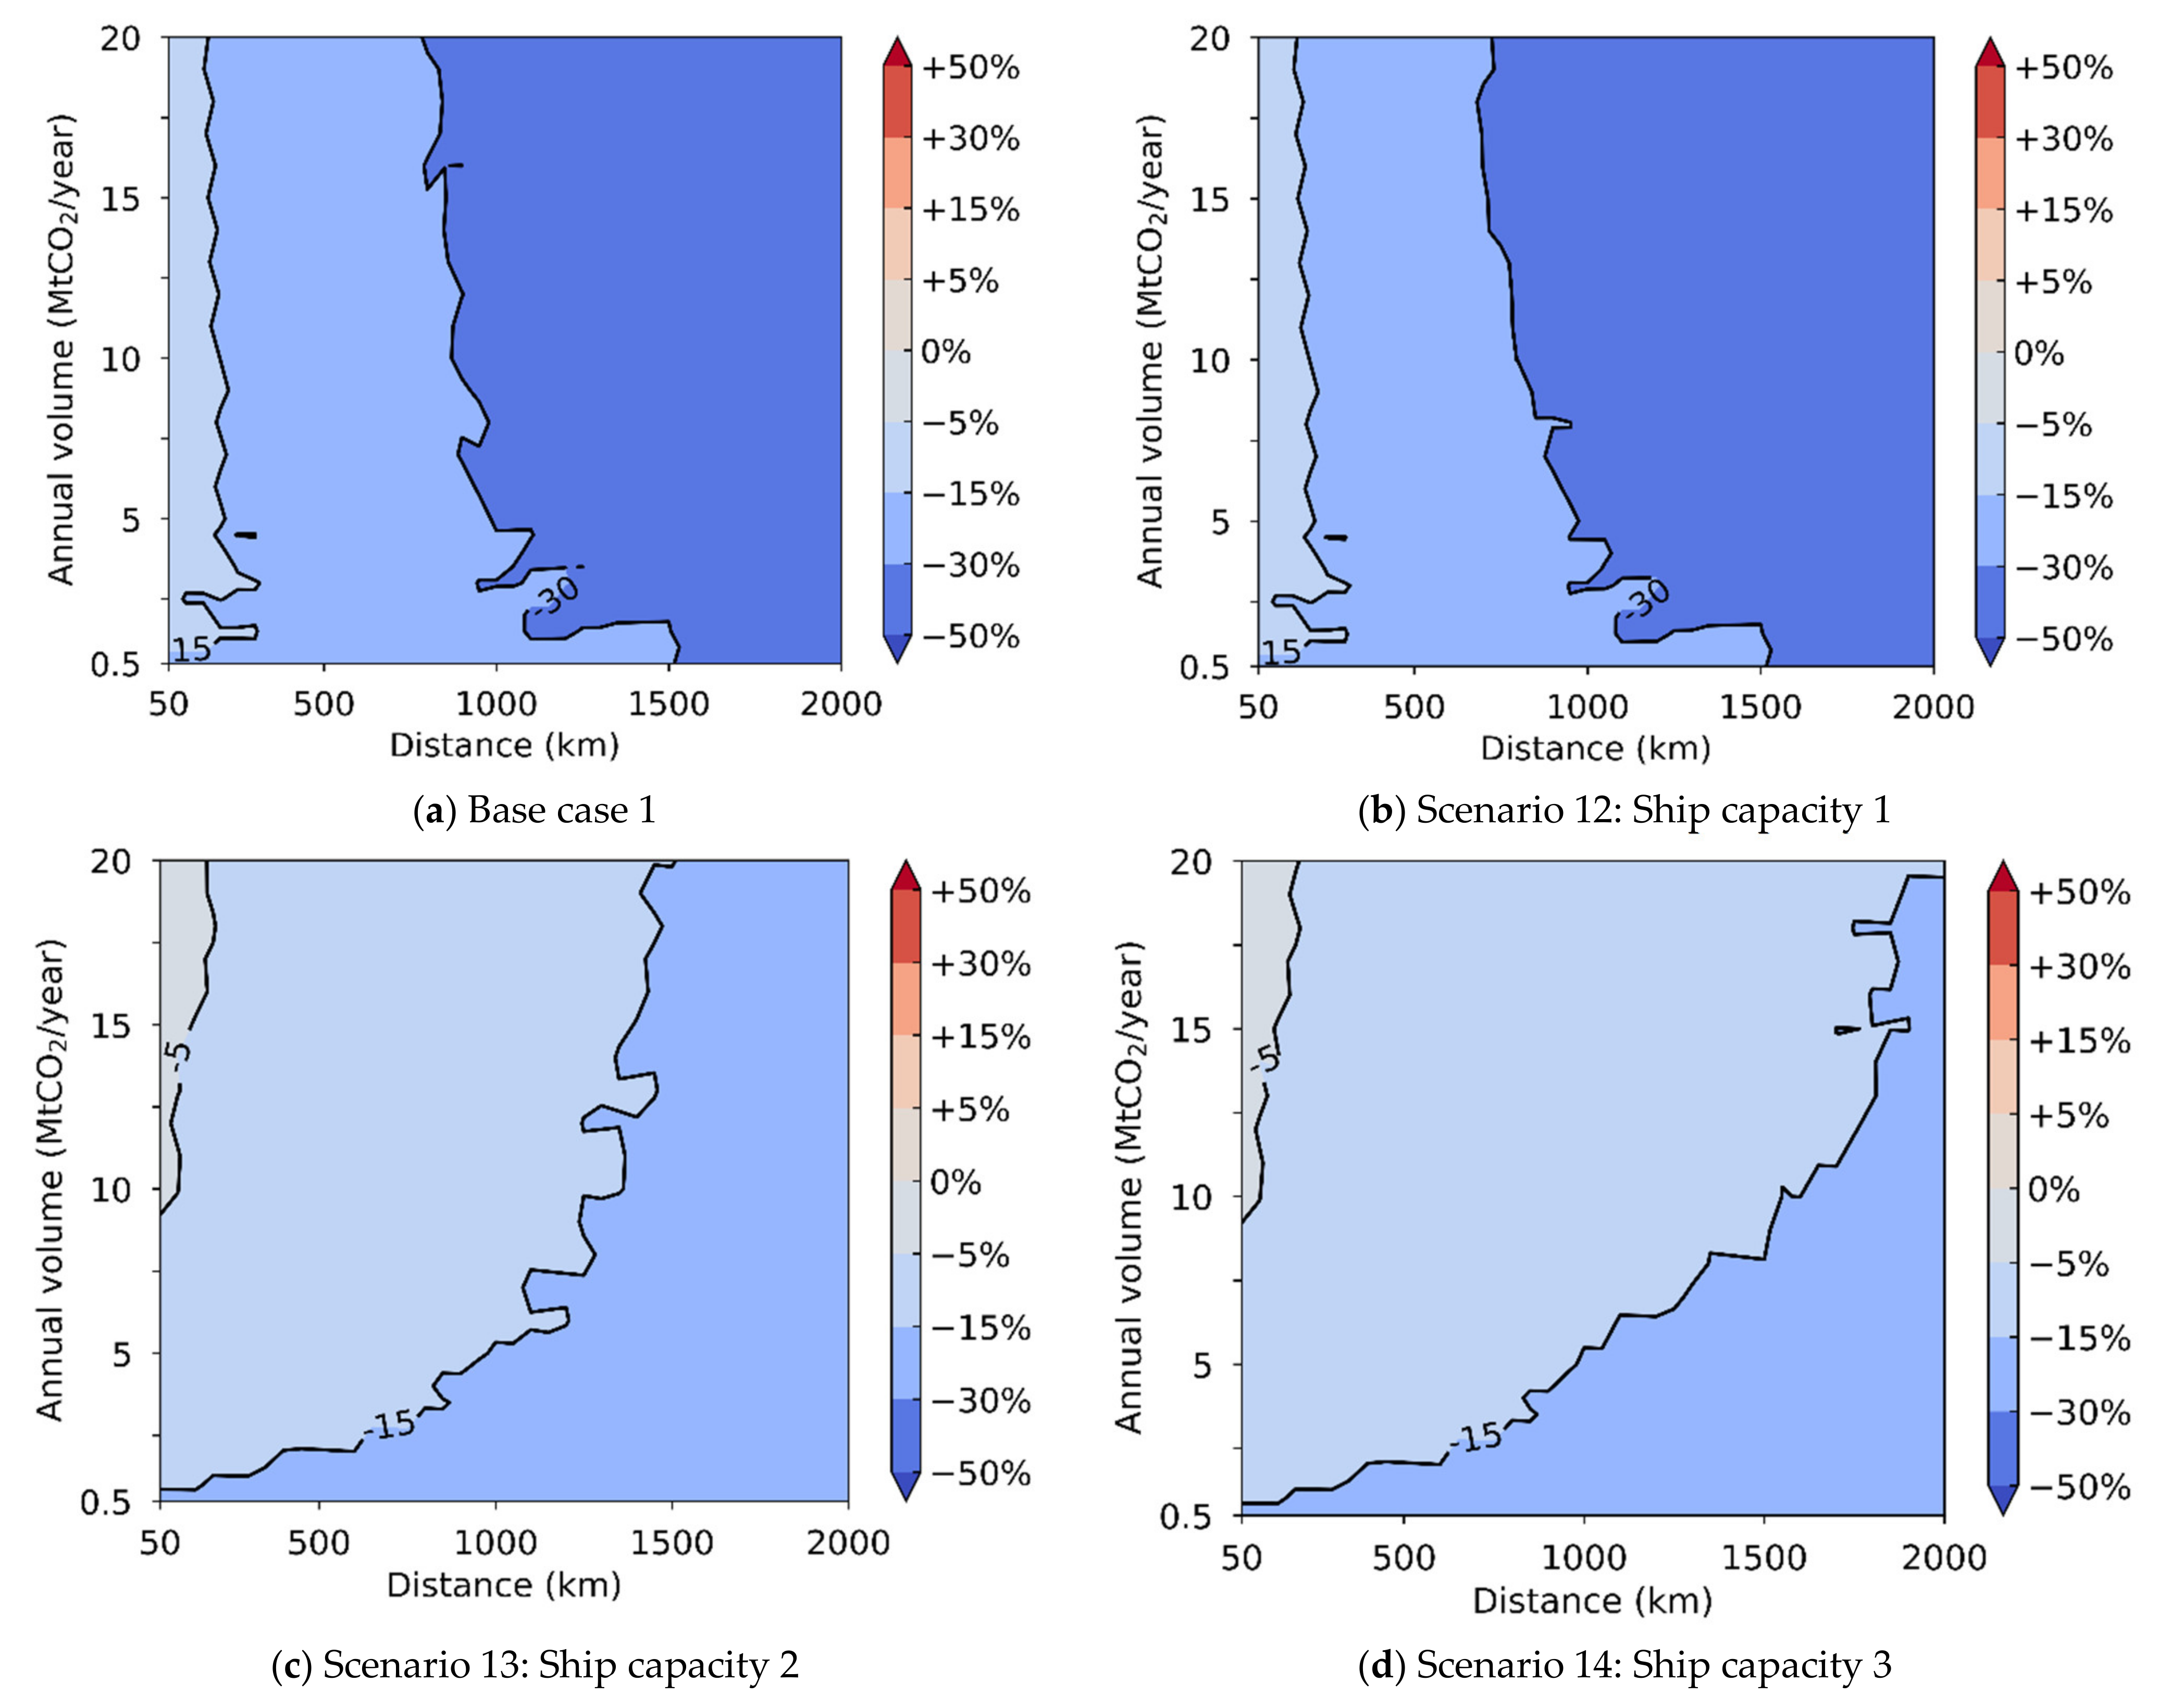
- Both industrial feedback and recent research studies [40] have indicated that a ship capacity beyond 10 ktCO2/ship is not very likely to be feasible for the 15 barg option since the pressure limits the practical diameter that can be considered for the CO2 tank with current tank configurations. In addition, reliable cost data for 7 barg shipping are only available for capacities up to 50 ktCO2/ship. While these two limits are considered as the baseline, three scenarios (12 to 14) investigate the impact of maximum feasible ship capacity on optimal transport conditions. In the first of these scenarios (scenario 12), the maximum ship capacity for the 7 barg option is extended to 100 ktCO2, as such capacity could still be considered for transport of large volumes over long distances. Finally, scenarios 13 and 14 assume that the 15 barg option could still be feasible for ship capacity beyond 10 ktCO2/per ship. In these two scenarios, the 15 barg option is assumed to follow the same ship capacity constraint as for the 7 barg option.
3. Modelling
3.1. Technical Modelling
3.1.1. CO2 Liquefaction
3.1.2. Shipping Supply Chain
- The duration of mooring, loading, and departure at the export hub is set to 12 h [18].
- The average shipping speed during transport is assumed to be 26 km/h (14 knots) [18].
- The duration of mooring, unloading, and departure at the receiving facility is considered to be 12 h in the case of an onshore harbour (base case 1), and 36 h in the case of a floating facility at sea (base case 2) [18].
- A ship is considered to operate 8400 h per year, leaving 360 h for annual maintenance and repairs.
- The ship capacity, and its associated characteristics, can be selected among the ones presented in Table 4 for both 7 and 15 barg shipping. As discussed in Section 2, with the exception of scenarios 12 to 14, the maximum ship capacities considered for 7 and 15 barg shipping are 50 and 10 ktCO2/ship, respectively.
- Boil-off during ship transport is neglected [25].
3.2. Cost Assessment Methodology
3.2.1. CO2 Liquefaction and Reconditioning Processes
- C is the CAPEX of the considered capacity (in M€);
- S is the capacity under consideration (in MtCO2/year);
- is the CAPEX for the reference capacity;
- is the reference capacity;
3.2.2. Buffer Storage, Loading and Unloading Facilities, and Ships
3.3. Cost Performance Metric
4. Results
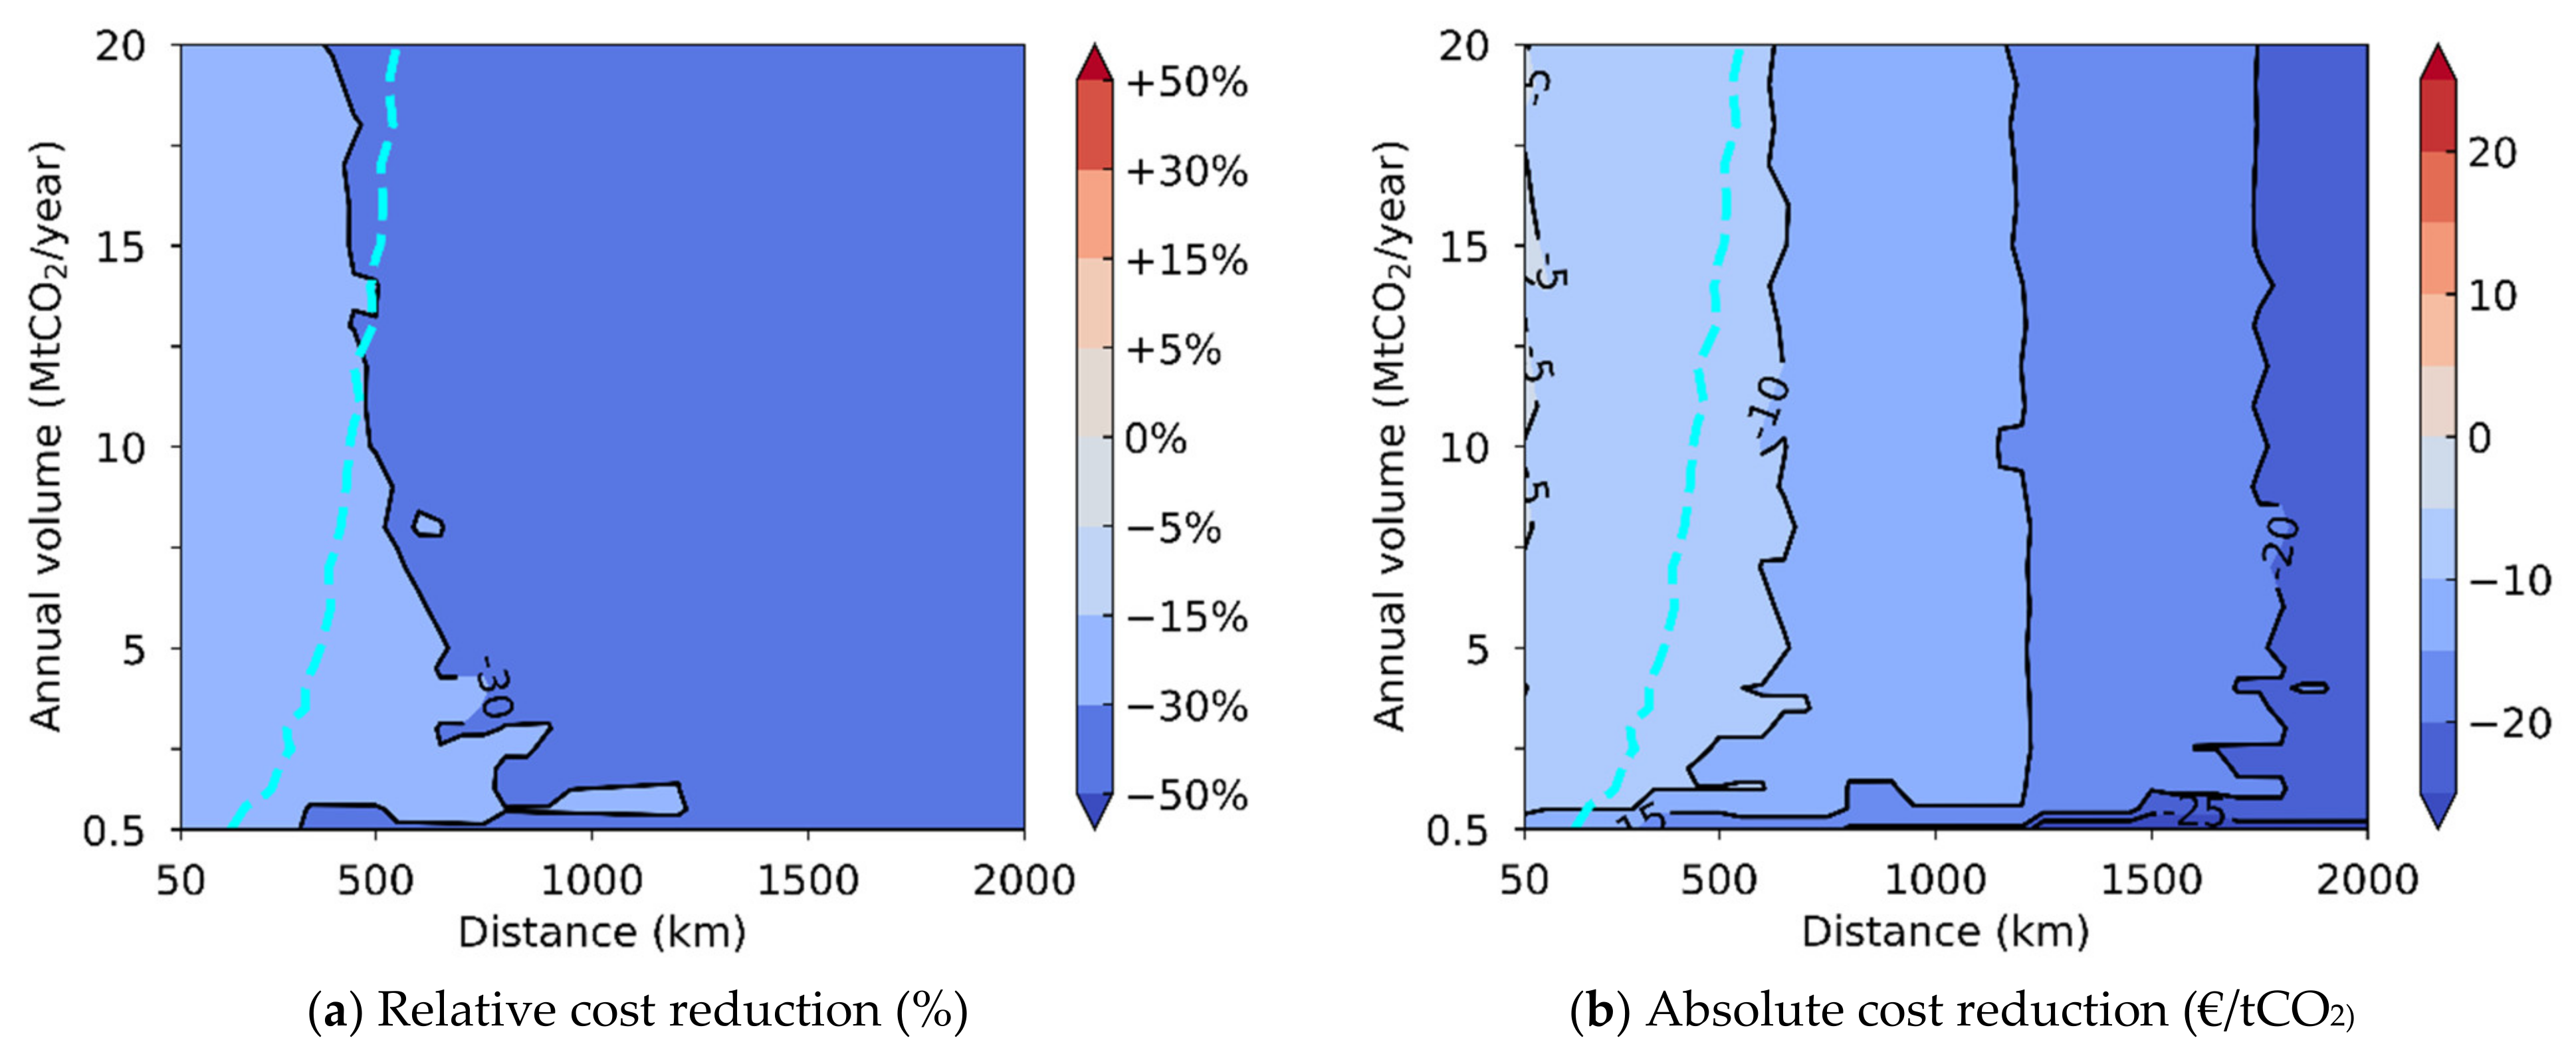
4.1. CO2 Shipping between Harbours
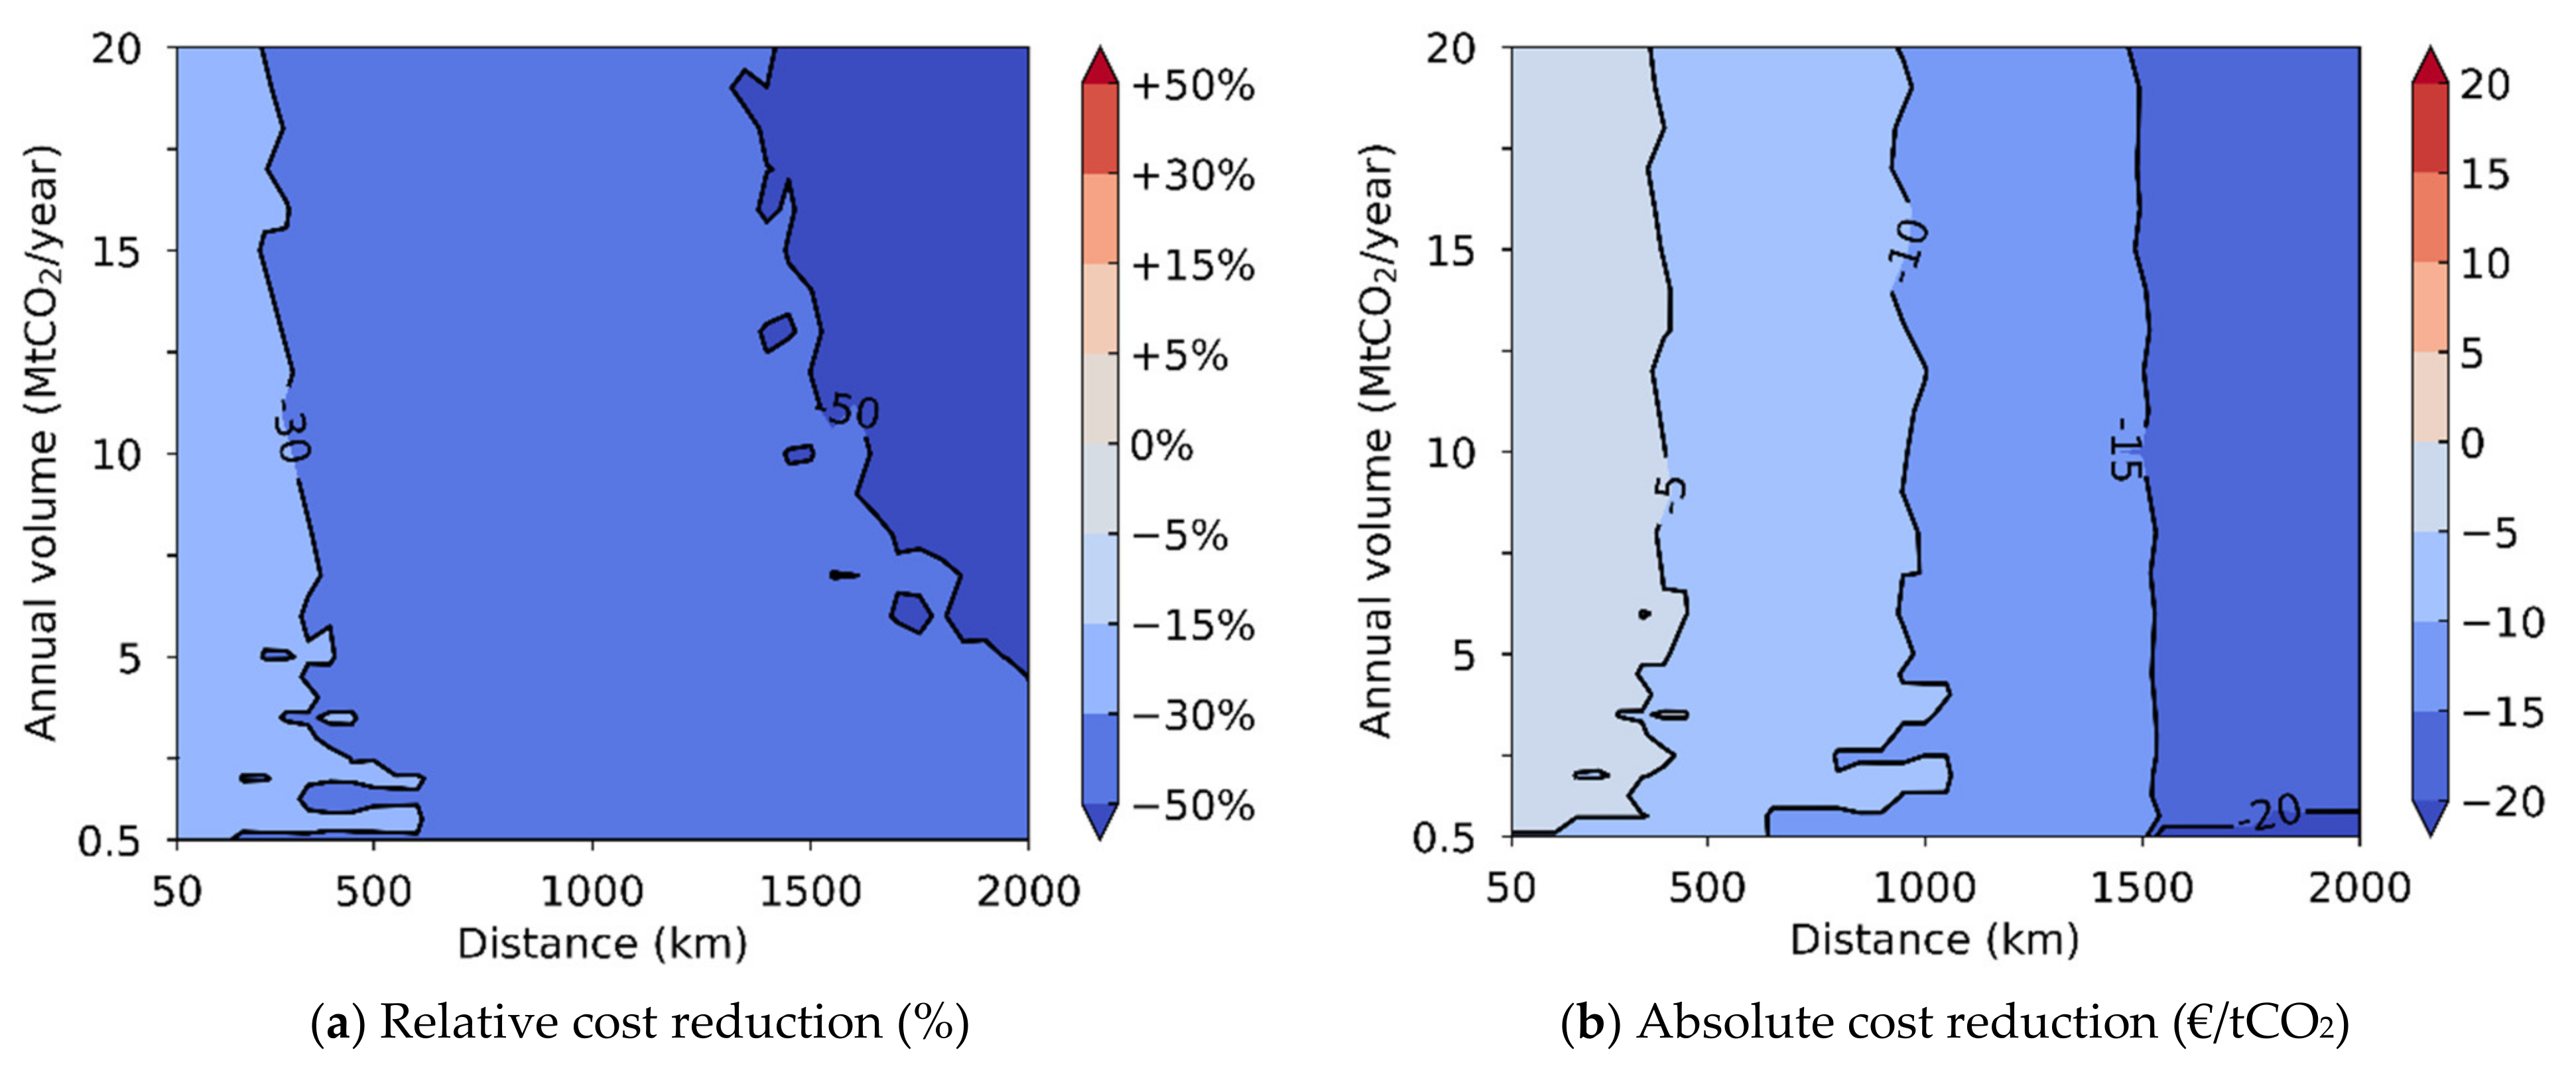
4.2. CO2 Shipping to an Offshore Site
5. Discussions
5.1. Impact of CO2 Pressure Prior to the Liquefaction Process
5.2. Impact of Impurities and Purity Constraints
5.3. Impact of Uncertainties in Ship Investment Costs
5.4. Impact of Maximum Ship Capacity
6. Conclusions
Author Contributions
Funding
Acknowledgments
Conflicts of Interest
Abbreviations
| CAPEX | Capital expenditures |
| CCS | Carbon capture and storage |
| IGCC | Integrated gasification combined cycle |
| OPEX | Operating expenditures |
Appendix A. Modelling of Pipeline-Based CO2 Transport
Appendix B. CO2 Conditioning and Transport Costs
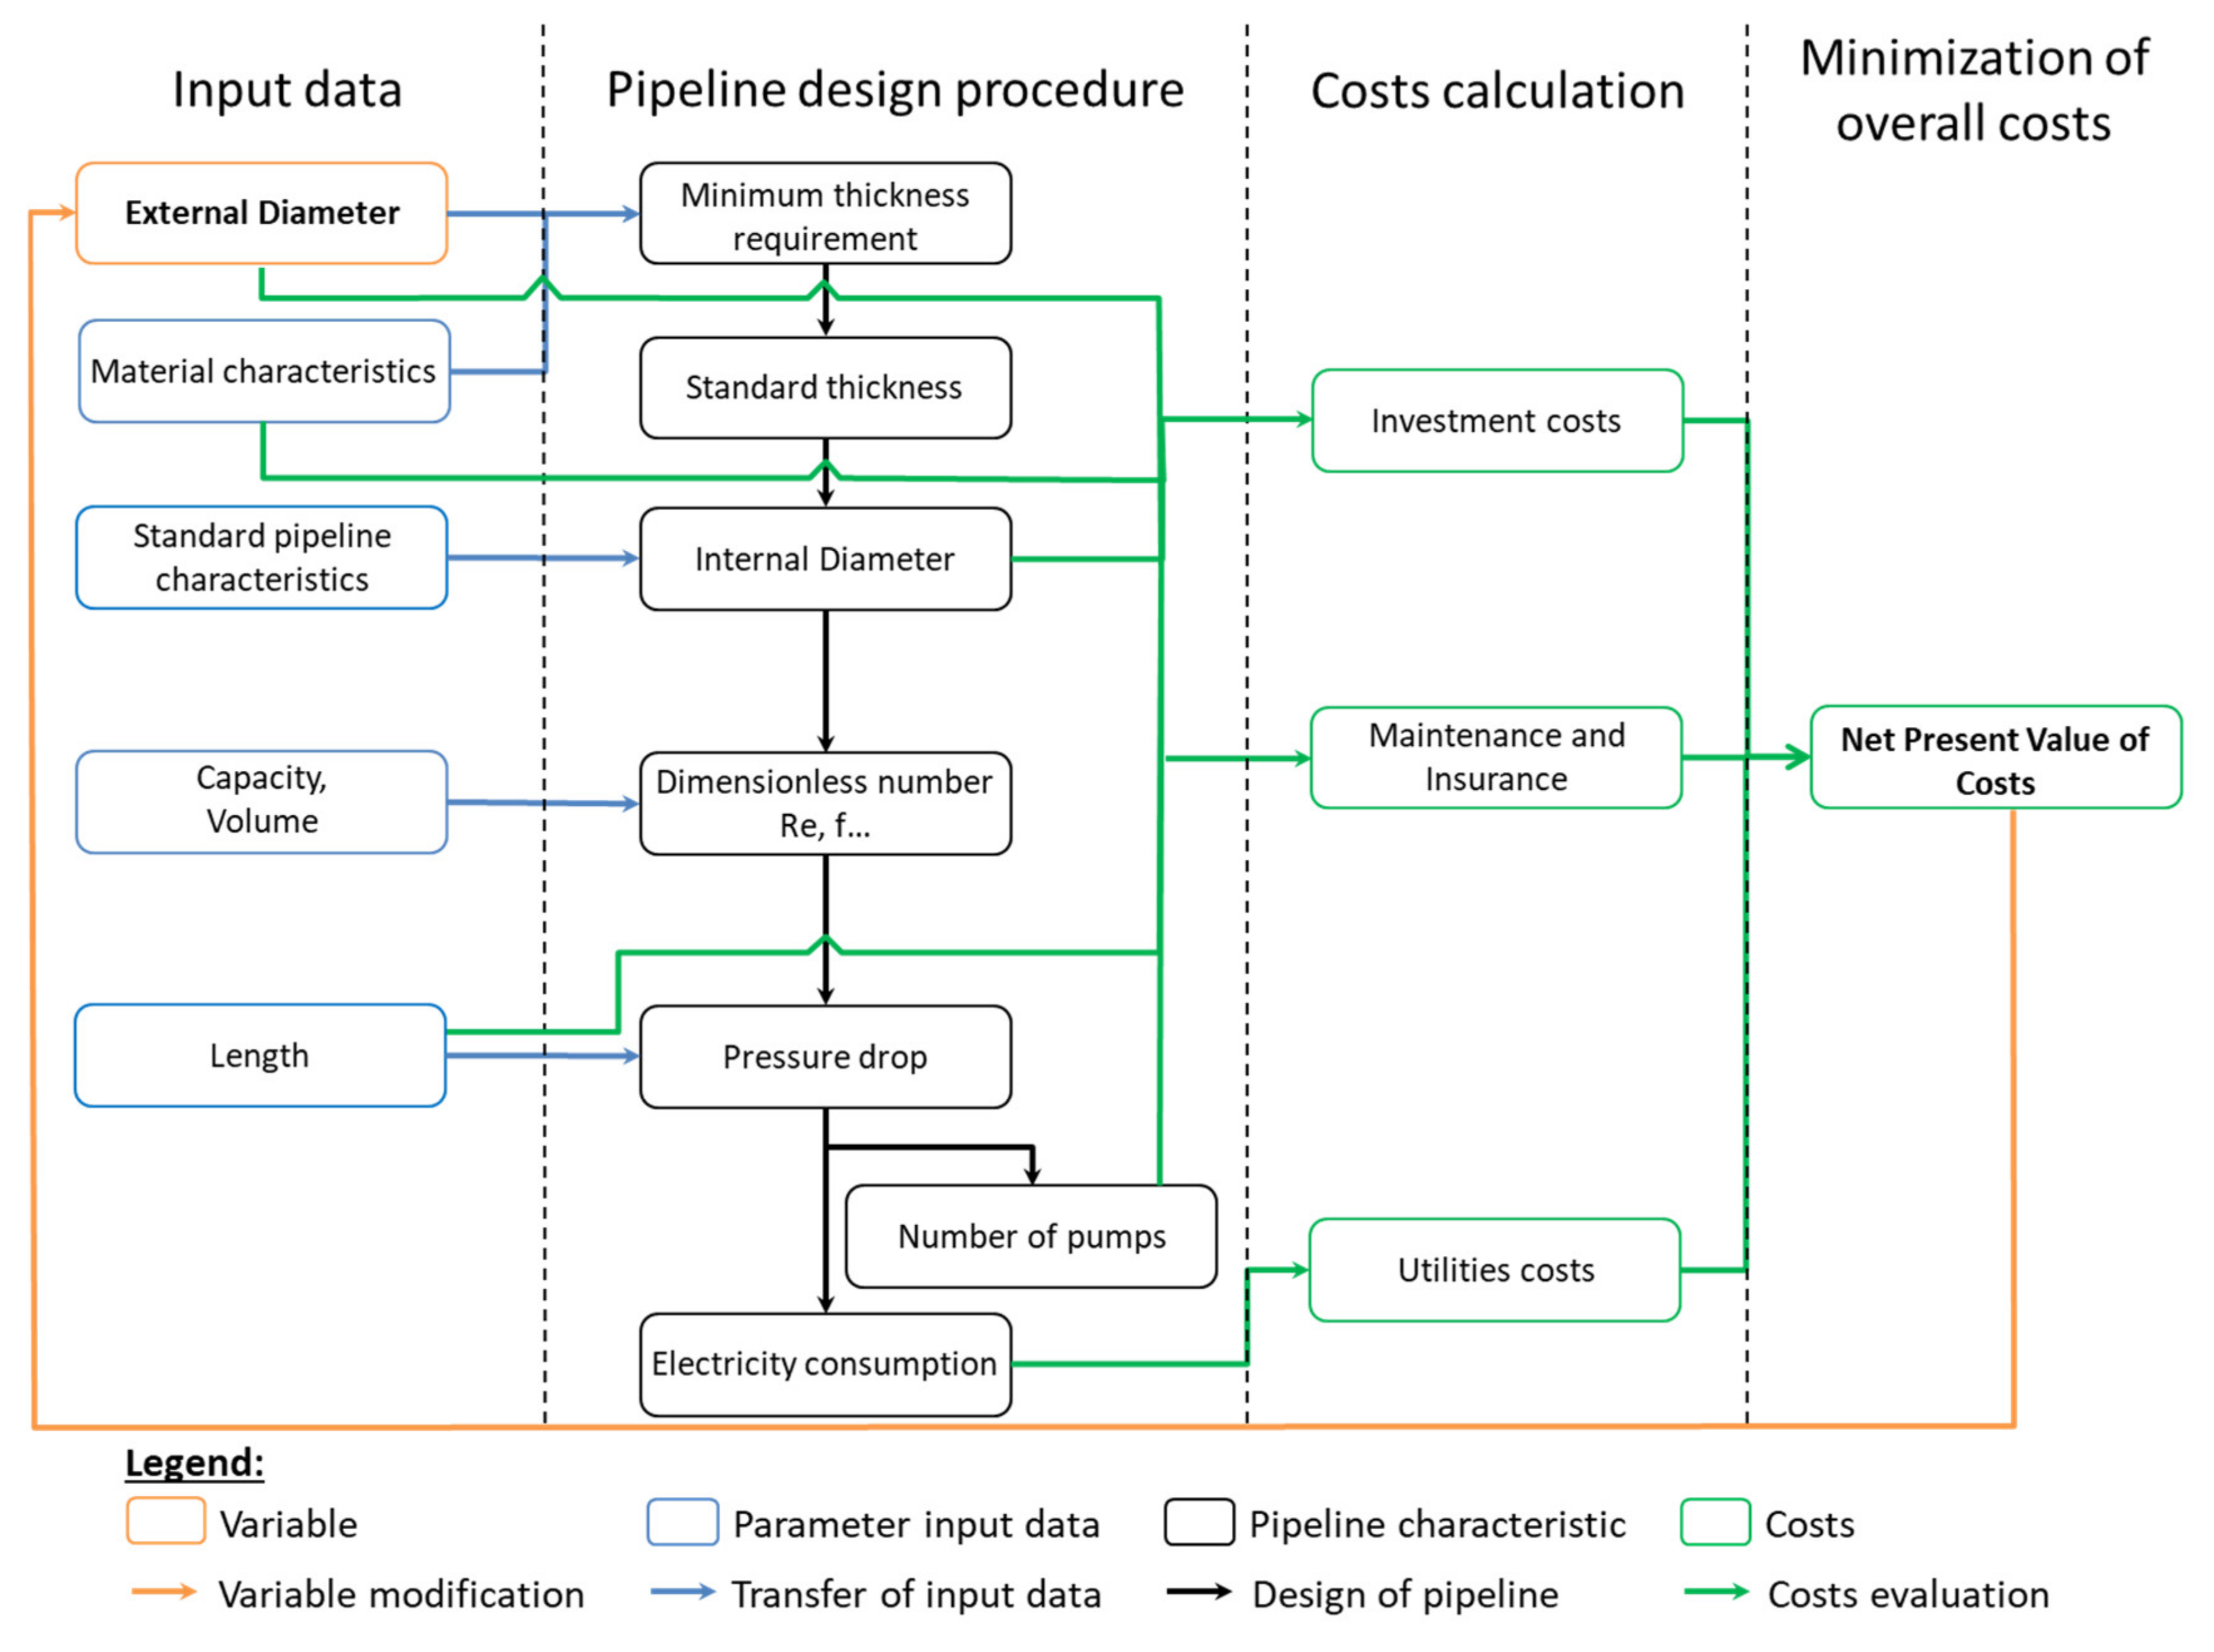
Appendix B.1. CO2 Conditioning and Transport Costs for Transport between Two Harbours/Onshore Locations


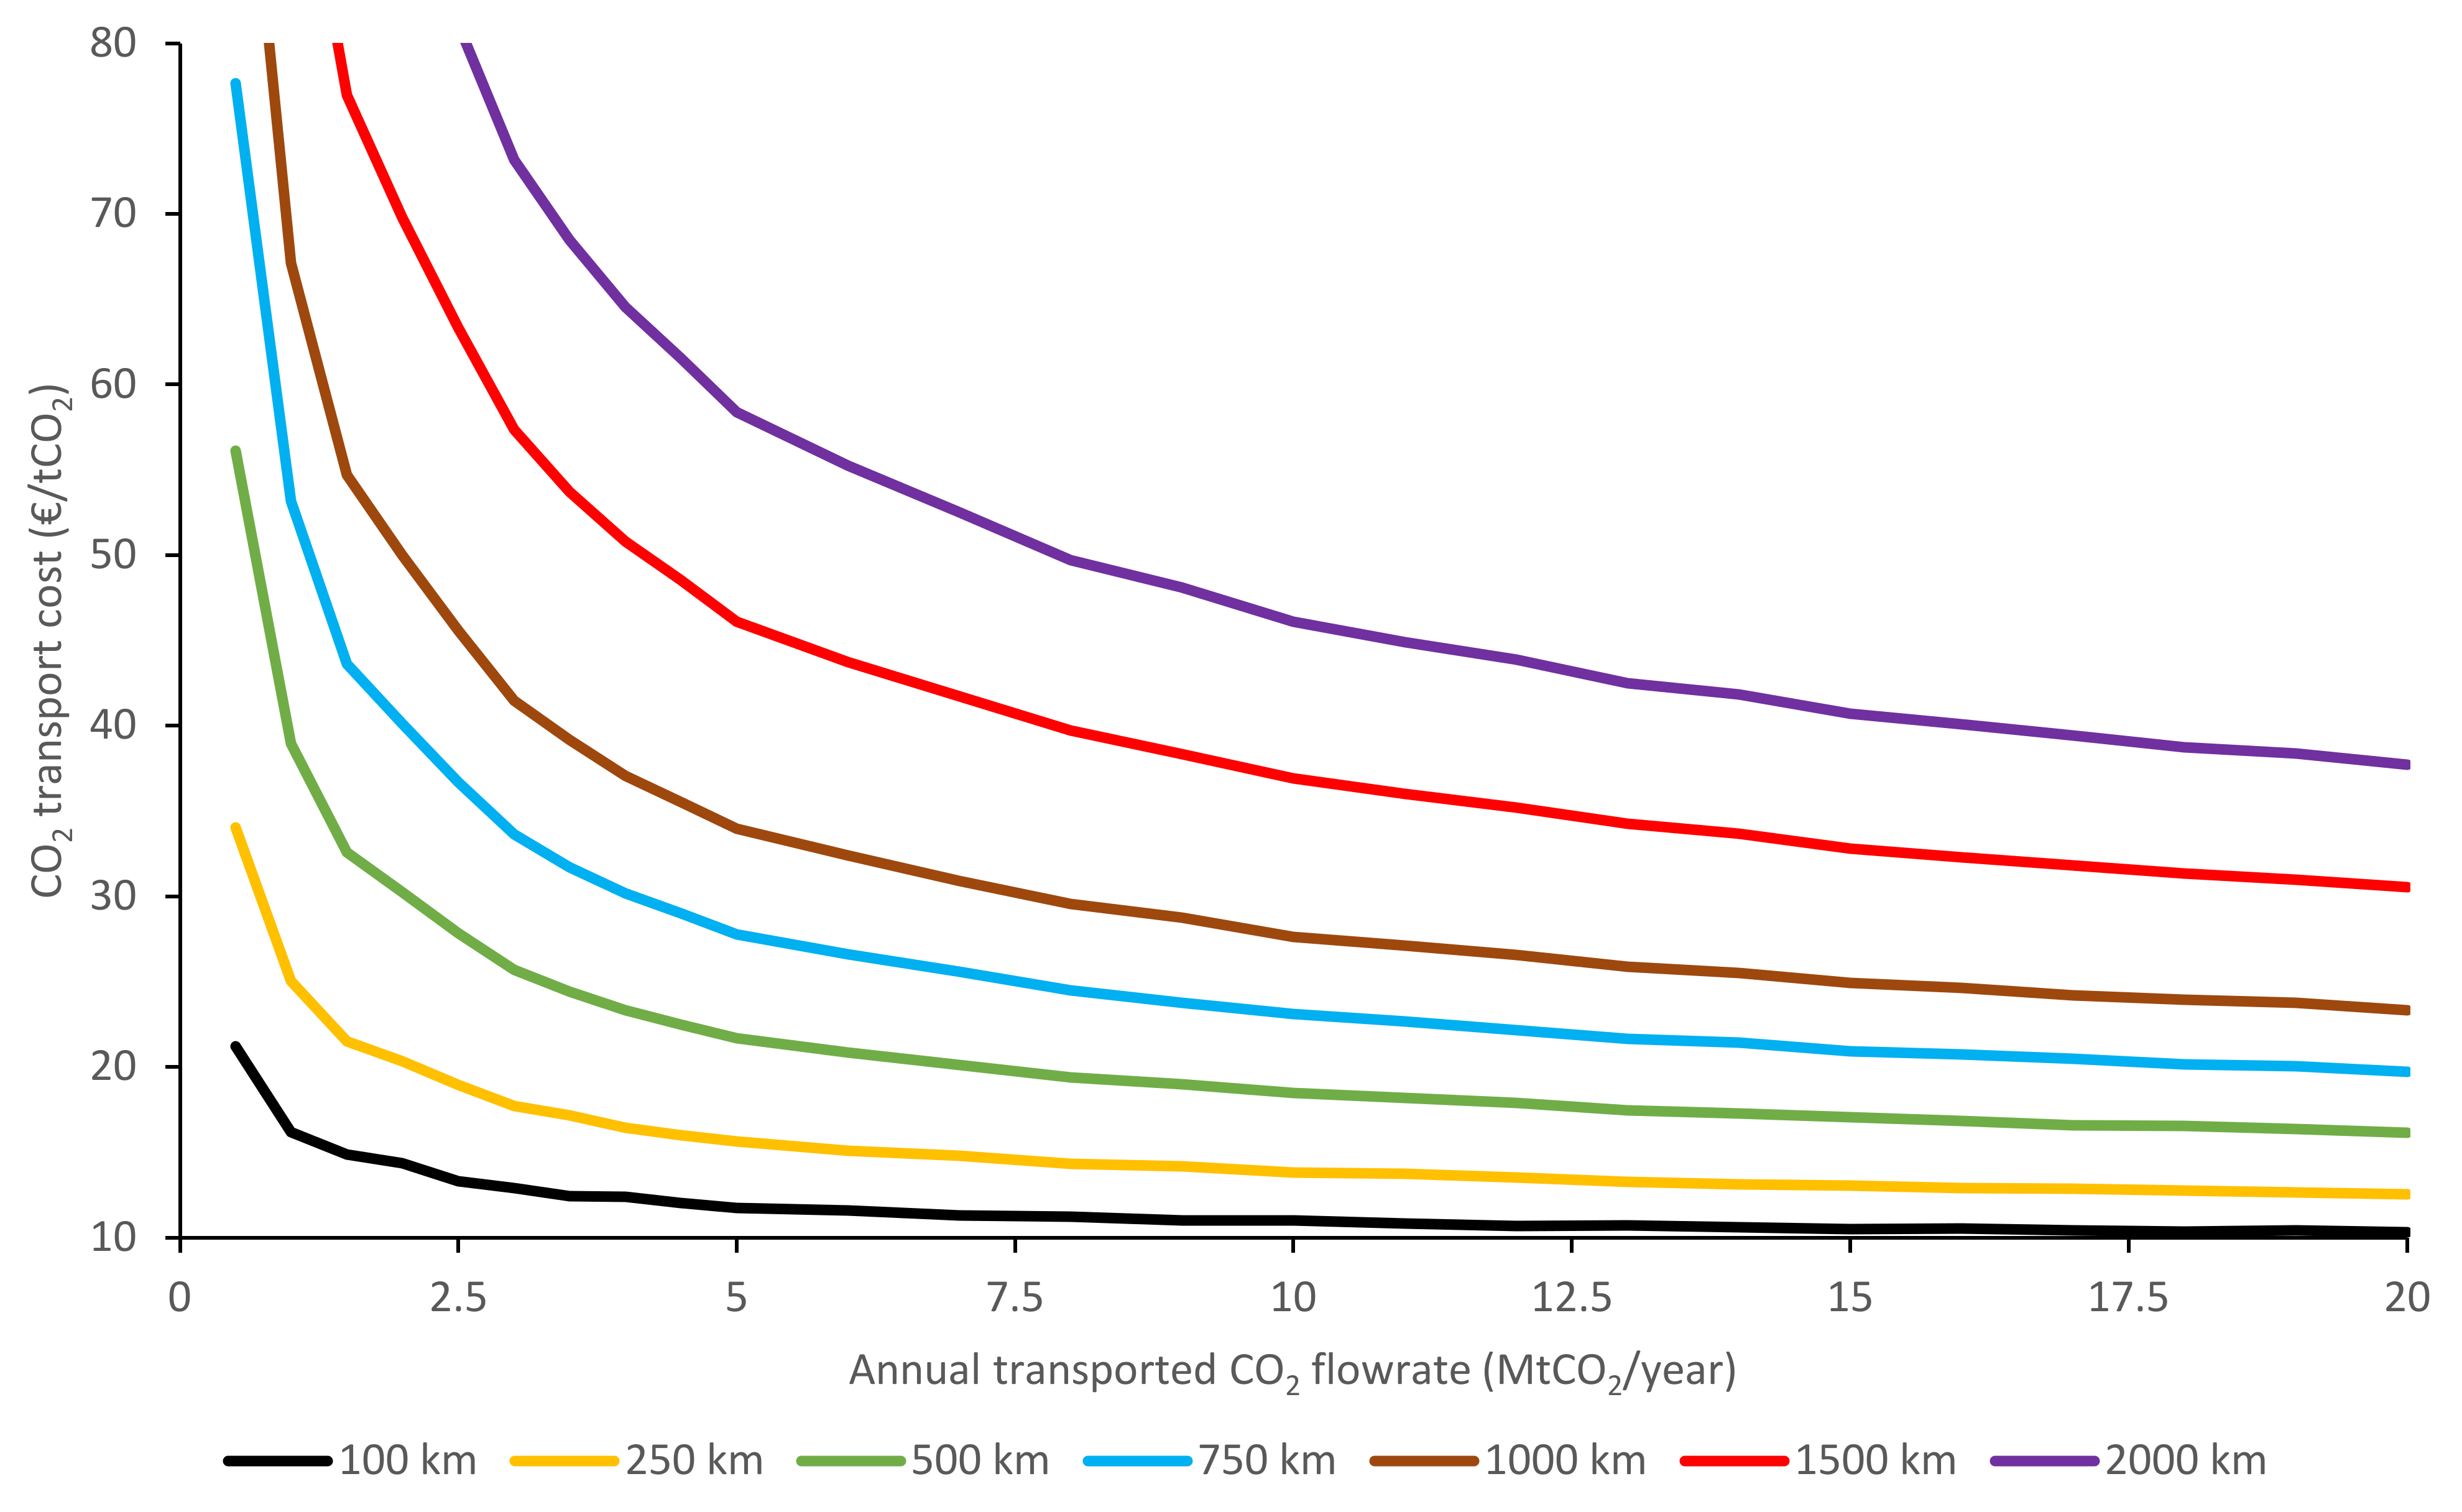
Appendix B.2. CO2 Conditioning and Transport Costs for Transport to an Offshore Site


Appendix C. Cost Breakdowns
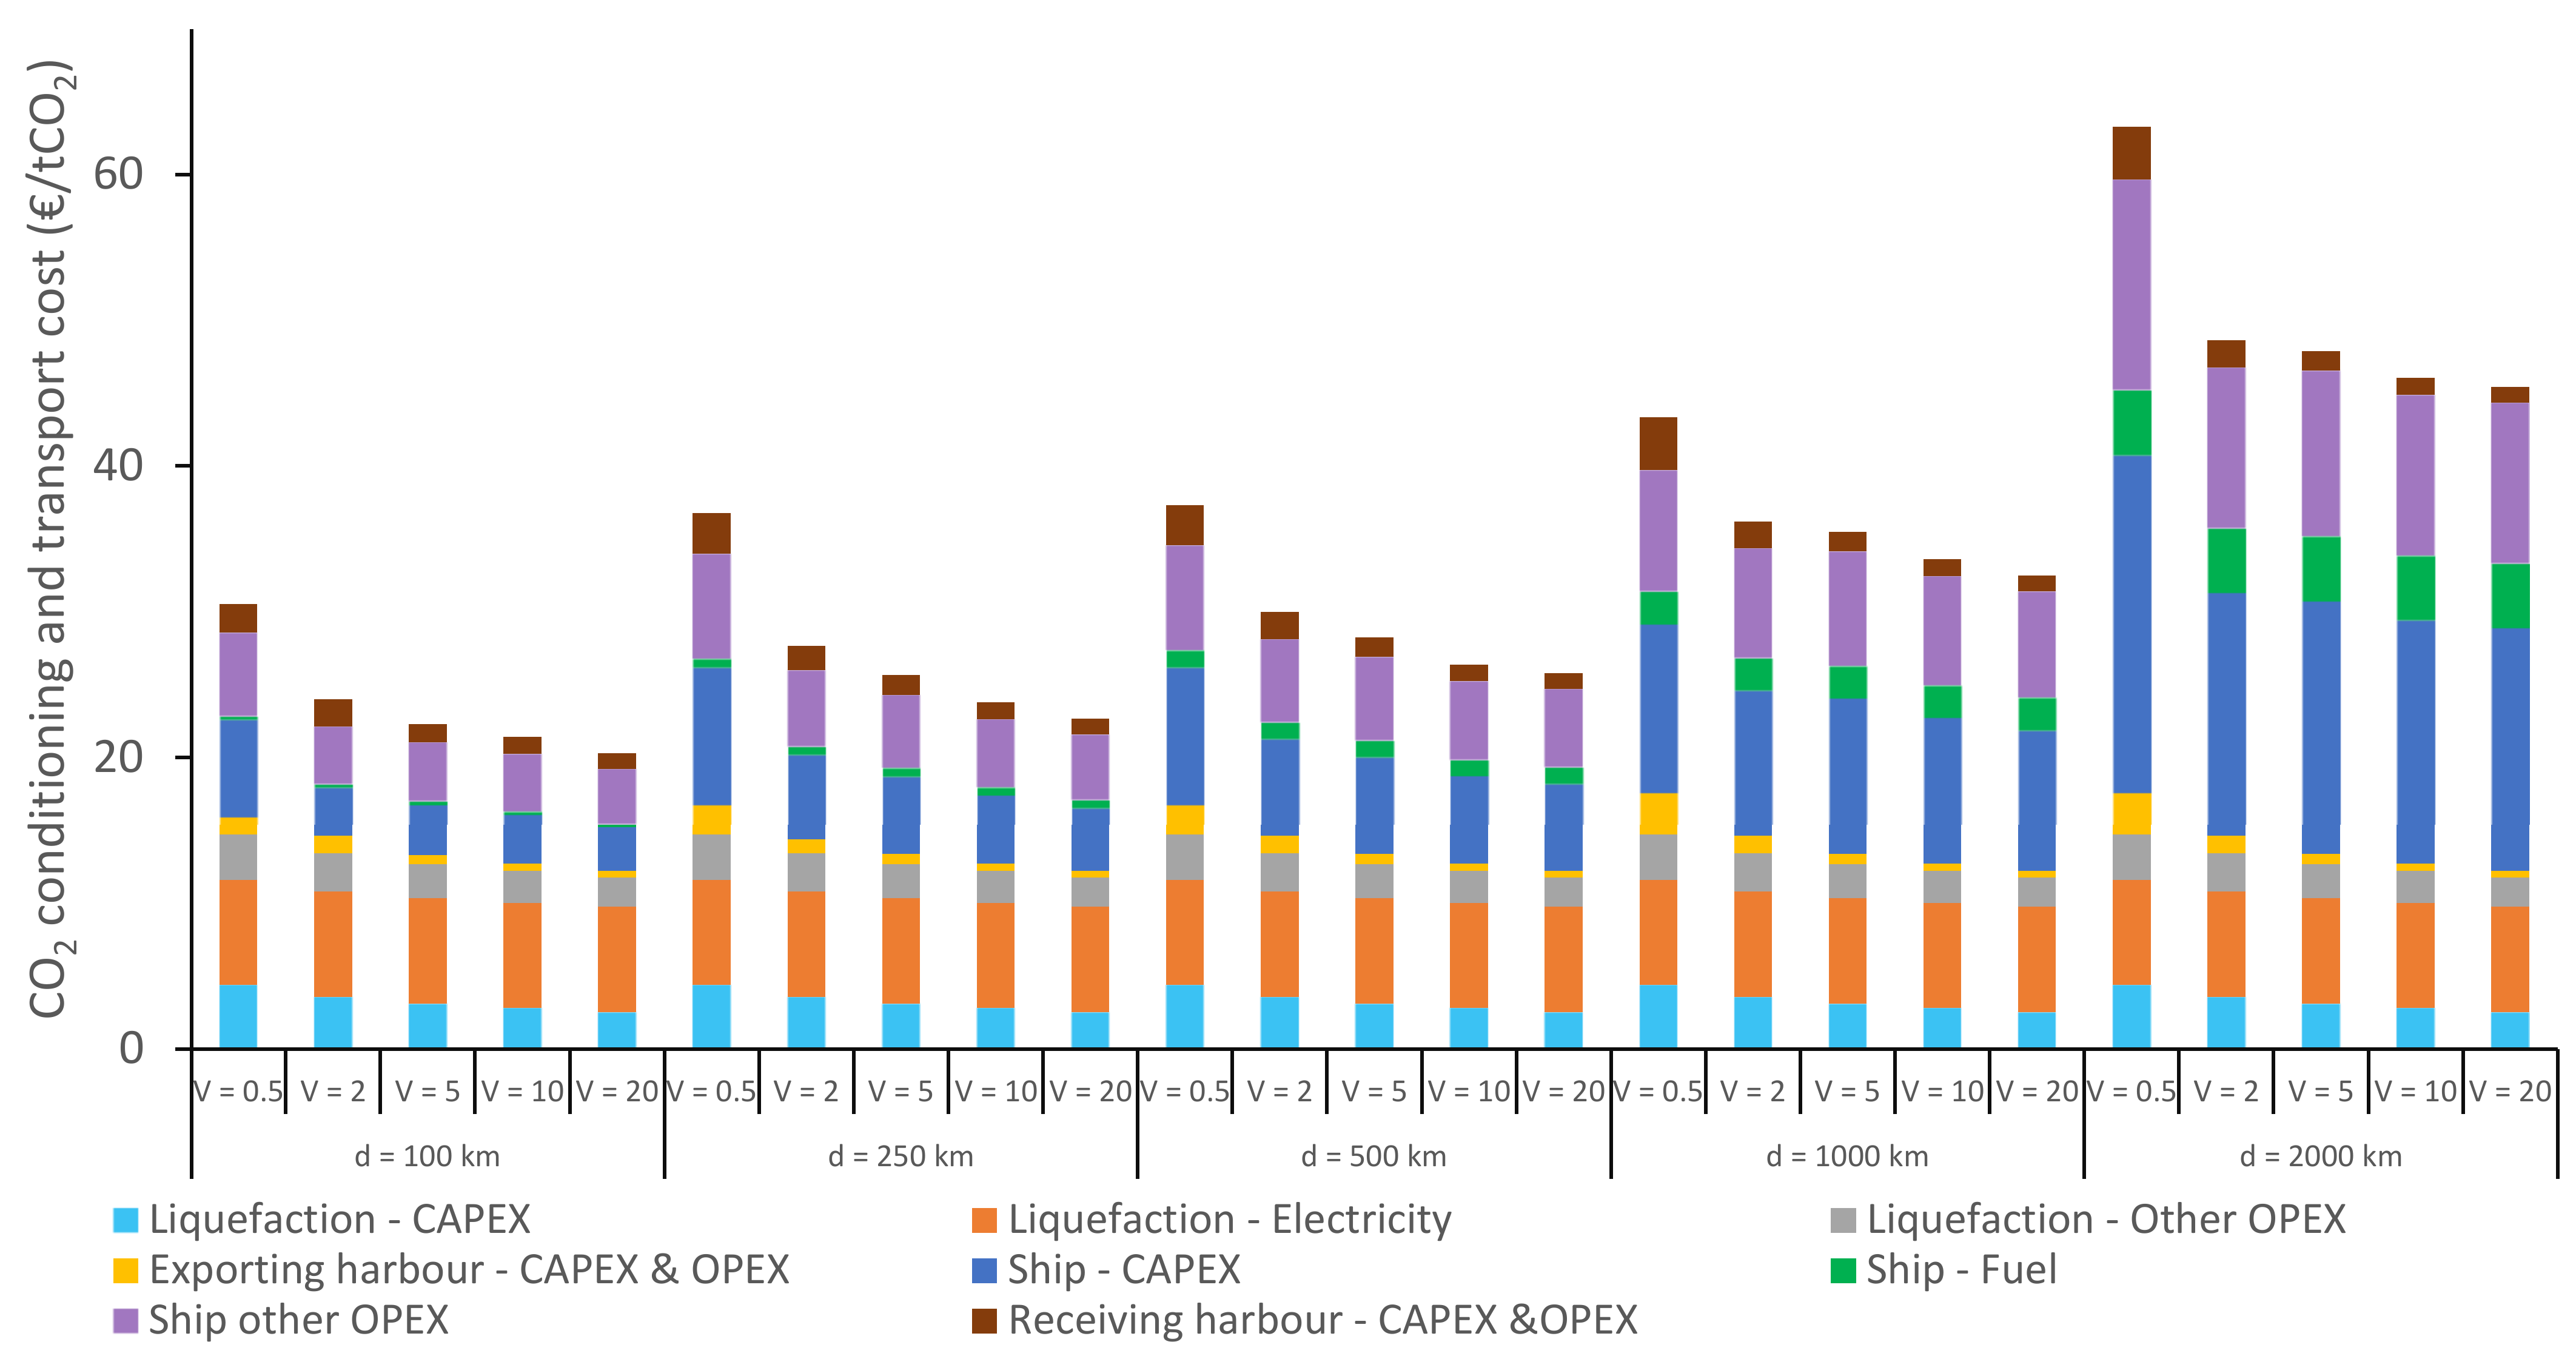
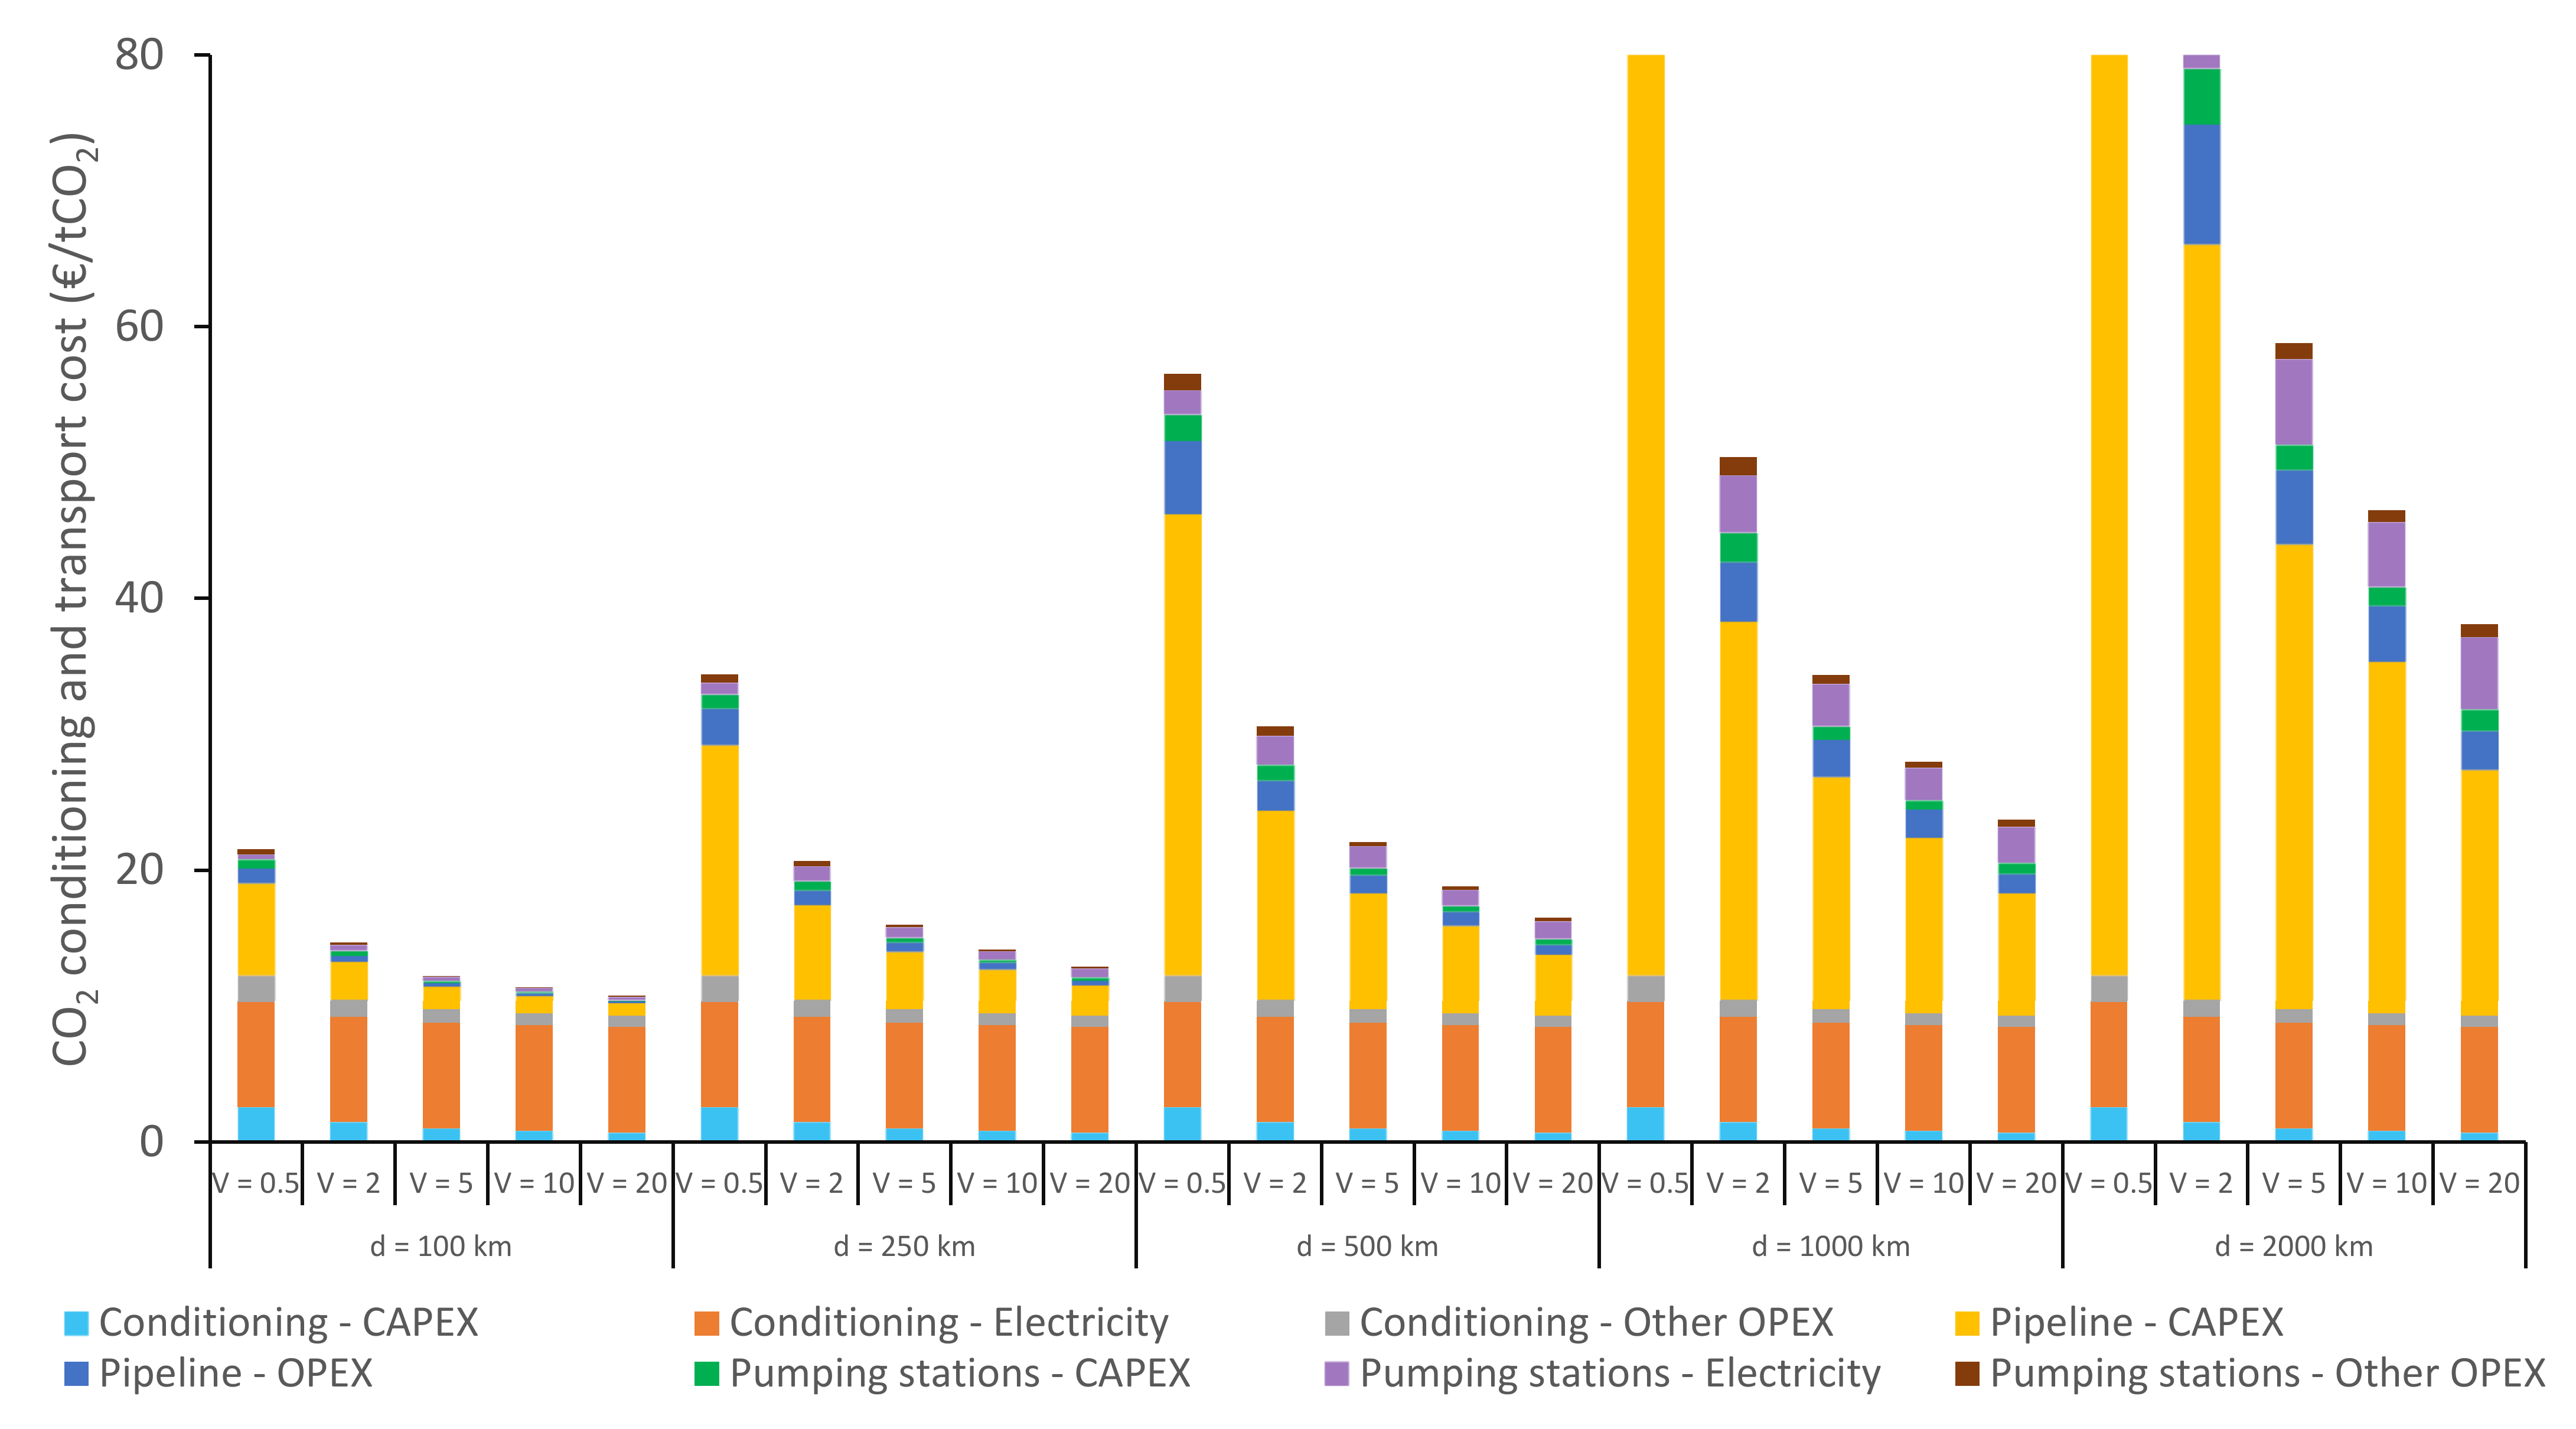
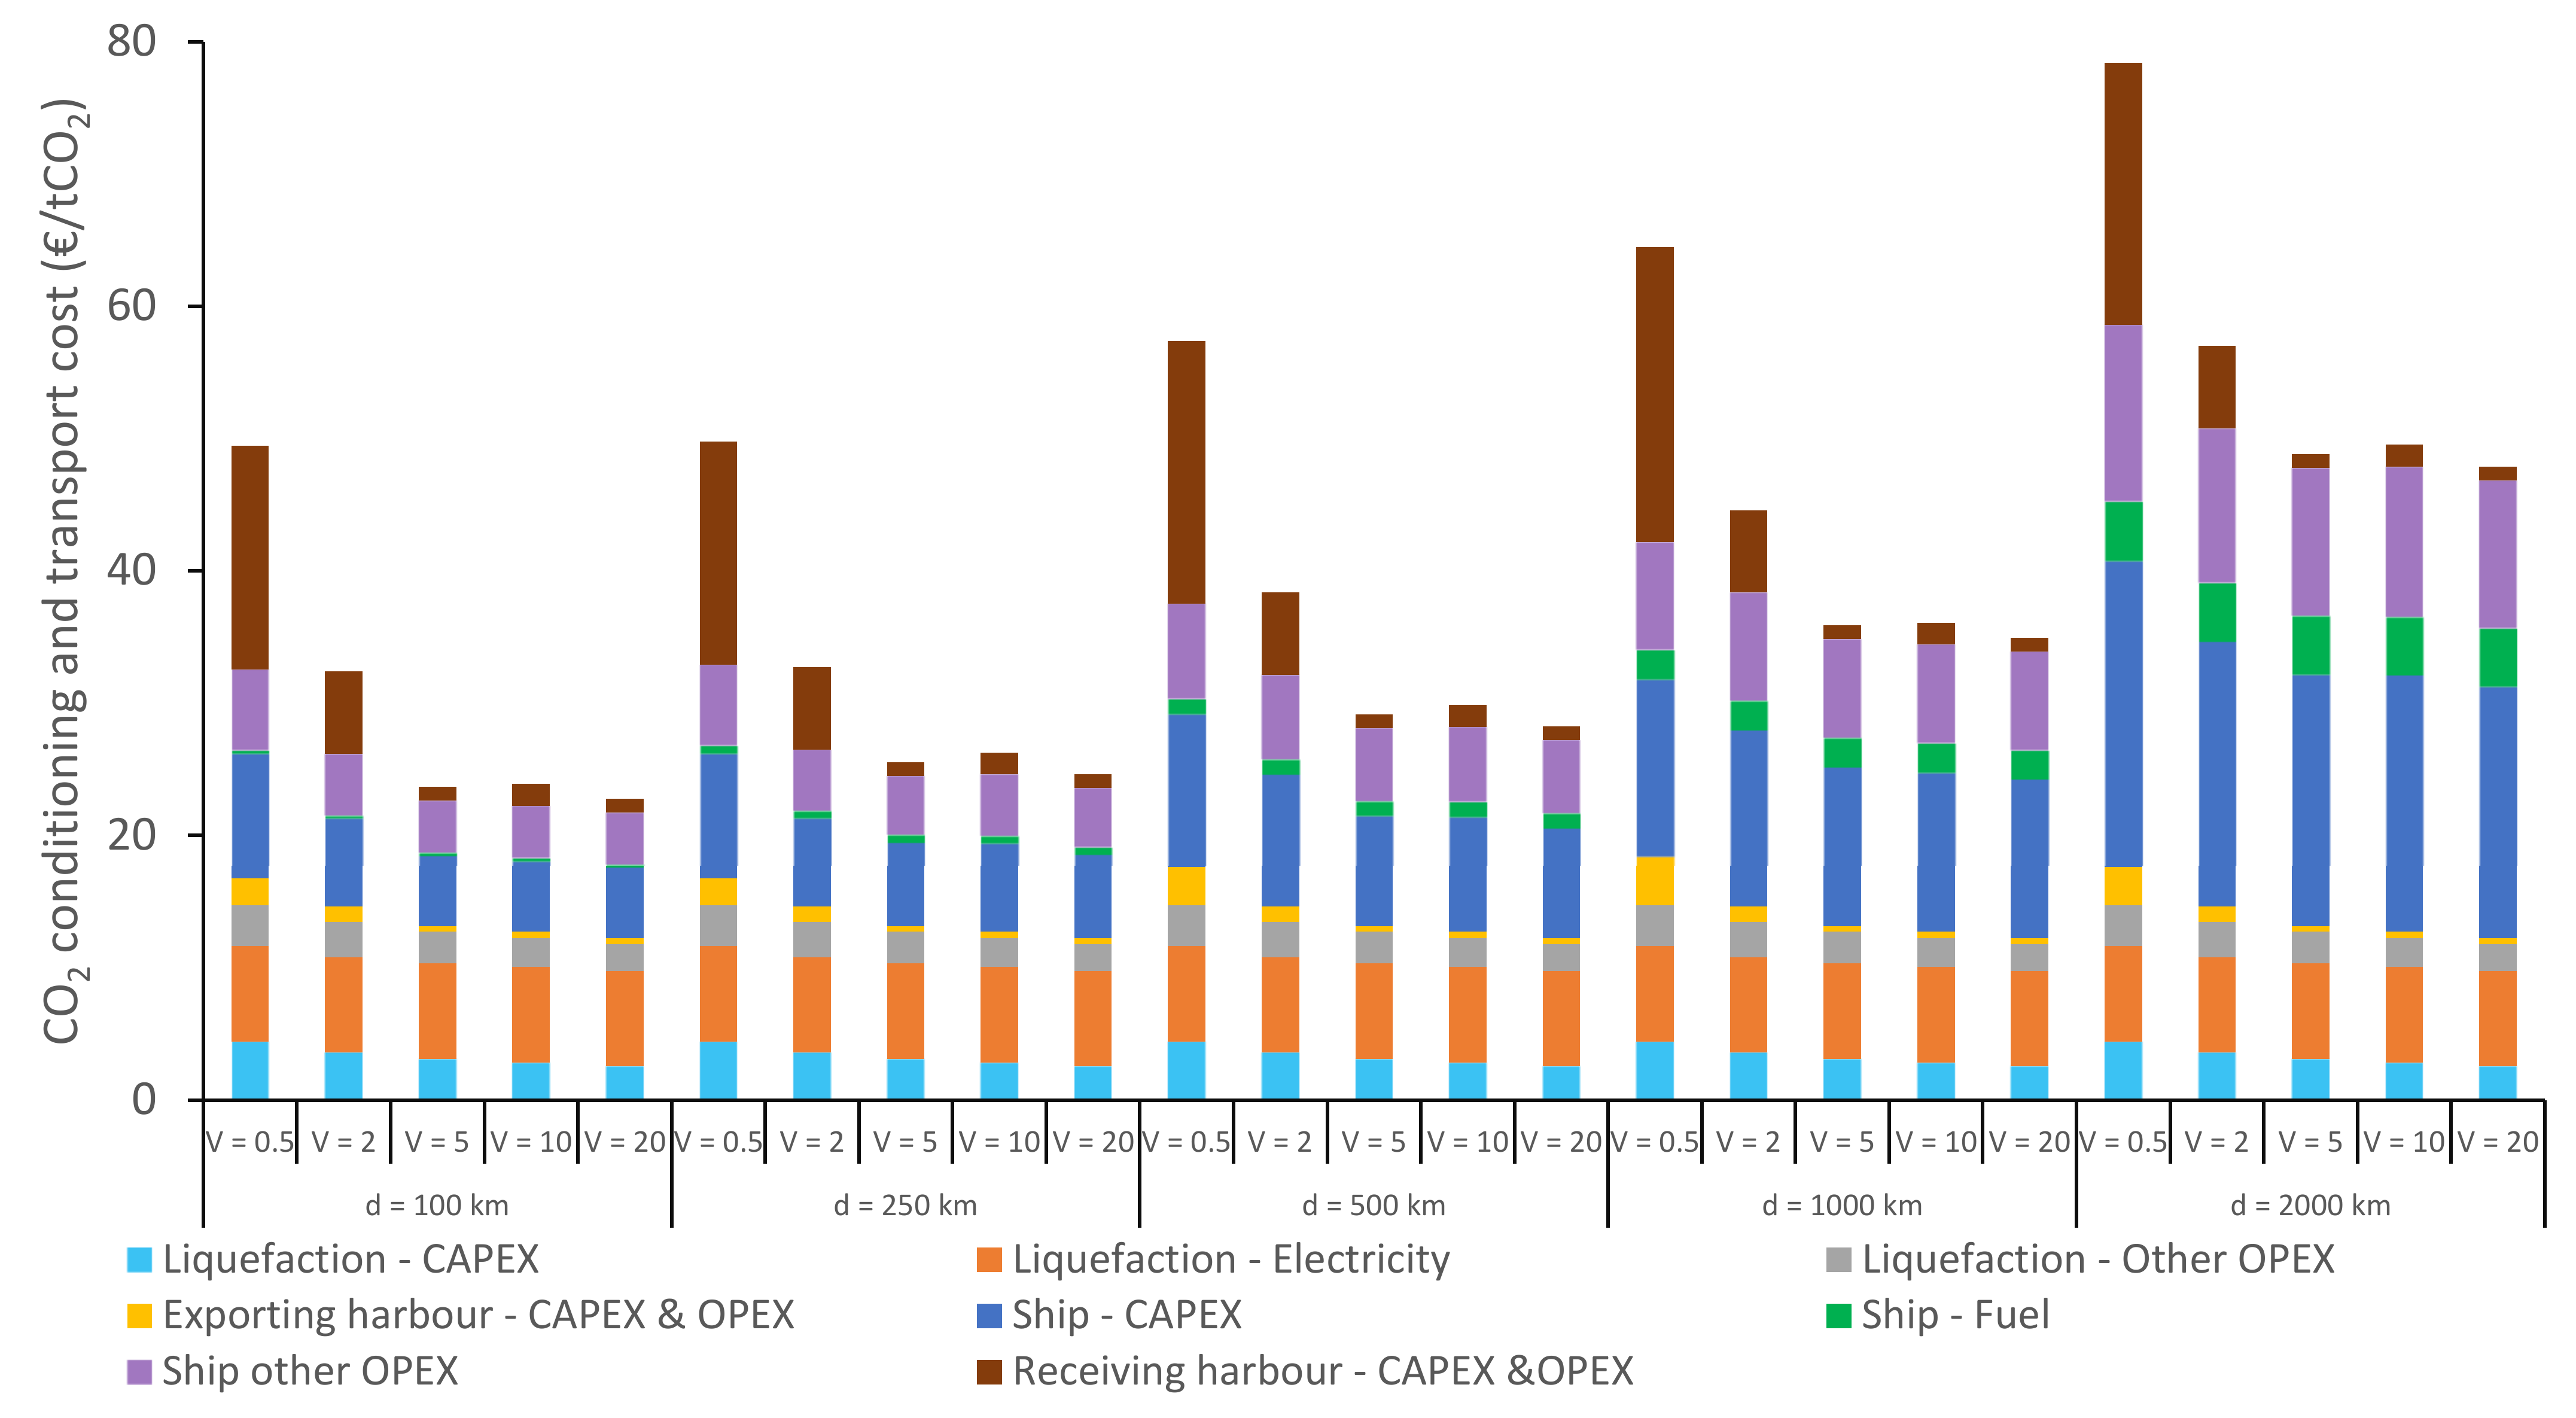
Appendix C.1. CO2 Conditioning and Transport Cost Breakdowns for Transport between Two Harbours/Onshore Locations
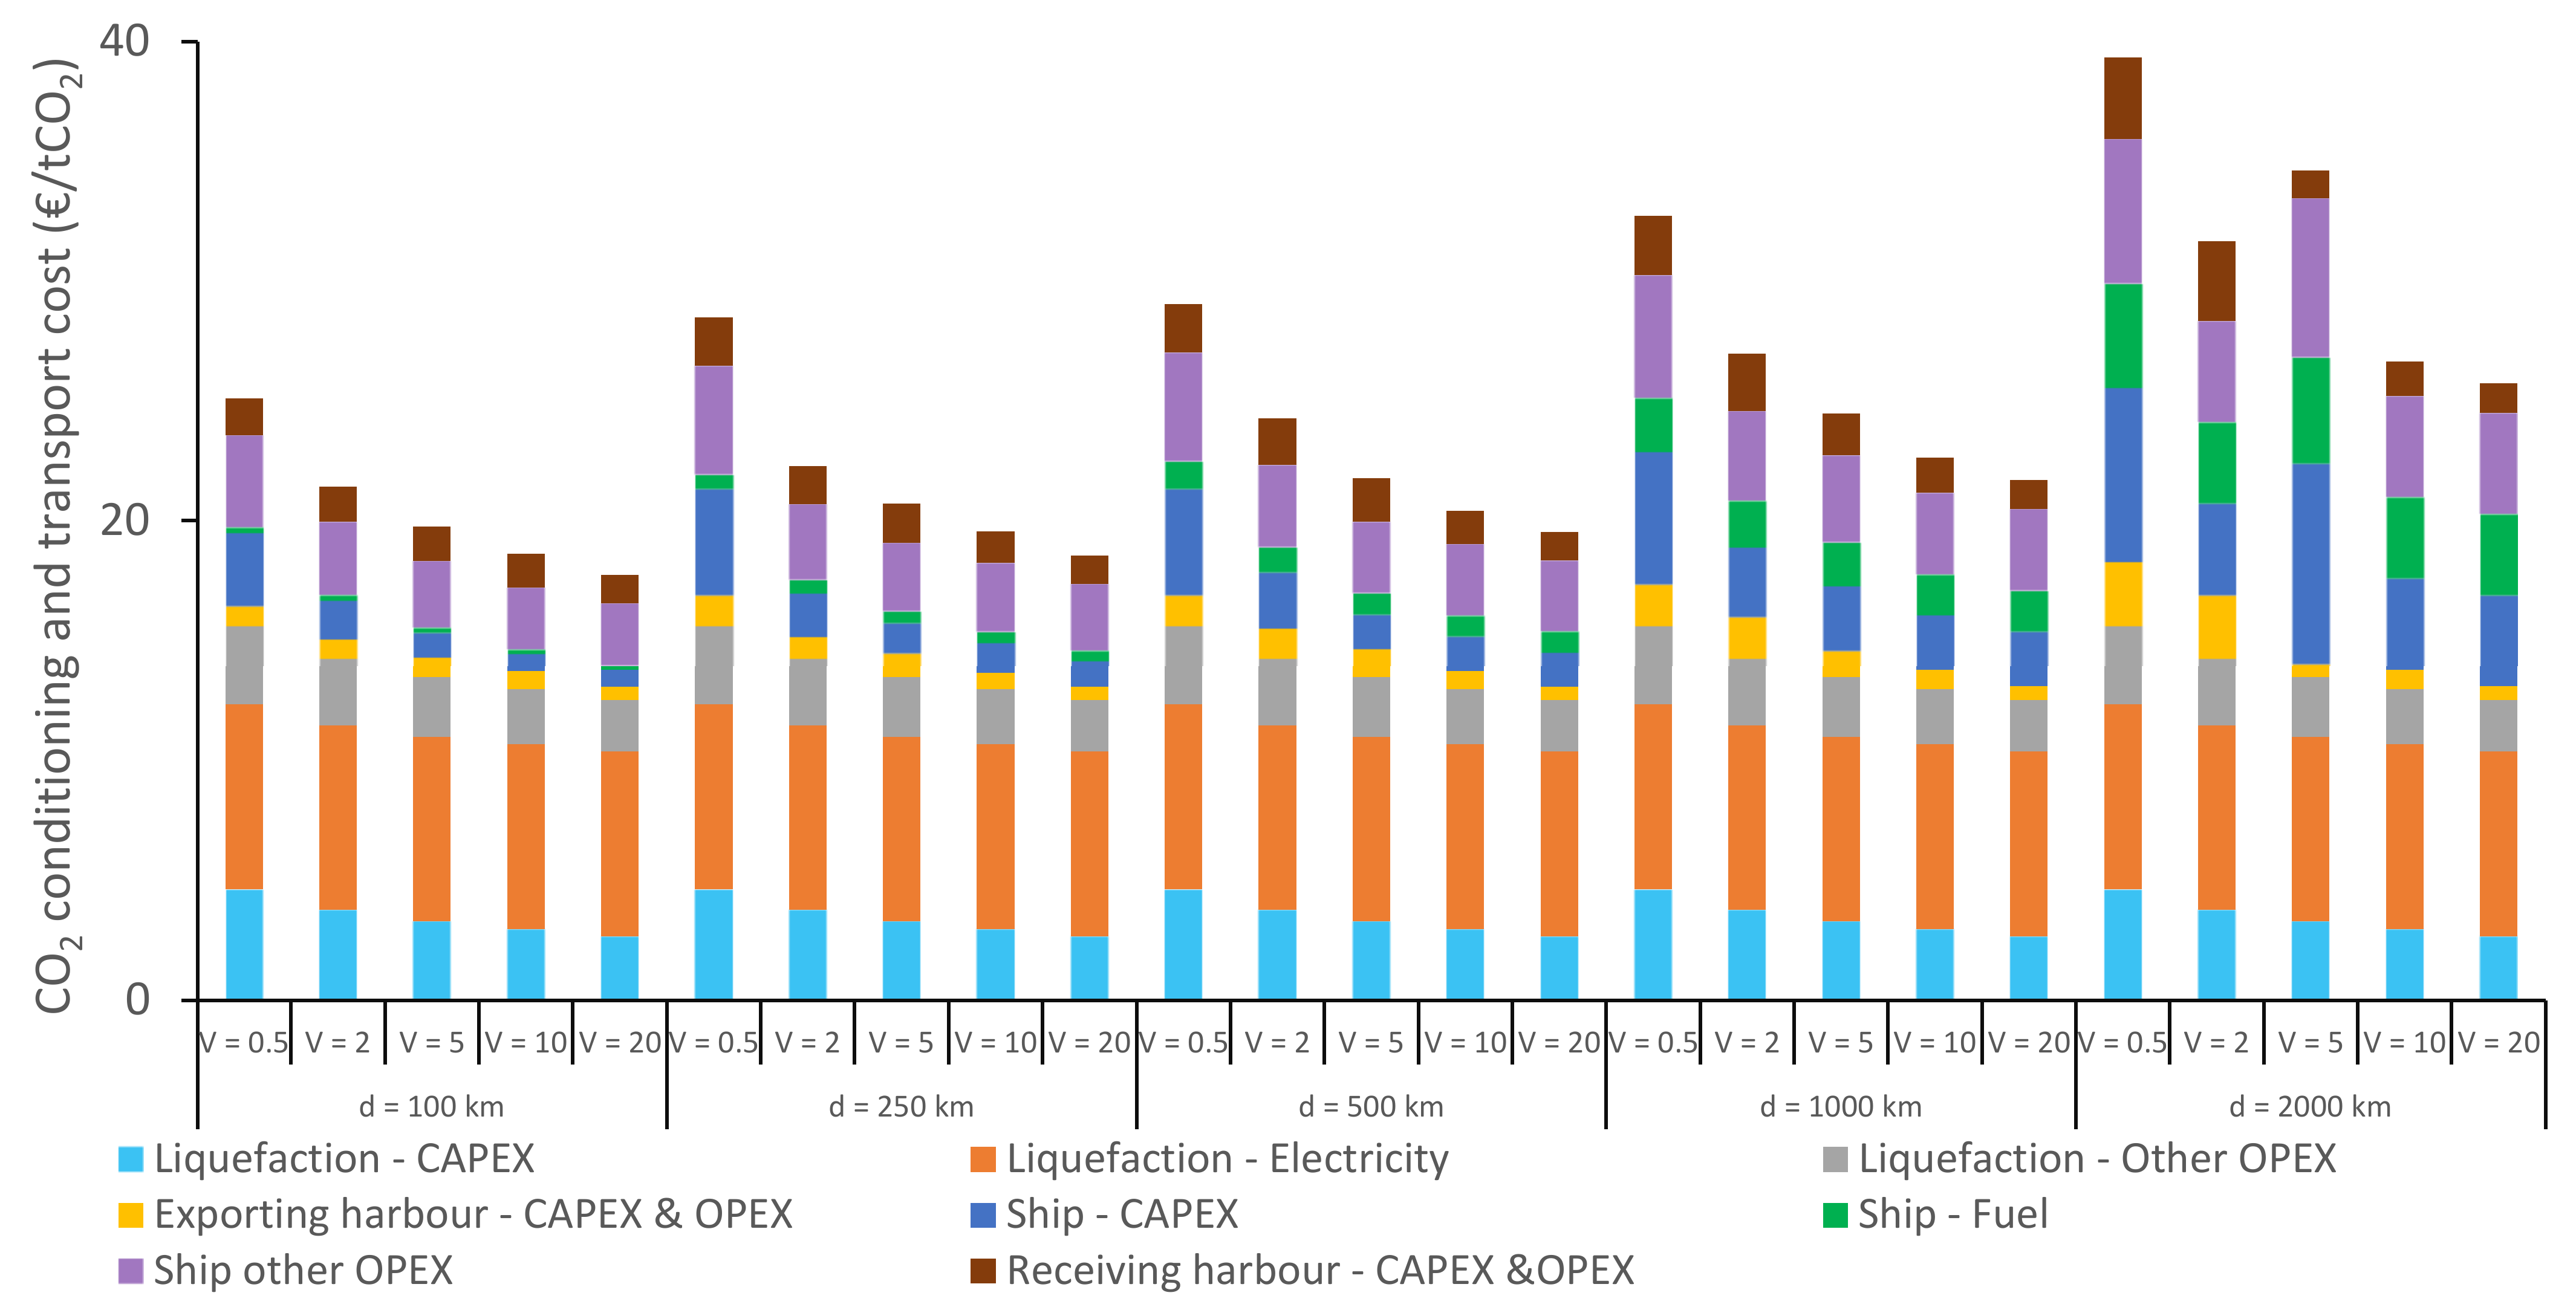
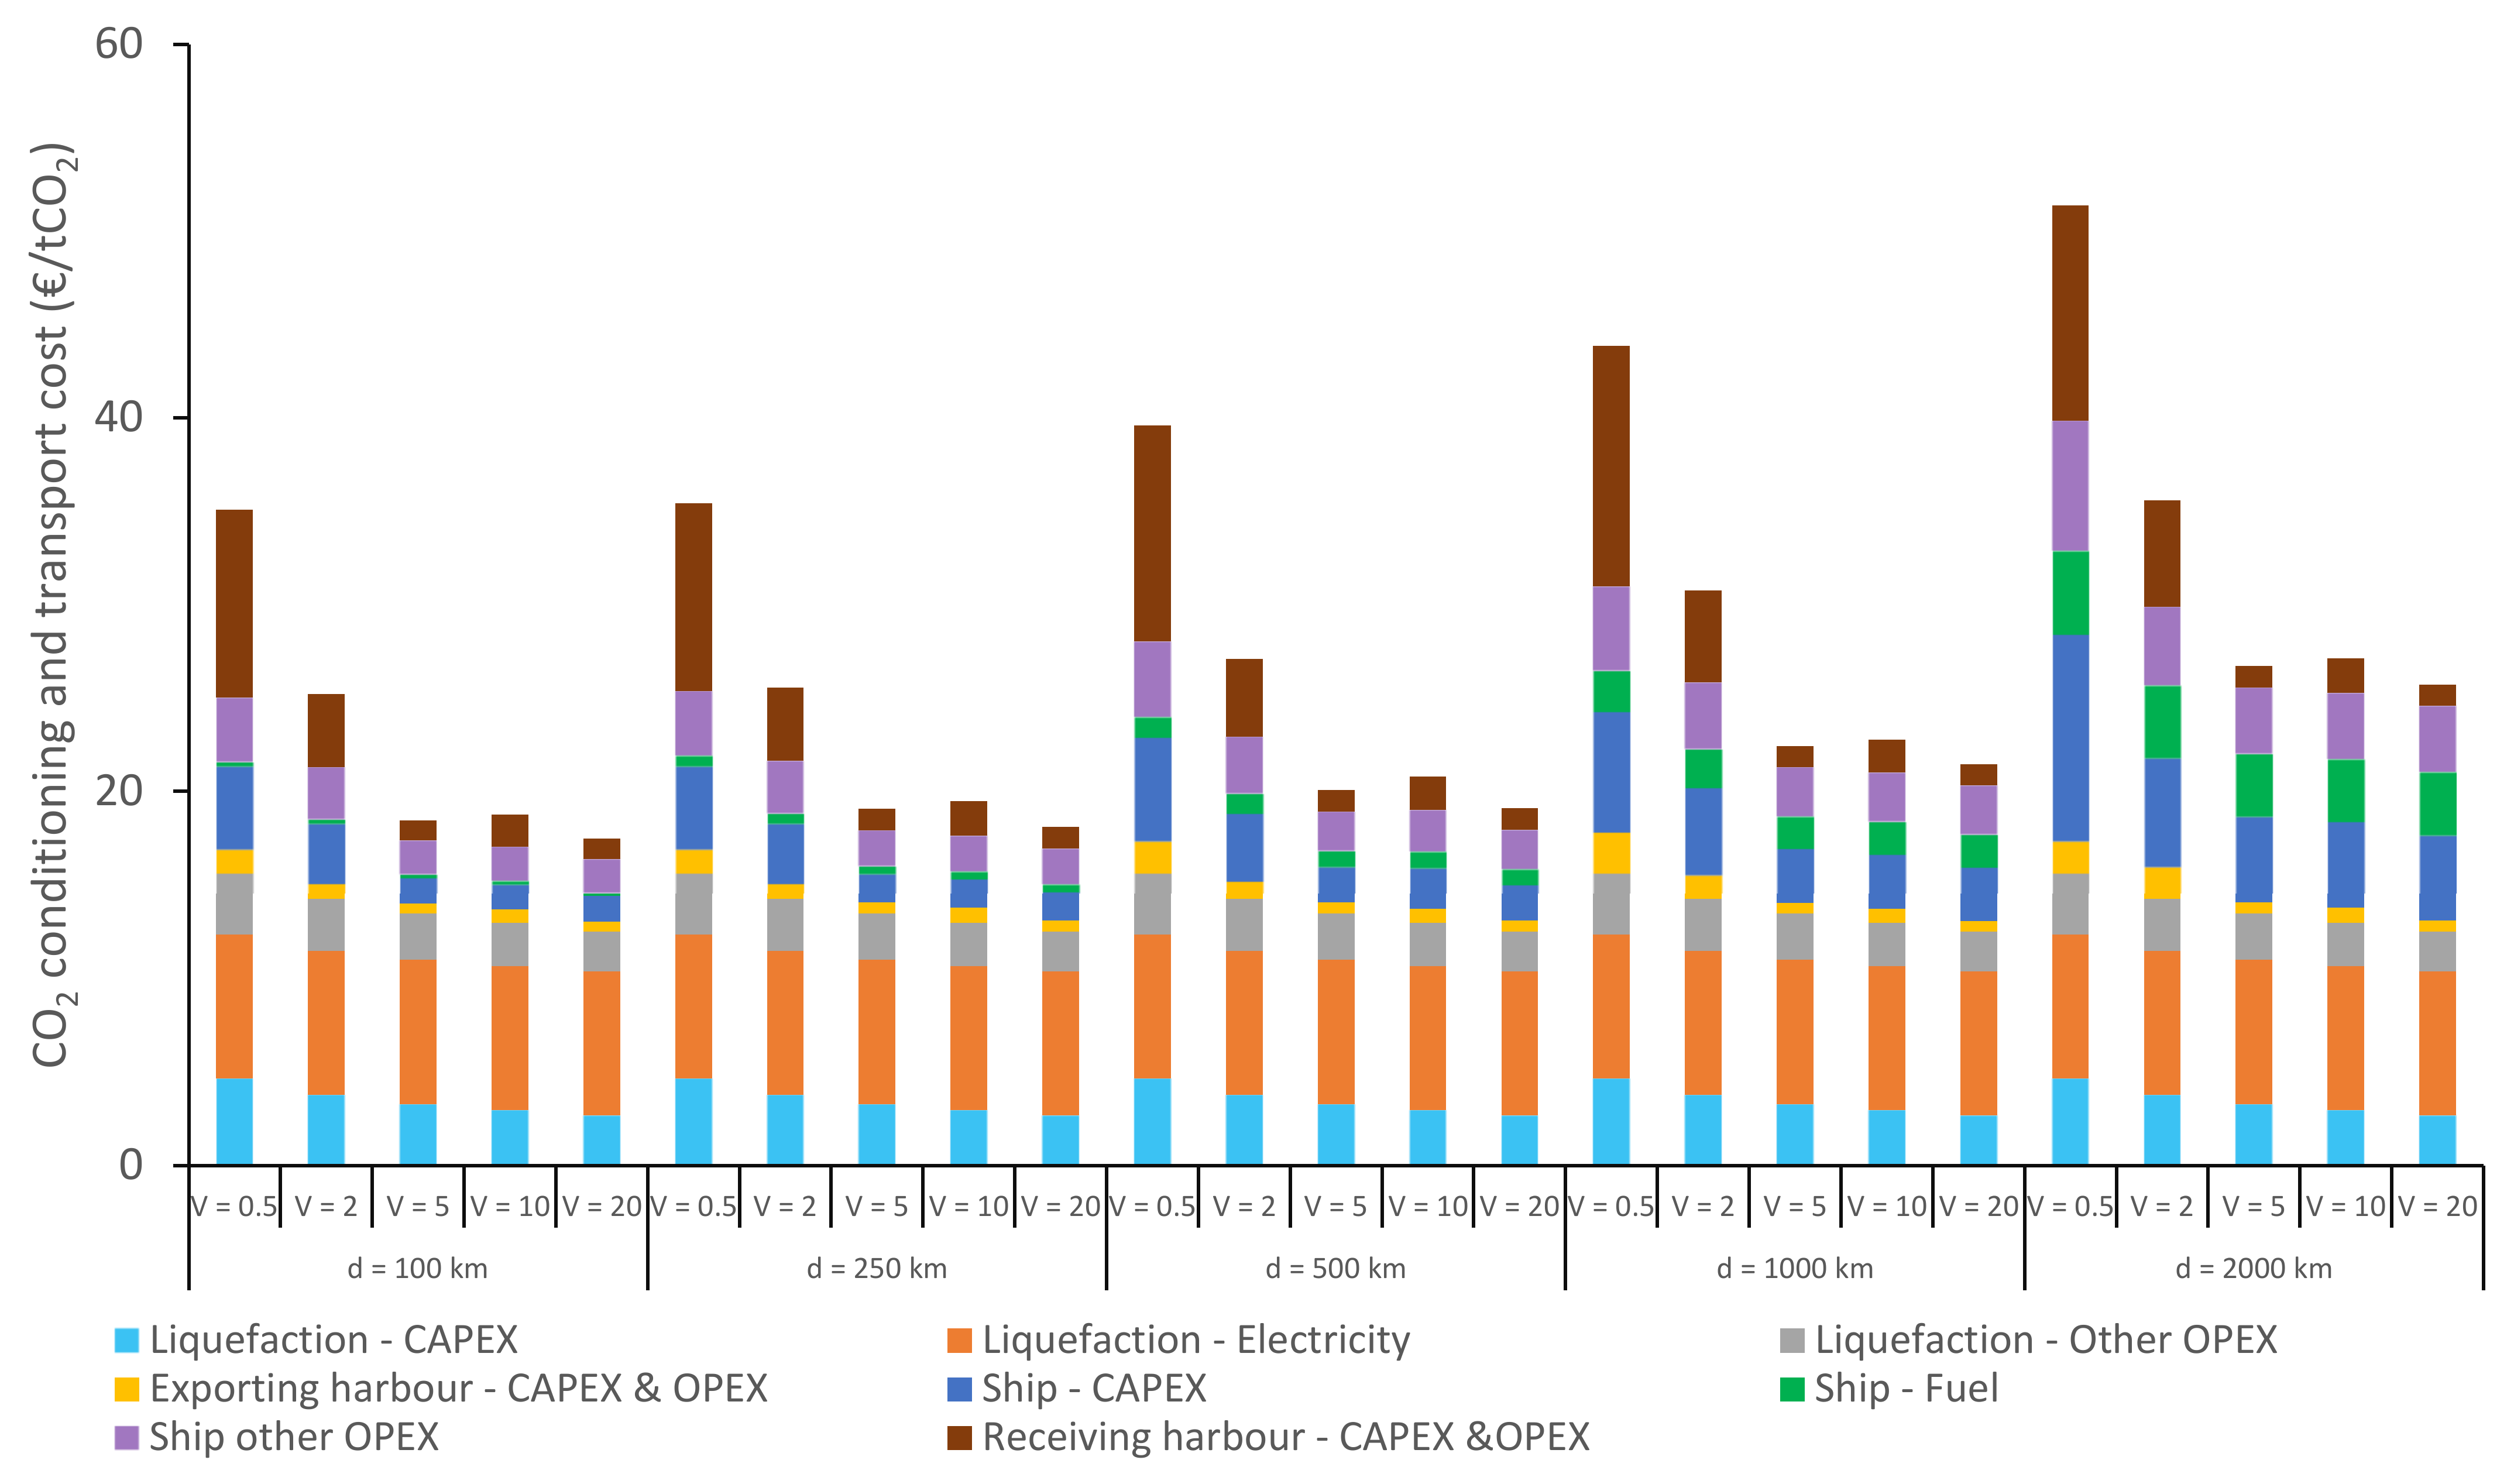
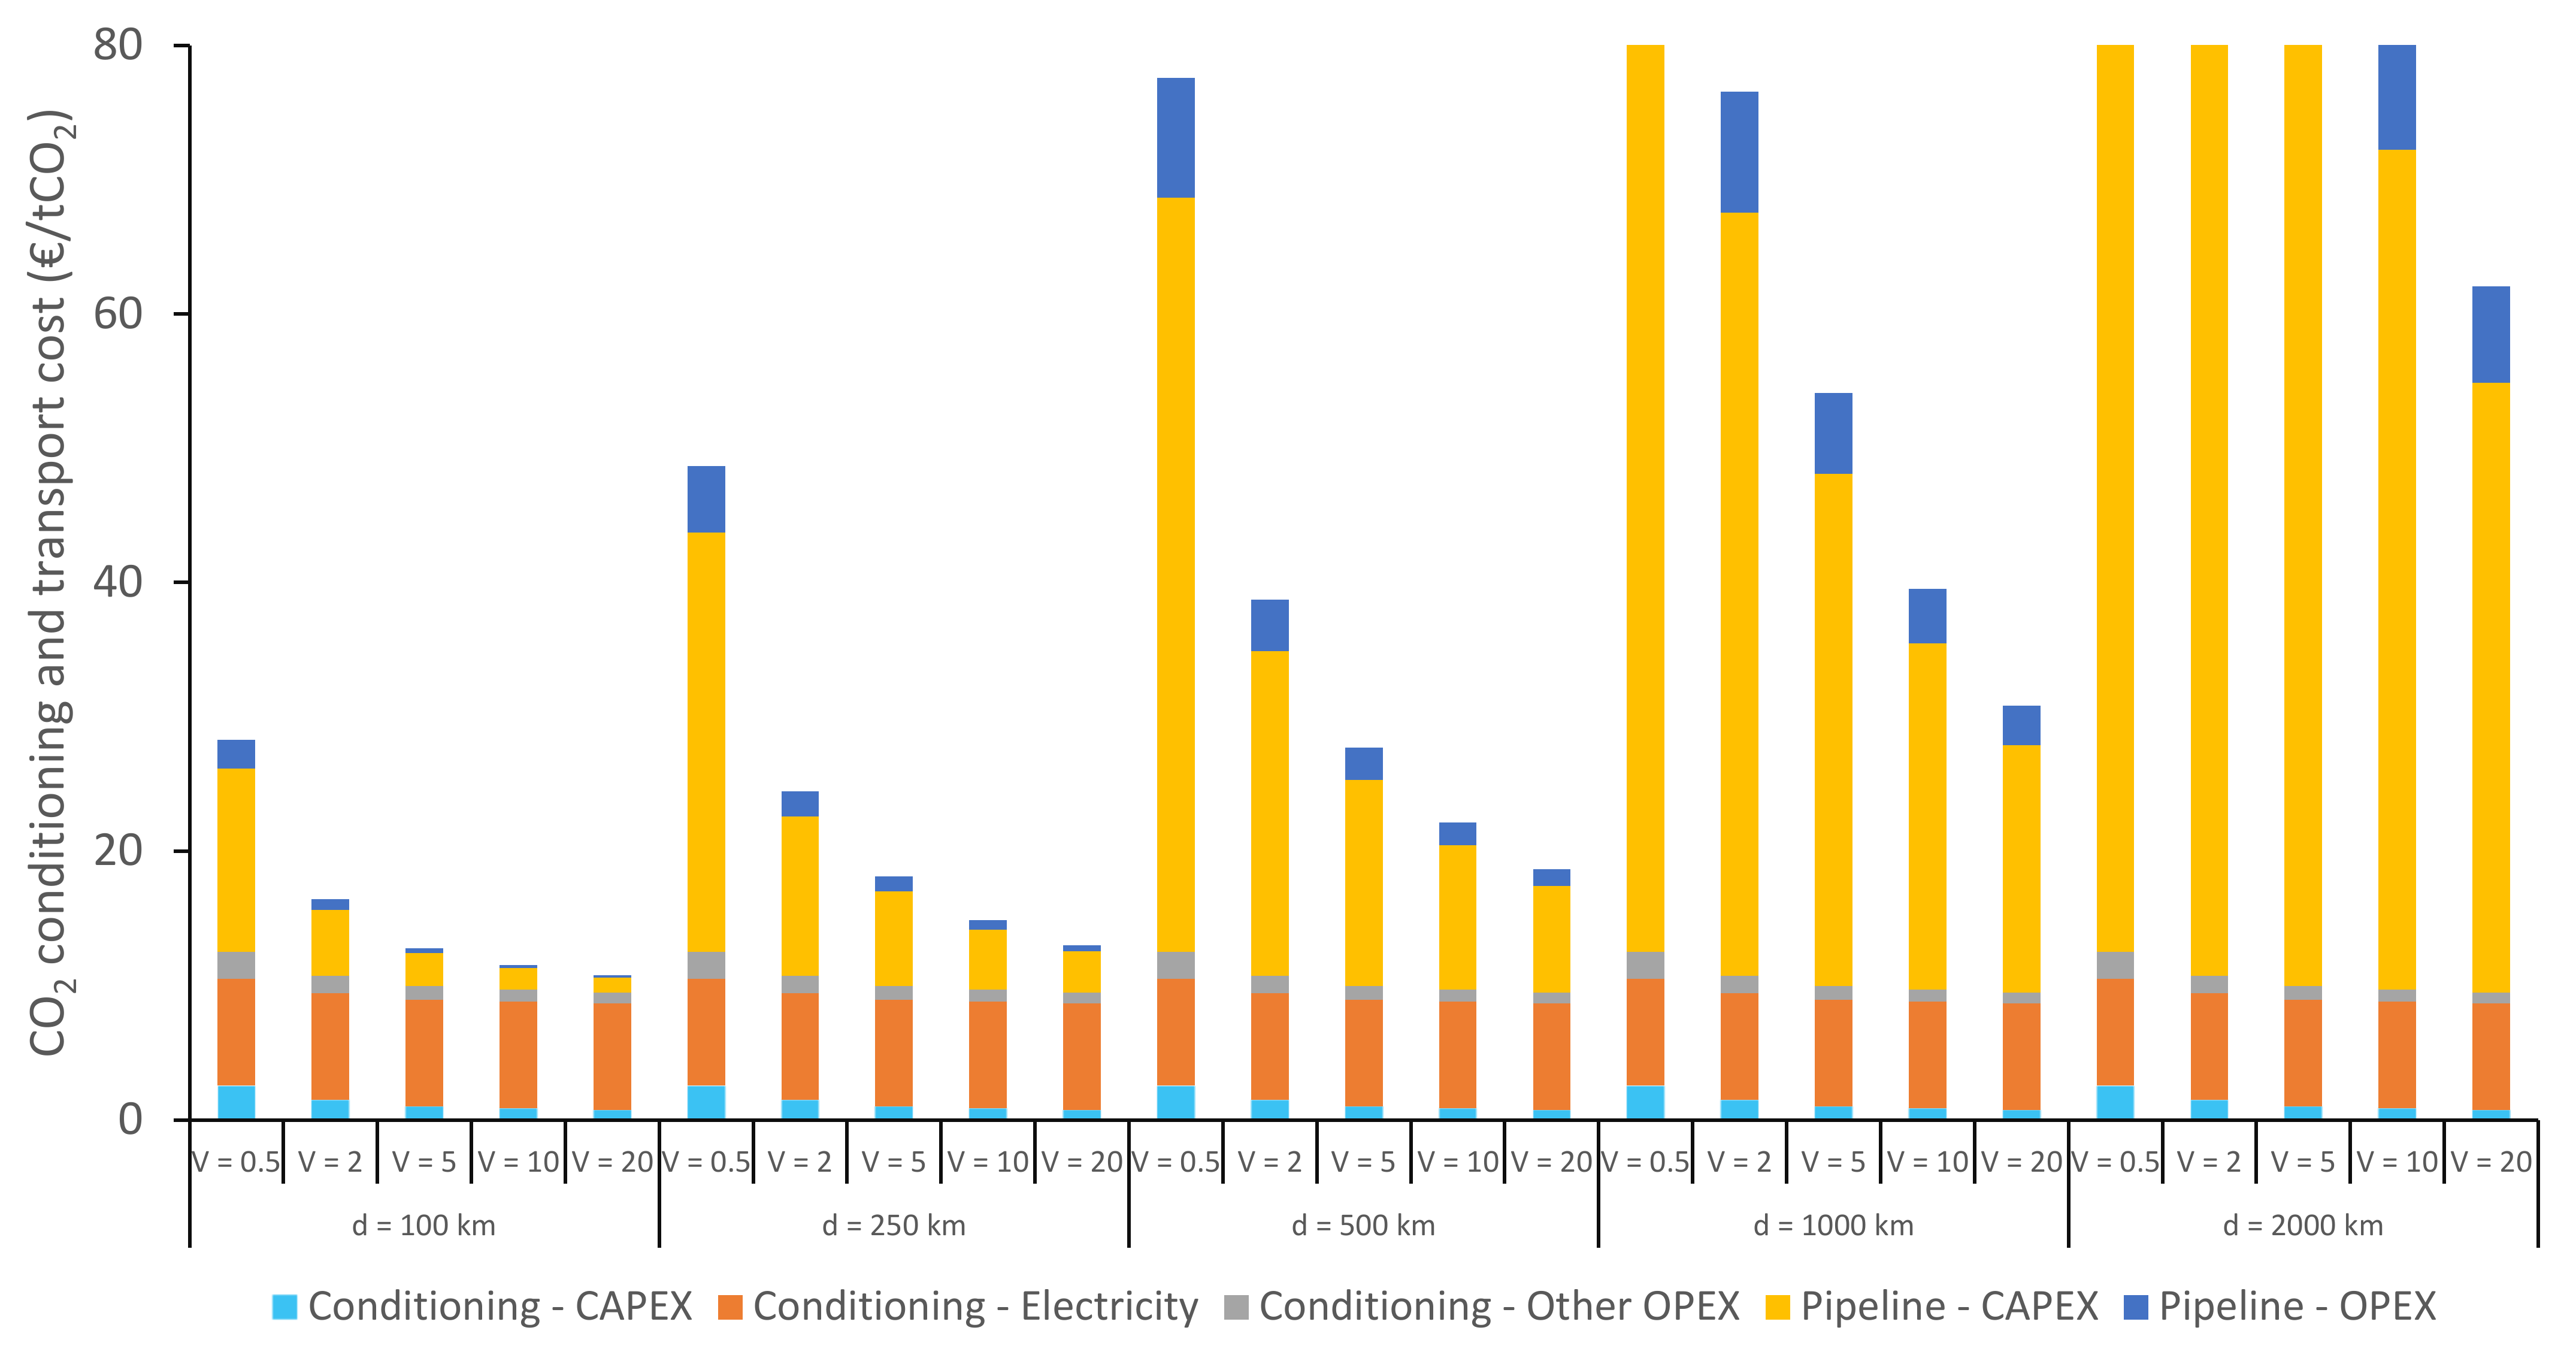
Appendix C.2. CO2 Conditioning and Transport Cost Breakdowns for Transport to an Offshore Site
References
- Energy Technology Perspective; IEA: Paris, France, 2020.
- Mølnvik, M.J.; Aarlien, R.; Henriksen, P.P.; Munkejord, S.T.; Tangen, G.; Jakobsen, J.P. BIGCCS Innovations—Measures to Accelerate CCS Deployment. Energy Procedia 2016, 86, 79–89. [Google Scholar] [CrossRef] [Green Version]
- Gardarsdottir, S.; De Lena, E.; Romano, M.; Roussanaly, S.; Voldsund, M.; Pérez-Calvo, J.-F.; Berstad, D.; Fu, C.; Anantharaman, R.; Sutter, D.; et al. Comparison of technologies for CO2 capture from cement production—Part 2: Cost analysis. Energies 2019, 12, 542. [Google Scholar] [CrossRef] [Green Version]
- Abanades, J.C.; Arias, B.; Lyngfelt, A.; Mattisson, T.; Wiley, D.E.; Li, H.; Ho, M.T.; Mangano, E.; Brandani, S. Emerging CO2 capture systems. Int. J. Greenh. Gas Control 2015, 40, 126–166. [Google Scholar] [CrossRef] [Green Version]
- Roussanaly, S.; Berghout, N.; Fout, T.; Garcia, M.; Gardarsdottir, S.; Nazir, S.M.; Ramirez, A.; Rubin, E.S. Towards improved cost evaluation of Carbon Capture and Storage from industry. Int. J. Greenh. Gas Control 2021, 106, 103263. [Google Scholar] [CrossRef]
- Assessment of Emerging CO2 Capture Technologies and their Potential to Reduce Costs; 2014/TR4; IEAGHG: Cheltenham, UK, 2014.
- Further Assessments of Emerging CO2 Capture Technologies for the Power Sector and their Potential to Reduce Costs; IEAGHG: Cheltenham, UK, 2019.
- Cleanker Project. Clean Clinker by Calcium Looping for Low-CO2 Cement. Available online: http://www.cleanker.eu/the-project/objectives.html (accessed on 1 May 2021).
- Global status of CCS; Global CCS Institute: Docklands, Australia, 2019.
- CO2RE Facilities Database; Global CCS Institute: Docklands, Australia, 15 September 2020.
- Morbee, J.; Serpa, J.; Tzimas, E. Optimised deployment of a European CO2 transport network. Int. J. Greenh. Gas Control 2012, 7, 48–61. [Google Scholar] [CrossRef]
- d’Amore, F.; Romano, M.; Bezzo, F. Optimal design of European supply chains for carbon capture and storage from industrial emission sources including pipeline and ship transport. Int. J. Greenh. Gas Control 2021, 109, 103372. [Google Scholar] [CrossRef]
- Munkejord, S.T.; Hammer, M.; Løvseth, S.W. CO2 transport: Data and models—A review. Appl. Energy 2016, 169, 499–523. [Google Scholar] [CrossRef]
- Koornneef, J.; Spruijt, M.; Molag, M.; Ramírez, A.; Turkenburg, W.; Faaij, A. Quantitative risk assessment of CO2 transport by pipelines—A review of uncertainties and their impacts. J. Hazard. Mater. 2010, 177, 12–27. [Google Scholar] [CrossRef] [PubMed]
- Knoope, M.M.J.; Raben, I.M.E.; Ramírez, A.; Spruijt, M.P.N.; Faaij, A.P.C. The influence of risk mitigation measures on the risks, costs and routing of CO2 pipelines. Int. J. Greenh. Gas Control 2014, 29, 104–124. [Google Scholar] [CrossRef]
- McCoy, S.T.; Rubin, E.S. An engineering-economic model of pipeline transport of CO2 with application to carbon capture and storage. Int. J. Greenh. Gas Control 2008, 2, 219–229. [Google Scholar] [CrossRef]
- Roussanaly, S.; Bureau-Cauchois, G.; Husebye, J. Costs benchmark of CO2 transport technologies for a group of various size industries. Int. J. Greenh. Gas Control 2013, 12, 341–350. [Google Scholar] [CrossRef] [Green Version]
- The Costs of CO2 Transport, Post-Demonstration CCS in the EU; Zero Emission Platform: Brussels, Belgium, 2011.
- Wei, N.; Li, X.; Wang, Q.; Gao, S. Budget-type techno-economic model for onshore CO2 pipeline transportation in China. Int. J. Greenh. Gas Control 2016, 51, 176–192. [Google Scholar] [CrossRef]
- Skaugen, G.; Roussanaly, S.; Jakobsen, J.; Brunsvold, A. Techno-economic evaluation of the effects of impurities on conditioning and transport of CO2 by pipeline. Int. J. Greenh. Gas Control 2016, 54 Pt 2, 627–639. [Google Scholar] [CrossRef] [Green Version]
- Porter, R.T.J.; Mahgerefteh, H.; Brown, S.; Martynov, S.; Collard, A.; Woolley, R.M.; Fairweather, M.; Falle, S.A.E.G.; Wareing, C.J.; Nikolaidis, I.K.; et al. Techno-economic assessment of CO2 quality effect on its storage and transport: CO2QUEST: An overview of aims, objectives and main findings. Int. J. Greenh. Gas Control 2016, 54 Pt 2, 662–681. [Google Scholar] [CrossRef] [Green Version]
- Fimbres Weihs, G.A.; Wiley, D.E. Steady-state design of CO2 pipeline networks for minimal cost per tonne of CO2 avoided. Int. J. Greenh. Gas Control 2012, 8, 150–168. [Google Scholar] [CrossRef]
- Kim, C.; Kim, K.; Kim, J.; Ahmed, U.; Han, C. Practical deployment of pipelines for the CCS network in critical conditions using MINLP modelling and optimization: A case study of South Korea. Int. J. Greenh. Gas Control 2018, 73, 79–94. [Google Scholar] [CrossRef]
- Feasibility Study for Full-Scale CCS in Norway; Ministry of Petroleum and Energy: Oslo, Norway, 2016.
- Al Baroudi, H.; Awoyomi, A.; Patchigolla, K.; Jonnalagadda, K.; Anthony, E.J. A review of large-scale CO2 shipping and marine emissions management for carbon capture, utilisation and storage. Appl. Energy 2021, 287, 116510. [Google Scholar] [CrossRef]
- Alabdulkarem, A.; Hwang, Y.; Radermacher, R. Development of CO2 liquefaction cycles for CO2 sequestration. Appl. Therm. Eng. 2012, 33, 144–156. [Google Scholar] [CrossRef]
- Lee, S.G.; Choi, G.B.; Lee, C.J.; Lee, J.M. Optimal design and operating condition of boil-off CO2 re-liquefaction process, considering seawater temperature variation and compressor discharge temperature limit. Chem. Eng. Res. Des. 2017, 124, 29–45. [Google Scholar] [CrossRef]
- Jeon, S.H.; Kim, M.S. Effects of impurities on re-liquefaction system of liquefied CO2 transport ship for CCS. Int. J. Greenh. Gas Control 2015, 43, 225–232. [Google Scholar] [CrossRef]
- Decarre, S.; Berthiaud, J.; Butin, N.; Guillaume-Combecave, J.-L. CO2 maritime transportation. Int. J. Greenh. Gas Control 2010, 4, 857–864. [Google Scholar] [CrossRef] [Green Version]
- Vermeulen, T.N. Knowledge Sharing Report—CO2 Liquid Logistics Shipping Concept (LLSC): Overall Supply Chain Optimization; 3112001; Tebodin Netherlands, B.V.: The Hague, The Netherlands, 21 June 2011. [Google Scholar]
- Climate Change 2014: Synthesis Report. Contribution of Working Groups I, II and III to the Fifth Assessment Report of the Intergovernmental Panel on Climate Change; IPCC: Geneva, Switzerland, 2014. [Google Scholar]
- Jung, J.-Y.; Huh, C.; Kang, S.-G.; Seo, Y.; Chang, D. CO2 transport strategy and its cost estimation for the offshore CCS in Korea. Appl. Energy 2013, 111, 1054–1060. [Google Scholar] [CrossRef]
- Roussanaly, S.; Jakobsen, J.P.; Hognes, E.H.; Brunsvold, A.L. Benchmarking of CO2 transport technologies: Part I—Onshore pipeline and shipping between two onshore areas. Int. J. Greenh. Gas Control 2013, 19, 584–594. [Google Scholar] [CrossRef] [Green Version]
- Roussanaly, S.; Brunsvold, A.L.; Hognes, E.S. Benchmarking of CO2 transport technologies: Part II—Offshore pipeline and shipping to an offshore site. Int. J. Greenh. Gas Control 2014, 28, 283–299. [Google Scholar] [CrossRef] [Green Version]
- Bjerketvedt, V.S.; Tomasgard, A.; Roussanaly, S. Optimal design and cost of ship-based CO2 transport under uncertainties and fluctuations. Int. J. Greenh. Gas Control 2020, 103, 103190. [Google Scholar] [CrossRef]
- Bjerketvedt, V.; Tomasgaard, A.; Roussanaly, S. Deploying a shipping infrastruture to enable CCS from Norwegian industries. Accept. J. Clean. Prod. 2021. [Google Scholar]
- Kang, K.; Seo, Y.; Chang, D.; Kang, S.-G.; Huh, C. Estimation of CO2 Transport Costs in South Korea Using a Techno-Economic Model. Energies 2015, 8, 2176–2196. [Google Scholar] [CrossRef] [Green Version]
- Feasibility Study for Ship Based Transport of Ethane to Europe and Back Hauling of CO2 to the USA; IEAGHG: Cheltenham, UK, 2017.
- Seo, Y.; Huh, C.; Lee, S.; Chang, D. Comparison of CO2 liquefaction pressures for ship-based carbon capture and storage (CCS) chain. Int. J. Greenh. Gas Control 2016, 52, 1–12. [Google Scholar] [CrossRef]
- Shipping CO2—UK Cost Estimation Study; Element Energy Limited: Cambridge, UK, 2018.
- Northern Lights Contribution to Benefit Realisation; Equinor: Trondheim, Norway, 2019.
- Longship—Carbon Capture and Storage; Norwegian Ministry of Petroleum and Energy: Oslo, Norway, 2020.
- Brunsvold, A.; Jakobsen, J.P.; Mazzetti, M.J.; Skaugen, G.; Hammer, M.; Eickhoff, C.; Neele, F. Key findings and recommendations from the IMPACTS project. Int. J. Greenh. Gas Control 2016, 54 Pt 2, 588–598. [Google Scholar] [CrossRef]
- Voldsund, M.; Gardarsdottir, S.; De Lena, E.; Pérez-Calvo, J.-F.; Jamali, A.; Berstad, D.; Fu, C.; Romano, M.; Roussanaly, S.; Anantharaman, R.; et al. Comparison of technologies for CO2 capture from cement production—Part 1: Technical evaluation. Energies 2019, 12, 559. [Google Scholar] [CrossRef] [Green Version]
- Roussanaly, S.; Anantharaman, R. Cost-optimal CO2 capture ratio for membrane-based capture from different CO2 sources. Chem. Eng. J. 2017, 327, 618–628. [Google Scholar] [CrossRef] [Green Version]
- Roussanaly, S.; Vitvarova, M.; Anantharaman, R.; Berstad, D.; Hagen, B.; Jakobsen, J.; Novotny, V.; Skaugen, G. Techno-economic comparison of three technologies for pre-combustion CO2 capture from a lignite-fired IGCC. Front. Chem. Sci. Eng. 2020, 14, 436–452. [Google Scholar] [CrossRef]
- Deng, H.; Roussanaly, S.; Skaugen, G. Techno-economic analyses of CO2 liquefaction: Impact of product pressure and impurities. Int. J. Refrig. 2019, 103, 301–315. [Google Scholar] [CrossRef]
- Jakobsen, J.; Roussanaly, S.; Anantharaman, R. A techno-economic case study of CO2 capture, transport and storage chain from a cement plant in Norway. J. Clean. Prod. 2017, 144, 523–539. [Google Scholar] [CrossRef] [Green Version]
- Aspelund, A.; Gundersen, T. A liquefied energy chain for transport and utilization of natural gas for power production with CO2 capture and storage—Part 1. Appl. Energy 2009, 86, 781–792. [Google Scholar] [CrossRef]
- Aspelund, A.; Tveit, S.P.; Gundersen, T. A liquefied energy chain for transport and utilization of natural gas for power production with CO2 capture and storage—Part 3: The combined carrier and onshore storage. Appl. Energy 2009, 86, 805–814. [Google Scholar] [CrossRef]
- XE Currency Data Feed. US Dollar/Euro: Monthly Exchange Rate. Available online: http://www.x-rates.com/average (accessed on 1 August 2020).
- Trading Economics. Database on Euro Area Inflation Rate. Available online: https://tradingeconomics.com/euro-area/inflation-cpi (accessed on 1 August 2020).
- DACE Price Booklet, Edition 34: Cost Information for Estmation and Comparison; Dutch Association of Cost Engineers: Amsterdam, The Netherlands, 2020.
- Understanding the Cost of Retrofitting CO2 Capture in an Integrated Oil Refineries; IEAGHG: Cheltenham, UK, 2017.
- Chauvel, A.; Fournier, G.; Raimbault, C. Manual of Process Economic Evaluation; Editions Technip: Courbevie, France, 2003. [Google Scholar]
- Rao, A.B.; Rubin, E.S. A Technical, Economic, and Environmental Assessment of Amine-Based CO2 Capture Technology for Power Plant Greenhouse Gas Control. Environ. Sci. Technol. 2002, 36, 4467–4475. [Google Scholar] [CrossRef] [PubMed] [Green Version]
- Apeland, S.; Belfroid, S.; Santen, S.; Hustad, C.W.; Tettero, M.; Klein, K. CO2 Europipe D4.3.1: Towards a Transport Infrastructure for Large-Scale CCS in Europe. Kårstø Offshore CO2 Pipeline Design. 2011. Available online: http://www.co2europipe.eu/Publications/D4.3.1%20-%20Karsto%20offshore%20CO2%20pipeline%20design.pdf.
- Bunker Ports News Worldwide. Bunker Prices Worldwide. Available online: http://www.bunkerportsnews.com (accessed on 1 August 2017).
- van der Spek, M.; Fout, T.; Garcia, M.; Kuncheekanna, V.N.; Matuszewski, M.; McCoy, S.; Morgan, J.; Nazir, S.M.; Ramirez, A.; Roussanaly, S.; et al. Uncertainty analysis in the techno-economic assessment of CO2 capture and storage technologies. Critical review and guidelines for use. Int. J. Greenh. Gas Control 2020, 100, 103113. [Google Scholar] [CrossRef]
- Knoope, M.M.J.; Ramírez, A.; Faaij, A.P.C. A state-of-the-art review of techno-economic models predicting the costs of CO2 pipeline transport. Int. J. Greenh. Gas Control 2013, 16, 241–270. [Google Scholar] [CrossRef]
- Mikunda, T.; van Deurzen, J.; Seebregts, A.; Kerssemakers, K.; Tetteroo, M.; Buit, L. Towards a CO2 infrastructure in North-Western Europe: Legalities, costs and organizational aspects. Energy Procedia 2011, 4, 2409–2416. [Google Scholar] [CrossRef] [Green Version]




| Impurity Scenario | Impurity 1 [44] | Impurity 2 [45] | Impurity 3 [46] |
|---|---|---|---|
| Capture route | Post-combustion | Post-combustion | Pre-combustion |
| Capture technology | Amine | Membrane | Rectisol |
| CO2 source | Cement plant | Refinery | IGCC a |
| CO2 (%) | 96.86 | 97.0 | 98.42 |
| H2O (%) | 3.00 | 1.0 | |
| N2 (%) | 0.11 | 2.0 | 0.44 |
| O2 (%) | 0.03 | ||
| Ar (%) | 0.0003 | 0.09 | |
| MeOH (%) | 0.57 | ||
| H2 (%) | 0.45 | ||
| CO (%) | 0.03 | ||
| H2S (%) | 0.0005 | ||
| Total (%) | 100 | 100 | 100 |
| Scenario | Shipping Chain | CO2 Conditions after Capture | Purity Requirement after Liquefaction | Ship CAPEX Scenario | Maximum Ship Capacity (ktCO2) | |||||
|---|---|---|---|---|---|---|---|---|---|---|
| Number | Name | Purity Scenario after Capture | Pressure (bara) | Temperature (°C) | 7 Barg | 15 Barg | 7 Barg | 15 Barg | ||
| 1 | Base case 1 | Between harbours | Pure CO2 | 1 | 40 | None | - | - | 50 | 10 |
| 2 | Base case 2 | To an offshore site | Pure CO2 | 1 | 40 | None | - | - | 50 | 10 |
| 3 | Inland emitter 1 | Between harbours | Pure CO2 | 90 | 40 | None | - | - | 50 | 10 |
| 4 | Inland emitter 2 | To an offshore site | Pure CO2 | 90 | 40 | None | - | - | 50 | 10 |
| 5 | Impurity 1 | Between harbours | Post-combustion amine | 1 | 40 | None | - | - | 50 | 10 |
| 6 | Impurity 2 | Between harbours | Post-combustion membrane | 1 | 40 | None | - | - | 50 | 10 |
| 7 | Impurity 3 | Between harbours | Pre-combustion Rectisol | 1 | 40 | None | - | - | 50 | 10 |
| 8 | Purity 1 | Between harbours | Post-combustion membrane | 1 | 40 | ≥99% | - | - | 50 | 10 |
| 9 | Purity 2 | Between harbours | Post-combustion membrane | 1 | 40 | ≥99.9% | - | - | 50 | 10 |
| 10 | Ship CAPEX 1 | Between harbours | Pure CO2 | 1 | 40 | None | +10% | −10% | 50 | 10 |
| 11 | Ship CAPEX 2 | Between harbours | Pure CO2 | 1 | 40 | None | +20% | −20% | 50 | 10 |
| 12 | Ship capacity 1 | Between harbours | Pure CO2 | 1 | 40 | None | - | - | 100 | 10 |
| 13 | Ship capacity 2 | Between harbours | Pure CO2 | 1 | 40 | None | - | - | 50 | 50 |
| 14 | Ship capacity 3 | Between harbours | Pure CO2 | 1 | 40 | None | - | - | 100 | 100 |
| CO2 Purity Scenario | Targeted Transport Pressure | CO2 Condition after Liquefaction | Specific Energy Consumption | CO2 Liquefaction Cost | ||||||
|---|---|---|---|---|---|---|---|---|---|---|
| Purity | Recovery Rate a | Density | CAPEX | Fixed OPEX | Variable OPEX b | Impurity Removal | Total | |||
| Barg | % | % | kg/m3 | kWh/tCO2 | €/tCO2 | €/tCO2 | €/tCO2 | €/tCO2 | €/tCO2 | |
| Pure CO2 (base case) | 7 | 100 | 100 | 1150 | 96.3 | 4.2 | 2.5 | 8.3 | - | 14.9 |
| 15 | 100 | 100 | 1060 | 90.4 | 4.0 | 2.3 | 7.8 | - | 14.0 | |
| Inland emitter scenarios | 7 | 100 | 100 | 1150 | 17.4 | 1.5 | 0.9 | 1.6 | - | 4.0 |
| 15 | 100 | 100 | 1060 | 9 | 1.3 | 0.8 | 0.9 | - | 3.0 | |
| Scenario impurity 1 | 7 | 99.92 | 97.9 | 1189 | 103.4 | 4.6 | 2.7 | 8.9 | 0.3 | 16.5 |
| 15 | 99.85 | 98.4 | 1094 | 94.6 | 4.3 | 2.5 | 8.1 | 0.0 | 14.9 | |
| Scenario impurity 2 | 7 | 99.74 | 96.1 | 1204 | 121.8 | 4.9 | 2.9 | 10.3 | 1.7 | 19.7 |
| 15 | 99.00 | 97.4 | 1143 | 112.4 | 4.9 | 2.9 | 9.5 | 1.1 | 18.3 | |
| Scenario impurity 3 | 7 | 99.30 | 97.4 | 1158 | 112.6 | 4.6 | 2.7 | 9.6 | 1.3 | 18.1 |
| 15 | 99.00 | 98.0 | 1093 | 105.0 | 4.5 | 2.7 | 9.0 | 1.0 | 17.2 | |
| Scenario purity 1 | 7 | 99.74 | 96.1 | 1204 | 121.8 | 4.9 | 2.9 | 10.3 | 1.7 | 19.7 |
| 15 | 99.00 | 97.4 | 1143 | 112.4 | 4.9 | 2.9 | 9.5 | 1.1 | 18.3 | |
| Scenario purity 2 | 7 | 99.93 | 99.6 | 1190 | 103.7 | 4.8 | 2.8 | 8.8 | 6.4 | 22.8 |
| 15 | 99.91 | 99.6 | 1091 | 93.7 | 4.5 | 2.6 | 8.0 | 6.3 | 21.4 | |
| Ship Capacity a | CAPEX b,c | Fixed OPEX d | Specific Fuel Consumption | ||
|---|---|---|---|---|---|
| 7 Barg | 15 Barg | 7 Barg | 15 Barg | ||
| ktCO2/Ship | M€/Ship | M€/Ship | M€/Ship/year | M€/Ship/year | gfuel/tCO2/km |
| 2.5 | 16.2 | 35.4 | 0.81 | 1.77 | 7.07 |
| 5 | 23.5 | 50 | 1.18 | 2.5 | 6.97 |
| 7.5 | 29.2 | 61.2 | 1.46 | 3.06 | 6.87 |
| 10 | 34.1 | 70.6 | 1.71 | 3.53 | 6.77 |
| 12.5 | 38.4 | 78.9 | 1.92 | 3.95 | 6.67 |
| 15 | 42.4 | 86.4 | 2.12 | 4.32 | 6.58 |
| 20 | 49.4 | 99.7 | 2.47 | 4.99 | 6.38 |
| 25 | 55.7 | 111.5 | 2.79 | 5.58 | 6.18 |
| 30 | 61.5 | 122.1 | 3.08 | 6.11 | 5.98 |
| 35 | 66.8 | 131.8 | 3.34 | 6.59 | 5.78 |
| 40 | 71.7 | 140.9 | 3.59 | 7.05 | 5.59 |
| 45 | 76.4 | 149.4 | 3.82 | 7.47 | 5.39 |
| 50 | 80.9 | 157.5 | 4.05 | 7.88 | 5.19 |
| 60 | 89.2 | 172.4 | 4.46 | 8.62 | 4.79 |
| 70 | 96.9 | 186.2 | 4.85 | 9.31 | 4.40 |
| 80 | 104.1 | 199 | 5.21 | 9.95 | 4.00 |
| 90 | 110.9 | 211 | 5.55 | 10.6 | 3.61 |
| 100 | 117.3 | 222.4 | 5.87 | 11.1 | 3.21 |
Publisher’s Note: MDPI stays neutral with regard to jurisdictional claims in published maps and institutional affiliations. |
© 2021 by the authors. Licensee MDPI, Basel, Switzerland. This article is an open access article distributed under the terms and conditions of the Creative Commons Attribution (CC BY) license (https://creativecommons.org/licenses/by/4.0/).
Share and Cite
Roussanaly, S.; Deng, H.; Skaugen, G.; Gundersen, T. At what Pressure Shall CO2 Be Transported by Ship? An in-Depth Cost Comparison of 7 and 15 Barg Shipping. Energies 2021, 14, 5635. https://doi.org/10.3390/en14185635
Roussanaly S, Deng H, Skaugen G, Gundersen T. At what Pressure Shall CO2 Be Transported by Ship? An in-Depth Cost Comparison of 7 and 15 Barg Shipping. Energies. 2021; 14(18):5635. https://doi.org/10.3390/en14185635
Chicago/Turabian StyleRoussanaly, Simon, Han Deng, Geir Skaugen, and Truls Gundersen. 2021. "At what Pressure Shall CO2 Be Transported by Ship? An in-Depth Cost Comparison of 7 and 15 Barg Shipping" Energies 14, no. 18: 5635. https://doi.org/10.3390/en14185635
APA StyleRoussanaly, S., Deng, H., Skaugen, G., & Gundersen, T. (2021). At what Pressure Shall CO2 Be Transported by Ship? An in-Depth Cost Comparison of 7 and 15 Barg Shipping. Energies, 14(18), 5635. https://doi.org/10.3390/en14185635


