Article

Combining Optical Microscopy and X-ray Computed Tomography Reveals Novel Morphologies and Growth Processes of Methane Hydrate in Sand Pores

1
Laboratoire Navier, École des Ponts ParisTech, F-77455 Marne-la-Vallée, France
2
Institut des Sciences Analytiques et de Physicochimie pour l’Environnement et les Matériaux (IPREM), Université de Pau et des Pays de l’Adour, F-64000 Pau, France
3
Laboratoire des Fluides Complexes et leurs Réservoirs (LFCR), Université de Pau et des Pays de l’Adour, F-64000 Pau, France
4
Synchrotron SOLEIL, F-91190 Saint-Aubin, France
*
Author to whom correspondence should be addressed.
Energies 2021, 14(18), 5672; https://doi.org/10.3390/en14185672
Submission received: 9 July 2021 / Revised: 3 September 2021 / Accepted: 3 September 2021 / Published: 9 September 2021

Abstract

:
Understanding the mechanisms involved in the formation and growth of methane hydrate in marine sandy sediments is crucial for investigating the thermo-hydro-mechanical behavior of gas hydrate marine sediments. In this study, high-resolution optical microscopy and synchrotron X-ray computed tomography were used together to observe methane hydrate growing under excess gas conditions in a coarse sandy sediment. The high spatial and complementary temporal resolutions of these techniques allow growth processes and accompanying redistribution of water or brine to be observed over spatial scales down to the micrometre—i.e., well below pore size—and temporal scales below 1 s. Gas hydrate morphological and growth features that cannot be identified by X-ray computed tomography alone, such as hollow filaments, were revealed. These filaments sprouted from hydrate crusts at water–gas interfaces as water was being transported from their interior to their tips in the gas (methane), which extend in the µm/s range. Haines jumps are visualized when the growing hydrate crust hits a water pool, such as capillary bridges between grains or liquid droplets sitting on the substrate—a capillary-driven mechanism that has some analogy with cryogenic suction in water-bearing freezing soils. These features cannot be accounted for by the hydrate pore habit models proposed about two decades ago, which, in the absence of any observation at pore scale, were indeed useful for constructing mechanical and petrophysical models of gas hydrate-bearing sediments.

Graphical Abstract

1. Introduction

Marine sediments bearing methane hydrate (MH), a clathrate of methane gas in an ice-like aqueous matrix, have long been considered as an alternative source of energy as well as a source of potential geo-hazards [1]. On a core scale, the hydrate displaces particles in fine sediments, to form hydrate nodules, or chunks, whereas lenses and veins occur in both fine- and coarse-grained sediments when the hydrate preferentially displaces grains normal to the local minimum stress [2,3,4]. On a smaller scale, pore filling with interspersed hydrate and sediment particles of comparable size, has been observed in deep, coarse sediments. The majority of marine methane hydrate is in dispersed form in fine sediments at low overall occupation, but for practical reasons the potential target of gas exploration is hydrate at high occupation in coarse sandy sediments [1,5]. Physical and mechanical properties of such sediments are often accounted for by assuming some model distributions of the hydrate within the pore space, referred as the hydrate pore habit, which is thus important for interpreting geophysical data and reservoir-scale simulations of methane production [6,7,8,9,10,11,12,13,14,15]. Even though it is helpful to build geophysical and reservoir models, this categorization of hydrate distribution within the pore space lacks direct experimental confirmation. The very scarce high-resolution imaging studies by means of synchrotron X-ray computed tomography (XRCT) in fact point to more complex features of gas hydrate formation and growth in sediment pores [16,17,18,19,20,21].
Owing to the difficulties of recovering and examining natural samples, and excepting the coarsest sediments, direct observational data on a pore scale mostly stem from samples prepared by two routes in the laboratory. The excess gas method mostly yields hydrate at sediment surfaces and grain contacts [22,23,24], while Priest et al. [25] obtained load-bearing hydrate by using the excess water method. XRCT and synchrotron XRCT are being widely used to investigate the microstructure of gas hydrate-bearing sediments [16,17,18,19,20,21,26,27,28,29,30]. Poor contrast between water and the hydrate, and limited temporal resolution, hamper identification of gas hydrate morphologies and growth modes within pores. Noise and partial volume effects influence significantly the attribution of phases and pore habits by image segmentation. The contrast between phases can be improved by use of electron-rich guest species (carbon dioxide, xenon), whose hydrates form at lower pressures than that of methane, or brines (sodium or barium chloride, potassium iodide) [16,17,31]. There is in addition no evidence that the hydrate formation from those latter gases, and their distribution in sediments, are similar to those of methane hydrate. A further difficulty in interpretation was recently addressed by Chen et al. [20]: the hydrate phase is itself porous when grown under excess gas conditions, with pockets of gas and brine slowly annealing over time (hours) and rejecting the ions into the surrounding brine. This porosity and annealing have long been observed by high resolution confocal microscopy and Raman spectroscopy [32]. Ta et al. [31] also pointed out that the hydrate phase (carbon dioxide) that grows in excess gas conditions exhibits a significant volume expansion, indicating a porous structure. Takeya et al. [28] showed that it is possible to distinguish methane hydrate and ice by mean of X-ray interferometric imaging, but this method has a limited dynamic range.
Up to now, macrophotography and optical microscopy have been mainly used to observe gas hydrates growing at simple interfaces, like those of water drops on a flat substrate under the guest phase or guest-containing phase (e.g., a guest-saturated organic solvent [33,34,35,36,37,38,39,40]), or around a meniscus between the phases in capillaries or larger vessels [41,42,43,44,45]. As a rule, the hydrate forms a crust over the interface between the aqueous and the guest (or guest-containing) phase, often nucleated at the contact line with the substrate or sample cell [46,47]. Hydrate morphology strongly depends on supercooling, which creates a difference between the temperature of the gas–water–hydrate equilibrium (at the pressure of the experiment) and that of the experiment [34,35]. For example, hair-like crystals of carbon dioxide or methane hydrate grow from this crust into the guest phase, at high supercooling [33], but faceted crystals or thick columns of polyhedral crystals of carbon dioxide or methane hydrate at lower supercooling [48,49]. The presence of additives and substrate wettability also play a role in hydrate growth [38,39,40]. The most complex configurations observed so far by optical microscopy are those obtained in etched two-dimensional silica glass or silicon wafer micromodels [50,51,52] or by using lab-on-a-chip technology [53,54,55].
XRCT offers the opportunity to see through opaque sediment particles to obtain a three-dimensional map of gas hydrates, but at the cost of low temporal resolution (minutes), which handicaps the study of fast-evolving interfaces. In a study recently published by some of the authors [21], methane hydrate formation under excess gas and water conditions in pores of a sandy sediment was characterized by synchrotron XRCT, but interpretation of some important features was rendered difficult by the low temporal resolution. The methane hydrate protuberances observed near the water–gas interfaces or grain surfaces could hardly be identified, probably because of the large scan duration (about 15 min); their shapes were loosely qualified as needle-shaped crystals or “filaments”, or as nodular crystals/filaments. Evidence for water motion was also obtained, but its origin and whether these were fast phenomena (Haines jumps) could not be ascertained. Cryogenic suction was proposed as a possible cause of the water motion, even though no direct evidence was provided.
As shown in this paper, these difficulties or ambiguities in interpreting XRCT data, also emphasized in other recent works [18,19,20], can be lifted by means of optical microscopy, which offers a view closer to visual inspection at a much better temporal resolution (below 1 s) compared to synchrotron XRCT even though it is hampered by the opacity of mineral particles in thick samples.
Here, high-resolution optical microscopy observations of methane hydrate growth are reported in the same sand system and conditions as those in a previous synchrotron XRCT study carried out by some of the present authors [21], with the purpose of shedding light on the difficulties or ambiguities mentioned above. These observations and those obtained by synchrotron XRCT are jointly presented below, followed by a discussion that addresses the questions raised above, particularly about the nature and growth mechanisms of methane hydrate protuberances, the existence of Haines jumps, and possible cryosuction mechanisms. The coupling of these two types of pore-scale observations had never been attempted before even though joint spectroscopic and optical investigations, as presented by Schicks et al. [56], are not uncommon.

2. Materials and Methods

As described in Le et al. [21], the sand grain particles used were siliceous, poorly graded, sub-rounded Fontainebleau sand (NE34) and had diameters ranging from 100 to 300 µm. The aqueous phase was distilled or tap water or a potassium iodide (KI) brine with a concentration (3.5 wt.%) typical of seawater: KI is preferred to NaCl because of its higher electronic density and therefore higher X-ray contrast (see below). The ice melting temperature of KI aqueous solution (3.5 wt.%) is about −1 °C [57]. Methane is 99.995 % grade.
Figure 1 shows a schematic view of the setup used for optical microscopy observations, using square borosilicate glass capillary tubes as sample cells, internal side: 500 µm and wall thickness: 100 µm (Vitrotubes, CMScientific). Recall that silica glass and quartz sands have similar surface properties. Capillaries were mounted in a custom aluminium cell holder with optimal optical access (Étincelage, Serres-Castet, France), contacted with heat-conducting paste to an annular Peltier cooler with a water-cooled heat sink [37]. The open end of the tube was fixed with epoxy glue in a steel high pressure tube, connected via a three-way valve (for flushing the lines) to a precision pump (ISCO DM65). All cold parts were enclosed in an ad hoc housing with a dry nitrogen flow to prevent condensation. See [45] for more details. Samples were observed in transmission on an inverted widefield microscope (Nikon Ti-Eclipse, equipped with an ORCA-4.0s CMOS camera, Hamamatsu).
The synchrotron XRCT experiments are briefly described here (see [21] for more details). The porous medium, made up of wet sand grains, was packed in an aluminium tube (outer diameter, dext = 6.45 mm; thickness = 0.89 mm) with temperature controlled by a descending, constant flow of cooled air in a polymethyl–methacrylate sleeve (dext = 25 mm; thickness t = 2 mm). Methane at a constant pressure of 7.0 ± 0.1 MPa was then admitted. The high-resolution XRCT scans were acquired at the PSICHE beamline at the SOLEIL synchrotron: mean energy, 44 keV; voxel size, 0.9 µm; and scan time, 12 min). The beamline used an X-ray mirror and filters to produce relatively narrow spectra, typically a few keV full width at half maximum intensity [58]. The Paganin filter [59] was optimized to limit phase contrast so that the grey values of the phases were homogeneous in all images. Contrast, therefore, depended mainly on differences in material attenuation. Attenuations by water and methane hydrate are very similar, but the energy from the pink beam made the brine stand out well from the methane hydrate: relative attenuation coefficients 1 (sand), 0.66 (brine), 0.27 (pure water), 0.24 (methane hydrate), 0 (methane gas), see Figure 2. Therefore, the brightness of the different phases in the images shown here follows the same order as the materials’ densities: sand > saline water > tap water ~ methane hydrate > methane gas.
For synchrotron XRCT runs, wet sand was compacted in the aluminium tube to reach an average porosity of 0.4. Residual air was evacuated before admitting methane gas at 7 MPa and the system was cooled to the run temperatures in Table 1, which are 7–9 °C lower than the three-phase (hydrate–liquid and water–gas) equilibrium temperature at 7 MPa (strong supercooling). Four runs were performed, one with brine (run 1) and three with tap water (runs 2 to 4) (See Table 1). In run 1, the use of a potassium iodide brine instead of water afforded a clearer distinction between the aqueous phase and the hydrate. The initial moisture content (mass ratio of water to sand determined before packing the sample tube) was either 10 or 15%, corresponding to an average water saturation (fraction of the porosity occupied by water or brine) of 40 and 60%, respectively. We noted, however, the inhomogeneity of water distribution on the scale of the probed volume. Scanning was pursued for up to 22 h from reaching the target temperature (Table 1).
In the optical microscopy observations, dry sand grains were inserted in the capillaries, and then deionized water was added via capillary rise using a micro-pipette connected to a vacuum line so that the water content could be adjusted (but not finely controlled) to exhibit capillary bridges between the sand grains. In preliminary runs, the same conditions as those used in the XRCT runs were applied, but hydrate nucleation could not be detected over the 5–6 h spent at the target temperature, presumably because of the much smaller sample volume and sand content. In fact, production of methane hydrate in a reasonable time in such small samples requires either strong supercooling to nucleate the hydrate directly or formation of the hydrate from melting ice, where the ice formation, itself, requires very strong supercooling. Two runs were performed. In run 5 (Table 1), a methane pressure of 7 MPa was established prior to quenching to −16 °C to nucleate the hydrate, and two cycles of hydrate formation were carried out; the second cycle was performed after dissociating the hydrate and reforming another hydrate by exploiting the memory effect. In run 6, ice was formed in the evacuated cell by quenching to −25 °C. Then the temperature was raised to −5 °C and methane was admitted at 7 MPa. Finally, the temperature was raised to 2 °C to form methane hydrate from ice meltwater. Ice was unambiguously identified from its melting when the temperature was raised above 0 °C.
The three-phase equilibrium temperature for pure water at 7 MPa is Teq = 10–11 °C, and 9 °C for the brine, assuming KI has the same effect as NaCl at the same concentration [60]. Supercooling in all the runs was thus strong, Teq − Trun = 6–9 °C in runs 1–4 and 6, to very strong, 27 °C in run 5.
It is worth pointing out that in many natural settings, gas hydrates are formed from the dissolved gas in the aqueous phase, i.e., under excess water conditions. This process is however extremely slow and has not been implemented in most experimental studies published so far [61]. The excess gas method is preferred because the nucleation and growth processes are more rapid (as they are promoted by the presence of water–gas interfaces) and therefore accessible over reasonable time scales, provided the supercooling is large enough.

3. Results

Unless potassium iodide is present, the aqueous phase is hardly distinguishable from methane hydrate by grey levels alone in synchrotron XRCT cross-sections. The hydrate is identified by growth of protuberances, thickening around menisci and grain surfaces, particularly rough bands and patches of intermediate grey pixels, incompatible with the smooth and constant curvature interfaces between water and methane.

3.1. Early Stages of MH Formation and Growth: Nucleation and Water Migration to Sustain Initial MH Growth

The early stages of methane hydrate growth by synchrotron run 1 (Table 1), which corresponded to the first experiment presented and discussed in Le et al. [21], is illustrated. Here, again, the high-resolution images showed water menisci and capillary bridges in damp sand at the start of the run (Figure 3a). Displacement of water in the capillary bridges is clear in Figure 3b, obtained 0.58 h after reaching the conditions for hydrate formation: 7 MPa and 1–2 °C. Movement of water may be due to formation of the hydrate in the region scanned, or nearby. At the experimental temperature, 1–2 °C, detached patches of intermediate grey pixels near capillary bridges and the grain surfaces can only be the hydrate phase. These patches may be followed from plane to plane of the three-dimensional data, either to a meniscus or to a grain surface. Their blurred appearance indicates an evolving structure due to growth and movement during the X-ray scan, which lasted 15 min. Over longer time scales, these protuberances turn into rounded structures (see Section 3.3). These observations are consistent with those reported in Le et al. [21].

3.2. Growth of Hydrate Filaments

Optical microscopy, with its much higher temporal resolution, provides some indications as to the above “evolving structures” and patches with blurred appearances. Figure 4 shows optical micrographs of protuberances of the MH phase growing fast into the gas in run 5 at 7 MPa, and −16 °C (supercooling ≈ 27 °C). The grains were covered in a few minutes by a dense growth of filaments of methane hydrate extending into the gas, similar to the observations by Servio and Englezos [33], who observed filaments growing into the gas from a hydrate crust on a droplet of water under large enough supercooling. (See also Atig et al. [45], who observed MH filaments growing on the methane side from the hydrate crust separating the water and gas compartments in a thin glass capillary). Within a few minutes, filaments with typical lengths of up to several hundred micrometers over curves—corresponding to a growth rate of a few micrometers per second—formed and grew from their extremity in the gas phase (see Discussion below). Figure 4a shows one nearly 300 µm long, completely free-standing except for its root at the sand grain. The diameters of the filaments were remarkably constant, both over the length of individual filaments and in the whole population: mostly in the range 2–5 μm. Most filaments were spiralled, with a typical pitch of 10–15 μm, some completing a dozen or more turns before terminating in a club head or mass of small turns.
Interestingly, the halo of gas hydrate, commonly observed on glass substrates [35,45], was not prominent at this stage. Instead, circular hydrate halos appeared that were centred on, and radiating around, the points of contact of the filaments drooping onto the glass floor of the cell (Figure 4b,c). As we discuss further later (Section 4.2), these halos are evidence that the filaments are hollow and transport water in their interior to their tips. On raising the temperature to −5 °C, abundant halos spread over the glass from the contact lines of sand-to-glass capillary bridges (see Figure 5) and also presented filaments. When ice was first formed at low temperature and then melted above 0 °C, there was immediate spreading of hydrate halos over the sand surfaces.
After dissociation of all the hydrate by raising the temperature to above 12 °C, the sample was cooled to 4 °C. The situation was reversed in this second cycle of hydrate formation by the memory effect: filaments were not observed on the sand grains, but halos spread widely over the free glass (see the Supplementary Materials Video S1), radiating from the contact line of sand glass capillary bridges, see Figure 6. They advanced at ≈10 µms−1, leap-frogging over water droplets at up to ≈50 µms−1, consistent with the observations of Beltran and Servio [35] under similar pressure and temperature conditions, but rather faster than already noted for cyclopentane hydrate by Martínez de Baños et al. [37], at lower supercooling. Corkscrew filaments grew out of the halos, but were less dense than previously on the sand grains. They lengthened at rates ≈20–30 µms−1. The proposed mechanism of the capillary effect causing rapid displacement of water (Figure 6d) is discussed in the next section.
Filaments were present but grew at a slower rate and were less developed and numerous in run 6 than in run 5 (see Figure 7), presumably because of the lower supercooling.

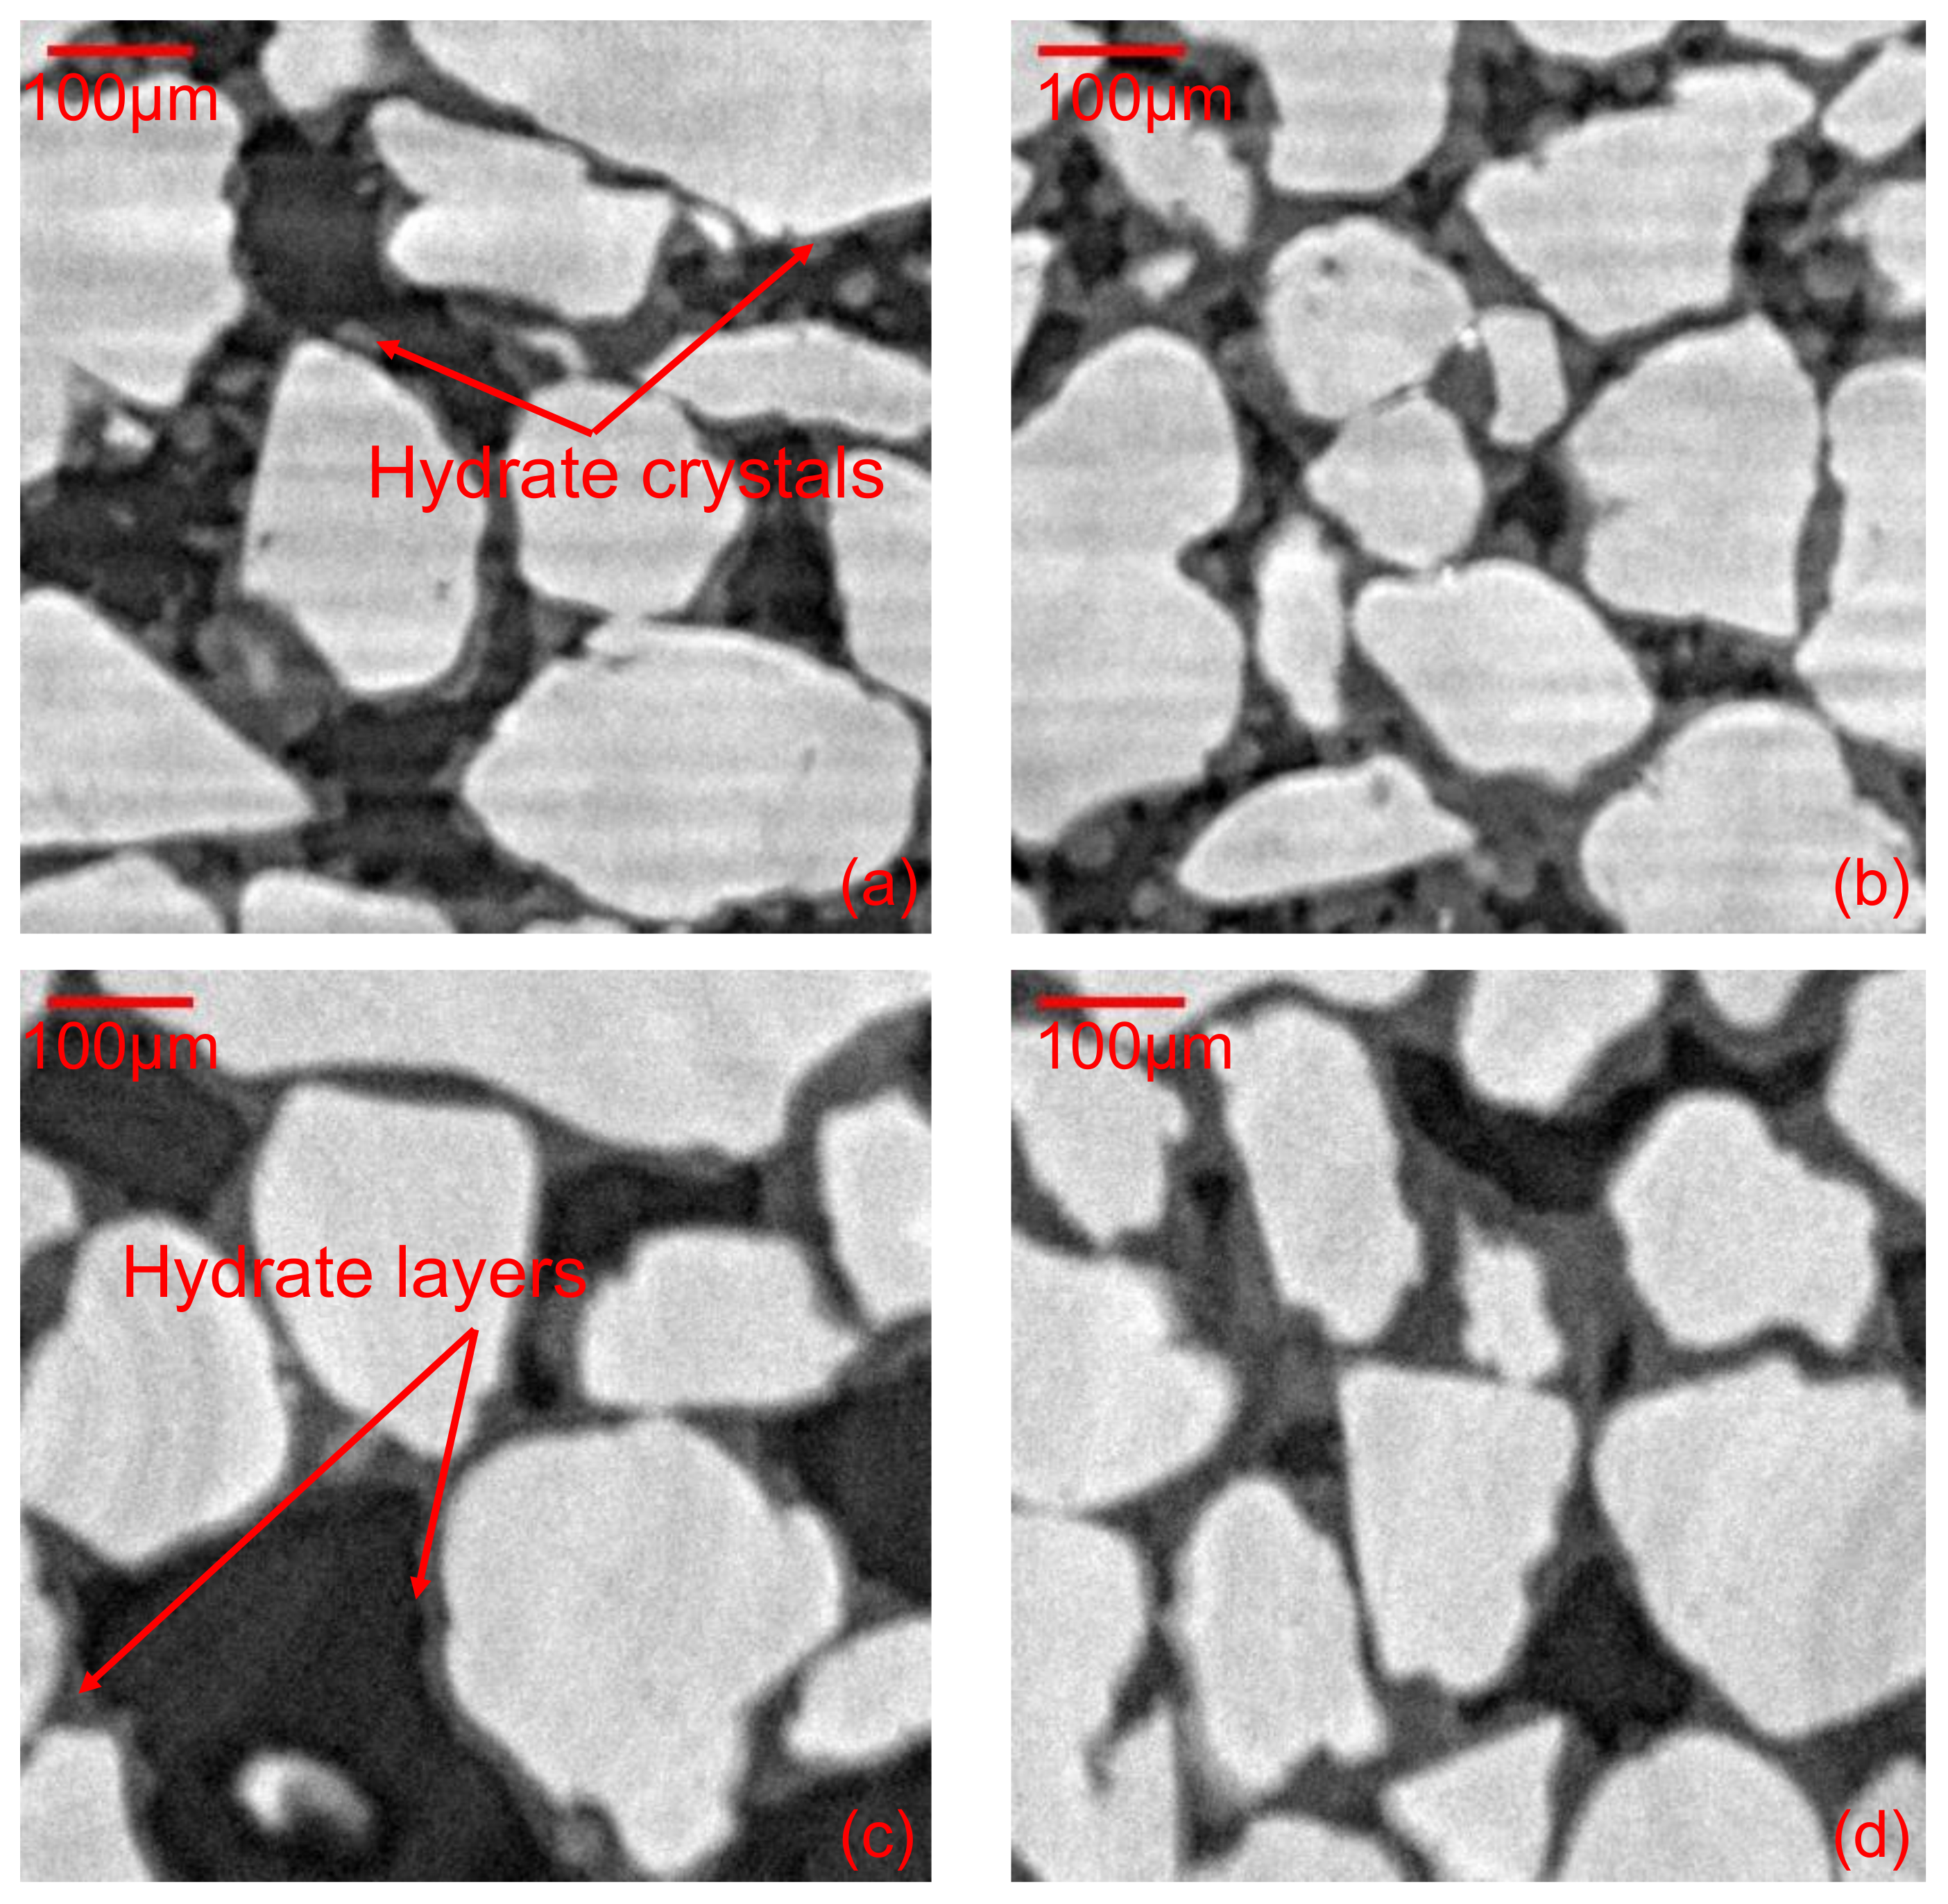
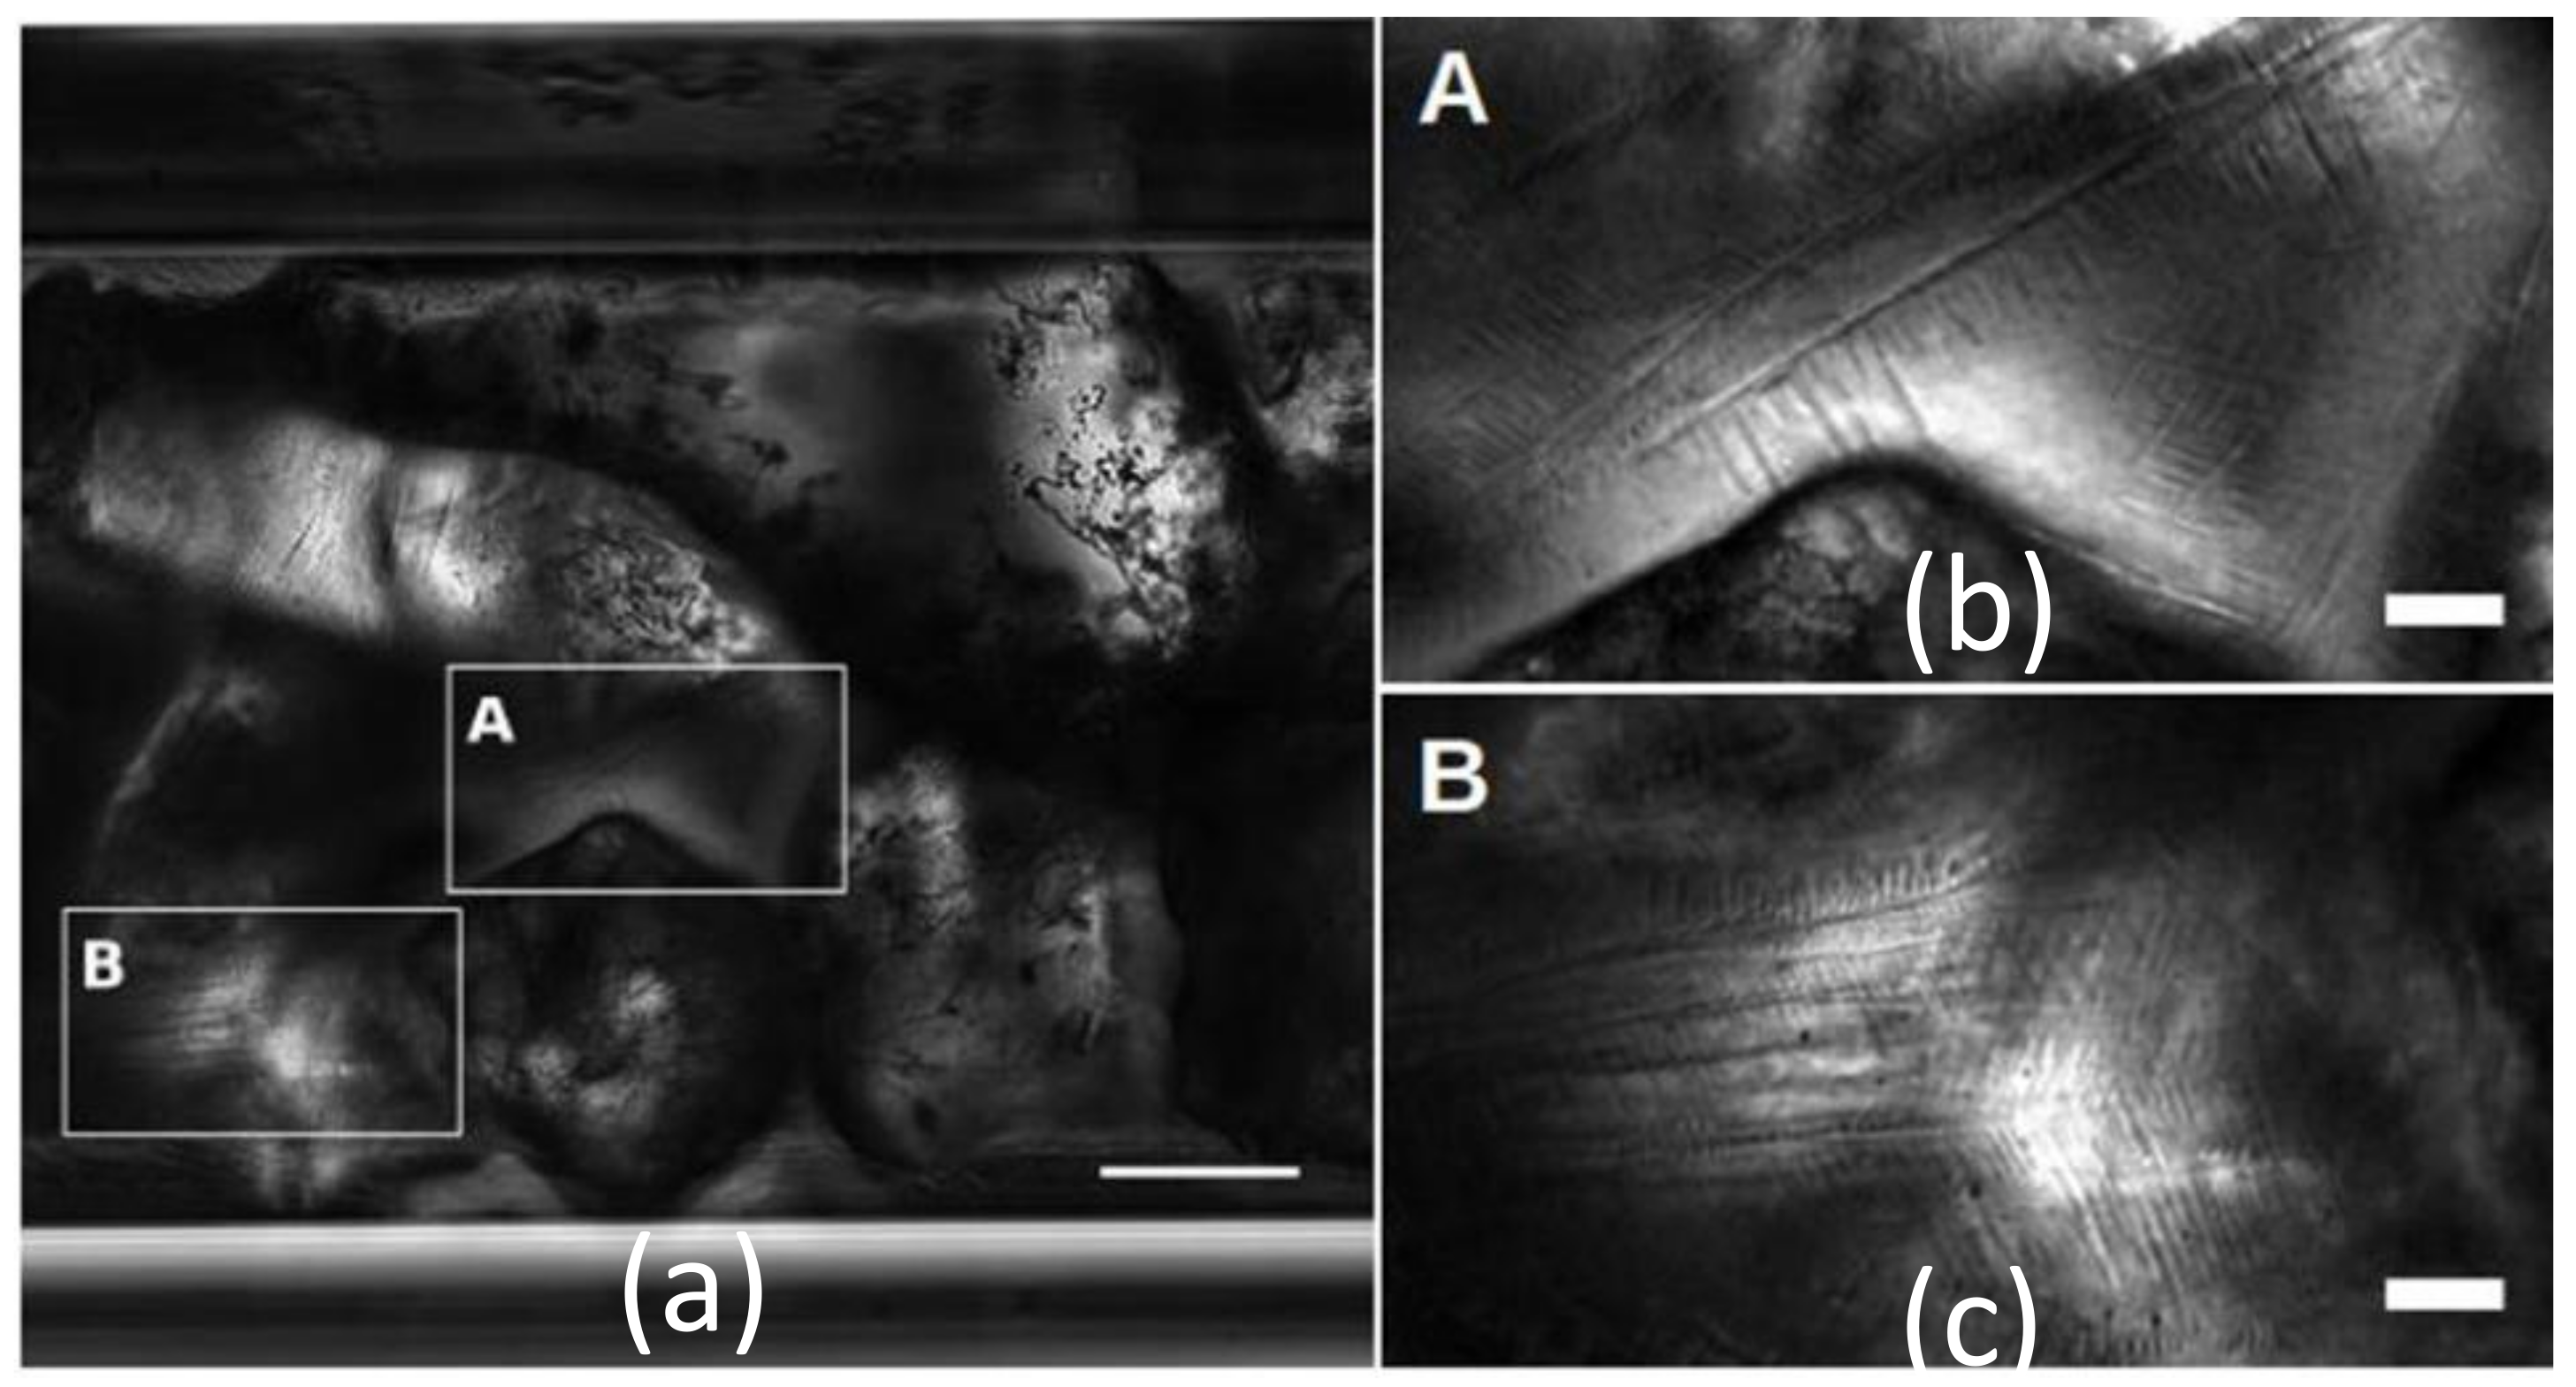
3.3. Later Stages of MH Growth and MH Morphologies

Figure 8a,b illustrates run 2, 10 h after initiation of hydrate formation conditions (2 °C, 7 MPa). Development of the protuberances into the form of rounded crystals can be clearly identified. Run 4 at higher average water saturation showed similar features, see Figure 8c,d. Most of these rounded crystals remained close and connected to the grain surfaces.
Synchrotron XRCT scans of runs 2 and 4 (Figure 8b–d, respectively) and run 3 (Figure 9) illustrate the presence and thickening over time of the hydrate layers on the sand (i.e., the halos mentioned above) and at interfaces between methane gas and pendular water over periods of up to 21 h. In run 3, see Figure 9, water must have migrated from areas outside the scanned volume to produce a surprisingly regular layer of hydrate 10–20 µm thick since it was not present in the first scan. See also Figure 10 (runs 2 and 3). Possible mechanisms for such fluid redistribution and hydrate layer thickening are discussed in the next section.
Correspondingly, feathered dendritic crystals appeared in the optical observations of capillary bridges in run 5 (See Figure 11). Visible at all depths of focus (Figure 12, see the Supplementary Materials Video S2), they therefore occupied all available volume, albeit tenuously, i.e., they might evolve into a denser pore filling configuration. Figure 10 shows XRCT scans obtained at later stages (18 and 21 h) in runs 2 and 3. The hydrate, again identified more by its form than by greyscale contrast with water, is present over the sand grains, as more or less rough crusts or even rounded protuberances. A thick crust is also present on the (former) water–gas menisci and in the smaller interstices between grains, thus filling the porous space over neighbouring pores.
In Figure 13 the results of run 1 are shown where the grey scale was represented by a colour scale for a better distinction among the four phases. Hydrate protuberances were visible at sand surfaces after 0.58 h (Figure 13a). After 2 h (Figure 13b), hydrate layers were clearly visible on menisci and on sand grains. These layers thickened over several hours (Figure 13c–e). Brine could still be observed behind the hydrate layer up to the end of the run at 10 h (Figure 13e). Note that the colour of the brine changed from yellow to red as water was withdrawn to form hydrate, signalling a local increase in salt concentration [21]. A higher salt concentration corresponded to a lower freezing temperature. That meant supercooling was lower which would induce slower hydrate growth.

4. Discussion

Reflecting the slowness of geological processes, the formation of hydrates in sediments typically occurs under excess water conditions [61]. However, the pore-scale mechanisms of methane hydrate growth in sediments are known essentially from laboratory studies, which are at best limited to periods of days. Therefore, excess gas conditions are favoured: the small size of the samples may further imply working at a higher driving force (i.e., stronger supercooling or larger departure from equilibrium conditions) to initiate crystallization. Model systems have nonetheless come progressively closer to configurations encountered in natural sediments, from a drop of water resting on glass under the guest gas [33,35], to thin glass capillaries filled with water and gas separated by a meniscus [43,45], to glass or silicon micromodels [50,52], and finally to synthetic sediments with hydrate formed following the excess gas method [17,18,19,20,21,62,63]. Recently, larger scale XRCT observations were obtained by Le et al. [21] on similar samples, where MH was initially formed under excess gas conditions. Water migration was observed during MH formation inducing excess water conditions in some areas where MH kept evolving and changing morphology. The XRCT and optical microscopy observations reported here are all concerned with experiments conducted under excess gas conditions.
Several earlier studies used either XRCT or low power microscopy. With all the above caveats, the picture of growth and distribution of methane hydrates within pores of sandy sediments that emerges from the present combination of high-resolution (synchrotron) XRCT and high-resolution optical microscopy is more complex than the conventional categorization into four pore habits: pore-filling, load-bearing, grain-contact cementing and grain-coating. Some of the synchrotron XRCT observations of methane hydrate grown under strong supercooling in the excess-gas conditions reported here may indeed be related to one of these habits but in a rather complex way. Pendular structures and water/gas menisci are initially present between adjacent sand grains. Grain-contact cementing and grain-coating were ensured by the MH layer that slowly thickened and roughened at water–gas interfaces and over the grain substrate, cf. Figure 9, Figure 10 and Figure 13. However, the exact hydrate morphology was hardly detected in the XRCT runs because of blurring effects, probably due to growth or motion of the MH hydrate over the time of measurement. Furthermore, the synchrotron XRCT results indicated extensive fluid rearrangements within pores following hydrate nucleation and growth (see Figure 3a,b). A scan time of 15 min does not, however, allow the drawing of any conclusion about the kinetics of such arrangements, i.e., whether they occur in a smooth and progressive manner or discontinuously as burst-like events with rapid interface motion—Haines jumps. Evidence for Haines jumps accompanying hydrate formation in a sand–fluid system and supercooling similar to those observed in the present work was recently claimed in a high-resolution synchrotron XRCT study [19] based on the observation of blurring tomography images acquired over a much shorter timescale compared to those in the present work (70 s vs. 900 s). Nikitin et al. [19] hypothesized without evidence that such a rapid migration of liquid water was due to a cryogenic suction phenomenon, i.e., water being pulled by capillarity to water-depleted, hydrate-rich regions. This evidence, together with a mechanism for such rapid suction, are provided here by optical microscopy data obtained in the present study.
Video-microscopy is much faster and closer to direct visual inspection: the timescale of standard optical microscopy is fractions of 1 s, orders of magnitude below that of synchrotron XRCT with comparable spatial resolution. Rapid fluid displacements, morphological ambiguities and their temporal evolution are elucidated in this work by optical microscopy observations of the same model sandy sediment under similar excess gas operating conditions and strong supercooling: the sand was confined between glass (the walls of the optical cell) with similar surface properties.

4.1. Haines Jumps and Proposal for a Cryogenic Suction Mechanism

The video-microscopy observations (Supplementary Materials Video S1) show unambiguous evidence for Haines jumps and provide one possible mechanism for cryogenic suction, a concept borrowed from the physics of freezing water-bearing soils that describes the water being drawn into ice-bearing regions by capillarity. This is an imbibition process, in which liquid water invades the ice surface and its interstices with the mineral substrate when ice reaches a liquid water pool [64]. Figure 6a (see also the Supplementary Materials Video S1) shows a hydrate halo creeping over the glass wall of the optical cell at the moment it makes contact with a large drop of water. The flow of water in and under the halo is established unequivocally by observing the entrainment of small objects such as hydrate or mineral debris. The total thickness of the halo and water layer is on the order of the depth of focus, i.e., a few micrometers, implying a similar boundary for at least one of the two radii of curvature of the meniscus (r in Figure 6d) stretched between the advancing halo front and the glass. By the Laplace effect, the pressure of the water under the halo, pwh ≈ pg − γ/r, must be lower than that in the drop, pwd ≈ pg + 2γ/R ≈ pg, which has much larger radius of curvature, R (see Figure 6b), where pg is the gas pressure and γ the water/methane interfacial tension ≈60 mN·m−1, at the pressure and temperature of the experiment [65]. The former pressure is lower than the latter by thousands of Pa and therefore water droplets are abruptly sucked under the edge of the halo, with transient local thickening of this layer and a leap forward of the halo front (see sequence 2 of the Supplementary Materials Video S1). A thin layer of water left on the footprint of the sucked-in droplet, but absent on the surrounding glass, could explain why the speed drops to its former value once the footprint is covered. We suggest that this process, which has been observed and characterized with cyclopentane hydrate on a flat glass substrate as well [37], may also occur on sand grains.
In addition, it can be related to the cryogenic suction accompanying methane hydrate formation—liquid water being drawn into water-depleted pores with MH halos (or layers) on sand. The extremely rapid lateral propagation of the hydrate layer (from the contact or nucleation point) over the liquid water layer left on glass (the footprint mentioned above), known as the “leap frog effect” [37], is typical of hydrate growth along interfaces between saturated water and gas under strong supercooling [66,67]. The halo is quite opaque, reflecting its polycrystallinity, again a typical feature of hydrate films formed under strong supercooling; the existence of internal cracks cannot however be excluded [31,41]. This leap-frog effect, which allows hydrate formation to be rapidly propagated in neighbouring water droplets, is reminiscent of the so-called relay crystallization observed in some water-in-oil emulsions [47].

4.2. A novel Methane Hydrate Morphology: Hollow Filaments

Blurred protuberances dangling in the gas are apparent near grain-coating MH layers (cf. the synchrotron XRCT sections: Figure 3, Figure 8, Figure 10 and Figure 3), which are as poorly defined as those observed in the phase-contrast XRCT observations by Lei et al. [18] and in other recent studies of methane hydrate formation in excess gas conditions at moderate-to-high supercooling [19,20]. Lei et al. [18] interpreted them as hollow spikes conducting the water necessary for their own lengthening in the methane gas from sources such as the water layer between the hydrate and the substrate. Optical microscopy images (shown in Section 3.2) revealed a gas hydrate morphology and growth mechanism in the form of thin hydrate filaments spiralling into the gas phase from the polycrystalline hydrate layer covering the substrates, either sand (Figure 4 and Figure 11), or glass (Figure 5). This growth may be sustained by water from the bulk, e.g., water in the pendular structures or capillary bridges between neighbouring grains, or by the liquid layer sandwiched between the substrate and the hydrate layer itself. When the tip of these filaments hits the pristine glass substrate, hydrate halos (or layers) radiate around the points of contact of the filaments with the glass, thus providing evidence that the hydrate filaments are hollow and convey liquid water to their extremity (Figure 4b,c and Figure 14). Note that hydrate filaments have very recently been observed growing under similar conditions from the pores of activated carbons in water–methane systems [68,69] even though the growth mechanisms seem to differ.

4.3. Methane Hydrate Growth around Sediment Particles and at Their Contacts

A water film beneath substrate-coating hydrate layers (halos) has been observed several times since it was hypothesized a decade ago by Beltran and Servio [35] whether for xenon hydrate in sandy sediment via high-resolution (synchrotron) XRCT [17] or for methane hydrate in a glass capillary via optical microscopy [45]. This layer is apparent in Figure 11, which shows a sand grain viewed through a capillary bridge between itself and the glass. A dense grain-coating layer of hydrate filaments surrounds the grain on the gas side, but makes only intermittent contact with it due to a water layer (arrows). Dendritic crystals grow on the water side, which has been observed in simpler settings [45,49]. The remaining water at the contacts of grains is gradually transformed into MH by means of methane gas–water diffusion through the existing porous hydrate at the water–gas interfaces (Figure 13). It has been reported that hydrate growth at the water–gas interface is subject to a variety of stress conditions as the water volume expands during phase transformation from liquid to solid [41]. Likewise, the MH hydrate layer (halo) that covers the grain substrate under methane gas very slowly thickens over time and exhibits two different limiting patterns, one with low roughening (i.e., a homogeneous thickness), and one with strong roughness with connected protuberances evolving into rounded crystals (Figure 9 and Figure 13).
The phenomena observed in the present work on methane hydrate with sand grains are very similar to those observed by Ta et al. [31] on carbon dioxide hydrate with glass beads: (i) dendritic morphology of hydrates, growing into pore spaces accompanied by an increase in brine concentration and a liquid aqueous phase remaining on the grain surface, and (ii) a significant volume expansion when water is transformed into hydrate, indicating its porous nature. Some insight into these evolutions and into the thickening of the hydrate layers (see Section 3.3) can be gained from observations of the same sample over a larger zone [21], which confirmed the migration of liquid water from regions outside the observed one. Additional water can be transported through the vapor phase as well as through liquid water films.
It is worth mentioning here the recent XRCT study of MH growth in a similar sand–fluid system under comparable supercooling [20], which showed annealing of the hydrate porous structure (i.e., slow resorption of water and gas pockets) over periods much longer than those in the present work (up to 19 days). Chen el al. [20] also showed evidence for two additional (or more complex) hydrate habits than the idealized ones presented above, which they call grain-attaching and pore-interconnecting. Grain-attaching differs from grain-coating by the inhomogeneity of the MH layer (or halo), which we indeed also observed. The pore-interconnecting habit describes a hydrate phase that spans over neighbouring pores, which we also observed (cf. Figure 10c,d). This distribution of the hydrate was distinct from the four conventional habits considered so far.

5. Conclusions

XRCT studies, especially those involving synchrotron sources, have provided tremendous insight into the pore-scale 3D features of methane hydrate growth in sandy sediments. The high-quality synchrotron XRCT data reported here have a spatial resolution (voxel size) below the micrometer, but at the expense of temporal resolution: the scanning time here is 15 min and exceeds one minute in all other XRCT studies published so far. Such temporal resolution does not allow the capture of fast-evolving gas hydrate structures and rapid fluid migration processes, which can only be inferred from poorly defined heterogeneities or image artefacts (blurring) by some sort of educated guesses. Examples are elongating crystals of various shapes and internal structure (such as hollow spikes) and Haines instabilities, in which liquid water quickly migrates to a hydrate-rich area of the pore space by a process analogous to the cryogenic suction in freezing water-bearing soils. In this study, the sub-second temporal resolution of optical microscopy complemented the synchrotron XRCT imaging by giving access to rapidly evolving events at similar spatial resolution.
This study is the first of its kind to combine synchrotron XRCT imaging with optical microscopy of methane hydrate in a sandy sediment. This combination provided a precise and unambiguous picture of methane hydrate growing in coarse sand under excess-gas and strong supercooling conditions, down to the micrometer and sub-second scales, and revealed growth features and mechanisms that could (in the best case) only be guessed from XRCT alone.
Under strong supercooling and excess gas conditions, two novel MH hydrate growth processes were clearly demonstrated in this work. First were the hollow hydrate filaments, which grew from hydrate crusts, either covering the water–gas menisci or the siliceous substrate––the “halo”, itself supported by a water sleeve between it and the substrate. They grew at high rates (>1 µm·s−1) from their tip in the gas phase, where liquid water was transported in the interior of the filament from the bulk liquid water on the other side of the crust.
The second was the Haines jumps––very rapid (sub-second) fluid redistribution within pores from regions where liquid water had accumulated to the hydrate growing in gas. Evidence showed the capillary-driven cryosuction of liquid water to the hydrate crust, a rapid imbibition of the liquid water into the porous hydrate or its interstices with the mineral substrate. This phenomenon occurred, when a growing hydrate crust hit a water pool (e.g., a droplet).
These features cannot be accounted for by the hydrate pore habit models that were proposed two or more decades ago, which in the absence of any observation on a pore scale, were indeed useful for constructing mechanical and petrophysical models of hydrate-bearing sediments. The more precise picture that emerged from this and other recent studies has far-reaching consequences for the hydromechanical and physical behaviours of MH-bearing sediments.

Supplementary Materials

The following are available online at https://www.mdpi.com/article/10.3390/en14185672/s1, Video S1: The video (prepared with imagej, gimp and openshot) shows the hydrate growth process in excess gas conditions near sand particles (visible in the upper part of the field of view) on the glass floor of the observation cell. Methane hydrate has been formed previously (at −16 °C, 8 MPa, run 5 in Table 1) and then melted by raising the temperature to 12 °C, which generated the numerous water droplets on the glass floor. Temperature was then lowered to 4 °C and kept at that value for the duration of the video (which started when the temperature reached 4 °C). By virtue of the memory effect, methane hydrate formed readily from the contact line of sand–glass capillary bridges and advanced on glass as a halo, at ≈10 µm·s−1 (Sequence 1), leapfroged over water droplets at up to 50 µm·s−1 (Sequence 2), and formed corkscrew filaments growing out of the halo (Sequence 3). Video S2: Transmission video sequence of the area shown in Figure 11 and Figure 12 of the main text. The video shows free gas (upper right), sand grains, capillary bridges between them, dendritic methane hydrate in the capillary bridges and spiral hydrate filaments in the gas on the other side of the interface. The focus was wound down by hand from within the capillary through the floor (cf. specks of dust on the floor on the gas side, upper right), ending at the outer glass surface (horizontal streaks left by imperfect wiping). The approximate nominal focus indicated by the microscope stage display (lower left), should be corrected for nearing due to refraction: Figures above 0 µm should be multiplied by the refractive index of the medium observed. The actual focus in the capillary bridges thus started at 174 µm × 1.33 ≈ 230 µm above the floor (0 µm, dust specks on the floor in the upper left corner) and passed through the glass to the outer surface at −70 µm × 1.5 ≈ −100 µm, corresponding to the thickness of the glass. Image processing: 16- bit acquisition, linear contrast stretch followed by local contrast enhancement (CLAHE, default parameters) and conversion to AVI in ImageJ 1.53c.

Author Contributions

Conceptualization, A.M.T. and D.B.; methodology, M.B., A.K. and R.B.; validation, B.C., T.X.L. and P.A.; formal analysis, T.X.L.; investigation, T.X.L.; resources, A.K.; data curation, T.X.L. and R.B.; writing—original draft preparation, T.X.L.; writing—review and editing, D.B. and A.M.T.; visualization, T.X.L. and R.B.; supervision, A.M.T.; project administration, A.M.T.; funding acquisition, A.M.T. All authors have read and agreed to the published version of the manuscript.

Funding

Please add: This research was funded by the French National Research Agency under project ANR-15-CE06-0008, HYDRE: “Mechanical behaviour of gas–hydrate-bearing sediments”, and by the CAPBP (Communauté d’Agglomération Pau Béarn Pyrénées), project “Laboratoire en capillaire”.

Data Availability Statement

Datasets for this research are available in https://figshare.com/projects/MH_growth_and_morphology_-_SXRCT_Optical_Microcopy/84053 (accessed on 3 Sepbtember 2021).

Acknowledgments

Use of the Psiché beamline at the Soleil synchrotron was granted under proposal 20181629 “Morphology and evolution of methane hydrates in granular sediment”. We thank Dyhia Atig, Marine Lemaire and Emmanuel Delaure for their help and technical support.

Conflicts of Interest

The authors declare no conflict of interest. The funders had no role in the design of the study; in the collection, analyses, or interpretation of data; in the writing of the manuscript, or in the decision to publish the results.

References

  1. Collett, T.S.; Johnson, A.H.; Knapp, C.C.; Boswell, R. Natural Gas Hydrates: Energy Resource Potential and Associated Geologic Hazards, AAPG Memoir 89; American Association of Petroleum Geologists: Tulsa, Oklahoma, USA, 2009; Volume 89, pp. 146–219. [Google Scholar] [CrossRef]
  2. Masui, A.; Kuniyuki, M.; Hironori, H.; Yuji, O.; Kazuo, A. Mechanical Properties of Natural Gas Hydrate Bearing Sediments Retrieved from Eastern Nankai Trough. In Proceedings of the Offshore Technology Conference (OTC), Houston, TX, USA, 5–8 May 2008. [Google Scholar] [CrossRef]
  3. Dai, S.; Santamarina, J.C.; Waite, W.F.; Kneafsey, T.J. Hydrate morphology: Physical properties of sands with patchy hydrate saturation. J. Geophys. Res. B Solid Earth 2012, 117, B11205. [Google Scholar] [CrossRef] [Green Version]
  4. Konno, Y.; Yoneda, J.; Egawa, K.; Ito, T.; Jin, Y.; Kida, M.; Suzuki, K.; Fujii, T.; Nagao, J. Permeability of sediment cores from methane hydrate deposit in the Eastern Nankai Trough. Mar. Pet. Geol. 2015, 66, 487–495. [Google Scholar] [CrossRef]
  5. Boswell, R.; Collett, T.S. Current perspectives on gas hydrate resources. Energy Environ. Sci. 2011, 4, 1206–1215. [Google Scholar] [CrossRef]
  6. Helgerud, M.B.; Dvorkin, J.; Nur, A. Elastic-wave velocity in marine sediments with gas hydrates: Effective medium modeling. Geophys. Res. Lett. 1999, 26, 2021–2024. [Google Scholar] [CrossRef]
  7. Dvorkin, J.; Helgerud, M.; Waite, W.; Kirby, S.; Nur, A. Introduction to physical properties and elasticity models. In Natural Gas Hydrate; Max, M.D., Ed.; Springer: Dordrecht, The Netherlands, 2000; pp. 245–260. [Google Scholar] [CrossRef]
  8. Chand, S.; Minshull, T.A.; Gei, D.; Carcione, J.M. Elastic velocity models for gas-hydrate-bearing sediments—A comparison. Geophys. J. Int. 2004, 159, 573–590. [Google Scholar] [CrossRef] [Green Version]
  9. Soga, K.; Ng, M.; Lee, S.; Klar, A. Characterisation and engineering properties of methane hydrate soils. Characterisation Eng. Prop. Nat. Soils 2006, 4, 2591–2642. [Google Scholar] [CrossRef]
  10. Waite, W.F.; Santamarina, J.C.; Cortes, D.D.; Dugan, B.; Espinoza, D.N.; Germaine, J.; Jang, J.; Jung, J.W.; Kneafsey, T.J.; Shin, H.; et al. Physical properties of hydrate-bearing sediments. Rev. Geophys. 2009, 47, 1–38. [Google Scholar] [CrossRef]
  11. Uchida, S.; Soga, K.; Yamamoto, K. Critical state soil constitutive model for methane hydrate soil. J. Geophys. Res. Solid Earth 2012, 117, 1–13. [Google Scholar] [CrossRef]
  12. Sánchez, M.; Gai, X.; Santamarina, J.C. A constitutive mechanical model for gas hydrate bearing sediments incorporating inelastic mechanisms. Comput. Geotech. 2017, 84, 28–46. [Google Scholar] [CrossRef] [Green Version]
  13. Taleb, F.; Garziglia, S.; Sultan, N. Hydromechanical Properties of Gas Hydrate-Bearing Fine Sediments From In Situ Testing. J. Geophys. Res. Solid Earth 2018, 123, 9615–9634. [Google Scholar] [CrossRef]
  14. Nguyen-Sy, T.; Tang, A.M.; To, Q.D.; Vu, M.N. A model to predict the elastic properties of gas hydrate-bearing sediments. J. Appl. Geophys. 2019, 169, 154–164. [Google Scholar] [CrossRef]
  15. Alavoine, A.; Dangla, P.; Pereira, J.M. Fast Fourier transform-based homogenisation of gas hydrate bearing sediments. Géotech. Lett. 2020, 10, 367–376. [Google Scholar] [CrossRef]
  16. Kerkar, P.B.; Horvat, K.; Jones, K.W.; Mahajan, D. Imaging methane hydrates growth dynamics in porous media using synchrotron X-ray computed tomography. Geochem. Geophys. Geosyst. 2014, 15, 4759–4768. [Google Scholar] [CrossRef]
  17. Chaouachi, M.; Falenty, A.; Sell, K.; Enzmann, F.; Kersten, M.; Haberthür, D.; Kuhs, W.F. Microstructural evolution of gas hydrates in sedimentary matrices observed with synchrotron X-ray computed tomographic microscopy. Geochem. Geophys. Geosyst. 2015, 16, 1711–1722. [Google Scholar] [CrossRef] [Green Version]
  18. Lei, L.; Seol, Y.; Choi, J.H.; Kneafsey, T.J. Pore habit of methane hydrate and its evolution in sediment matrix–Laboratory visualization with phase-contrast micro-CT. Mar. Pet. Geol. 2019, 104, 451–467. [Google Scholar] [CrossRef] [Green Version]
  19. Nikitin, V.V.; Geser, N.; Dugarov, A.; Duchkov, A.A.; Fokin, M.I.; Arkady Drobchik, N.; Shevchenko, P.D.; De Carlo, F.; Mokso, R. Dynamic in-situ imaging of methane hydrate formation and self-preservation in porous media. Mar. Pet. Geol. 2020, 115, 104234. [Google Scholar] [CrossRef]
  20. Chen, X.; Espinoza, D.N.; Luo, J.S.; Tisato, N.; Flemings, P.B. Pore-scale evidence of ion exclusion during methane hydrate growth and evolution of hydrate pore-habit in sandy sediments. Mar. Pet. Geol. 2020, 117, 104340. [Google Scholar] [CrossRef]
  21. Le, T.X.; Aimedieu, P.; Bornert, M.; Chabot, B.; King, A.; Tang, A.M. An experimental investigation on the methane hydrates morphologies and pore habits in sandy sediment by using Synchrotron X-ray Computed Tomography. Mar. Pet. Geol. 2020, 122, 104646. [Google Scholar] [CrossRef]
  22. Waite, W.; Winters, W.J.; Mason, D.H. Methane hydrate formation in partially water-saturated Ottawa sand. Am. Mineral. 2004, 89, 1202–1207. [Google Scholar] [CrossRef]
  23. Priest, J.A.; Best, A.I.; Clayton, C.R.I. A laboratory investigation into the seismic velocities of methane gas hydrate-bearing sand. J. Geophys. Res. Solid Earth 2005, 110, 1–13. [Google Scholar] [CrossRef]
  24. Winters, W.J.; Waite, W.F.; Mason, D.H.; Gilbert, L.Y.; Pecher, I.A. Methane gas hydrate effect on sediment acoustic and strength properties. J. Pet. Sci. Eng. 2007, 56, 127–135. [Google Scholar] [CrossRef] [Green Version]
  25. Priest, J.A.; Rees, E.V.L.; Clayton, C.R.I. Influence of gas hydrate morphology on the seismic velocities of sands. J. Geophys. Res. Solid Earth 2009, 114, B11205. [Google Scholar] [CrossRef] [Green Version]
  26. Jin, S.; Takeya, S.; Hayashi, J.; Nagao, J.; Kamata, Y.; Ebinuma, T.; Narita, H. Structure Analyses of artificial methane hydrate sediments by microfocus X-ray computed tomography. Jpn. J. Appl. Phys. 2004, 43, 5673–5675. [Google Scholar] [CrossRef]
  27. Jones, K.W.; Feng, H.; Tomov, S.; Winters, W.J.; Prodanoviće, M.; &Mahajan, D. Characterization of methane hydrate host sediments using synchrotron-computed microtomography (CMT). J. Pet. Sci. Eng. 2007, 56, 136–145. [Google Scholar] [CrossRef] [Green Version]
  28. Takeya, S.; Yoneyama, A.; Ueda, K.; Hyodo, K.; Takeda, T.; Mimachi, H.; Takahashi, M.; Iwasaki, T.; Sano, K.; Yamawaki, H.; et al. Non-destructive imaging of anomalously preserved methane hydrate by phase-contrast X-ray imaging. J. Phys. Chem. C 2011, 115, 16193–16199. [Google Scholar] [CrossRef]
  29. Wu, P.; Li, Y.; Sun, X.; Liu, W.; Song, Y. Pore-scale 3D morphological modeling and physical characterization of hydrate-bearing sediment based on computed tomography. J. Geophys. Res. Solid Earth 2020, 125. [Google Scholar] [CrossRef]
  30. Le, T.X.; Aimedieu, P.; Bornert, M.; Chabot, B.; King, A.; Tang, A.M. Experimental development to investigate the grain-scale morphology and pore habit of methane hydrate-bearing sandy sediment by X-ray Computed Tomography. Geotech. Test. J. 2021, 44, 502–519. [Google Scholar] [CrossRef]
  31. Ta, X.H.; Yun, T.S.; Muhunthan, B.; Kwon, T. Observations of pore-scale growth patterns of carbon dioxide hydrate using X-ray computed microtomography. Geochem. Geophys. Geosyst. 2015, 16, 912–924. [Google Scholar] [CrossRef]
  32. Davies, S.H.; Sloan, E.D.; Sum, A.K.; Koh, C.A. In-situ studies of the mass transfer mechanism across a methane hydrate film using high-resolution confocal Raman spectroscopy. J. Phys. Chem. C 2010, 114, 1173–1180. [Google Scholar] [CrossRef]
  33. Servio, P.; Englezos, P. Morphology of methane and carbon dioxide hydrates formed from water droplets. Environ. Energy Eng. AIChE J. 2004, 49, 269–276. [Google Scholar] [CrossRef]
  34. Lee, J.D.; Song, M.; Susilo, R.; Englezos, P. Dynamics of Methane-Propane Clathrate Hydrate Crystal Growth from Liquid Water with or without the Presence of n-Heptane. Cryst. Growth Des. 2006, 6, 1428–1439. [Google Scholar] [CrossRef]
  35. Beltrán, J.G.; Servio, P. Morphology investigations of methane-hydrate films formed on a glass surface. Cryst. Growth Des. 2010, 10, 4339–4347. [Google Scholar] [CrossRef]
  36. Saito, K.; Kishimoto, M.; Tanaka, R.; Ohmura, R. Crystal growth of clathrate hydrate at the interface between hydrocarbon gas mixture and liquid water. Cryst. Growth Des. 2011, 11, 295–301. [Google Scholar] [CrossRef]
  37. Martinez de Baños, L.M.; Hobeika, N.; Bouriat, P.; Broseta, D.; Enciso, E.; Clément, F.; Brown, R. How do gas hydrates spread on a substrate? Cryst. Growth Des. 2016, 16, 4360–4373. [Google Scholar] [CrossRef]
  38. Esmail, S.; Beltrán, J.G. Methane hydrate propagation on surfaces of varying wettability. J. Nat. Gas Sci. Eng. 2016, 35, 1535–1543. [Google Scholar] [CrossRef]
  39. Udegbunam, L.U.; DuQuesnay, J.R.; Osorio, L.; Walker, V.K.; Beltran, J.G. Phase equilibria, kinetics and morphology of methane hydrate inhibited by antifreeze proteins: Application of a novel 3-in-1 method. J. Chem. Therm. 2018, 117, 155–163. [Google Scholar] [CrossRef]
  40. Stoporev, A.S.; Adamova, T.P.; Manakov, A.Y. Insight into Hydrate Film Growth: Unusual Growth of Methane and the Aqueous Solution of Malonic Acid. Cryst. Growth Des. 2020, 20, 1927–1934. [Google Scholar] [CrossRef]
  41. Jung, J.-W.; Santamarina, C. Hydrate formation and growth in pores. J. Cryst. Growth 2012, 345, 61–68. [Google Scholar] [CrossRef]
  42. Touil, A.; Broseta, D.; Hobeika, N.; Brown, R. Roles of Wettability and Supercooling in the Spreading of Cyclopentane Hydrate over a Substrate. Langmuir 2017, 33, 10965–10977. [Google Scholar] [CrossRef]
  43. Touil, A.; Broseta, D.; Desmedt, A. Gas hydrate crystallization in thin glass capillaries: Roles of supercooling and wettability. Langmuir 2019, 35, 12569–12581. [Google Scholar] [CrossRef] [PubMed]
  44. Hobeika, N.; Martinez de Baños, M.L.; Bouriat, P.; Broseta, D.; Brown, R. High-Resolution Optical Microscopy of Gas Hydrates. In Gas Hydrates 1: Fundamentals, Characterization and Modeling; Broseta, D., Ruffine, L., Desmedt, A., Eds.; Wiley-ISTE: Hoboken, NJ, USA, 2017; pp. 113–144. [Google Scholar] [CrossRef]
  45. Atig, D.; Broseta, D.; Pereira, J.M.; Brown, R. Contactless probing of polycrystalline methane hydrate at pore scale suggests weaker tensile properties than thought. Nat. Commun. 2020, 11, 3379. [Google Scholar] [CrossRef] [PubMed]
  46. Adamova, T.P.; Stoporev, A.S.; Manakov, A.Y. Visual Studies of Methane Hydrate Formation on the Water–Oil Boundaries. Cryst. Growth Des. 2018, 18, 6713–6722. [Google Scholar] [CrossRef]
  47. Stoporev, A.S.; Semenov, A.P.; Medvedev, V.I.; Sizikova, A.A.; Gushchin, P.A.; Vinokurov, V.A.; Manakov, A.Y. Visual observation of gas hydrates nucleation and growth at a water-organic liquid interface. J. Cryst. Growth 2018, 485, 54–68. [Google Scholar] [CrossRef]
  48. Ohmura, R.; Shimada, W.; Uchida, T.; Mori, Y.H.; Takeya, S.; Nagao, J.; Minagawa, H.; Ebinuma, T.; Narita, H. Clathrate hydrate crystal growth in liquid water saturated with a hydrate-forming substance: Variations in crystal morphology. Philos. Mag. 2004, 84, 1–16. [Google Scholar] [CrossRef]
  49. Ohmura, R.; Matsuda, S.; Uchida, T.; Ebinuma, T.; Narita, H. Clathrate Hydrate Crystal Growth in Liquid Water Saturated with a Guest Substance:  Observations in a Methane + Water System. Cryst. Growth Des. 2005, 5, 953–957. [Google Scholar] [CrossRef]
  50. Tohidi, B.; Anderson, R.; Ben Clennell, M.; Burgrass, R.W.; Biderkab, A.B. Visual observation of gas-hydrate formation and dissociation in synthetic porous media by means of glass micromodels. Geology 2001, 29, 867–870. [Google Scholar] [CrossRef]
  51. Katsuki, D.; Ohymura, R.; Ebinuma, T.; Narita, H. Methane hydrate crystal growth in a porous medium filled with methane-saturated liquid water. Philos. Mag. 2007, 87, 1057–1069. [Google Scholar] [CrossRef]
  52. Hauge, L.P.; Gauteplass, J.; Høyland, M.D.; Ersland, G.; Kovscek, A.; Fernø, M.A. Pore-level hydrate formation mechanisms using realistic rock structures in high-pressure silicon micromodels. Int. J. Greenh. Gas Control 2016, 53, 178–186. [Google Scholar] [CrossRef]
  53. Almenningen, S.; Flatlandsmo, J.; Kovscek, A.R.; Ersland, G.; Fernø, M.A. Determination of pore-scale hydrate phase equilibria in sediments using lab-on-a-chip technology. Lab Chip 2017, 17, 4070–4076. [Google Scholar] [CrossRef]
  54. Pandey, J.S.; Strand, O.; von Solms, N.; Ersland, G.; Almenningen, S. Direct Visualization of CH4/CO2 Hydrate Phase Transitions in Sandstone Pores. Cryst. Growth Des. 2021, 21, 2793–2806. [Google Scholar] [CrossRef]
  55. Pandey, J.S.; Almmeningen, S.; von Solms, N.; Ersland, G. Pore-Scale Visualization of CH4 Gas Hydrate Dissociation under Permafrost Conditions. Energy Fuels 2021, 35, 1178–1196. [Google Scholar] [CrossRef]
  56. Schicks, J.M.; Naumann, R.; Erzinger, J.; Hester, K.C.; Koh, C.A.; Sloan, E.D. Phase Transitions in Mixed Gas Hydrates: Experimental Observations versus Calculated Data. J. Phys. Chem. B 2006, 110, 11468–11474. [Google Scholar] [CrossRef] [PubMed]
  57. David, R.L. CRC Handbook of Chemistry and Physics, 88th ed.; CRC Press: Boca Raton, FL, USA, 2004. [Google Scholar]
  58. King, A.; Guignot, N.; Zerbino, P.; Boulard, E.; Desjardins, K.; Bordessoule, M.; Leclerq, N.; Le, S.; Renaud, G.; Cerato, M.; et al. Tomography and Imaging at the PSICHE Beam Line of the SOLEIL Synchrotron. Rev. Sci. Instrum. 2016, 87, 093704. [Google Scholar] [CrossRef] [PubMed] [Green Version]
  59. Paganin, D.; Mayo, S.C.; Gureyev, T.E.; Miller, P.R.; Wilkins, S.W. Simultaneous phase and amplitude extraction from a single defocused image of a homogeneous object. J. Microsc. 2002, 206, 33–40. [Google Scholar] [CrossRef]
  60. Chong, Z.R.; Chan, A.H.M.; Babu, P.; Yang, M.; Linga, P. Effect of NaCl on methane hydrate formation and dissociation in porous media. J. Nat. Gas Sci. Eng. 2015, 27, 178–189. [Google Scholar] [CrossRef]
  61. Ruppel, C.D.; Waite, W.F. Grand challenge: Timescales and processes of methane hydrate formation and breakdown, with application to geologic systems. J. Geophys. Res. Solid Earth 2020, 125, e2018JB016459. [Google Scholar] [CrossRef]
  62. Le, T.X.; Aimedieu, P.; Bornert, M.; Chabot, B.; Rodts, S.; Tang, A.M. Effect of temperature cycle on mechanical properties of methane hydrate-bearing sediment. Soils Found. 2019, 59, 814–827. [Google Scholar] [CrossRef]
  63. Le, T.X.; Rodts, S.; Hautemayou, D.; Aimedieu, P.; Bornert, M.; Chabot, B.; Tang, A.M. Kinetics of methane hydrate formation and dissociation in sand sediment. Geomech. Energy Environ. 2020, 23, 100103. [Google Scholar] [CrossRef] [Green Version]
  64. Thomas, H.R.; Cleall, P.; Li, Y.C.; Harris, C.; Kern-Luetschg, M. Modelling of cryogenic processes in permafrost and seasonally frozen soils. Géotechnique 2009, 59, 173–184. [Google Scholar] [CrossRef]
  65. Yasuda, K.; Mori, Y.H.; Ohmura, R. Interfacial tension measurements in water-methane system from 278.15 K to 298.15 K and pressures up to 10 MPa. Fluid Phase Equilibria 2016, 413, 170–175. [Google Scholar] [CrossRef]
  66. Saito, K.; Sum, A.K.; Ohmura, R. Correlation of Hydrate-Film Growth Rate at the Guest/Liquid-Water Interface to Mass Transfer Resistance. Ind. Eng. Chem. Res. 2010, 49, 7102–7103. [Google Scholar] [CrossRef]
  67. Mochizuki, T.; Mori, Y.H. Simultaneous mass and heat transfer to/from the edge of a clathrate-hydrate film causing its growth along a water/guest-fluid phase boundary. Chem. Eng. Sci. 2017, 171, 61–75. [Google Scholar] [CrossRef]
  68. Venet, S.; Broseta, D.; Brown, R. A Novel Gas Hydrate Morphology: Massive Hollow Fiber Growth on a Porous Substrate. Cryst. Growh Des. 2021, 21, 3148–3152. [Google Scholar] [CrossRef]
  69. Zhang, G.; Liu, B.; Xu, L.; Zhang, R.; He, Y.; Wang, F. How porous surfaces influence the nucleation and growth of methane hydrates. Fuel 2021, 291, 120142. [Google Scholar] [CrossRef]
Figure 1. Experimental setup for optical microscopy runs. The cell, a thin glass capillary with a square cross-section, is inserted into a thermostated holder (not shown), on an inverted microscope.
Energies 14 05672 g001
Figure 2. Linear attenuation coefficients relative to quartz vs. photon energy.
Energies 14 05672 g002
Figure 3. Early stages of methane hydrate growth, results of run 1: (a) Image on reaching 1–2 °C; (b) Methane hydrate is visible in an image taken 0.58 h later.
Energies 14 05672 g003
Figure 4. Methane hydrate filaments in run 5, growing into the gas from sand grains at 7 MPa and −16 °C. (a) A self-supporting filament; (b,c) Filaments drooping onto the floor of the glass cell, giving rise to localised halos. Scale bars: (a,c) 50 µm; (b) 20 µm.
Energies 14 05672 g004
Figure 5. Methane hydrate halo and filaments on the floor of the glass cell on warming from −16 to −5 °C in run 5. Scale bar: 50 µm.
Energies 14 05672 g005
Figure 6. A halo and filaments of methane hydrate observed during a second cycle, at 4 °C, 7 MPa in run 5 on the optical microscope. Images a, b and c are extracted from the Supplementary Materials Video S1. (a) Growth of the halo on the glass, from the contact line “C”; (b) the halo leapfrogs over a droplet of water on the glass, “D”; (c) a few seconds later, the presence of filaments, “F”; (d) Schematic of the capillary effect causing rapid displacement of water. Scale bar: 100 µm. pwh is the pressure of the water under the halo; pwd is the pressure of the water in the drop; pg is the gas pressure; γ is the water–methane interfacial tension; R is the radius of the drop; r is the radius of the water film.
Energies 14 05672 g006
Figure 7. Examples of the shorter methane hydrate filaments growing from sand grains at 7 MPa, 2 °C in run 6. Scale bar: 20 µm.
Energies 14 05672 g007
Figure 8. Tomographic sections of the growth of methane hydrate: (a,b) after 10 h following the imposition of formation conditions in run 2; (c,d) after 6 h in run 4.
Energies 14 05672 g008
Figure 9. Tomographic sections of the thickening of methane hydrate (MH) layers in run 3 (a) 4 h following imposition of the MH formation conditions, (b) 10 h, (c) 15 h, and (d) 21 h.
Energies 14 05672 g009
Figure 10. Methane hydrate morphologies: (a,b) images at two different locations within the sample in run 2, 18 h after the imposition of the MH formation conditions; (c,d) images at two different locations within the sample in run 3, 21 h after the imposition of the MH formation conditions.
Energies 14 05672 g010
Figure 11. Section through a gas-water-sand interface (a) General, showing abrasion of the sand grains and a meniscus separating interstitial water in capillary bridges (lower left) from the gas (upper right); (b) Zoomed view of the boxed region in (a). With the focus being neither on the glass nor on a sand grain, but in a plane in the bulk of the water, the hatched hydrate growth (lower left) is dendritic; filaments sprout into the gas on the other side, cf. Figure 6. The section shows a water layer surrounding the grain of sand. (c) Schematic view of (b). Scale bars: (a) 100 µm, (b) 20 µm.
Energies 14 05672 g011
Figure 12. Feathered dendritic crystals of methane hydrate growing into capillary bridges between sand grains, at 7 MPa and −16 °C, in run 5: (a) Image with scale bar of 100 µm; (b) image corresponding to zone A, scale bar of 20 µm; (c) image corresponding to zone B, scale bar of 20 µm.
Energies 14 05672 g012
Figure 13. Tomographic sections of the growth of methane hydrate from brine in run 1: (a) 0.58 h; (b) 2 h; (c) 4 h; (d) 6 h; (e) 10 h.
Energies 14 05672 g013
Figure 14. Proposed mechanism of the hydrate filament growth process (Figure 4). The filament is hollow and conveys water to its expanding tip (top), until its hits (bottom) the sand surface at the right and forms a halo radiating around the contact point.
Energies 14 05672 g014
Table 1. Experimental conditions in the synchrotron XRCT runs (1–4) and the optical microscopy runs (5–6). All experiments were conducted at 7 MPa.
RunAqueous PhaseInitial
Gravimetric Moisture Content (%)
Temperature
(°C)
Duration
(h)
13.5 wt% KI151–222
2Tap water102–318
3Tap water103–421
4Tap water152–37
5Deionized water-−16 to −5 (1st formation)
4 (2nd formation)
3
6Deionized water-25
Publisher’s Note: MDPI stays neutral with regard to jurisdictional claims in published maps and institutional affiliations.

