Abstract
With the increase in the share of solar energy in the sustainable development, accurate parameter identification plays a significant role in designing optimal solar photovoltaic systems. For this purpose, this paper extensively implements and evaluates the grey wolf optimizer with a dimension learning-based hunting search strategy, an improved version of GWO named I-GWO, in the parameter extraction of photovoltaic cells and modules. According to the experimental results, the double-diode model leads to better fitness than the other diode models in representing the physical behaviors of both photovoltaic cells and photovoltaic modules. For further performance validation, firstly, the internal parameters extracted by the I-GWO algorithm and the corresponding output current data are compared with a number of widely-used parameter extraction methods in the literature. Then, the best goodness-of-fit results achieved by the I-GWO algorithm are evaluated considering many state-of-the-art metaheuristic algorithms in the literature. The accuracy measures including root mean squared error and sum of individual absolute errors show that I-GWO is fairly promising to be the efficient and valuable parameter extraction method for both photovoltaic cells and photovoltaic modules.
1. Introduction
1.1. Overview
By the end of 2019, the overall electricity generation from bioenergy, geothermal energy, hydropower, ocean power, solar energy and wind energy systems reached about 2588 GW worldwide. Among these renewable energy sources, solar photovoltaic systems have once again emerged as the frontrunner with the additional capacity of around 115 GW in 2019 [1]. In solar photovoltaic systems, the accurate characterization of diode model parameters enables us to closely represent the nonlinear current–voltage (I–V) and power–voltage (P–V) curves of photovoltaic cells and modules. Therefore, the solution of parameter extraction issue is a fundamental requirement for proper design, performance evaluation, quality controls and optimal operation of photovoltaic systems [2,3]. However, this task is still complex and challenging under various operating conditions.
1.2. Literature Review
In order to tackle the parameter extraction problem of photovoltaic cells and modules, a number of techniques have been recommended in the literature. These techniques are mostly categorized into three groups: analytical methods, deterministic techniques and metaheuristic optimization algorithms [4,5].
The analytical methods are mainly based on the correctness of maximum power voltage, maximum power current, short circuit current, open circuit voltage, etc. points on the I–V curve [4,6]. If these key data points are erroneously identified, the modeling accuracy drastically worsens. Instead of selecting several key data points on the I–V curve, deterministic techniques and metaheuristic optimization algorithms consider all measured I–V data [4,7]. Deterministic techniques, such as Levenberg–Marquardt method [8], Nelder-Mead simplex method [9], Gauss–Seidel method [10], Runge–Kutta–Merson method [11], Lambert W functions [12], least squares [13], etc., impose the limitations on the differentiability, convexity and continuity characteristics of fitness functions. This condition causes convergence to the local optima in the solution of the multimodal, multivariable and nonlinear parameter extraction issue. An analytical method based on the ideality factor variation was used to identify the electrical parameters and the absolute error of output current was found below 0.25 A for a solar module [14]. A simple iterative method was adopted to obtain the initial values of shunt resistance and its relative error did not exceed 4.38% [15]. The Newton–Raphson method was utilized to estimate the reverse saturation current and diode ideality factor, and the deviation in open circuit voltage was found 0.08 V for a solar cell [16].
Unlike the deterministic techniques, metaheuristic algorithms do not impose any limitations on the optimization problem and they have the capability of solving various complex issues. A genetic algorithm was used to improve the parameter estimation accuracy and it surpassed the quasi-Newton method [17]. However, it provided the electrical parameters with large errors. A differential evolution algorithm was utilized to enhance the parameter identification performance and it showed lower errors than the series resistance-based model [18]. Nevertheless, its improper differential scheme caused the premature convergence. Particle swarm optimization was employed to identify the uncertain parameters and it outperformed the genetic algorithm [19]. However, it required more data as an input. Artificial bee colony optimization (ABC) was applied to estimate the unknown parameters and it obtained higher precision than the particle swarm optimization [20]. Nevertheless, it suffered from the local exploitation ability. Some of other metaheuristic algorithms utilized in the literature are artificial bee swarm optimization (ABSO) [21], biogeography-based optimization with mutation strategies (BBO-M) [22], bacterial foraging algorithm (BFA) [23], bird mating optimizer (BMO) [24], grouping-based global harmony search (GGHS) [25], generalized oppositional teaching–learning-based optimization (GOTLBO) [26], improved whale optimization algorithm (IWOA) [27], pattern search (PS) [28], simulated annealing (SA) [29], self-adaptive teaching–learning-based optimization (SATLBO) [30], hybrid methods [31,32,33,34,35], etc. These metaheuristic approaches also suffer from different inherent characteristics, such as premature convergence, weak exploitation, high sensitivity to the initial population and adherence to the limited number of parameters for performance improvement [36,37,38].
1.3. Research Contributions
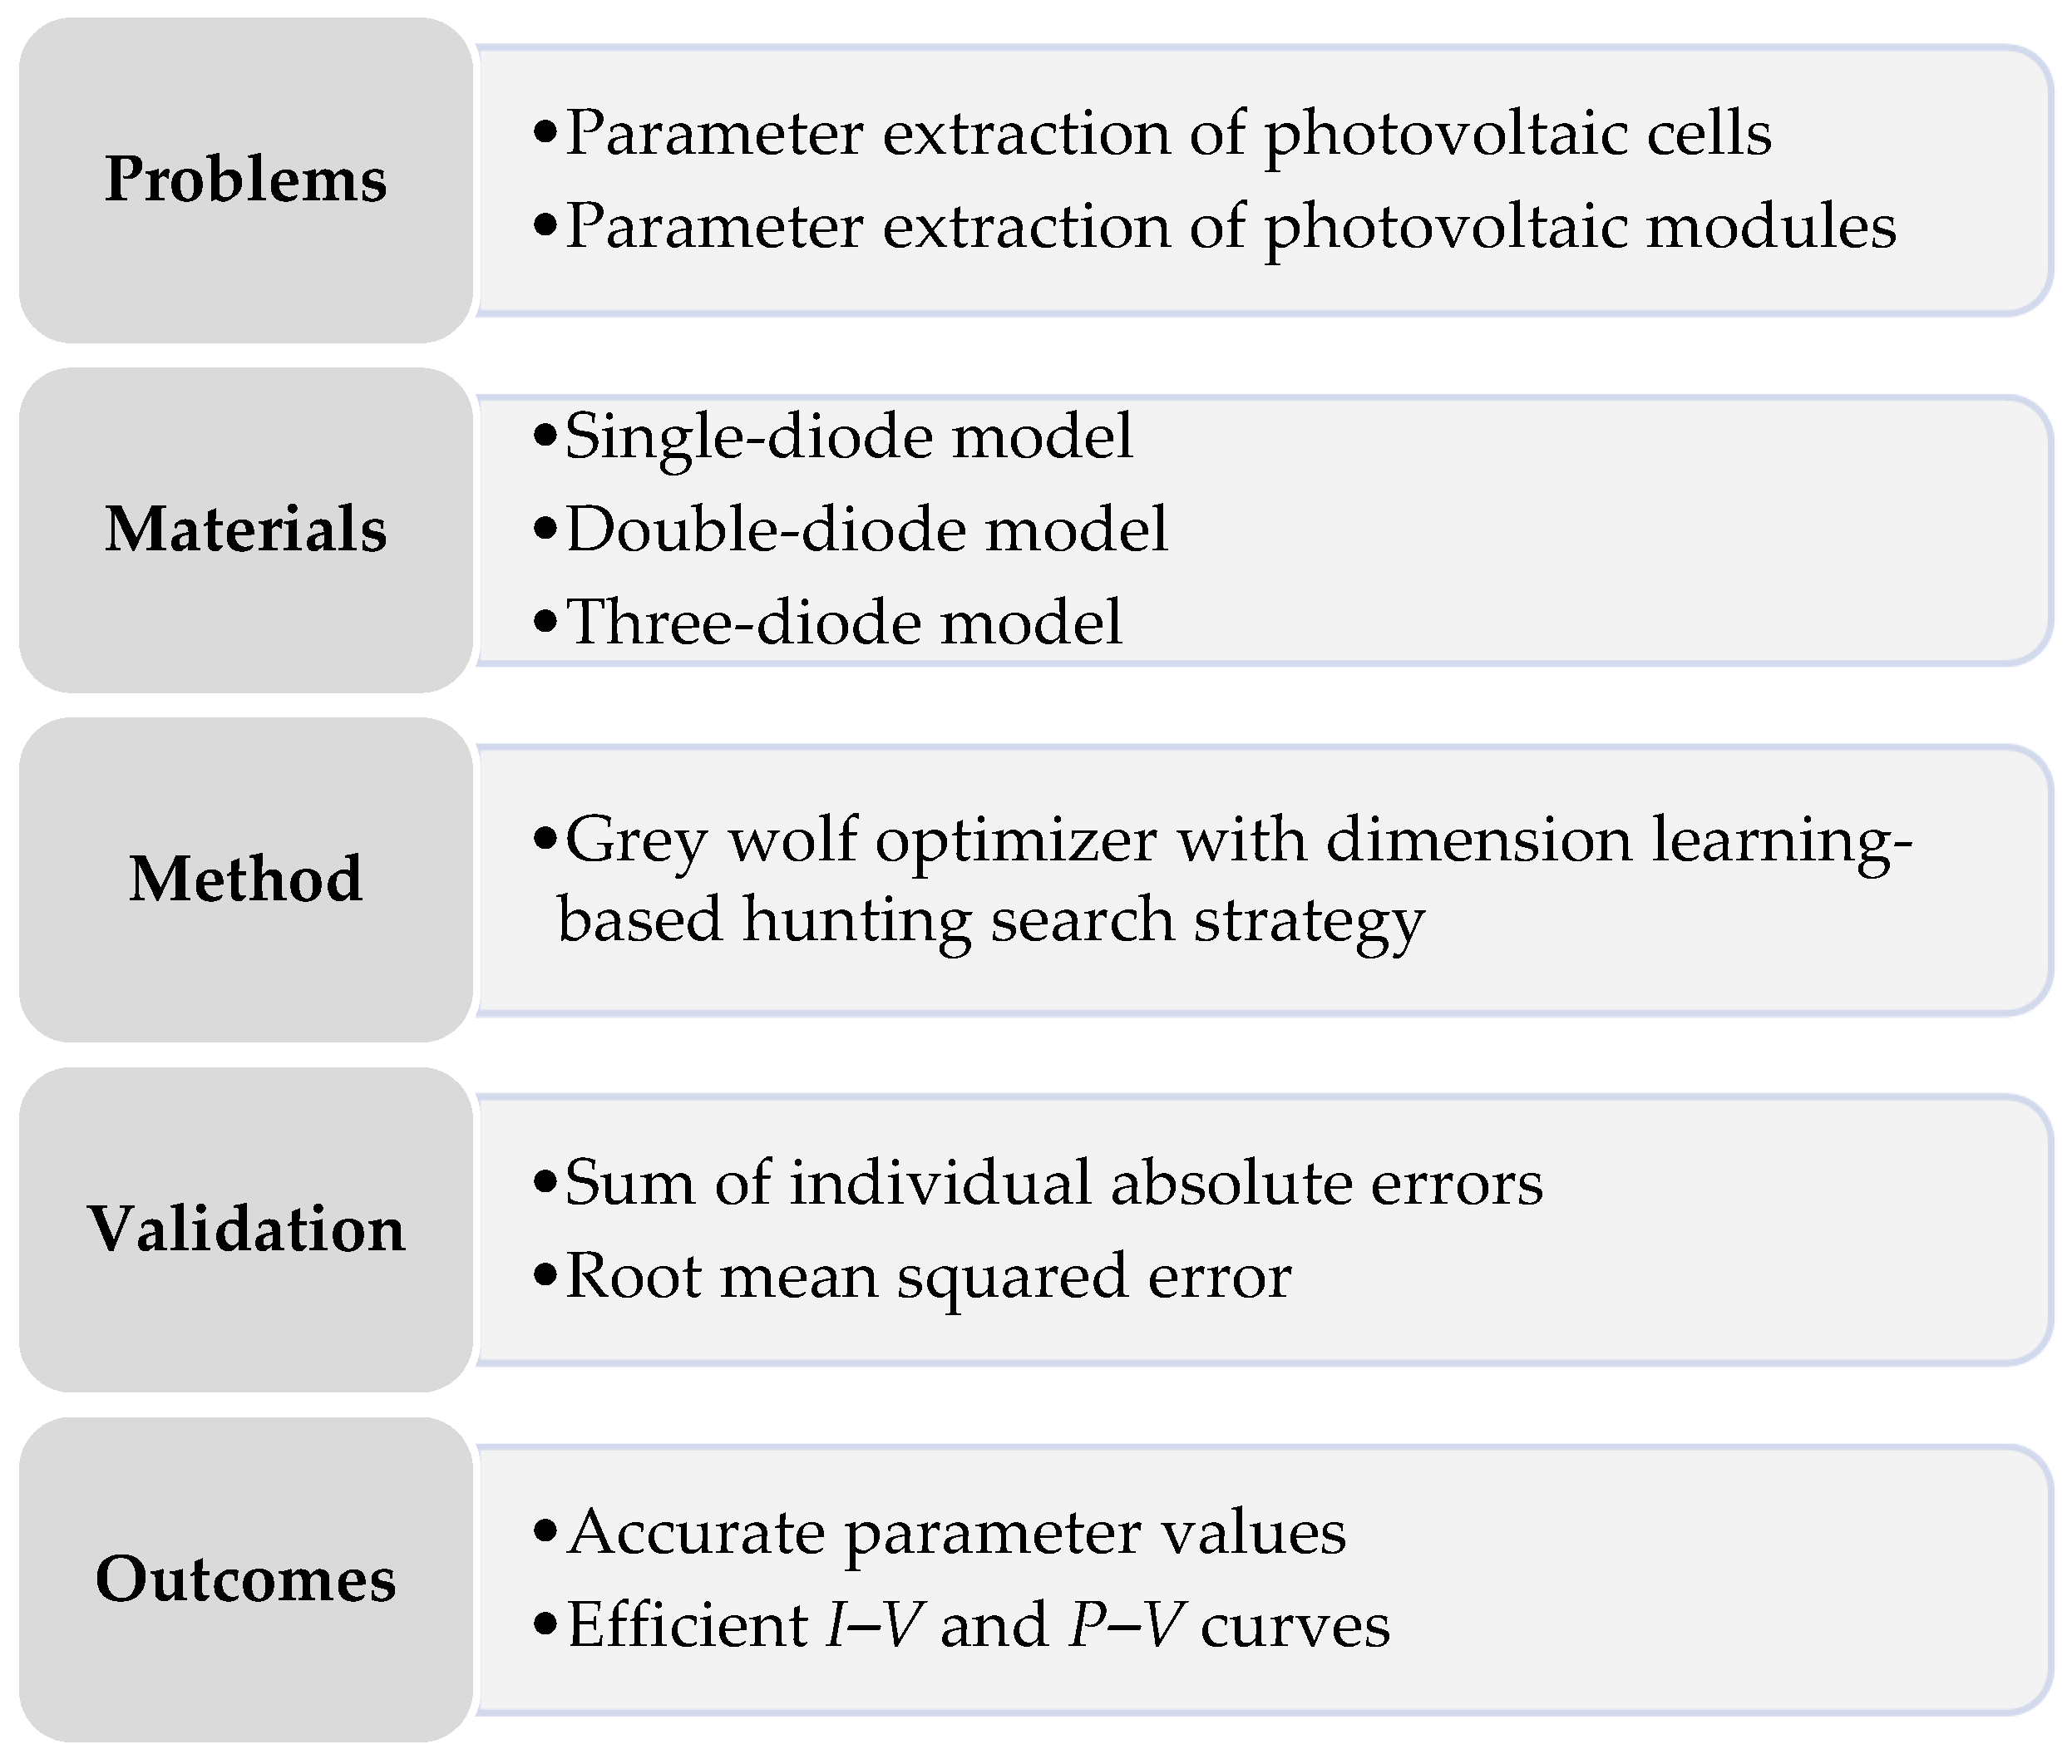
Grey Wolf Optimizer (GWO), which was proposed in 2014 [39], is an efficient evolutionary algorithm imitating the group hunting behavior of wolves in nature. Its success in solving the optimization problems has already been proven for several fields, such as unit commitment [40], load frequency control [41], optimal power flow [42], etc. A number of variants of the basic GWO algorithm, such as mGWO [43], EGWO [44], AgGWO [45], etc. have also been proposed in order to overcome its various weaknesses in the optimization process. Grey wolf optimizer with dimension learning-based hunting search strategy (I-GWO) [46] is one of the latest GWO variants benefit from the more population diversity, the high local optima avoidance and the good balance between exploration and exploitation. On the basis of the current knowledge in the literature, the I-GWO algorithm has not yet been extensively implemented and evaluated for the parameter extraction problem of photovoltaic cells and modules. To this end, the main goals of this paper are given below. In addition, the research framework of this study is also summarized in Figure 1.
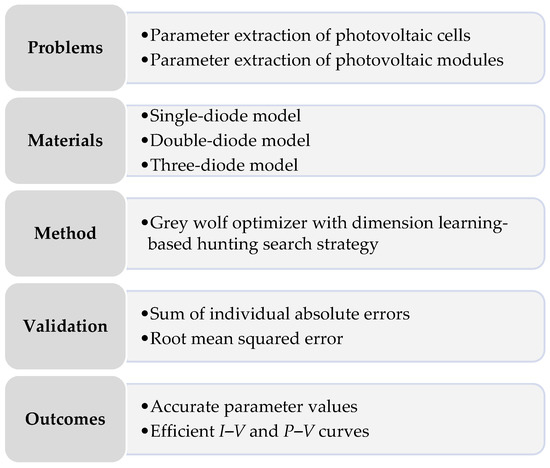
Figure 1.
The research framework of this study.
- I-GWO is applied to all of benchmark test models including single-diode, double-diode and three-diode models in the literature;
- The effectiveness of I-GWO is validated in terms of multiple performance aspects including accuracy, robustness and solution quality;
- A deeper comparison is made considering not only commonly used but also recently proposed parameter extraction models in the literature;
- The results demonstrate that I-GWO is often superior and quite competitive for reliably estimating the internal parameters of photovoltaic cells and modules.
1.4. Structure of the Article
The rest of this paper is organized as follows: Section 2 describes the diode circuit models utilized for photovoltaic systems. Section 3 presents the mathematical background of GWO and I-GWO in detail. Section 4 and Section 5 elaborate and compare the experimental results in the parameter extraction of photovoltaic cells and modules. Section 6 discusses the overall results. Finally, Section 7 concludes this paper.
2. Diode Circuit Models of Photovoltaic Systems
In the related literature, single-diode model and double-diode model are generally used for the mathematical modeling of electrical characteristics of PV cells and modules [47]. The single-diode model has easy-to-use characteristics. However, it shows unsatisfactory performance under low irradiance and neglects the influence of recombination at junction at low voltages [27,48]. Despite that, the double-diode model is preferred at low solar radiation and it considers the influence of recombination current loss in the depletion region [49]. As an alternative to the double-diode model, the three-diode model has recently been developed for modeling the effect of grain boundaries and large leakage current [50,51]. Nevertheless, it brings large computational load owing to its high number of uncertain parameters.
In the single-diode model, the photovoltaic cell is designed as a current source connected in parallel with a rectifying diode and a shunt resistance [52,53]. Figure 2 illustrates the equivalent circuit of the single-diode model for a photovoltaic cell. The output current of the single-diode model is computed using Equations (1) and (2). In these equations, , , and are the shunt resistor, diode, photo-generated and output current, respectively. and denote the shunt and series resistance, respectively. represents the saturation current, represents the output voltage and is the diode ideality factor. As observed from Equation (2), , , , and are the five parameters required to be extracted for the single-diode model.
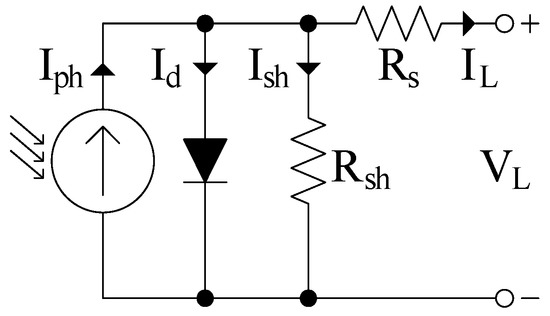
Figure 2.
Equivalent circuit of the single-diode model.
In the double-diode model, the photovoltaic cell is designed as a current source connected in parallel with a diffusion diode, a recombination diode and a shunt resistance [52,53]. Figure 3 depicts the equivalent circuit of the double-diode model for a photovoltaic cell. The output current of the double-diode model is calculated utilizing Equations (3) and (4). In these equations, and are the second diode and first diode current, respectively. and denote the ideality factors of recombination and diffusion diodes, respectively. and represent the saturation and diffusion current, respectively. As seen from Equation (4), , , , , , and are the seven parameters needed to be identified for the double-diode model.
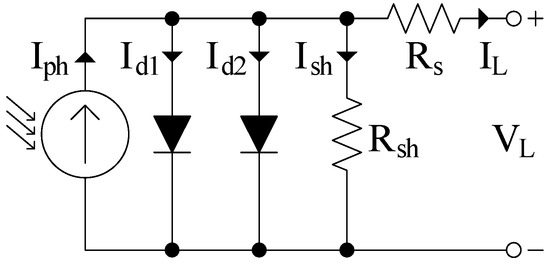
Figure 3.
Equivalent circuit of the double-diode model.
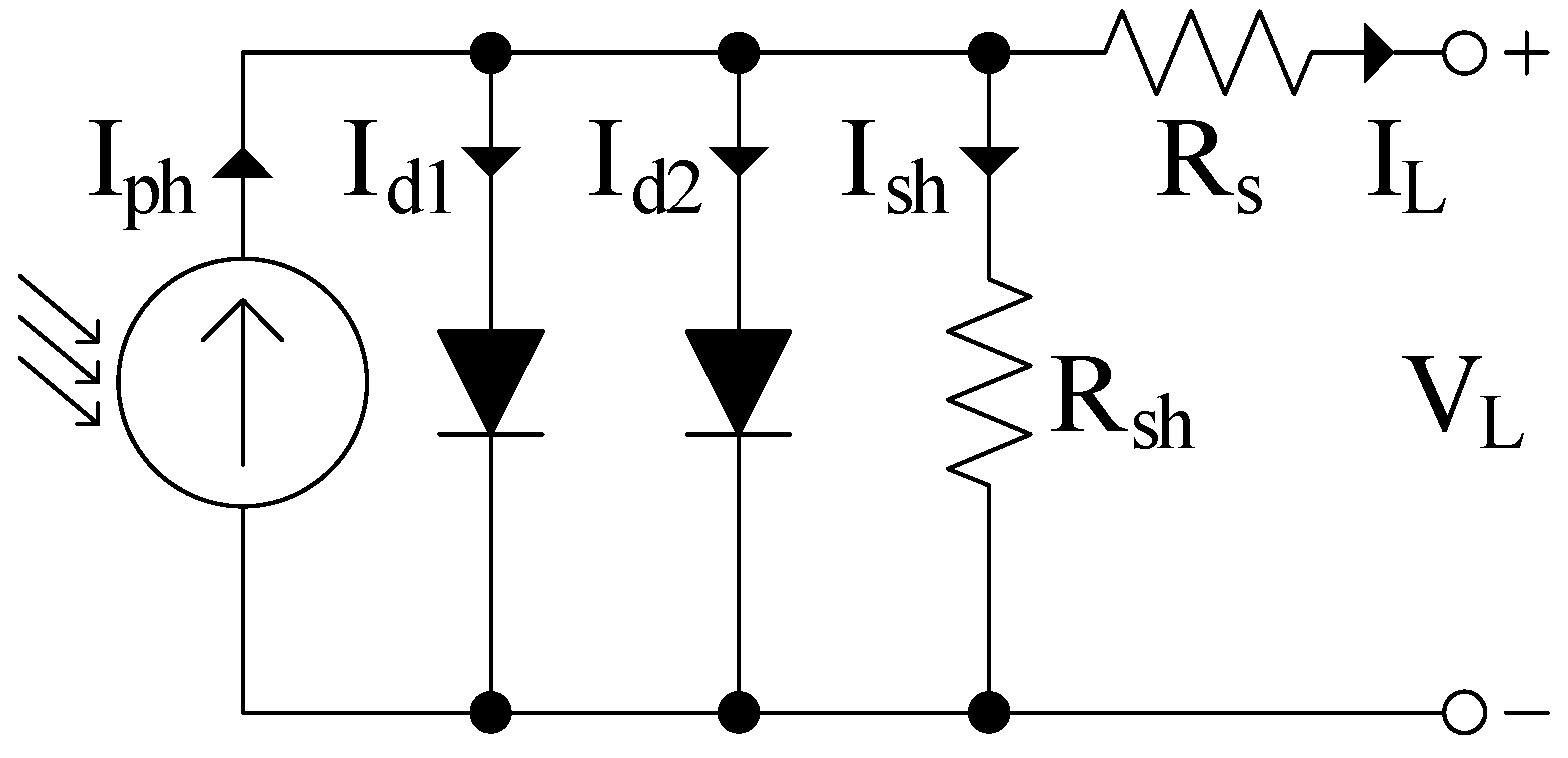
In the three-diode model, a third diode is added in parallel to the two diodes in the double-diode model [54,55]. Figure 4 shows the equivalent circuit of the three-diode model for a photovoltaic cell. The output current of the three-diode model is formulated as in Equations (5) and (6). In these equations, , and are the third diode, second diode and first diode current, respectively. Except from , same parameters affect the value of . As seen from Equation (6), , , , , , , , and are the nine parameters to be estimated for the three-diode model.
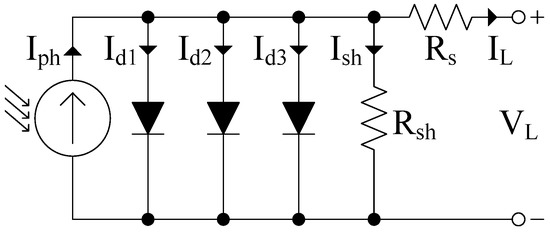
Figure 4.
Equivalent circuit of the three-diode model.
In all of diode circuit models, is the cell temperature (), is the Boltzmann constant with the value of and is the electron charge with the value of . In addition, the material resistivity at contacts is also modeled by means of the series resistance in all of diode circuit models.
3. Methodology
3.1. Fundamental Concepts of Grey Wolf Optimizer
Grey wolf optimizer, which was developed by Mirjalili et al. [39], is one of the widely employed bio-inspired and population-based metaheuristic optimization techniques. It mimics the behavior of the grey wolf pack in searching, encircling and attacking the prey. There is a strict social hierarchy in the grey wolf pack with different levels of leadership and dominance. Within this hierarchy, the alpha wolves, which are the leaders, make decisions on waking up, sleeping, hunting, etc. The beta wolves, which are the subordinate wolves, help the alpha wolves in the pack activities. The delta wolves obey the alpha and beta wolves, while dominating the omega wolves. Finally, the omega wolves are the scapegoats at the bottom of the pack. According to [39], the mathematical background of GWO is summarized below.
In the process of group hunting, grey wolves encircle their prey by Equation (7), where is the current iteration, represents the next location of the grey wolf, indicates the current location of the grey wolf and indicates the location of the prey.
and are the coefficient vectors computed with Equations (8) and (9), where and are the random vectors ranging between 0 and 1. In order to emphasize the exploration and exploitation tendencies, over the iterations, is linearly reduced and takes the stochastic weights.
The location of the prey is unspecified in the search space. For this reason, alpha, beta and delta wolves are set as the first, second and third closest search agents to the optimal solution, respectively. Omega wolves update their locations according to these best candidate solutions. This group hunting behavior is expressed with Equations (10)–(13), where , and denote the locations of delta, beta and alpha wolves, respectively. and enforce the grey wolves to go away from the current prey and to search a better one, whereas and enforce the grey wolves to converge towards the prey and to attack it.
3.2. Grey Wolf Optimizer with Dimension Learning-Based Hunting Search Strategy
GWO suffers from the premature convergence, the imbalance between exploration and exploitation phases and the lack of population diversity. In order to tackle these deficiencies, Nadimi-Shahraki et al. [46] incorporated the dimension learning-based hunting search strategy to GWO, which mainly consists of initialization, movement, and selecting and updating steps. Thus, the I-GWO algorithm benefits from not only the group hunting behavior of grey wolves but also the individual hunting behavior of each wolf. According to [46], the mathematical background of I-GWO is summarized below.
In the initialization step, wolves are stochastically distributed in the search space in the range of with Equation (14), where represents the dimension number.
In the movement step, in addition to calculated by Equations (10)–(13), is generated as another candidate for the new position of . To do this, initially, a radius is computed utilizing Euclidean distance among and with Equation (15). Following from this, , which indicates the neighbors of , is constituted with Equation (16) and multi neighbors learning is realized with Equation (17). In Equation (16), denotes the Euclidean distance among and . In Equation (17), is the d-th dimension of a stochastic neighbor chosen from and is the d-th dimension of a stochastic wolf chosen from the entire population.
In the selecting and updating step, initially, the best candidate for is chosen by evaluating the fitness values of and with Equation (18). Following, is updated by the chosen candidate in case the fitness value of the chosen candidate is smaller than . Otherwise, remains unchanged in the population. The optimization process is completed when reaching the maximum number of iterations.
4. Experimental Results on the PV Cells
In this section, the I-GWO algorithm is implemented to the three benchmark test models including single-diode, double-diode and three-diode models in order to validate its performance on the parameter extraction problem of PV cell models. The experimental I–V data are obtained from [56]. The corresponding commercial silicon solar cell (R.T.C. France) has a diameter of 57 mm and operates under standard test conditions of 1000 W/m2 at 33 °C. The search ranges for the unknown internal parameters of the mentioned benchmark test models are listed in Table 1.

Table 1.
The search ranges for the parameters of photovoltaic cell models.
In the experiments, the number of search agents and maximum iterations are set to 15 and 25,000, respectively. A number of 50 independent runs are conducted to eliminate the contingency. All experiments are executed on a 2.71 GHz Intel(R) Core(TM) personal computer with 12 GB RAM under MATLAB 2016a. In order to make a fair comparison, I-GWO is compared with some commonly used parameter extraction methods in the literature. These are ABC [20], ABSO [21], BBO-M [22], BFA [23], BMO [24], GGHS [25], GOTLBO [26], IWOA [27], PS [28], SA [29] and SATLBO [30]. It should be noted that the involved methods use the same experimental I–V data along with the same PV cell models.
The main objective for the parameter extraction of PV cells is to find a set of parameter values to minimize the errors between the current (fitted from the mathematical PV cell model) and the current (observed from the physical PV cell) [57]. Generally, the root mean squared error in Equation (19) is used as the objective function in the literature [50,58]. The lower RMSE, the more accurate parameter values. In this equation, is the number of experimental data and denotes the set of the extracted parameters. for the single-diode model, for the double-diode model and for the three-diode model. The sum of individual absolute errors , expressed in Equation (20), is also utilized for evaluating the goodness-of-fit results [57].
4.1. Experimental Results on the Single-Diode Model of the PV Cell
The values of current and power calculated by the I-GWO algorithm for the single-diode model of the PV cell are presented in Table 2. The individual absolute errors are also included in this table. According to these results, it is clear that the current and power data generated by I-GWO are highly coinciding with the measured data. The sums of IAEs are found as 0.02152728 A and 0.00873095 W for IL-calculated and PL-calculated, respectively. In case of examining the goodness-of-fit results and the extracted parameters presented in Table 3 and Table 4, respectively, it can be easily inferred that I-GWO achieves the least value of RMSE with 9.8602 × 10⁻⁴ A. Its design coefficients are obtained as 0.76077561 A for Iph, 0.32302197 μA for Isd, 0.03637706 Ω for Rs, 53.71770917 Ω for Rsh and 1.48118398 for n. In addition, I-GWO is, respectively, followed by BMO, BBO-M, GOTLBO, SATLBO, GGHS, ABSO, IWOA, ABC, SA and PS on the basis of achieving lower RMSE. On the other hand, BFA provides the greatest value of RMSE with 2.1887 × 10⁻¹ A.
Table 2.
IAEs of I-GWO for the single-diode model of the PV cell.
Table 3.
Comparison of the goodness-of-fit results achieved by I-GWO for the single-diode model of the PV cell.
Table 4.
Comparison of the parameters extracted by I-GWO for the single-diode model of the PV cell.
The I–V and P–V characteristic curves based on the extracted parameters of I-GWO are illustrated in Figure 5. It can be concluded from this figure that the I-GWO algorithm has the high capability for representing the actual photovoltaic cell characteristics for the single-diode model of the PV cell.
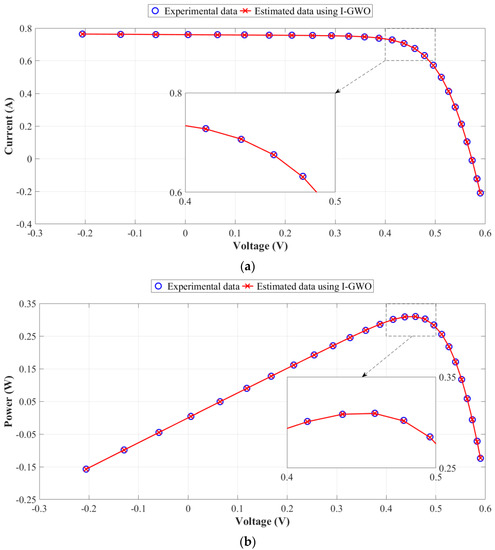
Figure 5.
Comparison of experimental and estimated photovoltaic cell characteristics for the single-diode model of the PV cell (a) I–V characteristics (b) P–V characteristics.
4.2. Experimental Results on the Double-Diode Model of the PV Cell
The values of current and power calculated by the I-GWO algorithm for the double-diode model of the PV cell are listed in Table 5. The individual absolute errors are also given in this table. With respect to these results, it is obvious that the current and power data generated by I-GWO are in very good agreement with the measured data. The sums of IAEs are found as 0.02127500 A and 0.00877613 W for IL-calculated and PL-calculated, respectively. In the case of investigating the goodness-of-fit results and the extracted parameters listed in Table 6 and Table 7, respectively, it can be simply revealed that I-GWO accomplishes the smallest RMSE value with 9.824852 × 10⁻⁴ A. Its design coefficients are acquired as 0.76078188 A for Iph, 0.22628489 μA for Isd1, 0.74609152 μA for Isd2, 0.03673977 Ω for Rs, 55.46161769 Ω for Rsh, 1.45112760 for n1 and 1.99999856 for n2. In any case, I-GWO is sequentially followed by BMO, BBO-M, SATLBO, GOTLBO, ABSO, IWOA, GGHS, ABC, PS and SA in terms of accomplishing lower RMSE. However, BFA produces the biggest RMSE value with 2.9827 × 10⁻¹ A.
Table 5.
IAEs of I-GWO for the double-diode model of the PV cell.
Table 6.
Comparison of the goodness-of-fit results achieved by I-GWO for the double-diode model of the PV cell.
Table 7.
Comparison of the parameters extracted by I-GWO for the double-diode model of the PV cell.
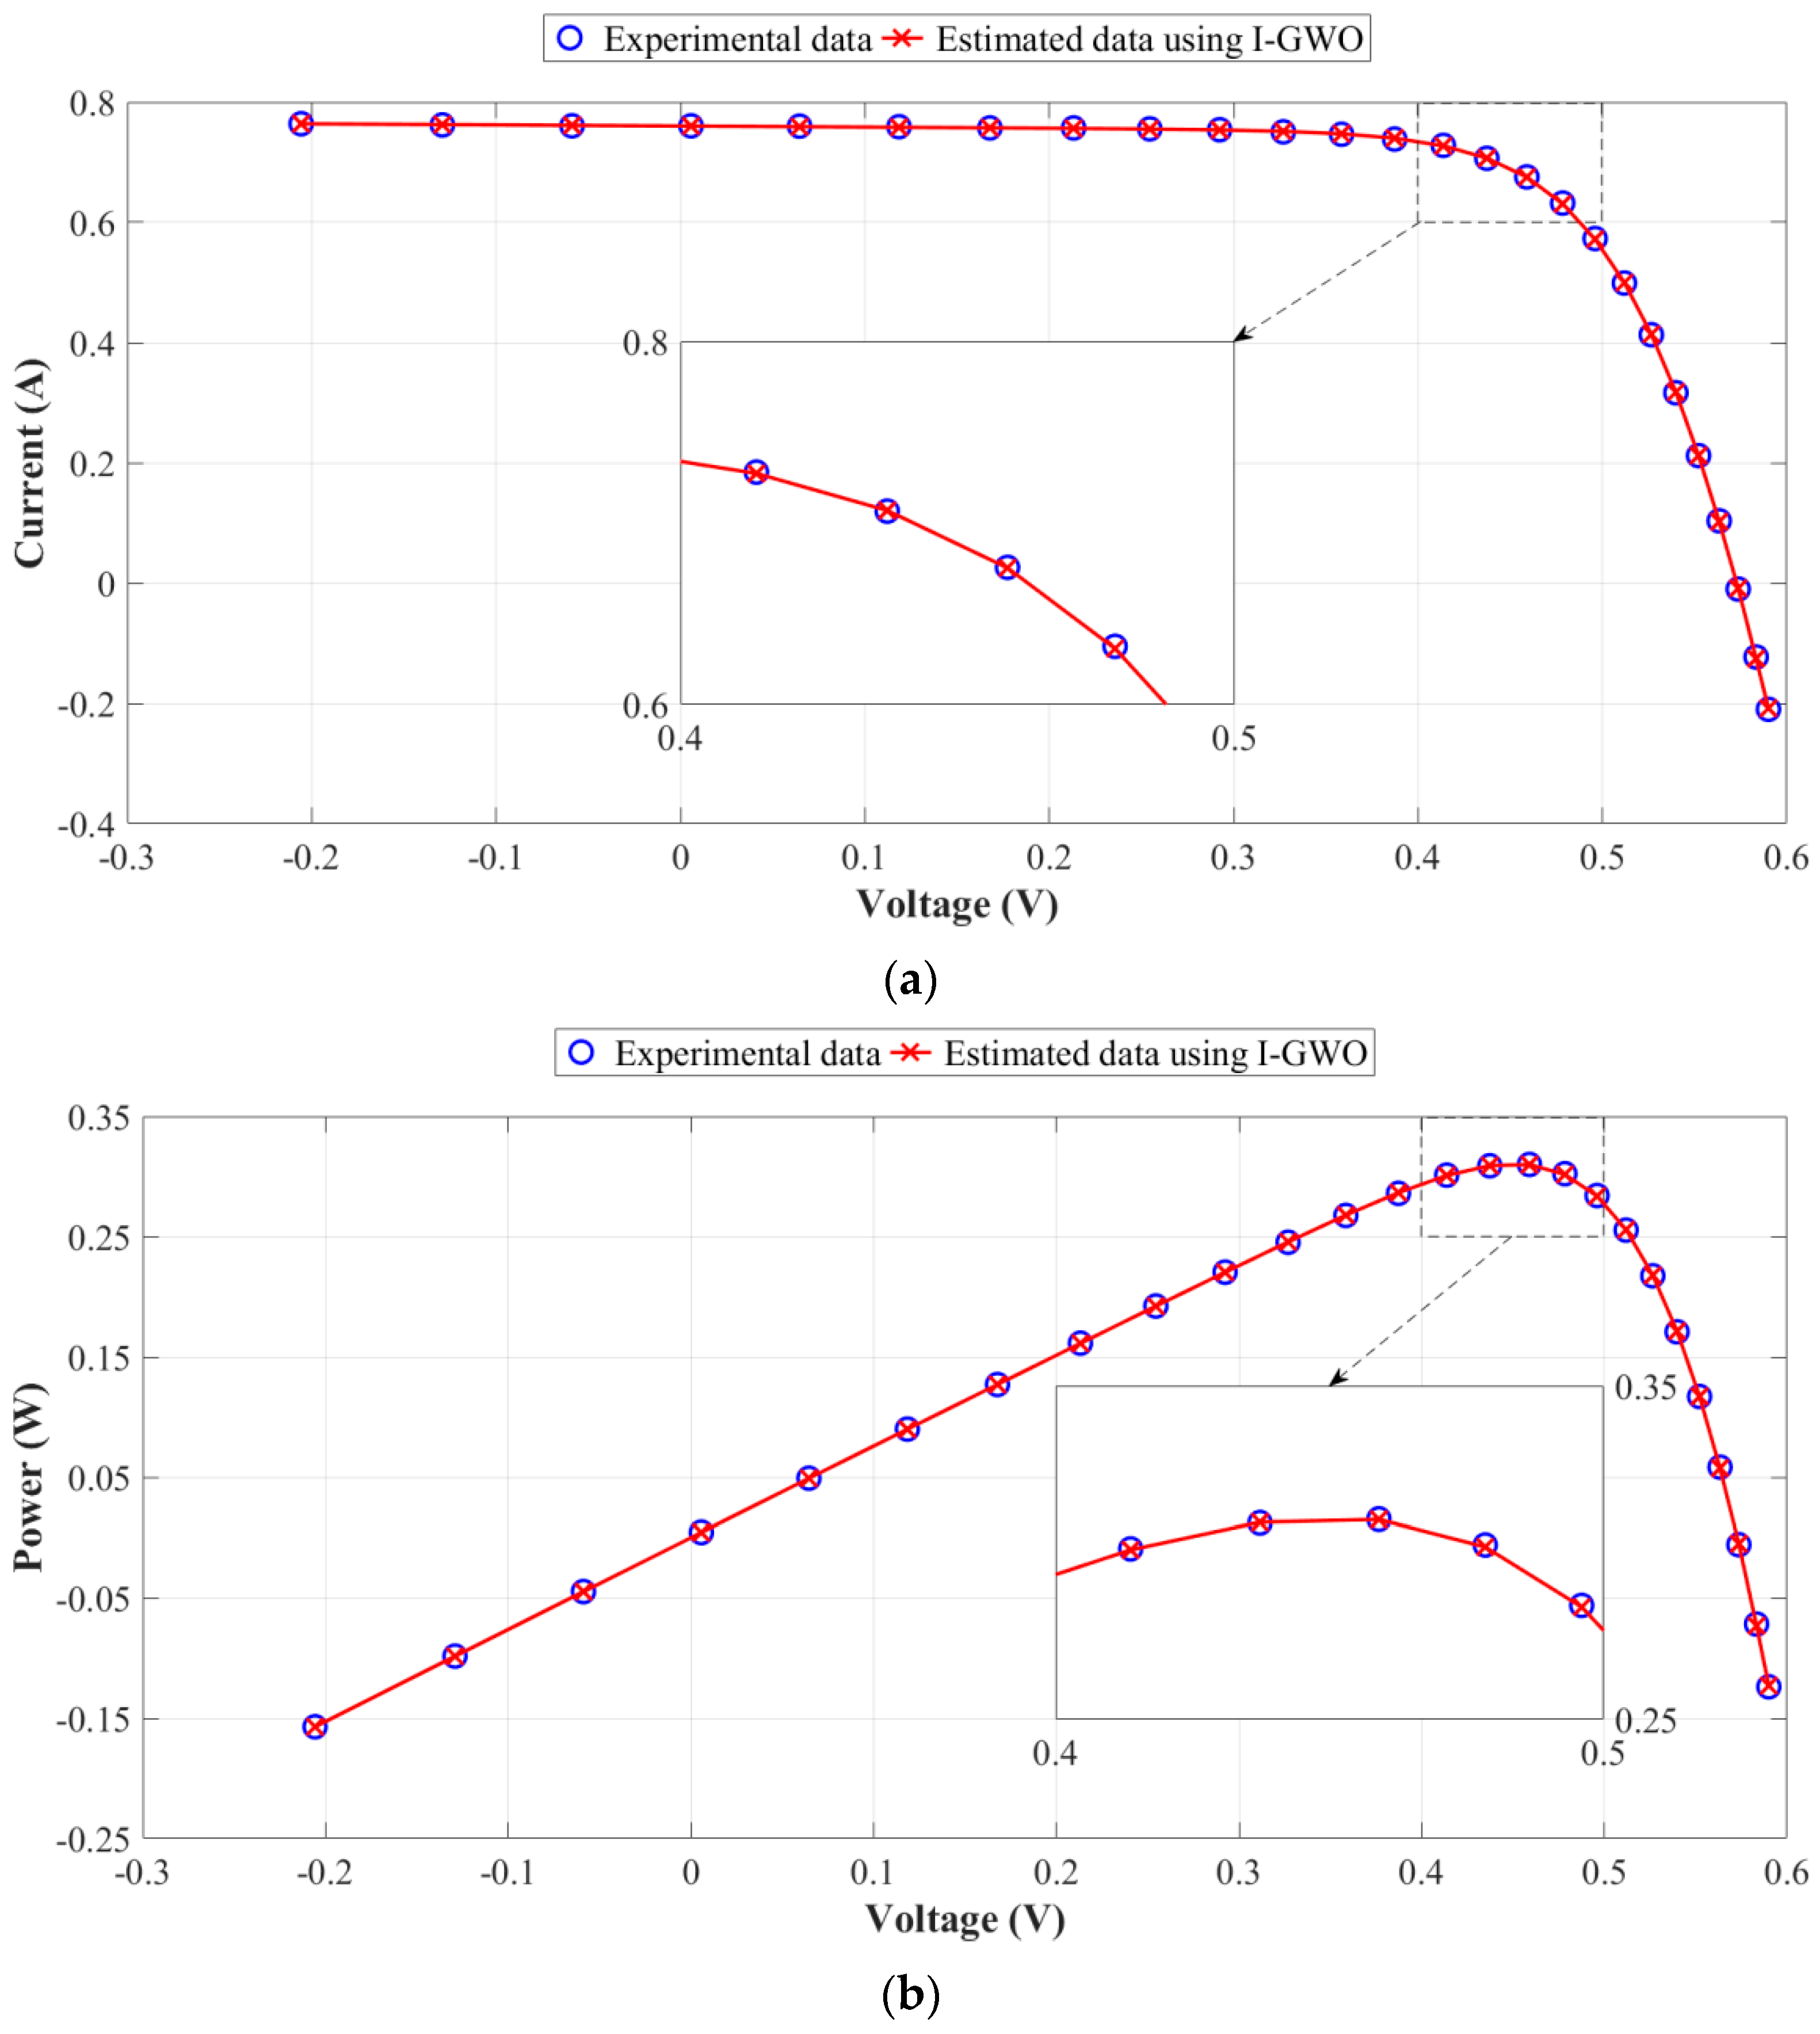
The I–V and P–V characteristic curves based on the extracted parameters of I-GWO are depicted in Figure 6. It can be deduced from this figure that the I-GWO algorithm has the strong ability to represent the real photovoltaic cell characteristics for the double-diode model of the PV cell.
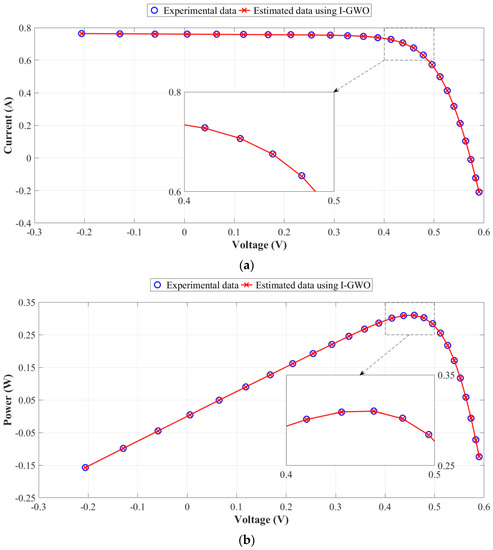
Figure 6.
Comparison of experimental and estimated photovoltaic cell characteristics for the double-diode model of the PV cell (a) I–V characteristics (b) P–V characteristics.
4.3. Experimental Results on the Three-Diode Model of the PV Cell
The values of current and power calculated by the I-GWO algorithm for the three-diode model of the PV cell are tabulated in Table 8. The individual absolute errors are also provided in this table. In light of these results, it is prominent that the current and power data generated by I-GWO shows the accurate representation of the measured data. The sums of IAEs are found as 0.02128348 A and 0.00877126 W for IL-calculated and PL-calculated, respectively. In addition, the RMSE value of I-GWO is observed as 9.8251 × 10⁻⁴ A. Its design coefficients are computed as 0.76077859 A for Iph, 0.23252760 μA for Isd1, 0.15049885 μA for Isd2, 0.54357543 μA for Isd3, 0.03670937 Ω for Rs, 55.38534211 Ω for Rsh, 1.45341362 for n1, 1.99896779 for n2 and 1.99998944 for n3. It should be noted that the three-diode model of the PV cell has recently been proposed as an alternative to single-diode and double-diode models, particularly for the modeling of solar cells in industrial applications [54]. For this reason, there have not been enough studies in the literature in order to make the benchmark test for the three-diode-based modeling of the commercial silicon solar cell of R.T.C. France, yet.
Table 8.
IAEs of I-GWO for the three-diode model of the PV cell.
The I–V and P–V characteristic curves based on the extracted parameters of I-GWO are visualized in Figure 7. It can be mined from this figure that the I-GWO algorithm has the great potential in reflecting the physical photovoltaic cell behavior for the three-diode model of the PV cell.

Figure 7.
Comparison of experimental and estimated photovoltaic cell characteristics for the three-diode model of the PV cell (a) I–V characteristics (b) P–V characteristics.
4.4. Discussion on the Single-Diode-, Double-Diode- and Three-Diode-Based Modeling Results of PV Cells
In the case of comparing the entire goodness-of-fit results achieved by the I-GWO algorithm on the R.T.C. France solar cell, the double-diode model outperforms the single-diode and three-diode models with an RMSE value of 9.824852 × 10⁻⁴ A. Following from this, the three-diode model is found to be better than the single-diode model with the RMSE value of 9.8251 × 10⁻⁴ A. Lastly, the RMSE value of the single-diode model is obtained as 9.8602 × 10⁻⁴ A. Moreover, Figure 8 shows the convergence accuracy of I-GWO for single-diode, double-diode and three-diode models of PV cells. According to this figure, it is observed during the iteration process that the relative stability of the objective function occurs around 7500 iterations in all of the diode models. It is also obvious that I-GWO is capable of running away from the local optima and accelerating the global searching direction. Especially, I-GWO surpasses ABC, ABSO, BBO-M, BFA, BMO, GGHS, GOTLBO, IWOA, PS, SA and SATLBO by achieving the least RMSE value in both single-diode and double-diode models. Despite the parametric values identified by the mentioned models seems to be very close each other, a small difference can lead a considerable effect on the PV model. As a result, the above comparisons indicate that the I-GWO algorithm is highly competitive in the estimation of the internal parameters of photovoltaic cells.
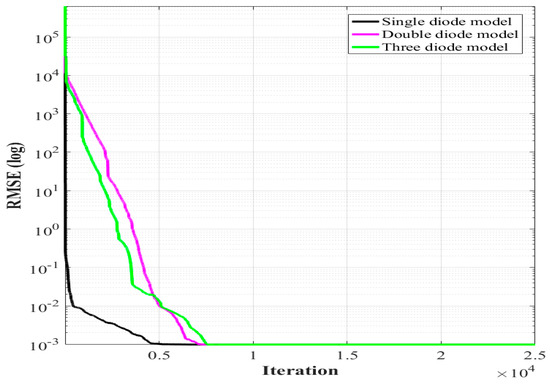
Figure 8.
The convergence curves for single-diode, double-diode and three-diode models of PV cells.
5. Experimental Results on the PV Modules
In this section, the I-GWO algorithm is applied to the two benchmark test models involving single-diode- and double-diode-based models in order to check its performance on the parameter extraction problem of PV module models. The experimental I–V data were taken from [56]. The relevant solar module (Photowatt-PWP201) consists of 36 polycrystalline silicon cells in series operating under 1000 W/m2 at 45 °C. The search ranges for the unknown internal parameters of the mentioned benchmark test models are tabulated in Table 9.
Table 9.
The search ranges for the parameters of photovoltaic module models.
The parameter settings of I-GWO and the technical specifications of PC are the same as those used in the PV cell models. For a reasonable comparison, I-GWO is checked against some widely-reported algorithms in the literature. These are artificial bee colony-differential evolution (ABC-DE) [59], chaos particle swarm optimization (CPSO) [60], flower pollination algorithm (FPA) [61], hybrid firefly and pattern search (HFAPS) [32], improved teaching–learning-based optimization (ITLBO) [3], IWOA [27], multiple learning backtracking search algorithm (LBSA) [62], PS [28], SA [29] and teaching–learning-based optimization (TLBO) [63]. The objective function in Equation (19) and the goodness-of-fit metric in Equation (20) are employed again. Only the output current equations expressed in Equations (21) and (22) [24,64] are considered for the single-diode- and double-diode-based models of PV modules, respectively. According to these equations, the I–V characteristics of single-diode- and double-diode-based models of PV modules make use of the number of parallel PV cell strings (), each having the same number of series PV cells string ().
5.1. Experimental Results on the Single-Diode-Based Model of the PV Module
The values of current and power calculated by the I-GWO algorithm for the single-diode-based model of the PV module are presented in Table 10. The individual absolute errors are also included in this table. According to these results, it is clear that the current and power data generated by I-GWO coincide to a great extent with the measured data. The sums of IAEs are found as 0.04892353 A and 0.51689196 W for IL-calculated and PL-calculated, respectively. In the case of examining the goodness-of-fit results and the extracted parameters presented in Table 11 and Table 12, respectively, it can be easily inferred that I-GWO achieves the least value of RMSE with 2.425075 × 10⁻³ A. Its design coefficients are obtained as 1.03051453 A for Iph, 3.48217802 μA for Isd, 1.20127379 Ω for Rs, 981.95296539 Ω for Rsh and 48.64274143 for n. In addition, I-GWO is, respectively, followed by HFAPS, ITLBO, IWOA, LBSA, FPA, ABC-DE, SA, CPSO, PS and TLBO on the basis of achieving lower RMSE. On the other hand, TLBO provides the most value of RMSE with 6.567087 × 10⁻³ A.
Table 10.
IAEs of I-GWO for the single-diode-based model of the PV module.
Table 11.
Comparison of the goodness-of-fit results achieved by I-GWO for the single-diode-based model of the PV module.
Table 12.
Comparison of the parameters extracted by I-GWO for the single-diode-based model of the PV module.
The I–V and P–V characteristic curves based on the extracted parameters of I-GWO are illustrated in Figure 9. It can be concluded from this figure that the I-GWO algorithm has the high capability of representing the actual photovoltaic module characteristics for the single-diode-based model of the PV module.
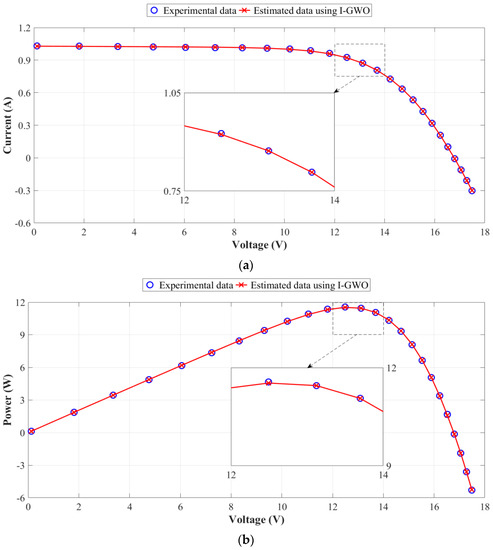
Figure 9.
Comparison of experimental and estimated photovoltaic module characteristics for the single-diode-based model of the PV module (a) I–V characteristics (b) P–V characteristics.
5.2. Experimental Results on the Double-Diode-Based Model of the PV Module
The values of current and power calculated by the I-GWO algorithm for the double-diode-based model of the PV module are listed in Table 13. The individual absolute errors are also given in this table. With respect to these results, it is obvious that the current and power data generated by I-GWO are in very good agreement with the measured data. The sums of IAEs are found as 0.04768683 A and 0.49347099 W for IL-calculated and PL-calculated, respectively. In addition, the RMSE value of I-GWO is observed as 2.356117 × 10⁻³ A. Its design coefficients are acquired as 1.03046641 A for Iph, 3.59574773 × 10⁻¹⁰ μA for Isd1, 3.09030003 μA for Isd2, 1.27844165 Ω for Rs, 1002.52197130 Ω for Rsh, 18.96309472 for n1 and 48.32865669 for n2. It should be noted that the double-diode-based modeling of the PV module has been conducted as an alternative to the single-diode-based modeling in recent years, and it has limited applications in the corresponding literature [65]. For this reason, there have not yet been enough studies in order to make the benchmark test for the double-diode-based modeling of the polycrystalline silicon solar module of Photowatt-PWP201.
Table 13.
IAEs of I-GWO for the double-diode-based model of the PV module.
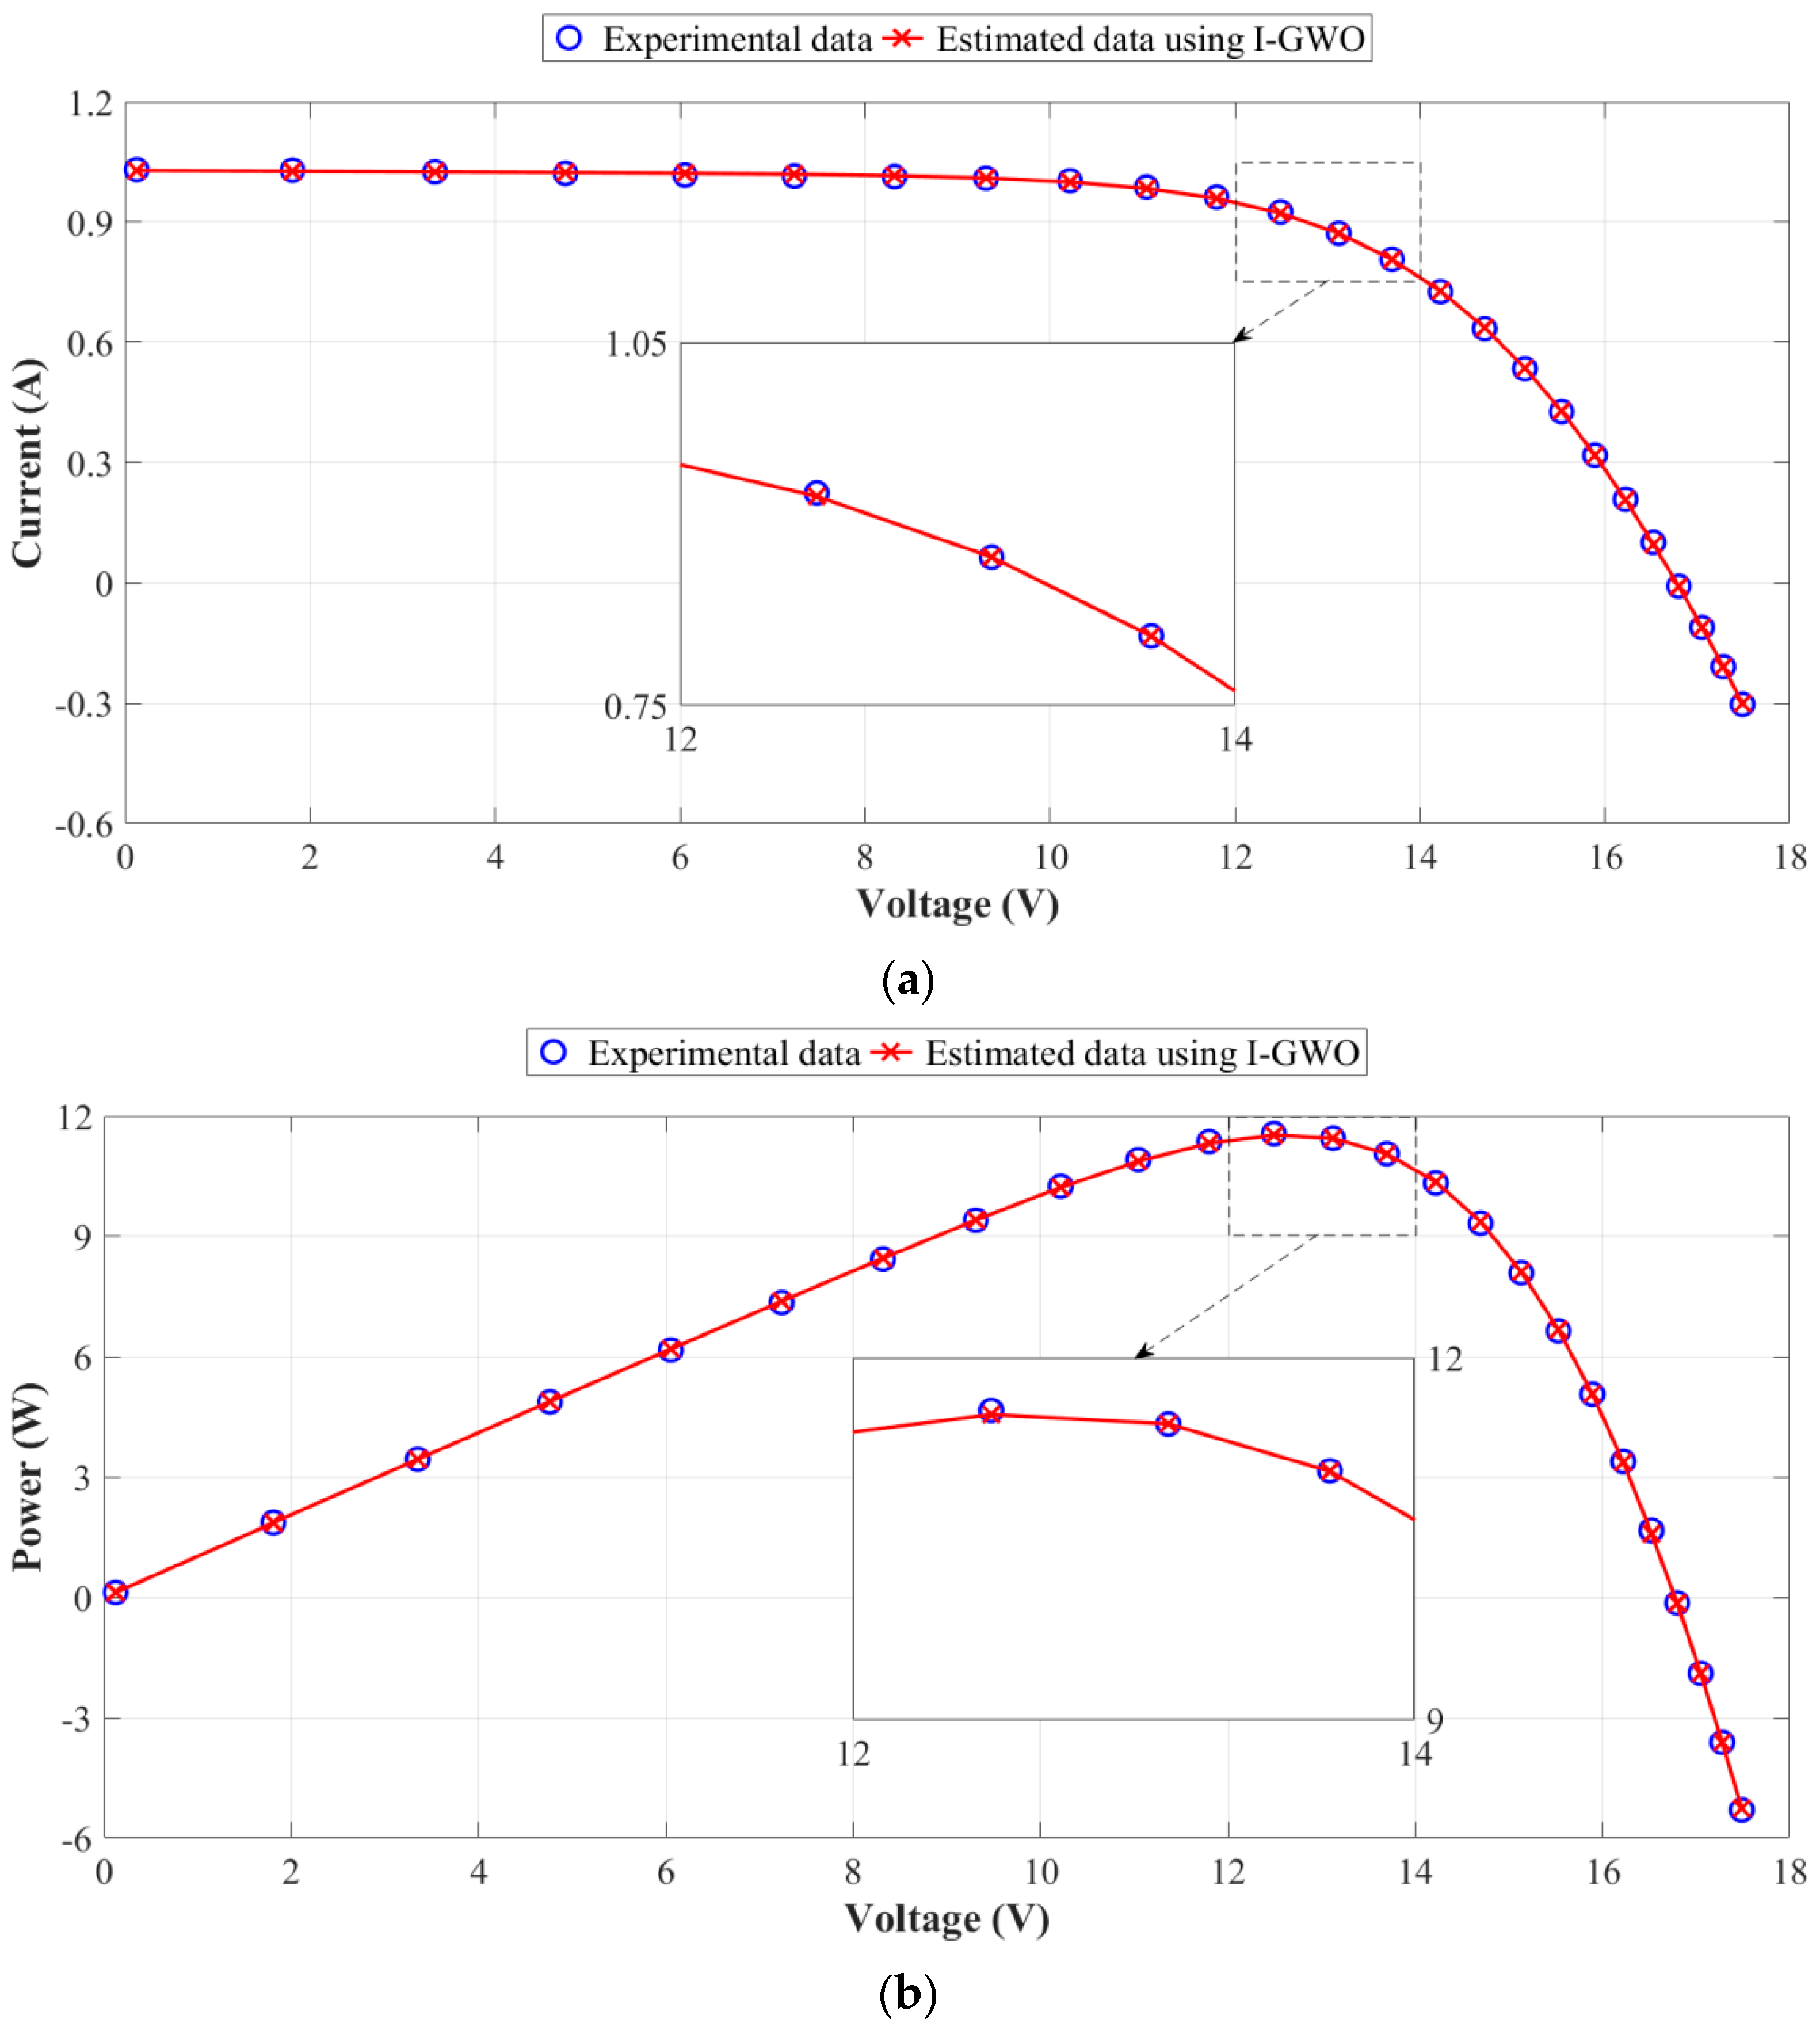
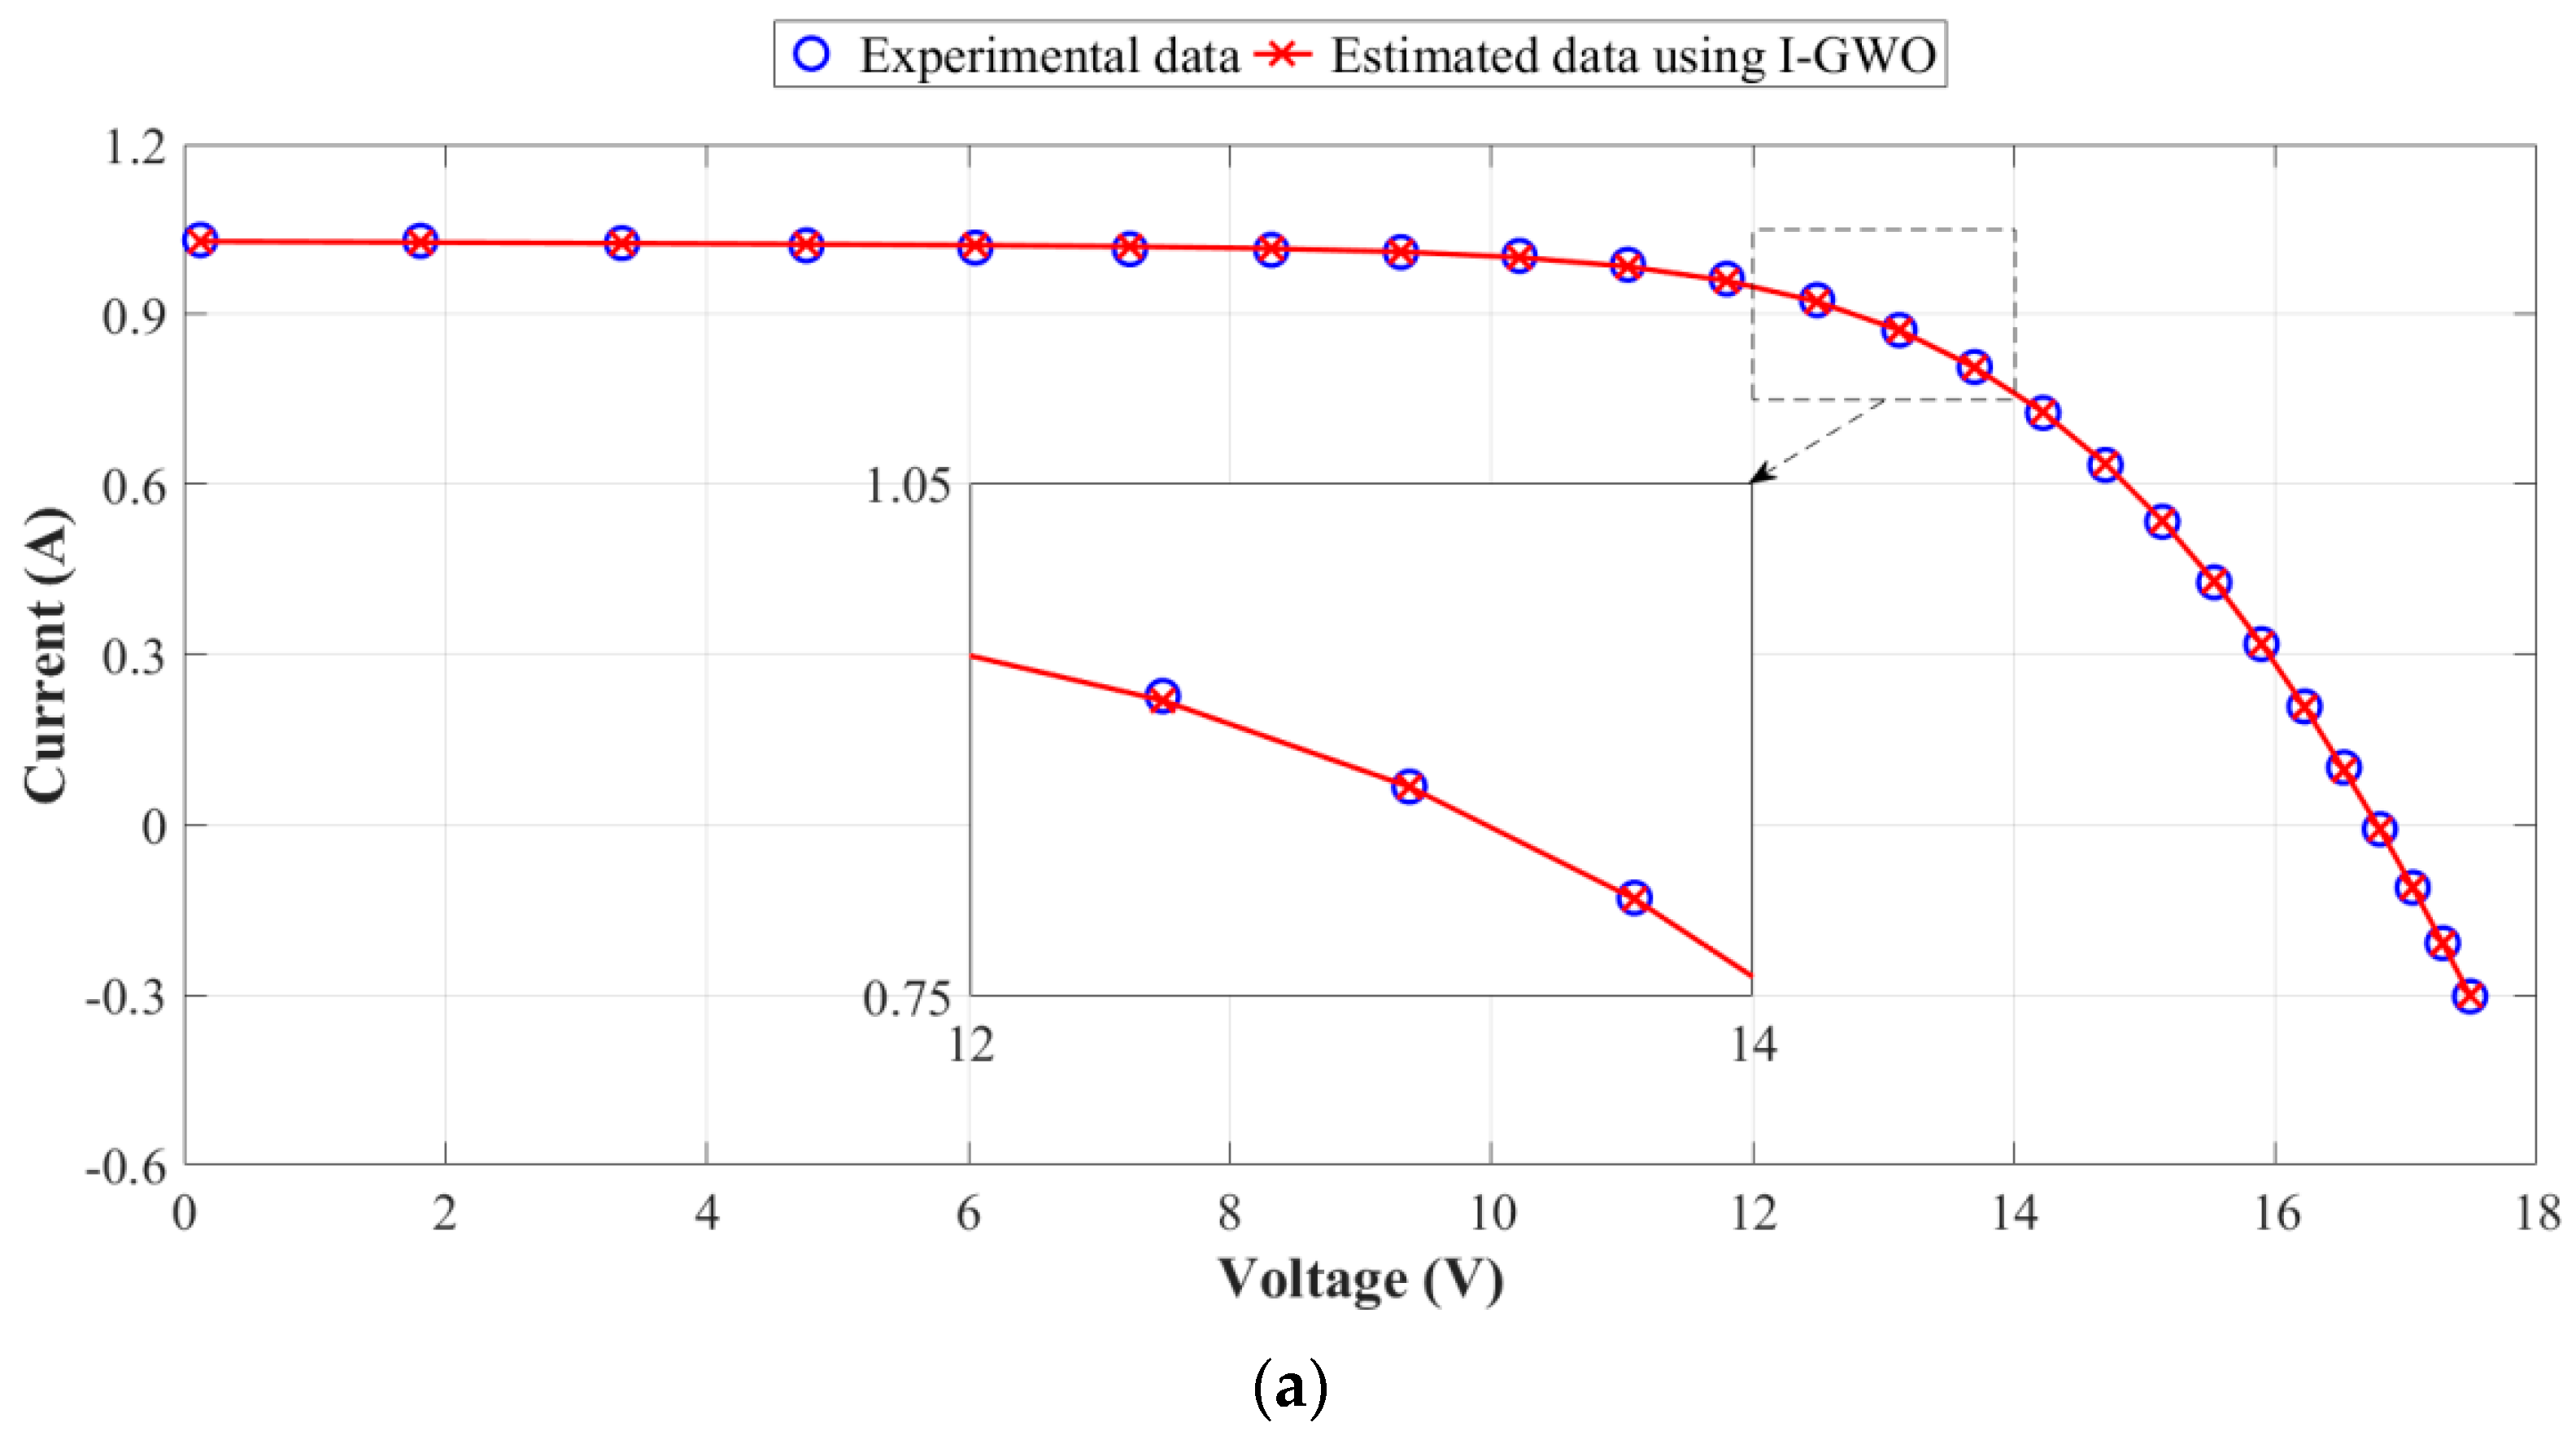
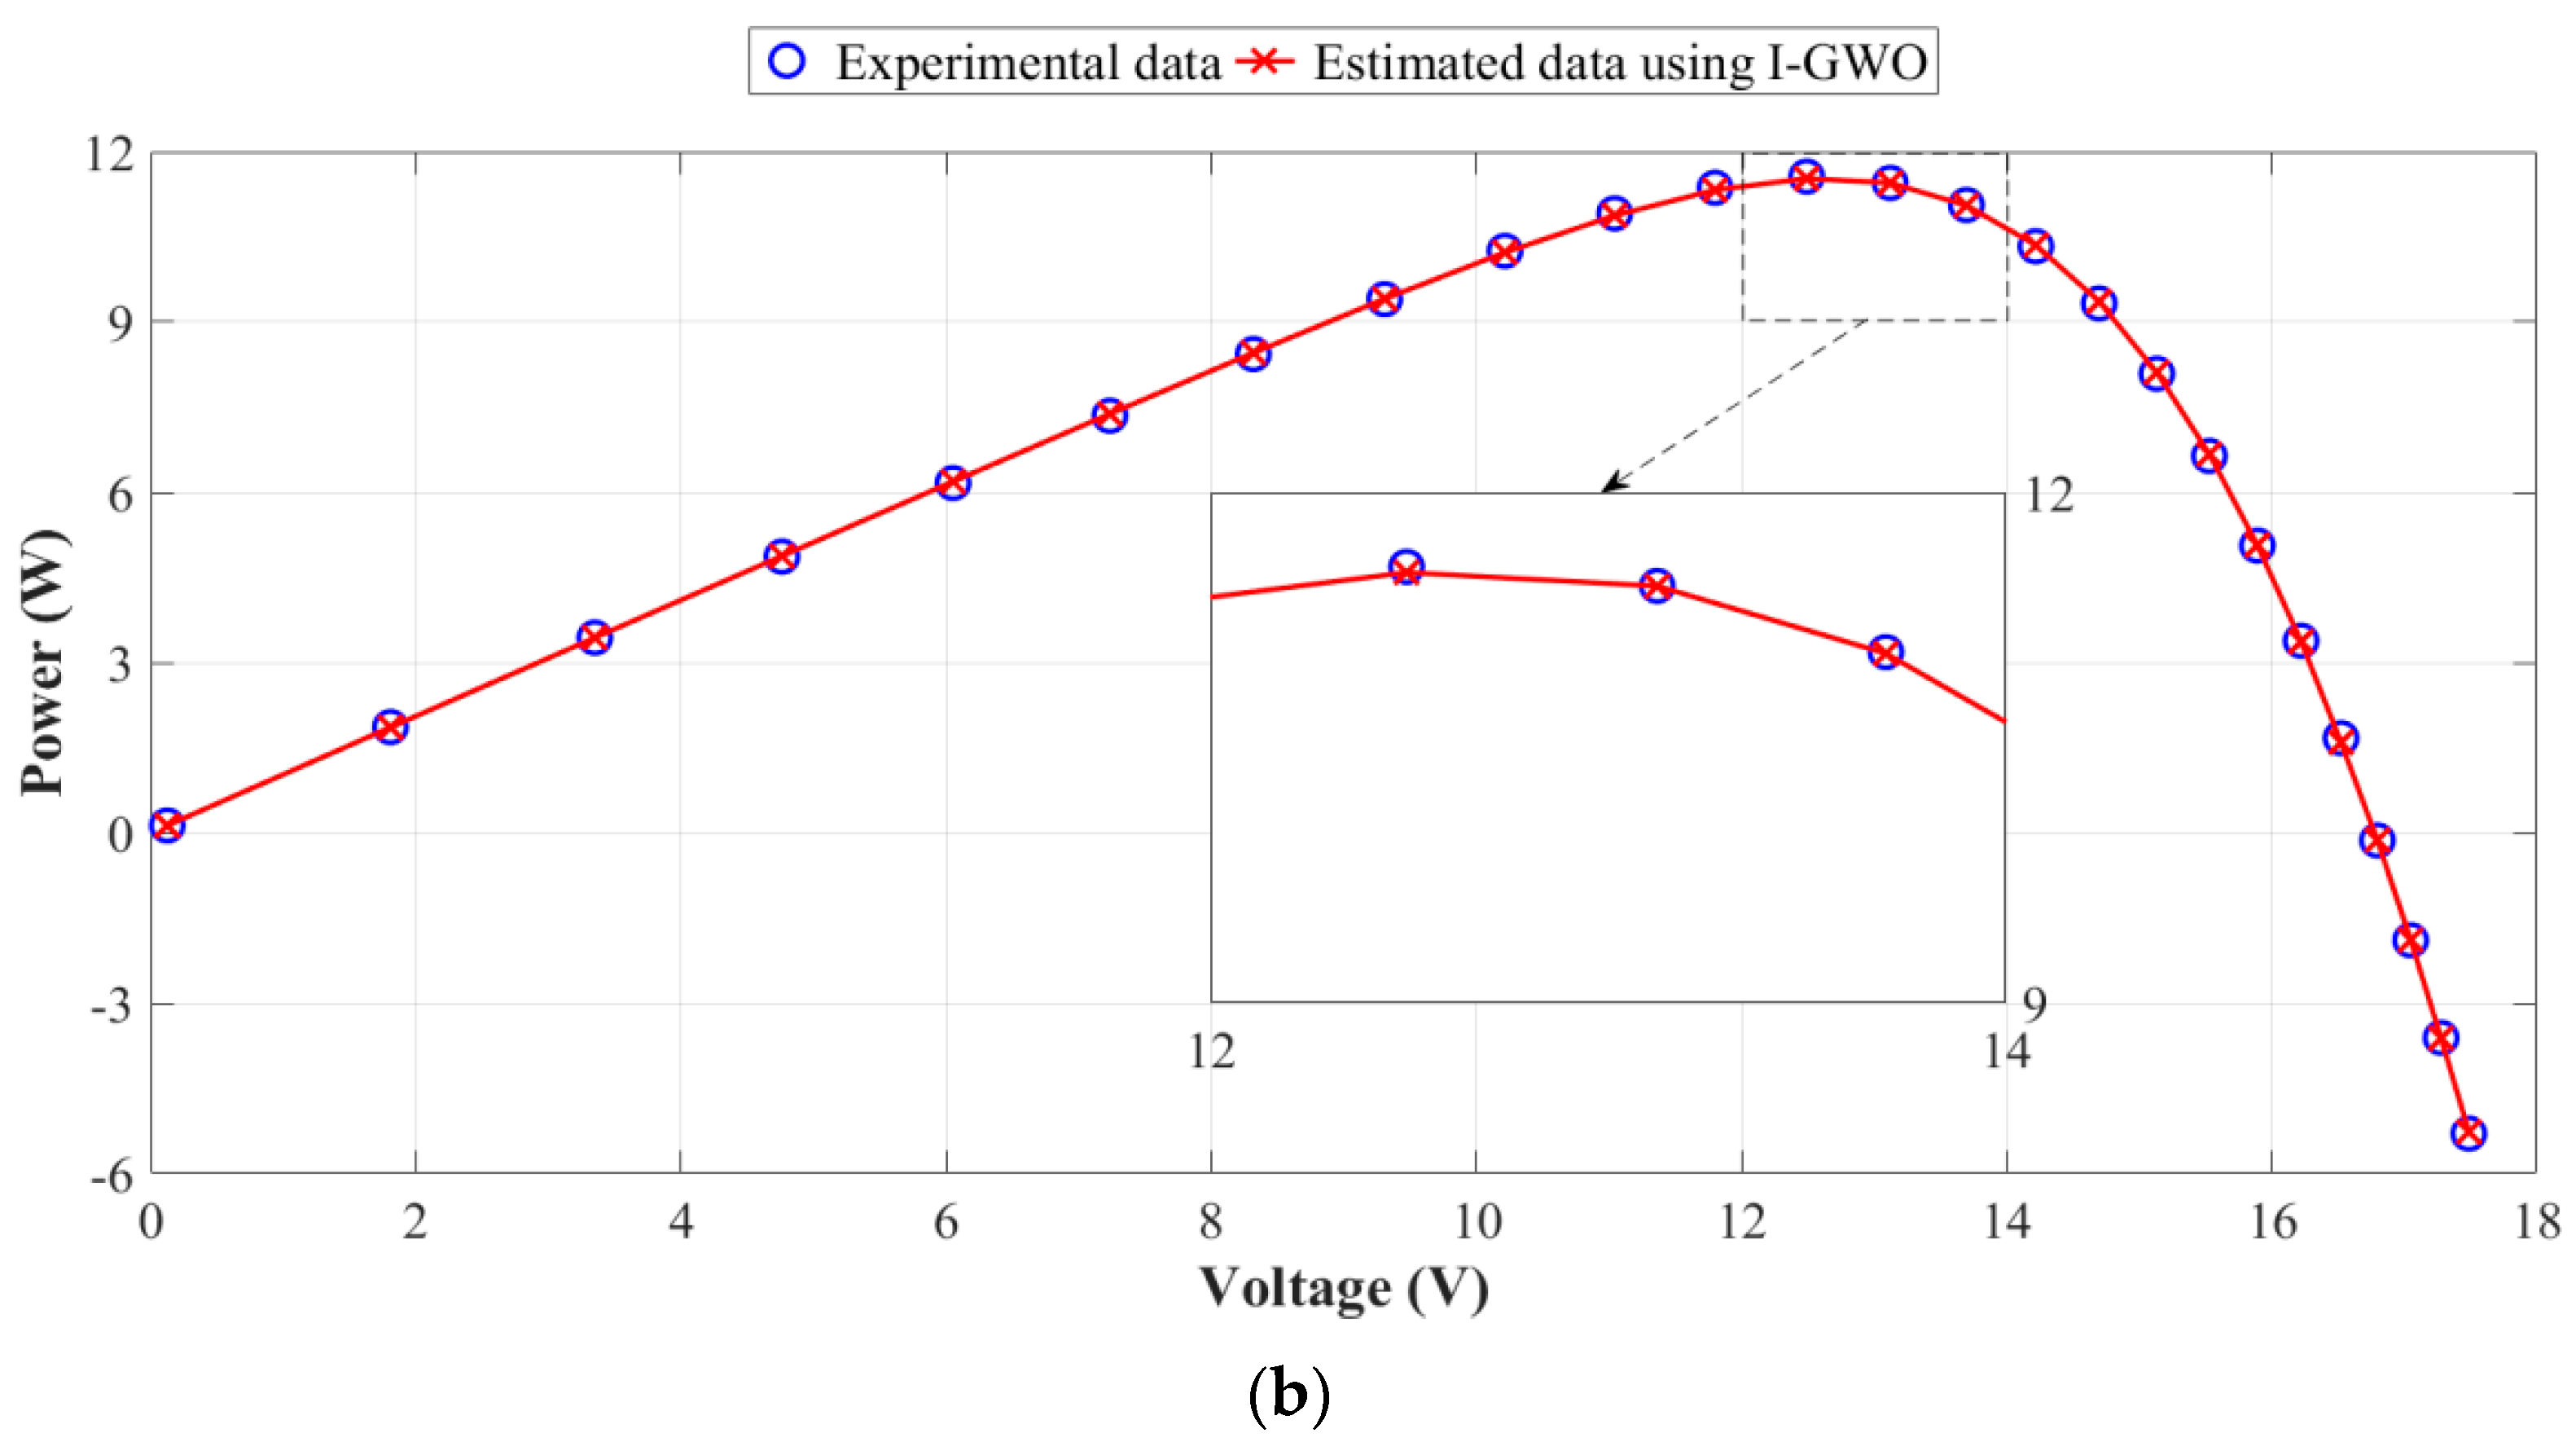
The I–V and P–V characteristic curves based on the extracted parameters of I-GWO are depicted in Figure 10. It can be deduced from this figure that the I-GWO algorithm has the strong ability to represent the real photovoltaic module characteristics for the double-diode-based model of the PV module.

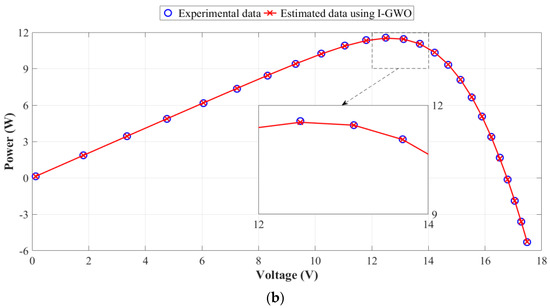
Figure 10.
Comparison of experimental and estimated photovoltaic module characteristics for the double-diode-based model of the PV module (a) I–V characteristics (b) P–V characteristics.
5.3. Discussion on the Single-Diode- and Double-Diode-Based Modeling Results of PV Modules
In the case of comparing the entire goodness-of-fit results accomplished by the I-GWO algorithm on the Photowatt-PWP201 solar module, the double-diode-based model surpasses the single-diode-based model with the RMSE value of 2.356117 × 10⁻³ A. The RMSE value of the single-diode-based model is computed as 2.425075 × 10⁻³ A. Furthermore, Figure 11 demonstrates the convergence accuracy of I-GWO for single-diode- and double-diode-based models of PV modules. With regard to this figure, it is clear that I-GWO has the capability of breaking away from the local minima and providing an encouraging searching direction towards the global optima. In consequence, the comparison results show that the I-GWO algorithm seems to be very efficient for solving the parameter estimation problem of photovoltaic modules.
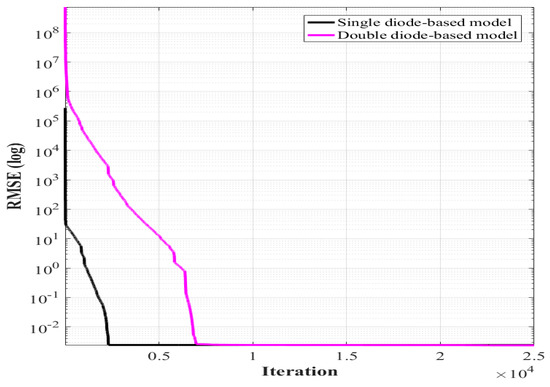
Figure 11.
The convergence curves for single-diode- and double-diode-based models of PV modules.
6. Discussion of the Overall Results
As a deeper accuracy analysis, in Table 14, the grey wolf optimizer with dimension learning-based hunting search strategy is compared with other algorithms, which were published in the last five years.
Table 14.
Comparison of I-GWO with other recently published algorithms (the lowest errors are highlighted in boldface).
For the single-diode model of R.T.C. France PV cell, I-GWO achieves the best RMSE (9.8602 × 10⁻⁴) similar to CSO, CWOA, DE-WOA, EHHO, ISCE, ORcr-IJADE, PGJAYA, SGDE and TLABC. It also shows better RMSE than CARO, GWO, GWOCS, IJAYA, MABC, MSSO and NM-PSO.
For the double-diode model of R.T.C. France PV cell, DE-WOA and ISCE obtain the best RMSE (9.824849 × 10⁻⁴). I-GWO provides the second best RMSE (9.824852 × 10⁻⁴), which is better than CARO, CSO, CWOA, EHHO, GWO, GWOCS, IJAYA, MABC, MSSO, NM-PSO, ORcr-IJADE, PGJAYA, SGDE and TLABC.
For the single-diode-based model of Photowatt-PWP201 PV module, I-GWO accomplishes the best RMSE (2.425075 × 10⁻³) similar to DE-WOA, ISCE, ORcr-IJADE, PGJAYA, SGDE and TLABC. It also demonstrates better RMSE than CARO, EHHO, GWO, GWOCS, IJAYA and NM-PSO.
According to the aforementioned comparisons, it can be observed that I-GWO can achieve the best solution performance or slightly different results from the best solution performance. In addition, it can be also revealed that I-GWO can provide better solution performance than most of the implemented algorithms.
7. Conclusions
In this paper, the grey wolf optimizer with a dimension learning-based hunting search strategy is exhaustively applied to extract the internal parameters of the diode circuit models of photovoltaic cells and modules. As a result of the entire analyses, the following reasonable and useful patterns are uncovered.
According to the experimental results on the PV cells:
- The single-diode model- and the double-diode model-based I-GWO algorithms achieve better goodness-of-fit statistics than ABC, ABSO, BBO-M, BFA, BMO, GGHS, GOTLBO, IWOA, PS, SA and SATLBO methods. The double-diode model-based I-GWO algorithm outperforms the single-diode model-based one.
- Although the single-diode and the double-diode circuit models are widely preferred for PV cells in the literature, the three-diode model-based I-GWO algorithm shows closer solution accuracy to the double-diode model-based one.
- In the case of only considering the recent publications on this issue, the I-GWO algorithm ensures the best RMSE, similar to most of the implemented methods for the single-diode circuit model. However, it provides the second best RMSE for the double-diode circuit model.
- According to the experimental results on the PV modules:
- The single-diode model-based I-GWO algorithm accomplishes better goodness-of-fit statistics than ABC-DE, CPSO, FPA, HFAPS, ITLBO, IWOA, PS, SA and TLBO methods.
- Despite the single-diode circuit model is widely employed for PV modules in the literature, the double-diode model-based I-GWO algorithm demonstrates better solution accuracy than the single-diode model-based one.
- When only taking into account the recent publications on this problem, the I-GWO algorithm provides the best RMSE, similar to most of the applied methods for the single-diode circuit model.
As a result, the I-GWO algorithm shows the considerable effectiveness in terms of accuracy, robustness and solution quality aspects in solving the parameter extraction problem of PV cells and modules. Hence, it can be regarded as a competitive method in order to obtain the I–V and P–V curves strongly fitted to the experimental measurements. In future works, the three-diode circuit model in PV cell modeling and the double-diode circuit model in PV module modeling should get more attention in order to improve parameter extraction performance. I-GWO can be modified to accomplish the online parameter estimation for more efficient photovoltaic systems. In addition, the applications of I-GWO to other engineering problems, such as fault diagnosis, photovoltaic power prediction, the power curve modeling of wind turbines, the energy consumption modeling of large-scale power systems, etc. are also interesting for future research.
Funding
No source of funding was attained for this research activity.
Institutional Review Board Statement
Not applicable.
Informed Consent Statement
Not applicable.
Data Availability Statement
Not applicable.
Conflicts of Interest
The author declares no conflict of interest.
Abbreviations
| ABC | Artificial bee colony optimization |
| ABC-DE | Artificial bee colony-differential evolution |
| ABSO | Artificial bee swarm optimization |
| BBO-M | Biogeography-based optimization with mutation strategies |
| BFA | Bacterial foraging algorithm |
| BMO | Bird mating optimizer |
| CPS | Chaos particle swarm optimization |
| FPA | Flower pollination algorithm |
| GGHS | Grouping-based global harmony search |
| GOTLBO | Generalized oppositional teaching–learning-based optimization |
| GWO | Grey wolf optimizer |
| HFAPS | Hybrid firefly and pattern search |
| IAE | Individual absolute error |
| I-GWO | Grey wolf optimizer with dimension learning-based hunting search strategy |
| ITLBO | Improved teaching–learning-based optimization |
| IWOA | Improved whale optimization algorithm |
| LBSA | Learning backtracking search algorithm |
| PS | Pattern search |
| RMSE | Root mean squared error |
| SA | Simulated annealing |
| SATLBO | Self-adaptive teaching–learning-based optimization |
| TLBO | Teaching–learning-based optimization |
References
- Renewables 2020 Global Status Report. Available online: https://www.ren21.net/gsr-2020 (accessed on 1 August 2021).
- Humada, A.M.; Hojabri, M.; Mekhilef, S.; Hamada, H.M. Solar cell parameters extraction based on single and double-diode models: A review. Renew. Sustain. Energy Rev. 2016, 56, 494–509. [Google Scholar] [CrossRef] [Green Version]
- Li, S.; Gong, W.; Yan, X.; Hu, C.; Bai, D.; Wang, L.; Gao, L. Parameter extraction of photovoltaic models using an improved teaching-learning-based optimization. Energy Convers. Manag. 2019, 186, 293–305. [Google Scholar] [CrossRef]
- Abbassi, R.; Abbassi, A.; Jemli, M.; Chebbi, S. Identification of unknown parameters of solar cell models: A comprehensive overview of available approaches. Renew. Sustain. Energy Rev. 2018, 90, 453–474. [Google Scholar] [CrossRef]
- Wang, J.; Yang, B.; Li, D.; Zeng, C.; Chen, Y.; Guo, Z.; Zhang, X.; Tan, T.; Shu, H.; Yu, T. Photovoltaic cell parameter estimation based on improved equilibrium optimizer algorithm. Energy Convers. Manag. 2021, 236, 114051. [Google Scholar] [CrossRef]
- Merchaoui, M.; Sakly, A.; Mimouni, M.F. Particle swarm optimisation with adaptive mutation strategy for photovoltaic solar cell/module parameter extraction. Energy Convers. Manag. 2018, 175, 151–163. [Google Scholar] [CrossRef]
- Fathy, A.; Rezk, H. Parameter estimation of photovoltaic system using imperialist competitive algorithm. Renew. Energy 2017, 111, 307–320. [Google Scholar] [CrossRef]
- Blaifi, S.; Moulahoum, S.; Taghezouit, B.; Saim, A. An enhanced dynamic modeling of PV module using Levenberg-Marquardt algorithm. Renew. Energy 2019, 135, 745–760. [Google Scholar] [CrossRef]
- Gao, X.; Cui, Y.; Hu, J.; Tahir, N.; Xu, G. Performance comparison of exponential, Lambert W function and Special Trans function based single diode solar cell models. Energy Convers. Manag. 2018, 171, 1822–1842. [Google Scholar] [CrossRef]
- Et-Torabi, K.; Nassar-Eddine, I.; Obbadi, A.; Errami, Y.; Rmaily, R.; Sahnoun, S.; El-Fajri, A.; Agunaou, M. Parameters estimation of the single and double diode photovoltaic models using a Gauss-Seidel algorithm and analytical method: A comparative study. Energy Convers. Manag. 2017, 148, 1041–1054. [Google Scholar] [CrossRef]
- Elbaset, A.A.; Ali, H.; El Sattar, M.A. New seven parameters model for amorphous silicon and thin film PV modules based on solar irradiance. Sol. Energy 2016, 138, 26–35. [Google Scholar] [CrossRef]
- Gao, X.; Cui, Y.; Hu, J.; Xu, G.; Yu, Y. Lambert W-function based exact representation for double diode model of solar cells: Comparison on fitness and parameter extraction. Energy Convers. Manag. 2016, 127, 443–460. [Google Scholar] [CrossRef]
- Lim, L.H.I.; Ye, Z.; Ye, J.; Yang, D.; Du, H. A linear identification of diode models from single I-V characteristics of PV panels. IEEE Trans. Ind. Electron. 2015, 62, 4181–4193. [Google Scholar] [CrossRef] [Green Version]
- El Achouby, H.; Zaimi, M.; Ibral, A.; Assaid, E.M. New analytical approach for modelling effects of temperature and irradiance on physical parameters of photovoltaic solar module. Energy Convers. Manag. 2018, 177, 258–271. [Google Scholar] [CrossRef]
- Chaibi, Y.; Allouhi, A.; Salhi, M. A simple iterative method to determine the electrical parameters of photovoltaic cell. J. Clean. Prod. 2020, 269, 122363. [Google Scholar] [CrossRef]
- Raj, S.; Sinha, A.K.; Panchal, A.K. Solar cell parameters estimation from illuminated I-V characteristic using linear slope equations and Newton-Raphson technique. J. Renew. Sustain. Energy 2013, 5, 033105. [Google Scholar] [CrossRef]
- Jervase, J.A.; Bourdoucen, H.; Al-Lawati, A. Solar cell parameter extraction using genetic algorithms. Meas. Sci. Technol. 2001, 12, 1922–1925. [Google Scholar] [CrossRef] [Green Version]
- Ishaque, K.; Salam, Z. An improved modeling method to determine the model parameters of photovoltaic (PV) modules using differential evolution (DE). Sol. Energy 2011, 85, 2349–2359. [Google Scholar] [CrossRef]
- Ye, M.; Wang, X.; Xu, Y. Parameter extraction of solar cells using particle swarm optimization. J. Appl. Phys. 2009, 105, 094502. [Google Scholar] [CrossRef]
- Oliva, D.; Cuevas, E.; Pajares, G. Parameter identification of solar cells using artificial bee colony optimization. Energy 2014, 72, 93–102. [Google Scholar] [CrossRef]
- Askarzadeh, A.; Rezazadeh, A. Artificial bee swarm optimization algorithm for parameters identification of solar cell models. Appl. Energy 2013, 102, 943–949. [Google Scholar] [CrossRef]
- Niu, Q.; Zhang, L.; Li, K. A biogeography-based optimization algorithm with mutation strategies for model parameter estimation of solar and fuel cells. Energy Convers. Manag. 2014, 86, 1173–1185. [Google Scholar] [CrossRef]
- Rajasekar, N.; Kumar, N.K.; Venugopalan, R. Bacterial foraging algorithm based solar PV parameter estimation. Sol. Energy 2013, 97, 255–265. [Google Scholar] [CrossRef]
- Askarzadeh, A.; Rezazadeh, A. Extraction of maximum power point in solar cells using bird mating optimizer-based parameters identification approach. Sol. Energy 2013, 90, 123–133. [Google Scholar] [CrossRef]
- Askarzadeh, A.; Rezazadeh, A. Parameter identification for solar cell models using harmony search-based algorithms. Sol. Energy 2012, 86, 3241–3249. [Google Scholar] [CrossRef]
- Chen, X.; Yu, K.; Du, W.; Zhao, W.; Liu, G. Parameters identification of solar cell models using generalized oppositional teaching learning based optimization. Energy 2016, 99, 170–180. [Google Scholar] [CrossRef]
- Xiong, G.; Zhang, J.; Shi, D.; He, Y. Parameter extraction of solar photovoltaic models using an improved whale optimization algorithm. Energy Convers. Manag. 2018, 174, 388–405. [Google Scholar] [CrossRef]
- AlHajri, M.F.; El-Naggar, K.M.; AlRashidi, M.R.; Al-Othman, A.K. Optimal extraction of solar cell parameters using pattern search. Renew. Energy 2012, 44, 238–245. [Google Scholar] [CrossRef]
- El-Naggar, K.M.; AlRashidi, M.R.; AlHajri, M.F.; Al-Othman, A.K. Simulated annealing algorithm for photovoltaic parameters identification. Sol. Energy 2012, 86, 266–274. [Google Scholar] [CrossRef]
- Yu, K.; Chen, X.; Wang, X.; Wang, Z. Parameters identification of photovoltaic models using self-adaptive teaching-learning-based optimization. Energy Convers. Manag. 2017, 145, 233–246. [Google Scholar] [CrossRef]
- Ayang, A.; Wamkeue, R.; Ouhrouche, M.; Djongyang, N.; Salome, N.E.; Pombe, J.K.; Ekemb, G. Maximum likelihood parameters estimation of single-diode model of photovoltaic generator. Renew. Energy 2019, 130, 111–121. [Google Scholar] [CrossRef]
- Beigi, A.M.; Maroosi, A. Parameter identification for solar cells and module using a hybrid firefly and pattern search algorithms. Sol. Energy 2018, 171, 435–446. [Google Scholar] [CrossRef]
- Ram, J.P.; Babu, T.S.; Dragicevic, T.; Rajasekar, N. A new hybrid bee pollinator flower pollination algorithm for solar PV parameter estimation. Energy Convers. Manag. 2017, 135, 463–476. [Google Scholar] [CrossRef]
- Yu, K.; Liang, J.J.; Qu, B.Y.; Chen, X.; Wang, H. Parameters identification of photovoltaic models using an improved JAYA optimization algorithm. Energy Convers. Manag. 2017, 150, 742–753. [Google Scholar] [CrossRef]
- Yousri, D.; Allam, D.; Eteiba, M.B.; Suganthan, P.N. Static and dynamic photovoltaic models’ parameters identification using chaotic heterogeneous comprehensive learning particle swarm optimizer variants. Energy Convers. Manag. 2019, 182, 546–563. [Google Scholar] [CrossRef]
- Long, W.; Cai, S.; Jiao, J.; Xu, M.; Wu, T. A new hybrid algorithm based on grey wolf optimizer and cuckoo search for parameter extraction of solar photovoltaic models. Energy Convers. Manag. 2020, 203, 112243. [Google Scholar] [CrossRef]
- Cárdenas-Bravo, C.; Barraza, R.; Sánchez-Squella, A.; Valdivia-Lefort, P.; Castillo-Burns, F. Estimation of single-diode photovoltaic model using the differential evolution algorithm with adaptive boundaries. Energies 2021, 14, 3925. [Google Scholar] [CrossRef]
- Liu, E.J.; Hung, Y.H.; Hong, C.W. Improved metaheuristic optimization algorithm applied to hydrogen fuel cell and photovoltaic cell parameter extraction. Energies 2021, 14, 619. [Google Scholar] [CrossRef]
- Mirjalili, S.; Mirjalili, S.M.; Lewis, A. Grey wolf optimizer. Adv. Eng. Softw. 2014, 69, 46–61. [Google Scholar] [CrossRef] [Green Version]
- Panwar, L.K.; Reddy, S.; Verma, A.; Panigrahi, B.K.; Kumar, R. Binary grey wolf optimizer for large scale unit commitment problem. Swarm Evol. Comput. 2018, 38, 251–266. [Google Scholar] [CrossRef]
- Guha, D.; Roy, P.K.; Banerjee, S. Load frequency control of interconnected power system using grey wolf optimization. Swarm Evol. Comput. 2016, 27, 97–115. [Google Scholar] [CrossRef]
- El-Fergany, A.A.; Hasanien, H.M. Single and multi-objective optimal power flow using grey wolf optimizer and differential evolution algorithms. Electr. Power Compon. Syst. 2015, 43, 1548–1559. [Google Scholar] [CrossRef]
- Mittal, N.; Singh, U.; Sohi, B.S. Modified grey wolf optimizer for global engineering optimization. Appl. Comput. Intell. Soft Comput. 2016, 2016, 7950348. [Google Scholar] [CrossRef] [Green Version]
- Joshi, H.; Arora, S. Enhanced grey wolf optimization algorithm for global optimization. Fundam. Inform. 2017, 153, 235–264. [Google Scholar] [CrossRef]
- Hu, P.; Chen, S.; Huang, H.; Zhang, G.; Liu, L. Improved alpha-guided grey wolf optimizer. IEEE Access 2019, 7, 5421–5437. [Google Scholar] [CrossRef]
- Nadimi-Shahraki, M.H.; Taghian, S.; Mirjalili, S. An improved grey wolf optimizer for solving engineering problems. Expert Syst. Appl. 2020, 166, 113917. [Google Scholar] [CrossRef]
- Muangkote, N.; Sunat, K.; Chiewchanwattana, S.; Kaiwinit, S. An advanced onlooker-ranking-based adaptive differential evolution to extract the parameters of solar cell models. Renew. Energy 2019, 134, 1129–1147. [Google Scholar] [CrossRef]
- Kler, D.; Goswami, Y.; Rana, K.P.S.; Kumar, V. A novel approach to parameter estimation of photovoltaic systems using hybridized optimizer. Energy Convers. Manag. 2019, 187, 486–511. [Google Scholar] [CrossRef]
- Sheng, H.; Li, C.; Wang, H.; Yan, Z.; Xiong, Y.; Cao, Z.; Kuang, Q. Parameters extraction of photovoltaic models using an improved moth-flame optimization. Energies 2019, 12, 3527. [Google Scholar] [CrossRef] [Green Version]
- Elaziz, M.A.; Oliva, D. Parameter estimation of solar cells diode models by an improved opposition-based whale optimization algorithm. Energy Convers. Manag. 2018, 171, 1843–1859. [Google Scholar] [CrossRef]
- Allam, D.; Yousri, D.A.; Eteiba, M.B. Parameters extraction of the three diode model for the multi-crystalline solar cell/module using moth-flame optimization algorithm. Energy Convers. Manag. 2016, 123, 535–548. [Google Scholar] [CrossRef]
- Abbassi, R.; Abbassi, A.; Heidari, A.A.; Mirjalili, S. An efficient salp swarm-inspired algorithm for parameters identification of photovoltaic cell models. Energy Convers. Manag. 2019, 179, 362–372. [Google Scholar] [CrossRef]
- Chen, X.; Yu, K. Hybridizing cuckoo search algorithm with biogeography-based optimization for estimating photovoltaic model parameters. Sol. Energy 2019, 180, 192–206. [Google Scholar] [CrossRef]
- Khanna, V.; Das, B.K.; Bisht, D.; Singh, P.K. A three diode model for industrial solar cells and estimation of solar cell parameters using PSO algorithm. Renew. Energy 2015, 78, 105–113. [Google Scholar] [CrossRef]
- Yesilbudak, M. Accurate identification of the electrical parameters of triple-diode photovoltaic model using a metaheuristic algorithm. In Proceedings of the 9th International Conference on Smart Grid, Setubal, Portugal, 29 June–1 July 2021. [Google Scholar]
- Easwarakhanthan, T.; Bottin, J.; Bouhouch, I.; Boutrit, C. Nonlinear minimization algorithm for determining the solar cell parameters with microcomputers. Int. J. Sol. Energy 1986, 4, 1–12. [Google Scholar] [CrossRef]
- Gao, X.; Cui, Y.; Hu, J.; Xu, G.; Wang, Z.; Qu, J.; Wang, H. Parameter extraction of solar cell models using improved shuffled complex evolution algorithm. Energy Convers. Manag. 2018, 157, 460–479. [Google Scholar] [CrossRef]
- Xiong, G.; Zhang, J.; Yuan, X.; Shi, D.; He, Y.; Yao, G. Parameter extraction of solar photovoltaic models by means of a hybrid differential evolution with whale optimization algorithm. Sol. Energy 2018, 176, 742–761. [Google Scholar] [CrossRef]
- Hachana, O.; Hemsas, K.E.; Tina, G.M.; Ventura, C. Comparison of different metaheuristic algorithms for parameter identification of photovoltaic cell/module. J. Renew. Sustain. Energy 2013, 5, 053122. [Google Scholar] [CrossRef]
- Wei, H.; Cong, J.; Lingyun, X.; Deyun, S. Extracting solar cell model parameters based on chaos particle swarm algorithm. In Proceedings of the International Conference on Electric Information and Control Engineering, Wuhan, China, 15–17 April 2011; pp. 398–402. [Google Scholar] [CrossRef]
- Alam, D.F.; Yousri, D.A.; Eteiba, M.B. Flower pollination algorithm based solar PV parameter estimation. Energy Convers. Manag. 2015, 101, 410–422. [Google Scholar] [CrossRef]
- Yu, K.; Liang, J.J.; Qu, B.Y.; Cheng, Z.; Wang, H. Multiple learning backtracking search algorithm for estimating parameters of photovoltaic models. Appl. Energy 2018, 226, 408–422. [Google Scholar] [CrossRef]
- Patel, S.J.; Panchal, A.K.; Kheraj, V. Extraction of solar cell parameters from a single current-voltage characteristic using teaching learning based optimization algorithm. Appl. Energy 2014, 119, 384–393. [Google Scholar] [CrossRef]
- Jordehi, A.R. Time varying acceleration coefficients particle swarm optimisation (TVACPSO): A new optimisation algorithm for estimating parameters of PV cells and modules. Energy Convers. Manag. 2016, 129, 262–274. [Google Scholar] [CrossRef]
- Nunes, H.G.G.; Pombo, J.A.N.; Mariano, S.J.P.S.; Calado, M.R.A.; Felippe de Souza, J.A.M. A new high performance method for determining the parameters of PV cells and modules based on guaranteed convergence particle swarm optimization. Appl. Energy 2018, 211, 774–791. [Google Scholar] [CrossRef]
- Yuan, X.; He, Y.; Liu, L. Parameter extraction of solar cell models using chaotic asexual reproduction optimization. Neural Comput. Appl. 2015, 26, 1227–1239. [Google Scholar] [CrossRef]
- Guo, L.; Meng, Z.; Sun, Y.; Wang, L. Parameter identification and sensitivity analysis of solar cell models with cat swarm optimization algorithm. Energy Convers. Manag. 2016, 108, 520–528. [Google Scholar] [CrossRef]
- Oliva, D.; Aziz, M.A.E.; Hassanien, A.E. Parameter estimation of photovoltaic cells using an improved chaotic whale optimization algorithm. Appl. Energy 2017, 200, 141–154. [Google Scholar] [CrossRef]
- Jiao, S.; Chong, G.; Huang, C.; Hu, H.; Wang, M.; Heidari, A.A.; Chen, H.; Zhao, X. Orthogonally adapted Harris hawks optimization for parameter estimation of photovoltaic models. Energy 2020, 203, 117804. [Google Scholar] [CrossRef]
- Jamadi, M.; Merrikh-Bayat, F.; Bigdeli, M. Very accurate parameter estimation of single- and double-diode solar cell models using a modified artificial bee colony algorithm. Int. J. Energy Environ. Eng. 2016, 7, 13–25. [Google Scholar] [CrossRef] [Green Version]
- Lin, P.; Cheng, S.; Yeh, W.; Chen, Z.; Wu, L. Parameters extraction of solar cell models using a modified simplified swarm optimization algorithm. Sol. Energy 2017, 144, 594–603. [Google Scholar] [CrossRef]
- Hamid, N.F.A.; Rahim, N.A.; Selvaraj, J. Solar cell parameters identification using hybrid Nelder-Mead and modified particle swarm optimization. J. Renew. Sustain. Energy 2016, 8, 015502. [Google Scholar] [CrossRef]
- Yu, K.; Qu, B.; Yue, C.; Ge, S.; Chen, X.; Liang, J. A performance-guided JAYA algorithm for parameters identification of photovoltaic cell and module. Appl. Energy 2019, 237, 241–257. [Google Scholar] [CrossRef]
- Liang, J.; Qiao, K.; Yuan, M.; Yu, K.; Qu, B.; Ge, S.; Li, Y.; Chen, G. Evolutionary multi-task optimization for parameters extraction of photovoltaic models. Energy Convers. Manag. 2020, 207, 112509. [Google Scholar] [CrossRef]
- Chen, X.; Xu, B.; Mei, C.; Ding, Y.; Lia, K. Teaching-learning-based artificial bee colony for solar photovoltaic parameter estimation. Appl. Energy 2018, 212, 1578–1588. [Google Scholar] [CrossRef]


Publisher’s Note: MDPI stays neutral with regard to jurisdictional claims in published maps and institutional affiliations. |
© 2021 by the author. Licensee MDPI, Basel, Switzerland. This article is an open access article distributed under the terms and conditions of the Creative Commons Attribution (CC BY) license (https://creativecommons.org/licenses/by/4.0/).