Abstract
These days, various national and international research organizations are working on the development of low NOx combustors. The present work describes the experimental and numerical characterization of flow dynamics and combustion characteristics in a rectangular burner. A ring-needle type plasma actuator was developed and driven by a high voltage nanosecond pulsed generator under atmospheric conditions. Smoke flow visualizations and Proper Orthogonal Decomposition (POD) were carried out to identify the relevant flow structures. Electrical characterization of the non-reactive flow was carried out to predict the electrical power and the optimum value of the reduced electric field (EN), which is useful for the implementation of a numerical model for the study of plasma-assisted ignition. A detailed plasma kinetic mechanism integrated with all excited species was considered and validated with experimental studies. Numerical modeling of plasma ignition has been performed by coupling ZDPlasKin with CHEMKIN. Energy and power consumption for methane/air plasma actuation is higher than the air plasma actuation. This could be due to the excitation and ionization of methane that required more energy deposition and power. The mole fraction of O atoms and ozone was higher in the air than the methane/air actuation. However, O atoms were produced in a very short time interval of 10−7 to 10−6 s; in contrast, the concentration of ozone was gradually increased with the time interval and the peak was observed around 10−1 s. Plasma discharges on the methane/air mixture also produced radicals that played a key role to enhance the combustion process. It was noticed that the concentration of H species was high among all radicals with a concentration of nearly 10−1. The concentration peak of CH3 and OH was almost the same in the order of 10−2. Finally, the mixture ignition characteristics under different low inlet temperatures were analyzed for both air and methane/air plasma actuation in the presence of different plasma discharges pulses numbers. Results showed that it is possible to reach flame ignition at inlet temperature lower than the minimum required in the absence of plasma actuation, which means ignition is possible in cold flow, which could be essential to address the re-ignition problems of aeroengines at high altitudes. At Ti = 700 K, the ignition was reached only with plasma discharges; ignition time was in the order of 0.01 s for plasma discharges on methane/air, lower than in case of plasma in air, which permitted ignition at 0.018 s. Besides this, in the methane/air case, 12 pulses were required to achieve successful ignition; however, in air, 19 pulses were needed to ignite.
1. Introduction
In recent years, numerous research organizations are working on the advancement of low NOx combustors and aeronautical engines to fulfill the regulations of international organizations. Lean fuel burning is one of the encouraging methods in order to achieve the low temperature combustion but as a result, strong flame instabilities are produced in the form of flame quenching which ultimately reduce the overall efficiency of the combustion process [1,2,3]. Furthermore, high-altitude aircraft engines operate in conditions of low inlet temperature, and under such conditions, the flow, atomization, and combustion characteristics are different from those at sea level. A low ambient temperature makes both ignition and combustion difficult as it slows down the rate of fuel evaporation and requires more spark energy for fuel evaporation.
This reduces ignition and flame extinction limits in high-altitude conditions, making ignition unstable and in a narrow range of fuel/air ratio. To improve ignition and flame stability both in lean fuel and low temperature conditions, various passive control technologies are commonly used to improve the flame stabilization by modifying the injector geometry or flame holders in a permanent way, which could help to promote combustion stability by creating large vortexes [4].
In addition to this, active control technologies could control flow and combustion parameters as operating conditions change in real time without altering the combustor design. Non-thermal plasma (NTP) is the established technology that actively controls the combustion characteristics of coaxial burners and axisymmetric air jets [5,6,7,8]. The basic principle of NTP is to produce plasmas in which electrical energy is used to ionize the fuel, air, or mixture without overheating the gas. It not only increases the efficiency of burners by increasing flame stabilization, improving oxidation at low temperature and extending the limits of lean blow out, but at the same time, also reduces the significant amount of exhaust emissions, i.e., nitrogen oxides (NOx) [9,10,11].
Among all NTPs dielectric barrier discharge (DBD), plasma actuators gained great attraction for aeronautical applications because of low power consumption, ease to handle, no movement of mechanical parts, being lightweight, and being cheap to build, implement, and maintain high-frequency response, permitting real-time operating conditions [12]. Usually, DBD is functioning with two electrical modes; the first one is the AC in which a high voltage (HV) waveform with a frequency in the range of kHz is used with or without the pulsation form. In the second mode, HV is applied in the form of nanosecond repetitive pulses (NRP), usually operating in a wide range from a few hundred Hz to a few hundred kHz. Particularly, nanosecond pulsed discharge has been drawing much attention due to the wide and efficient aptitude of producing excited states and free radicals by dissociation, ionization and electron impacted excitation reactions by subjecting to a high reduced electric field (EN) which kinetically improves the combustion process [13,14]. Furthermore, nanosecond plasma discharge produced fast gas heating via thermal pathways, which also helped in accelerating the combustion process [15]. However, during the nanosecond pulse discharge, plasma chemistry (electron impact reactions) has different time scales than the combustion chemistry (gas–phase reactions) [16,17,18].
Xu et al. [19] in 2015 studied the flame properties in a co-axial burner by using AC-DBDPA; the outer tube, carrying a CH4 jet, was connected with a HV electrode and the inner tube, carrying an air jet, was used as a grounded electrode. They noticed that flame behavior was significantly influenced by the reduced electric field strength (EN). Furthermore, they also observed that pre-mixing performance was improved, which results in the combustion enhancement.
Bernard et al. [20,21] in 2007–2008 carried out experimental studies to investigate the effects of AC-DBDPA by operating with or without the pulsation mode of the HV sinusoidal generator. Velocity profiles, turbulent kinetic energy (TKE), and turbulent spectra were characterized. The authors described that the mixing performance of the jet was heavily improved with plasma actuation.
Our research group also performed some experimental and numerical studies [22,23,24] focused on the impacts of plasma discharge on the flame behavior of the methane/air mixture by using a coaxial dielectric barrier discharge (DBD) in the Bunsen burner. It was noticed that the plasma excitation improved the production of OH radicals and changed flame luminosity. Moreover, the impact of plasma discharge with two different configurations of burners, normal diffusive flame (NDF) and inverse diffusive flame (IDF), was analyzed by considering lean non-premixed methane–air flame. It was found that plasma effects greatly depend on the burner and DBD configurations. Finally, a study about the impacts of plasma discharge on methane decomposition was carried out to improve combustion. It was observed that in the presence of a plasma discharge, the flame speed was increased by about 10% as compared with the clean case at stoichiometric conditions.
Rosocha et al. [25] in 2007 investigated the effects of AC-DBDPA on the flame in a burner. The authors analyzed the fragmentation process of hydrocarbons in the presence of plasma discharges and they also highlighted the basic ideas of the fuel plasma activation. Owing to this, increased flame speed, reduction in fuel consumption, and flame stability were examined.
Zhang et al. [26,27] in 2013–2014 investigated fuel reforming by DBDPA by considering two cases: partial oxidation and dry reforming. It was observed that fuel reforming was improved with the oxidation case. Furthermore, the overall conversion of methane and oxygen was increased with the plasma power, EN values, and the initial temperature. It was shown that by increasing the temperature, concentrations of neutral radicals such as O, H, CH, and OH are increased, which leads to improving the conversion efficiency of the fuel and oxidizer. However, because they used a low number of electrons impacted reactions in their model, no quantitative comparison of produced species was performed which ultimately limited the plasma-based analysis of fuel and oxidizer conversion processes.
Haibao et al. [28] in 2015 studied the effects of AC-DBDPA on CH4/O2/He mixture. They noticed that AC-DBDPA enhanced the flame speed from 17% to 35% under equivalence ratios ranging from 0.85 to 1.10. They also analyzed the decomposition of CH4 into intermediate radicals (CH, CH3, and H). The H and CH3 reacted very quickly with O2 to produce OH radicals. Owing to this, O atoms were generated through the dissociation of O2 molecules.
In the literature, it was found that plasma assisted combustion (PAC) effects are broadly explained in three different ways: thermal or temperature effects (slow and fast gas heating processes from vibrational and electronic state relaxation), kinetic effects (formation of charged species, electrons, excited species, neutral radicals, and fuel fragments) and via transport effect (fuel decomposition and oxidation at low temperatures) [29,30]. However, the accurate and detailed mechanism that could improve combustion is not well understood yet.
Therefore, the big challenge is a deep knowledge of the effects of DBD plasma actuation on combustion enhancement, which could help to optimize and identify the role of each specific process involved in the plasma induced combustion. Several assumptions were considered in previous studies by aiming to classify the plasma effects.
In this context, the main aim of this study is to examine the key challenges involved in plasma combustion such as fluid effects and the effects of produced species and radicals due to the plasma actuation on the ignition characteristics at low temperature conditions by varying the number of HV nanosecond plasma pulses in order to address the problems produced during cold ignition. The experimental characterizations of flow dynamic characteristics in a rectangular burner were investigated. A ring-needle type plasma actuator was developed and driven by a high voltage nanosecond pulsed generator at atmospheric conditions. Electrical characterization of non-reactive flow was performed to predict the optimum value of reduced electric field EN that could be supportive to correlate it with numerical simulations.
Generally, the nanosecond repetitively pulsed plasma actuators in combustor have been characterized in terms of the thermal effects and species decompositions. However, the present plasma needle-disk plasma actuator configuration could also influence the fluid dynamics such as induced flow with an impact on the recirculation zone near the corners of the combustor, improving the mixing performance of the mixture, ultimately resulting in the reduction of ignition delay timings.
Hence, in order to decouple the fluid, dynamic effects of the plasma actuation on the flow were investigated by means of a non-reacting flow characterization (absence of combustion), where the air was used as both fuel and oxidizer. The flow pattern and turbulence in both the presence and absence of actuation were studied by CCD flow visualization coupled with POD analysis and PIV analysis.
Then, the same experimental EN and voltage were used for the numerical analysis on the flame ignition, and smoke flow visualizations were performed by using a high-resolution camera. Proper orthogonal decomposition analyses were carried out to recognize the relevant flow structures. Electrical characterization has been also performed to estimate the power consumption and the reduced electrical field to be used in the numerical simulations. In order to understand the kinetic plasma effects, a detailed plasma kinetic mechanism integrated with all excited species was considered and validated with experimental studies by comparing the mole fraction of O atoms. Plasma ignition numerical modeling has been performed by coupling ZDPlasKin with CHEMKIN. A detailed description of numerical models is available in Section 3. The comparative analysis of species production and ignition characteristics at low inlet temperatures for different nanosecond plasma pulses numbers were considered for air and methane/air mixture that could be essential to address the re-ignition problems of aeroengines at high altitudes.
2. Materials and Methods
The experimental setup has been implemented to investigate the effects of plasma discharges on the flow and to measure the electrical properties in the case of a plasma actuator installed in a closed rectangular cross-sectional burner having the following dimensions: height H = 305 mm, width W = 104 mm, and wall thickness T = 2 mm. The burner was equipped with a ring-needle type plasma actuator. The actuator consisted of two copper electrodes; the disk electrode has inner and outer diameters equal to 32 mm and 52 mm, respectively, and relates to high voltage. This electrode was installed in the center of a Teflon plate that was the bottom part of the rectangular burner. A needle copper electrode with a diameter of 1 mm, the length equal to 330 mm and a blunt tip angle of 90°, was axially placed at the center of disk type electrode with standoff distance s = 0 mm, and it acted as the grounded electrode, as shown in Figure 1. The standoff distance indicated the positioning of the grounded electrode with reference to the upper edge of the HV disk.
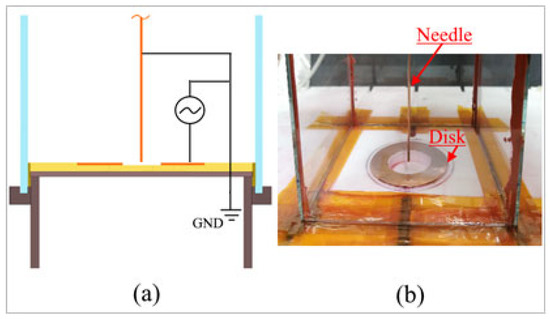
Figure 1.
A disk and needle type plasma actuator configuration: (a) sketch of the plasma actuator electrodes connections; (b) picture of the experimental plasma actuator device.
All tests were conducted at a laboratory ambient temperature and pressure of 298 K and 1 bar, respectively, by considering non-reactive flow (absence of flame). Different plasma actuation conditions were considered by using a nanosecond pulsed generator. A Faraday cage was used to shield the acquisition system from the electromagnetic interference caused by the high electric field required to generate the plasma discharge. Table 1 shows the experimental actuator operating conditions, in terms of the amplitude and repetition frequency of the nanosecond repetitive pulsed discharges and needle position. The amplitude and frequency values are reported in terms of percentage value with respect to the maximum given by the HV generator.

Table 1.
Experimental conditions (amplitude and frequency are expressed as the % value with respect to the maximum of the HV generator).
The electrical setup consisted of the HV nanosecond pulse generator (NPG-18/3500), the HV probe (Tektronix P6015A), the current transformer (Bergoz Current Transformer CT-D1.0-B), the oscilloscope (R&S-RTM3004), and a dedicated personal computer. To obtain the characteristic voltage-current curves as a function of time (t) and electrical power dissipation, both the HV probe and the current transformer were connected to the oscilloscope, and the corresponding signals were recorded with an accuracy given by Equation (1).
where DC gain Accuracy was: 1.5% for the input sensitivity > 5 Mv/div (Voltage case) and 2% for the input sensitivity ≤ 5 mV/div to ≥ 1 mV/div (Current case); Reading is the value of voltage or current measured by oscilloscope; Net offset is the offset value set in each test.
where: Input sensitivity is in the range 0.5 mV/div to 10 V/div at 1 MΩ.
Measurement Accuracy = ±DC gain Accuracy + |reading-net offset| + offset accuracy
Offset accuracy = ±0.5%*|offset| + 0.1 div*input sensitivity + 0.5 mV
In particular, the HV probe was placed on the HV connector side and the current transformer was located on the grounded side, allowing simultaneous measurement of the applied voltage and current due to the plasma discharge; a single oscilloscope’s acquisition was characterized by a sampling rate of 25 MHz, equivalent to two periods (T) for each signal; 128 individual acquisitions were recorded and averaged in order to obtain the average values of the applied voltage signal (V (t)) and current signal (I (t)).
The electrical power dissipation P was calculated by Equation (3):
where 2T is the period of the applied voltage and I(t) and V(t) are the acquired current and the voltage signals, respectively.
For the power calculation, a numerical integration was performed using the trapezoidal rule and the corresponding uncertainty of each power measurement was estimated by standard uncertainty analysis methodology [29,30]. A detailed sketch of electrical characterization is shown in Figure 2.
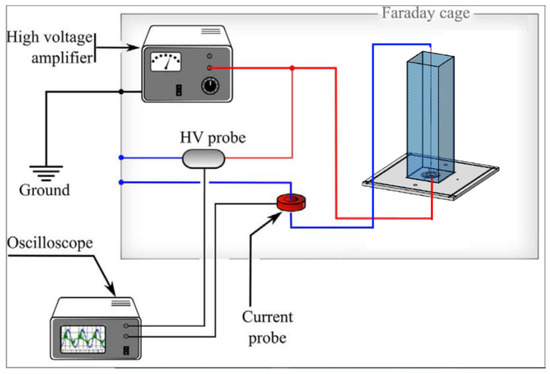
Figure 2.
A complete sketch of electrical characterization.
3. Numerical Procedure
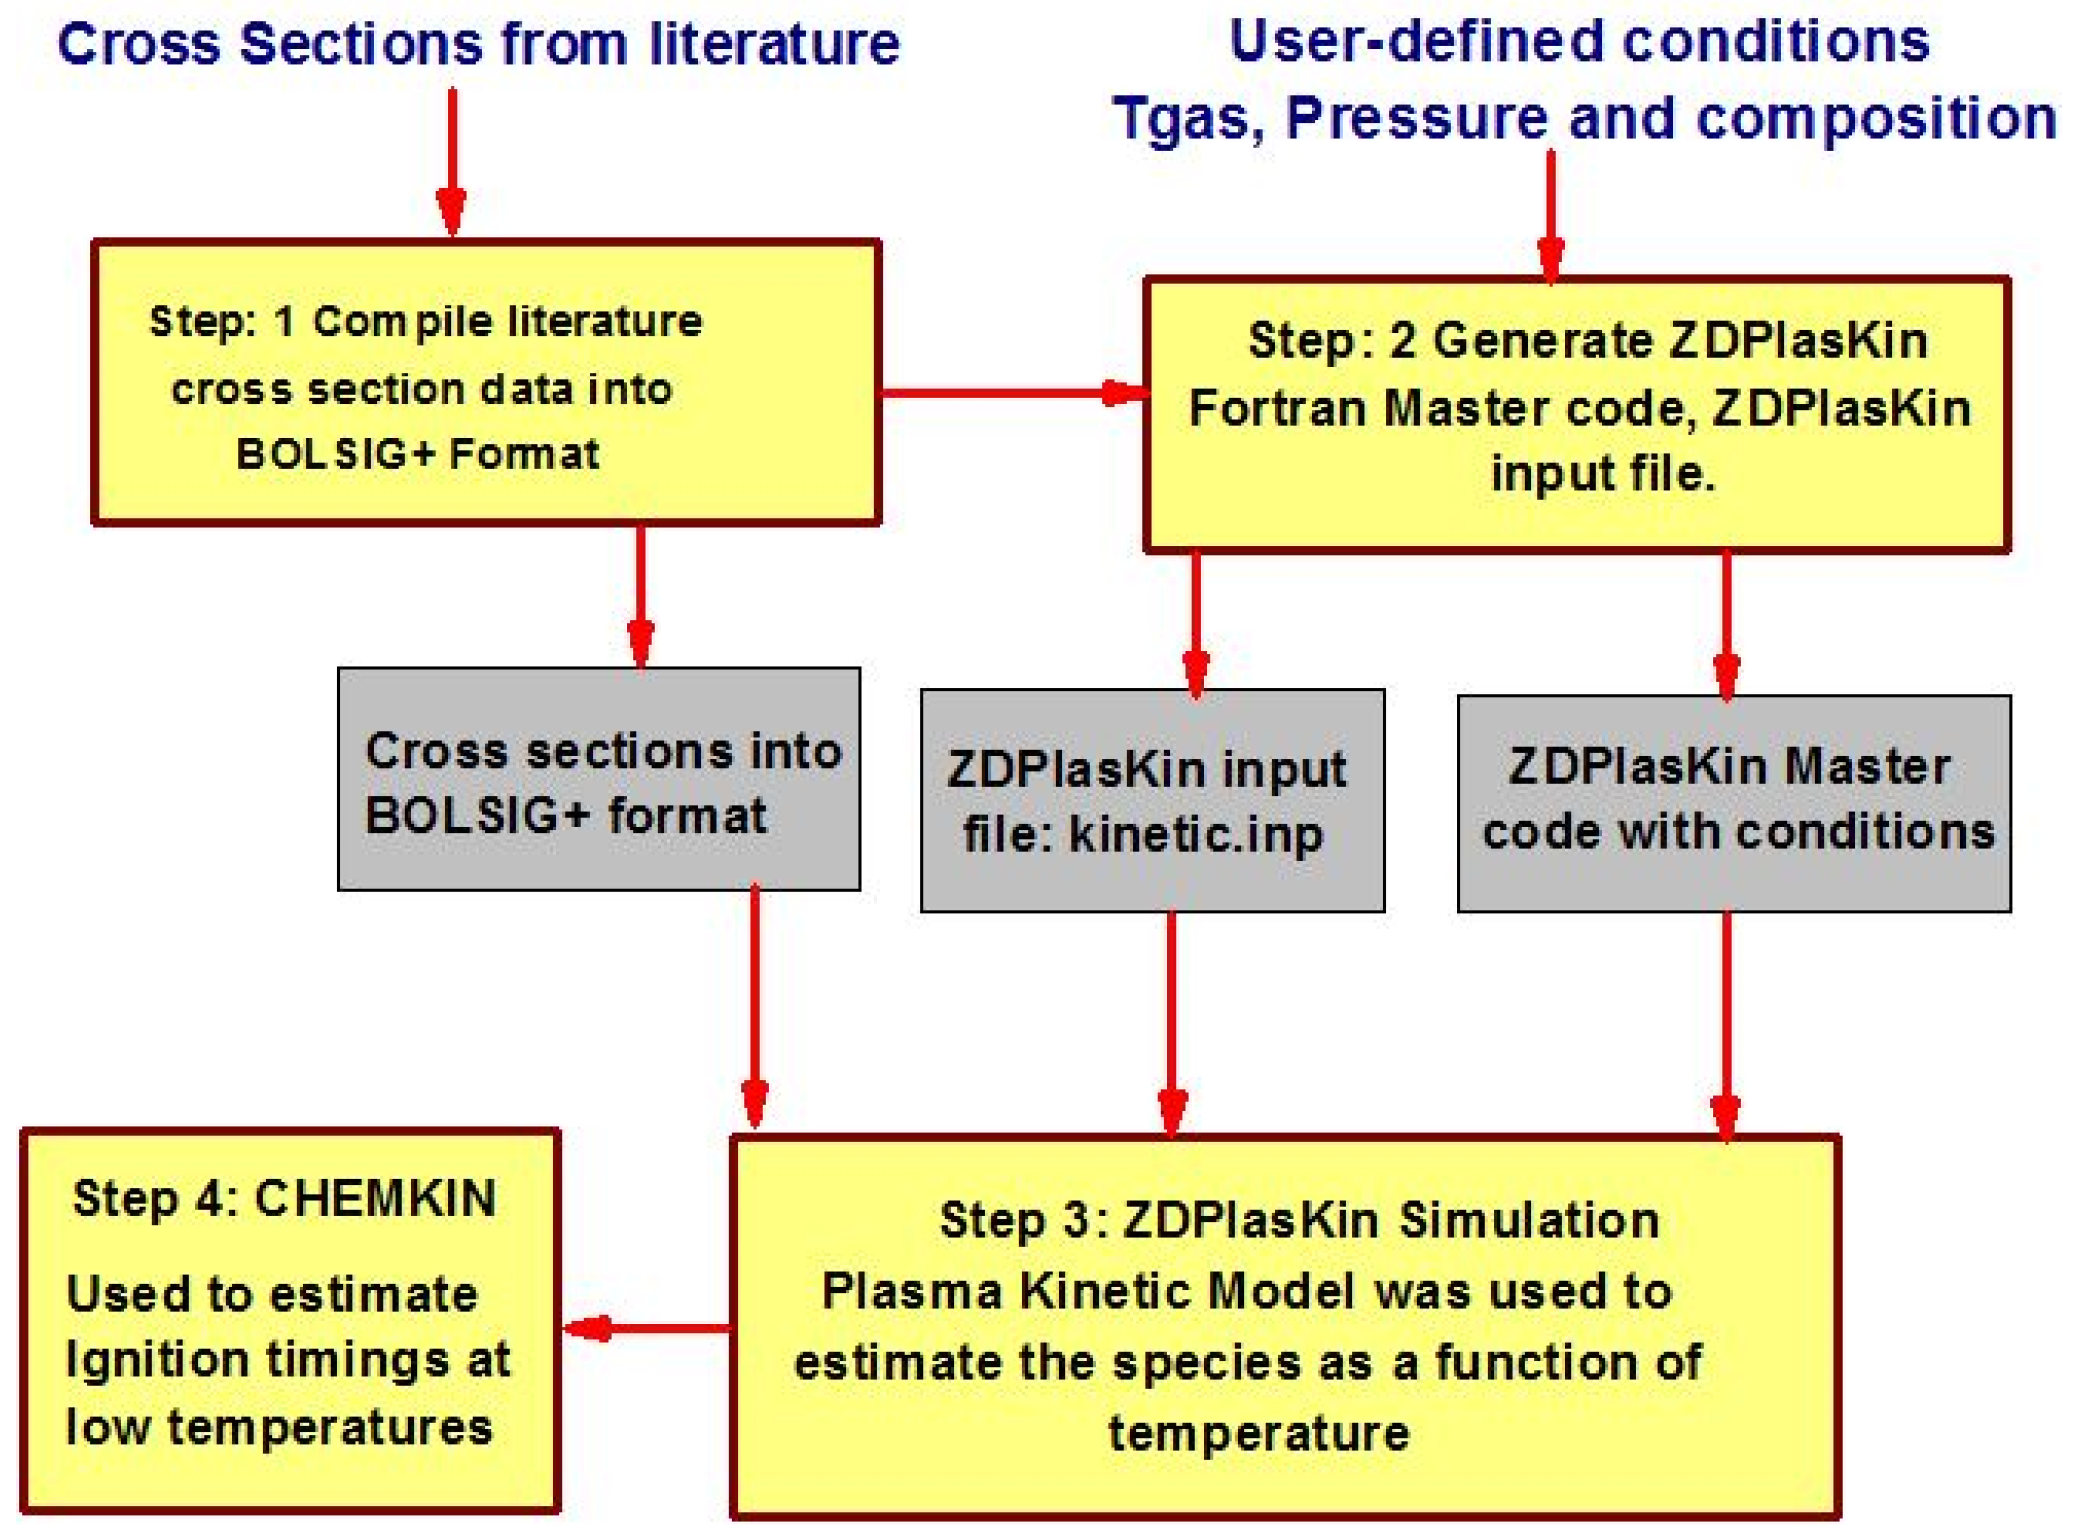
Numerical modeling has been performed by coupling a zero-dimensional plasma kinetic model (ZDPlasKin) [31] and the chemical kinetic model (CHEMKIN) [32]. A detailed description of coupling ZDPlasKin and CHEMKIN with their governing equations is available in [33,34]. ZDPlasKin was used to analyze the thermal and kinetic effects of nanosecond repetitive pulsed discharges on the air and methane/air mixture. A simulation model of plasma kinetics was developed to investigate the temporal evolution of time-dependent species. In this model, the 0-D plasma kinetic model (ZDPlasKin) was integrated with the Boltzmann equation solver (BOLSIG+) to predict the time-dependent evolution of species. CHEMKIN was considered to predict the ignition characteristic timings, particularly at low temperature ranges. The complete numerical procedure is described in Figure 3. Step 1: a detailed literature review carried out by aiming to generate the comprehensive plasma kinetic mechanism and collected the electron collision cross-sectional data. Step 2: initial code setting and boundary conditions on ZDPlasKin for plasma reaction simulation in terms of temperature, pressure, electrical feeding, and initial mixture composition in companies with the preparation of plasma chemistry file (detailed reaction mechanism) and compiling the cross-section data file. Step 3: simulations of plasma discharge on ZDPlasKin performed to estimate the species as a function of time. Step 4: the results obtained from ZDPlaskin incorporated in CHEMKIN to examine the pulsation effects of plasma discharge on ignition timings at low temperature conditions.

Figure 3.
Detailed numerical procedure.
The deposition of high energy electrons in the combustible mixture showed a significant influence on the combustion performance during electron impact reactions which results in decomposition of the fuel mixture. In the plasma kinetic model, when electrons reacted with the methane–air mixture, it produced different excitation states and reactions. The reaction mechanism consists of dissociation, ionization, recombination, charged transfer reactions, relaxation reactions, three-body recombination reactions, electronically and vibrational excitation states of species, concluded from the previous studies where available. The detailed plasma kinetic reaction mechanism involves 161 species and 1382 reactions involving electron impact and gas-phase reactions. It contained 3 reactants, 5 elements, 80 radicals, 35 charged species, and 38 excited species. It was developed by expanding the mechanism of N2-O2 [35,36] with the reactions of the CH4-H2-O2 mixture [37] and the mixture of CH4-H2-N2 from [38]. However, for plasma analysis, it is important to define the reaction rates coefficient of electron impacted reactions. Rate coefficient depends on the induced electron energy and collision cross-sectional data of electron impacted plasma reactions obtained from the LXCat database [39].
4. Results and Discussions
4.1. Experimental Results
4.1.1. Electrical Characterization
Table 2 highlighted the peak voltage, repetition rates, and the electrical power data such as the single pulse electrical power and the mean electrical power delivered to the fluidic flow for the different test cases reported in Table 1.
Table 2.
Electrical data for the different test cases.
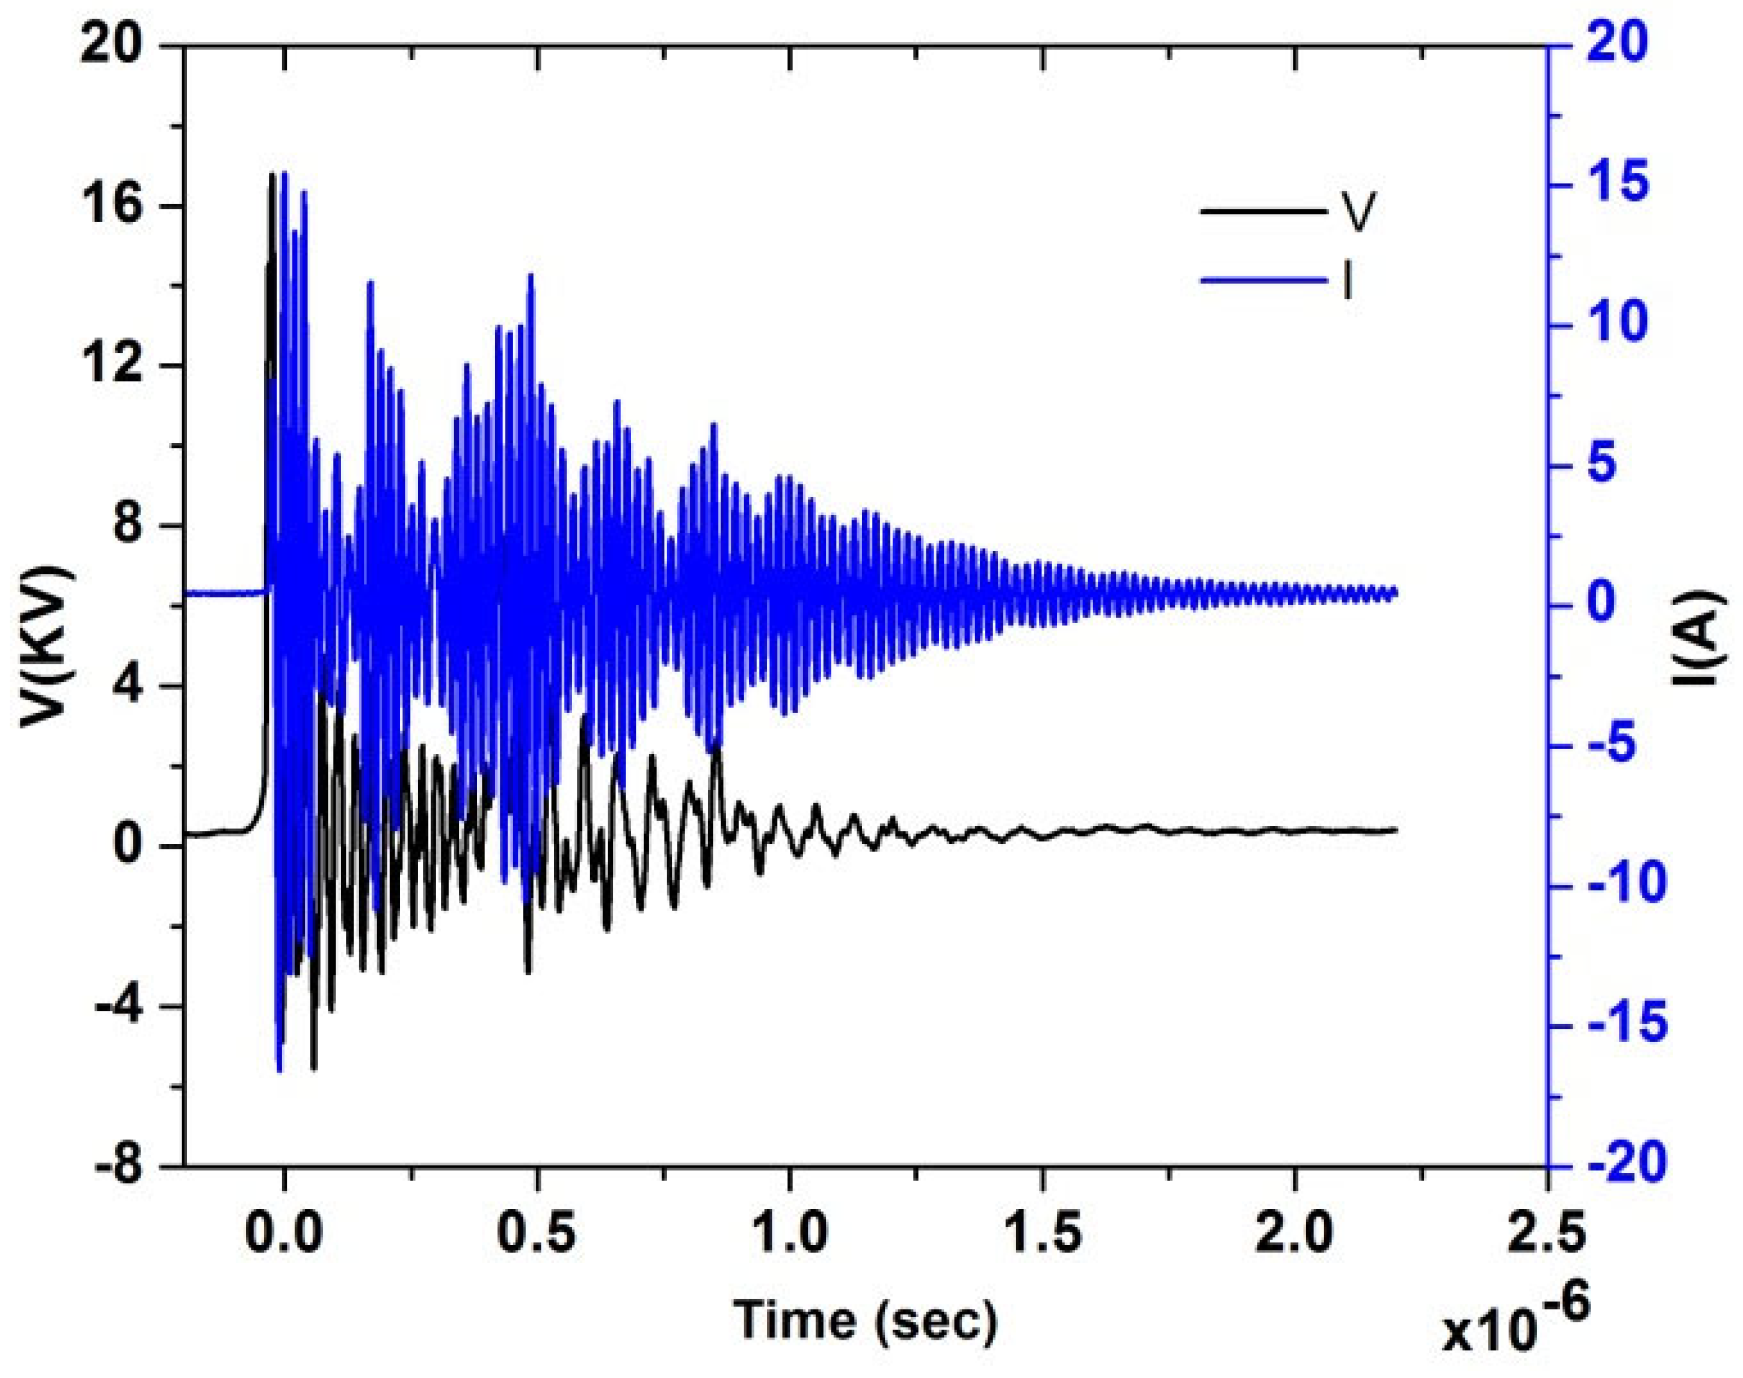
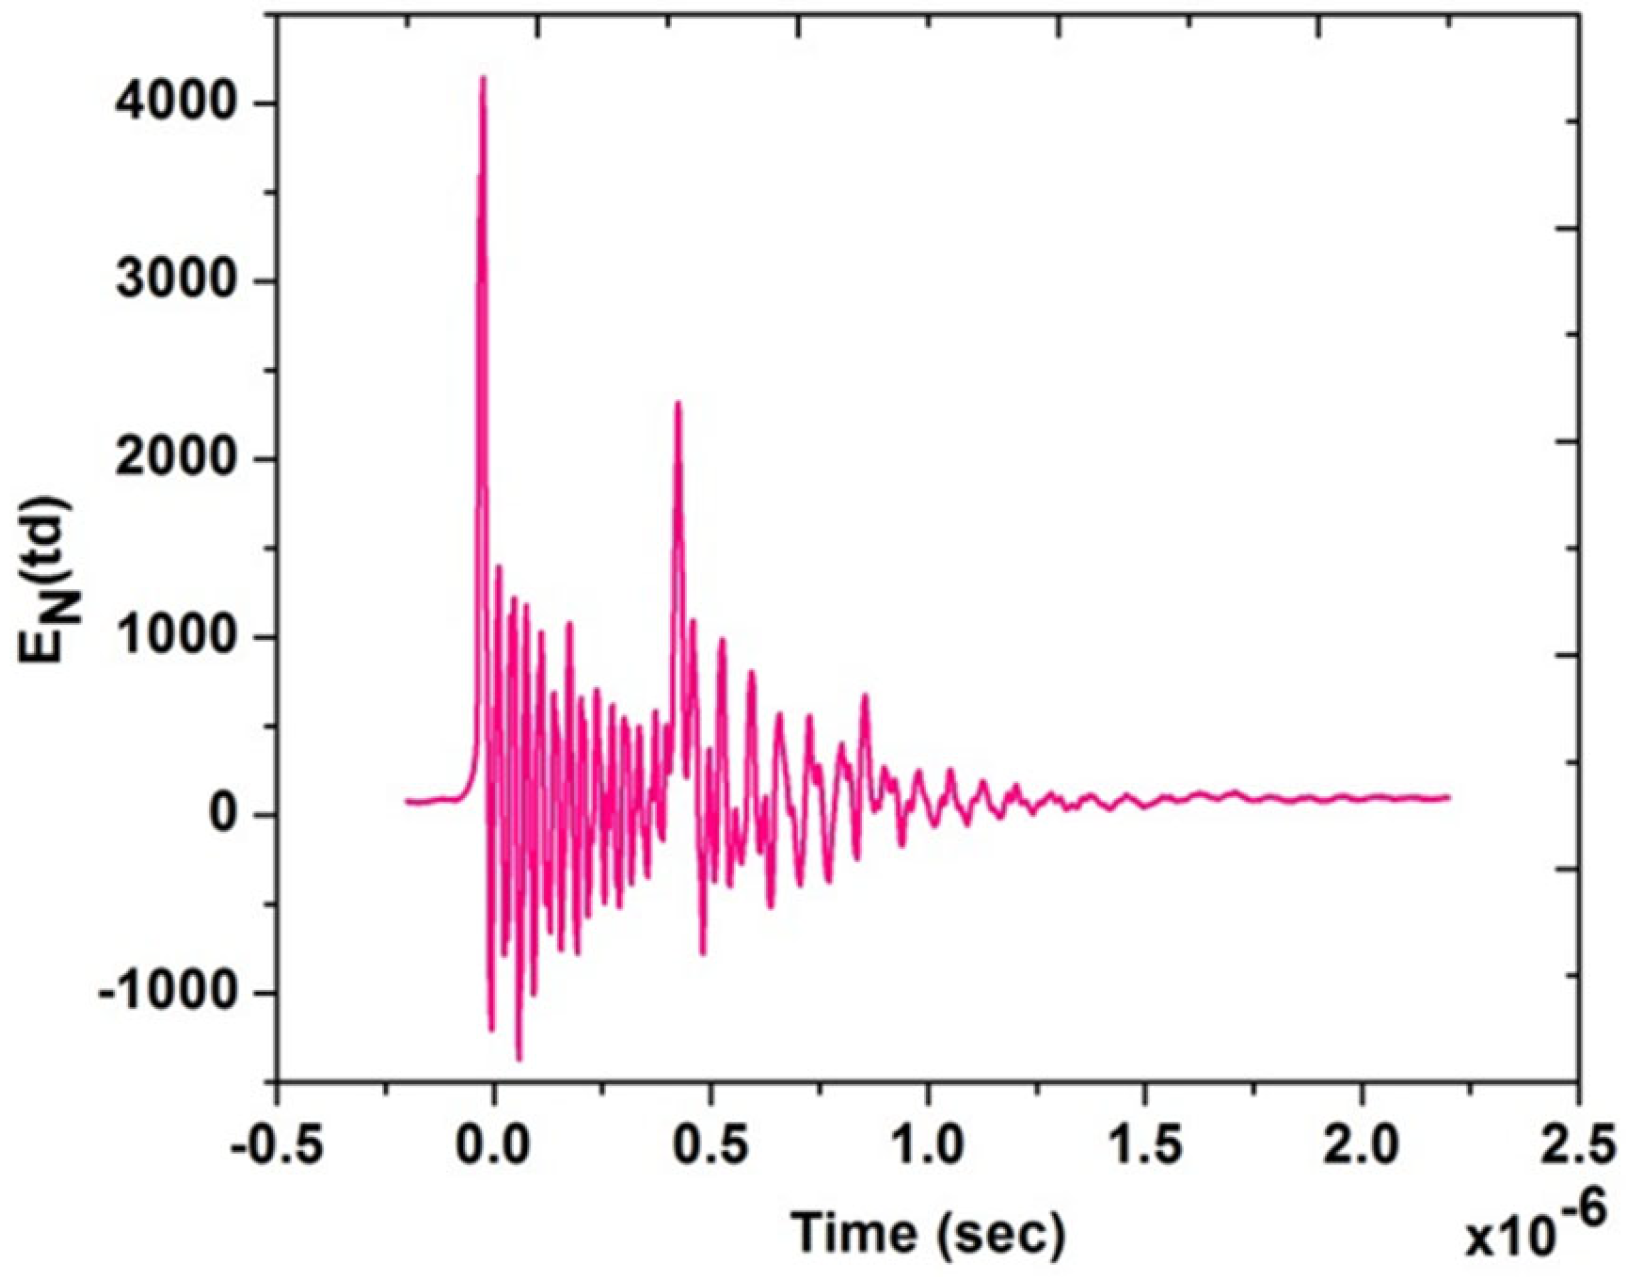
Figure 4 shows typical experimental current and voltage temporal signals for test Case 1; from the acquired current and voltage time series, the power characteristics were calculated and are shown in Table 3, then the voltage signal was used for the estimation of the reduced electric field EN, knowing the distance between needle and disk. It is a highly variable signal because of the nano pulsed repetitively discharge. The temporal behavior of EN is shown in Figure 5, underlining the several EN peaks. From this temporal signal, the integral mean of EN in the pulse duration time up to 10−6 s was then calculated. Therefore, the EN value for the single pulse was about 200 Td for Case 1. In our previous study, we found that the ignition has been significantly improved at 200 Td [40]. Similar results were also observed by [41] at the same EN value. Therefore, test Case 1 was better investigated for further analysis.

Figure 4.
Electrical characterization, I(t) and V(t) acquired temporal signals for the test Case 1.
Table 3.
Production of neutral radicals and power consumption during air and methane/air plasma actuation.

Figure 5.
Experimental EN (Td) for the test Case 1.
4.1.2. Flow Visualization and Proper Orthogonal Decomposition (POD)
Smoke flow visualization was performed by using a high-speed CCD camera MEMRECAM GX-3 equipped with a Nikkor 60 mm f/2.8d A/F objective and an interference filter (λ = 532 nm). The images were taken at 50 Hz for 1 s of acquisition time. The resolution was 288 × 384. Incense smoke (particle average diameter of 0.3 microns) has been used for filling the test chamber. A Laser 532 nm 300 mW mod. MGL-III-532 was used to illuminate the visualization plane.
Flow visualization was also used to make a quantitative estimation of the induced velocity field and the calculation of the various flow parameters was performed by PIV lab which is a MATLAB based program, for the analysis of the induced flow field, a region of interest (ROI) of 100 mm × 100 mm. The acquired images were cropped to analyze only the region of interest; then, to improve the contrast between the object and the background, the Contrast Limited Adaptive Histogram Equalization (CLAHE) method was used, enabled with 20 pixels window size [42]. As per the PIV algorithm, the FFT-based cross-correlation method was applied [43]. The interrogation window size was set to 64 × 64 pixels in the first pass and then was reduced to 32 × 32 pixels in the second pass and 24 × 24 in the third passage, with a 50% overlapping for each pass and adaptive interrogation window. Non-overlapping image sequencing (1–2, 3–4 …) was chosen for each run of image processing. Finally, improperly matched vectors were removed and vectors having a signal-to-noise ratio (SNR, ratio of the highest peak to the second highest peak in each individual correlation map) over 3 were analyzed. The time-averaged flow field was based on an ensemble size of 100 images.
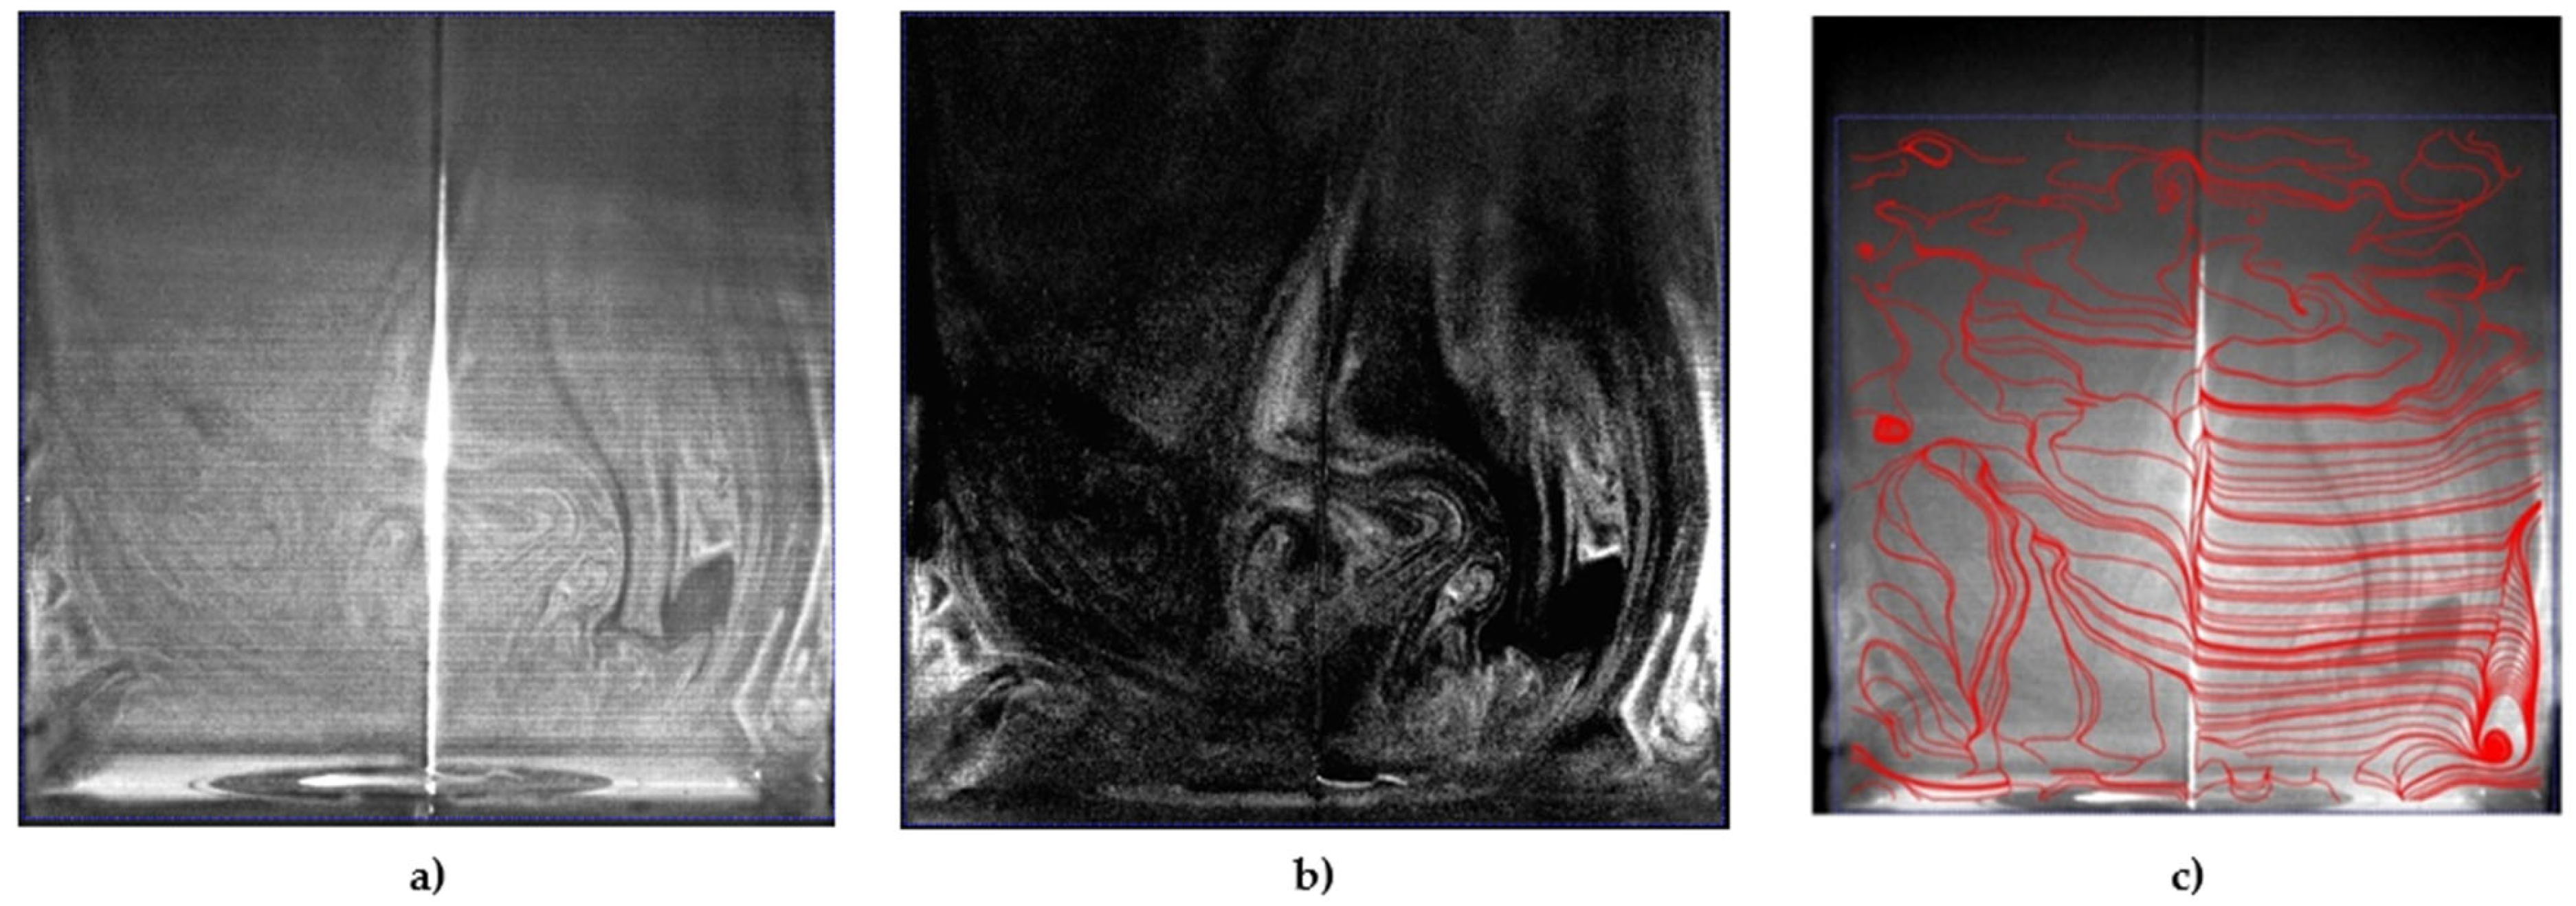
Figure 6 showed the instantaneous smoke flow visualizations and the time-average flow streamline in the proximity of the electrodes for the identification of vortical flow pattern generated in quiescent atmospheric air using a disk and needle type actuator powered by a nanosecond repetitively pulsed discharges generator. It was observed that the vortexes were generated at the corners of a closed rectangular box that could be used to highlight the recirculation of flow in the burner applications, and this aerodynamic effect could be essential to control the combustion characteristics. The contours of the instantaneous and time-average velocity magnitude are presented in Figure 7. The induced majority induced flow was on the right and covered about the 5 cm height region. The maximum velocity time-average magnitude is approximately 0.012 m/s and the maximum instantaneous magnitude velocity is in the order of 0.065 m/s.
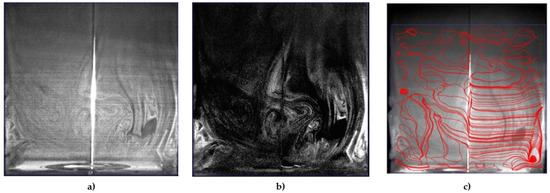
Figure 6.
Instantaneous smoke visualization of flow produced by the disk-needle plasma actuator: (a) raw image; (b) image with subtract mean intensity; (c) streamlines of the time-averaged flow field.
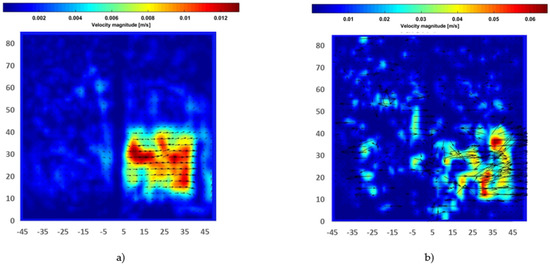
Figure 7.
Contour of flow produced by disk-needle plasma actuator: (a) Time-averaged velocity magnitude; (b) Instantaneous velocity. (Axes dimensions in mm).
However, for a better understanding of flow structures, it was challenged to extract the coherent flow motions from a random signal. Proper orthogonal decomposition (POD) analysis is the most powerful and established technique in the field of fluid dynamics to obtain the most relevant and protuberant spatial flow structures. That could help to control the flow dynamics. Before the analysis of POD based structures, it is mandatory to examine the criteria of the broadness of modes which has captured almost all the relative energy.
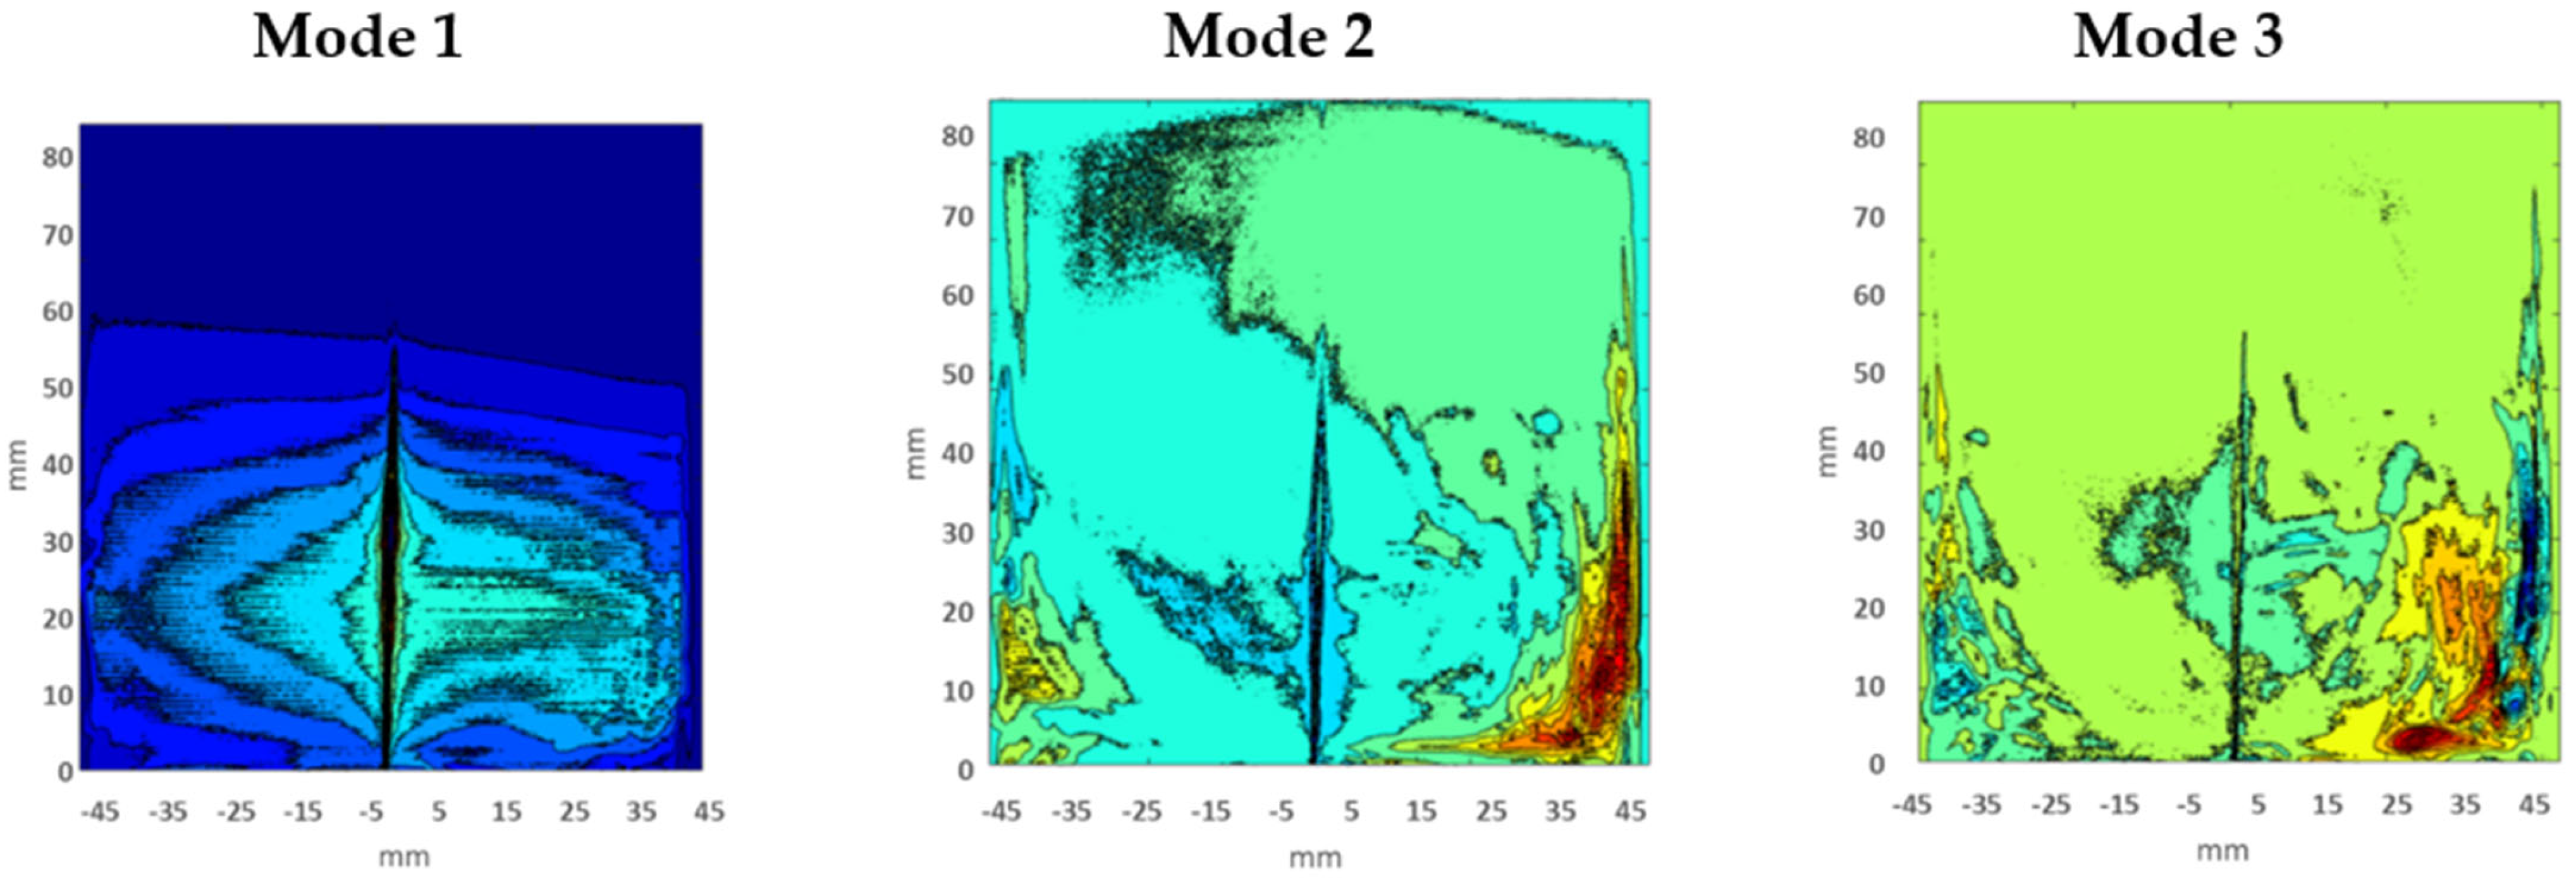
Therefore, Figure 8 is showing the individual relative energy contributions of the first 10 eigenmodes. It has been perceived that relative energy is generally consumed and distributed by the first three modes. Though, the contribution of Mode 1 guided high; it captured approximately 80% of the total energy, with POD modes above number 3 having very little impact. Therefore, only the first three modes were essential for the analysis of flow vortexes and structures. The first three eigenmodes which showed the flow field and vortexes in two-dimensional space for test Case 1 are shown in Figure 9. It has been noticed that Mode 1 is not symmetric with Mode 2 and Mode 3; this is because Mode 1 contained around 80% of total energy, so the main dominant structure could be as in Mode 1. However, Mode 2 and Mode 3 have somehow resembled each other because they acquired almost the same energy distribution. The first mode showed the dominant and actual structure produced by the swirling of flow around the walls of a closed box. This flow structure could contribute to improving the mixing performance of flow and combustion enhancement.
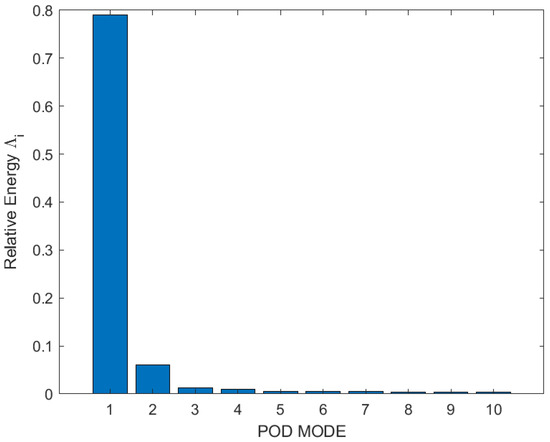
Figure 8.
Relative energy of first 10 POD modes of test Case 1.

Figure 9.
First three POD modes.
4.2. ZDPlaskin Results
In order to predict the effect of the plasma needle-ring actuator on the flame ignition, numerical simulations have been performed using a hybrid approach, coupling ZDPlasKin code and Chemkin code and the experimental data of [44] regarding the nanosecond repetitively pulsed discharges in air, and methane/air mixture were used to validate the kinetic modeling of the plasma discharge. ZDPlasKin was used to validate the kinetic mechanism by following experimental parameters. Single pulse discharge of 20 ns with peak tuned at EN of 289 Td, the initial pressure of 8000 Pa and temperature of 300 K and equivalence ratio of 1, and pure air (O2 + 3.76 N2) were used. It was found that the plasma kinetic model permitted a good fitting with experimental study of the decay process of the O atom in mole fraction for both air and methane/air mixture at similar equivalence ratios as presented in Figure 10. Furthermore, it was also analyzed that in the methane/air mixture, the decay rate of the O atom was relatively high in comparison with the case of pure air; because, due to methane dissociation, H atoms and CH3 radicals were produced and reacted with O atoms, which leads to the reduction of O atoms in the methane/air mixture.
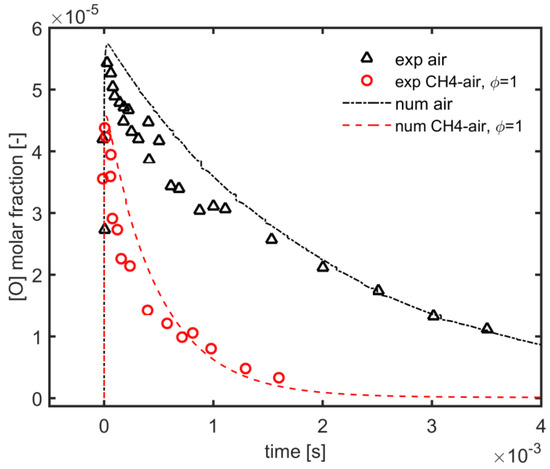
Figure 10.
Validation: Time evolution of predicted vs. experimental data [44] of O atoms decay process with air and methane/air at 300 K and 8000 Pa.
Numerical analysis of plasma kinetics of air and methane/air mixture were performed, considering EN equal to 200 Td, the repetition frequency of 10,000 Hz, ambient pressure equal to 1 atm, and temperature set at 300 K. CH4/O2/N2 were used as initial reactants. ZDPlasKin was integrated with the Boltzmann equation solver (BOLSIG+) in order to predict the time dependent evolution of species.
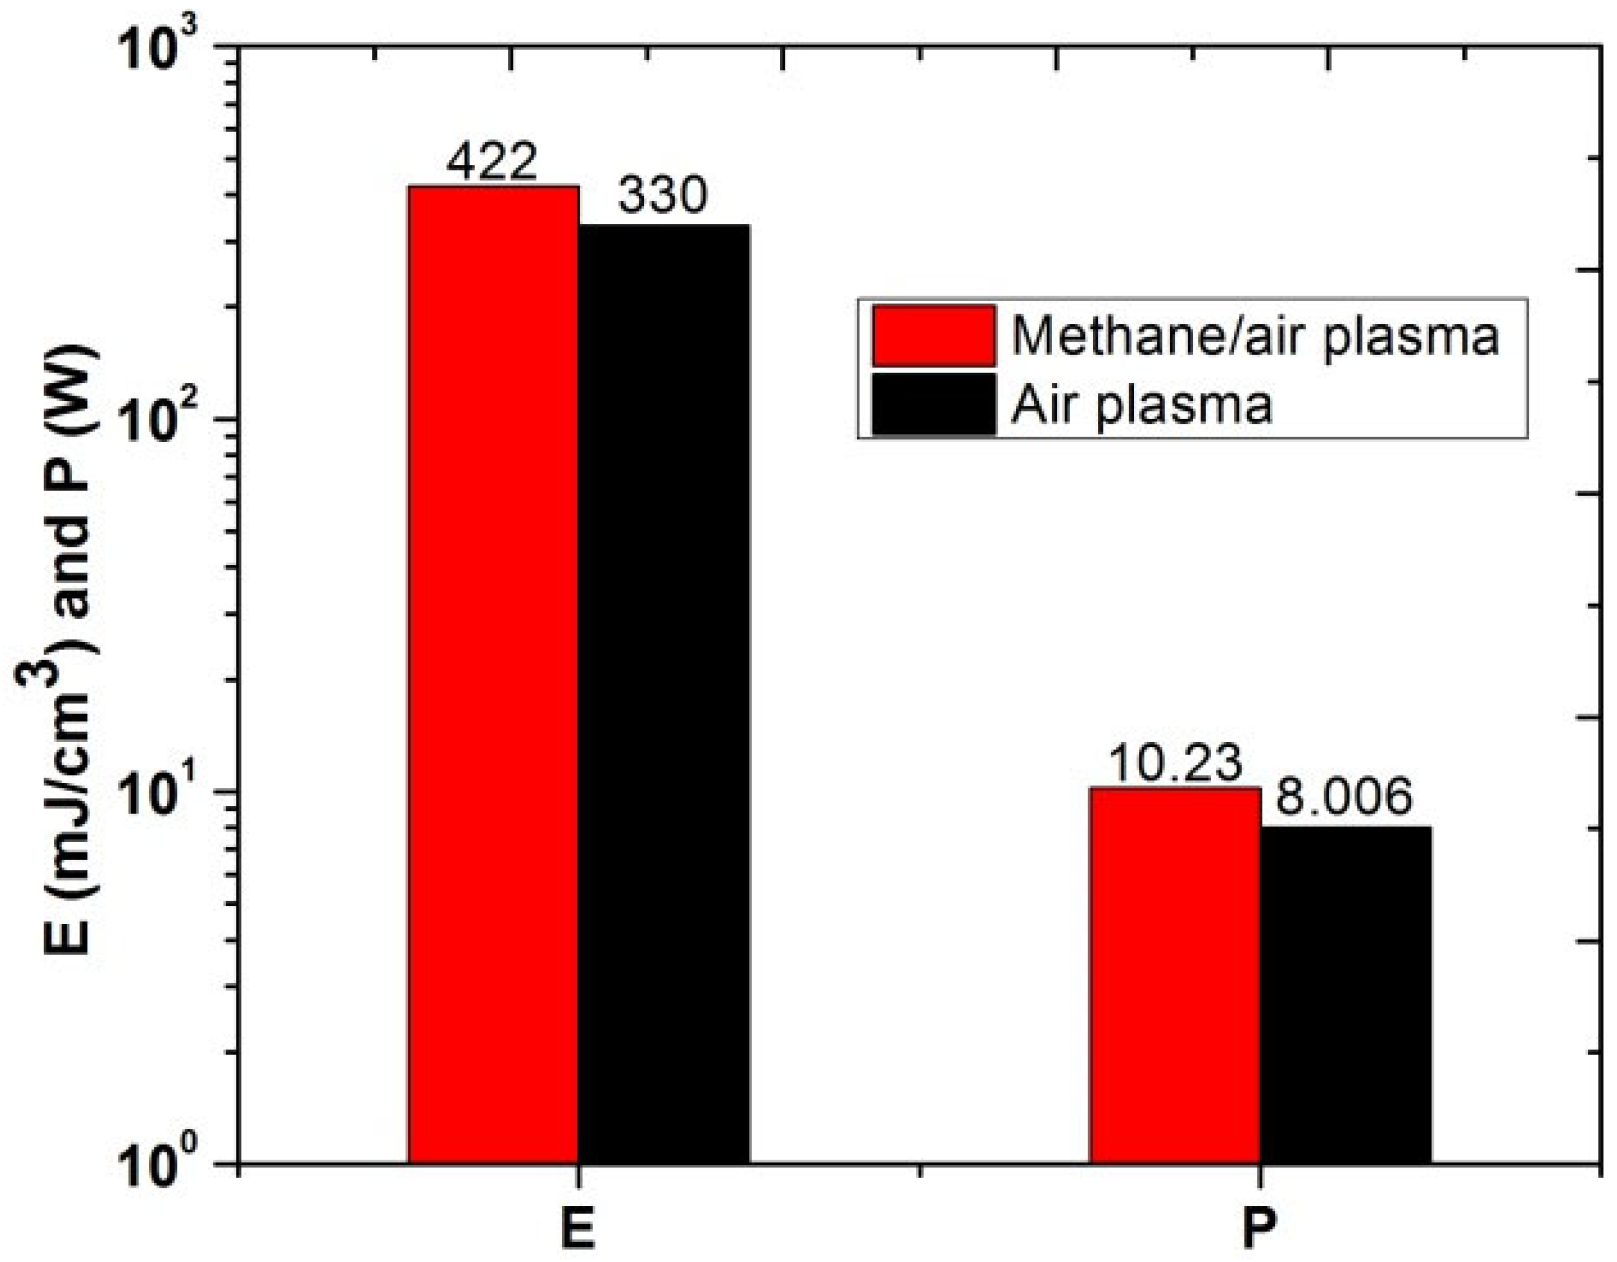
Figure 11 shows the comparative analysis of energy deposition and electrical power for plasma discharges in air and methane/air mixture. Energy and power utilized for methane/air actuation is higher than the pure air actuation. It could be due to the exciation and ionization of methane that required more energy deposition and power.

Figure 11.
Energy deposition (mJ/cm3) and electrical power (W) of air and methane/air plasma actuation.
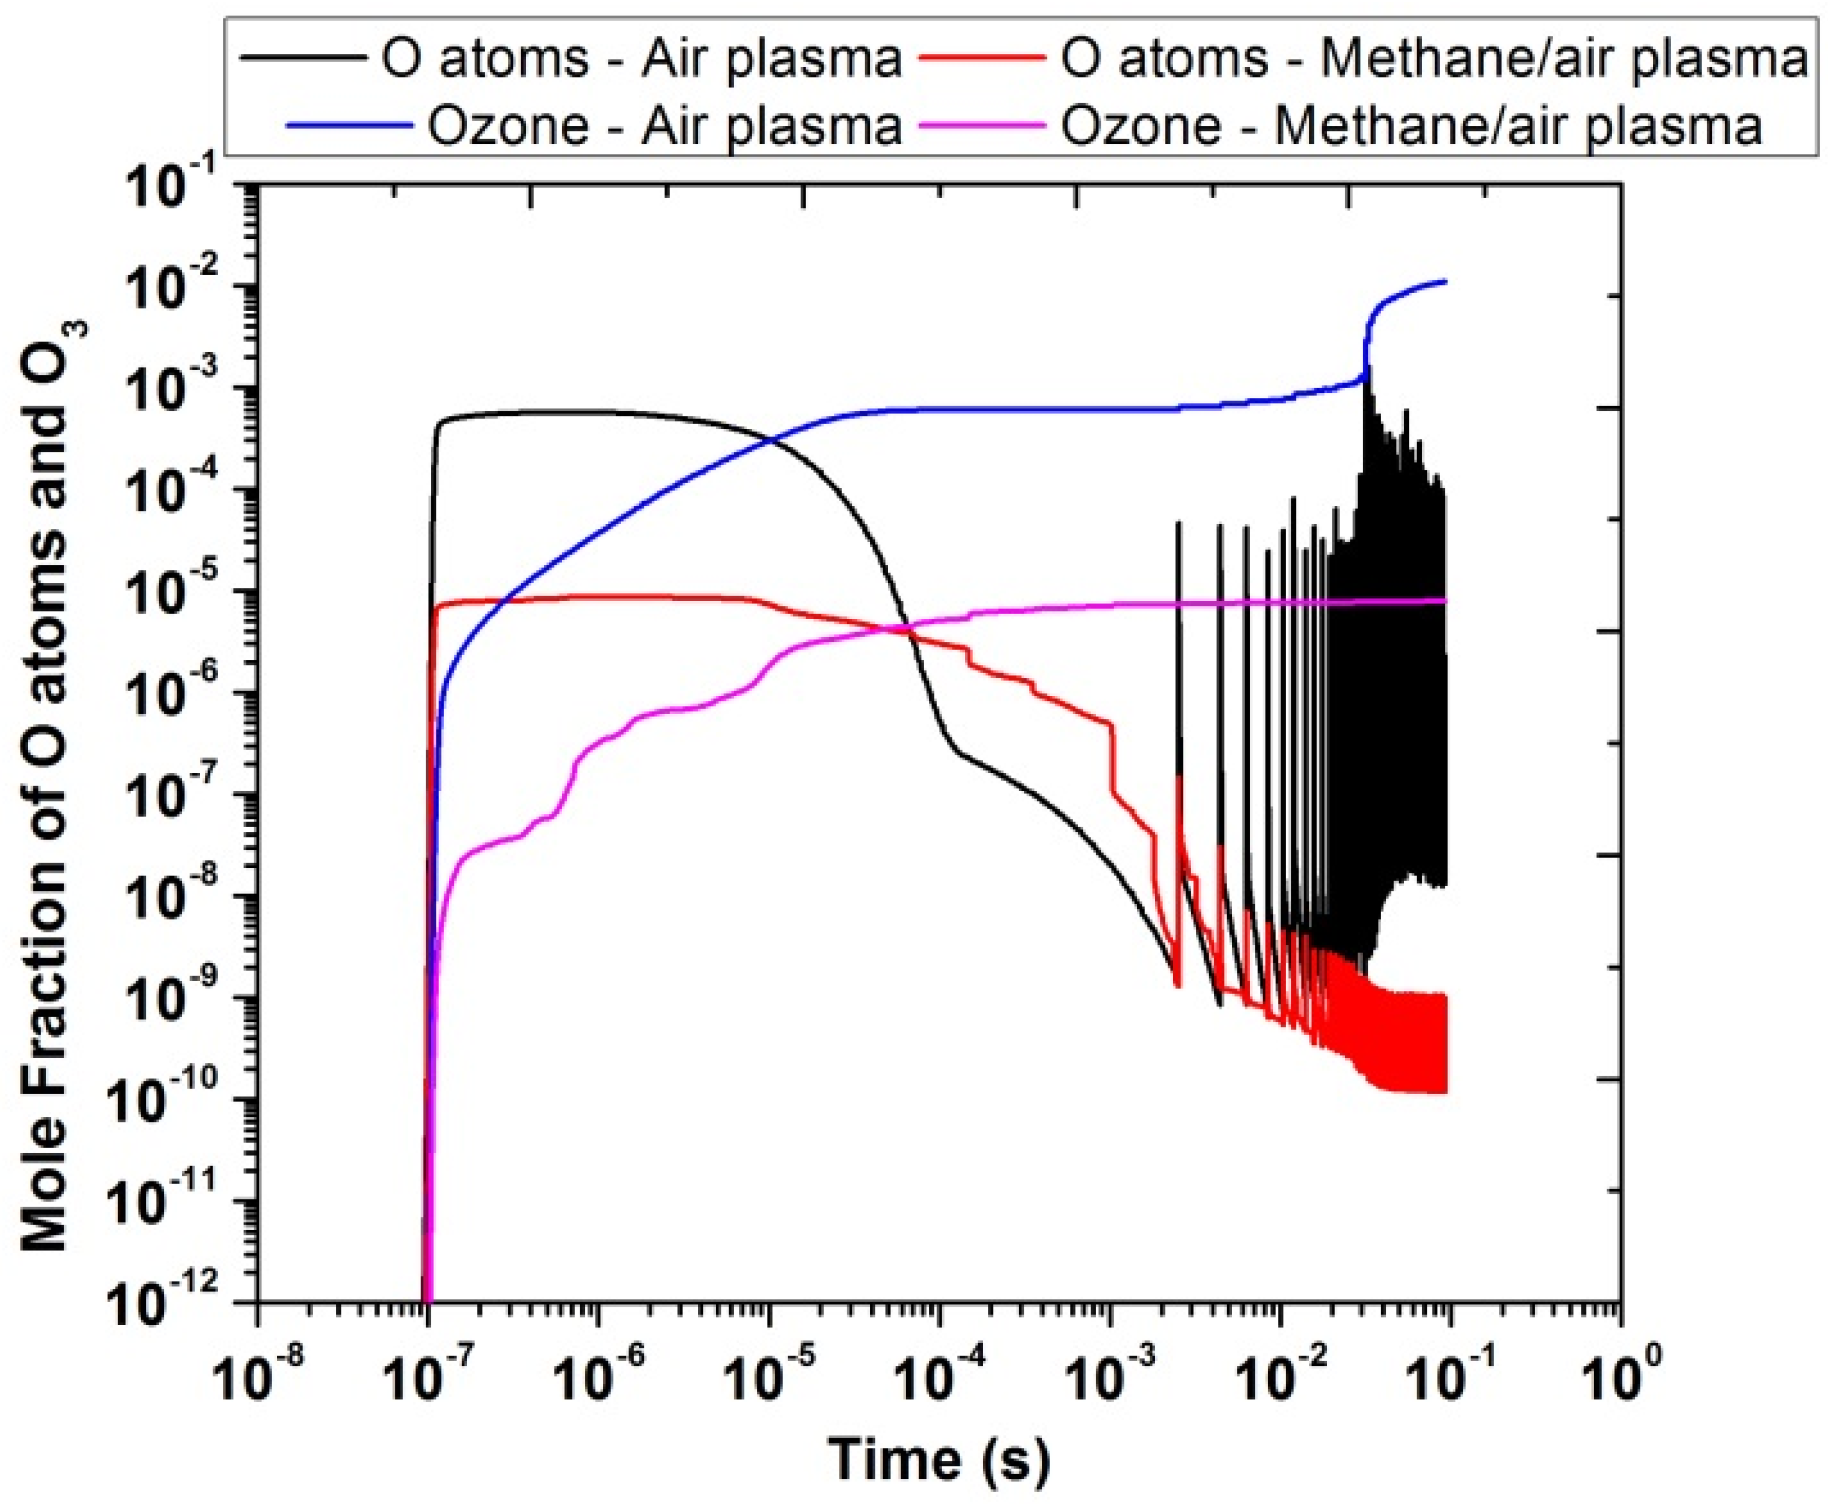
Figure 12 shows the comparison of the temporal evolution of O atoms and ozone, produced in the presence of air and methane/air plasma actuation. The mole fractions of O atoms and ozone were higher in the air than in the methane/air plasma discharges. The reason behind the lower production of O atoms in methane/air mixture is due to the consumption of O atoms produced during plasma discharge in reactions with other intermediate species and free radicals resulting from the decomposition of CH4, such as OH. The peak of ozone was close to 10−2 for air and 10−5 for methane/air. However, in the case of O atoms, the concentration peak was close to 10−3 for air and 10−5 for methane/air. Besides this, O atoms are produced in the very short time interval of 10−7 to 10−6 because the electronic excitation states of O atoms were very reactive, when they reacted with oxygen molecules such as O(1S) + O2 → O + O + O and O(1S) + O2(A1) → O + O + O. In contrast, the concentration of ozone was gradually increased with the time interval and the peak was observed around 10−1; this is because ozone reactions are too slow in comparison with other reactions (time scale of about 10−1 s) such as O + O2 + O2 → O3 + O2.

Figure 12.
Temporal evolution of O atoms and O3 in air and methane/air at 10,000 Hz and EN = 200 Td.
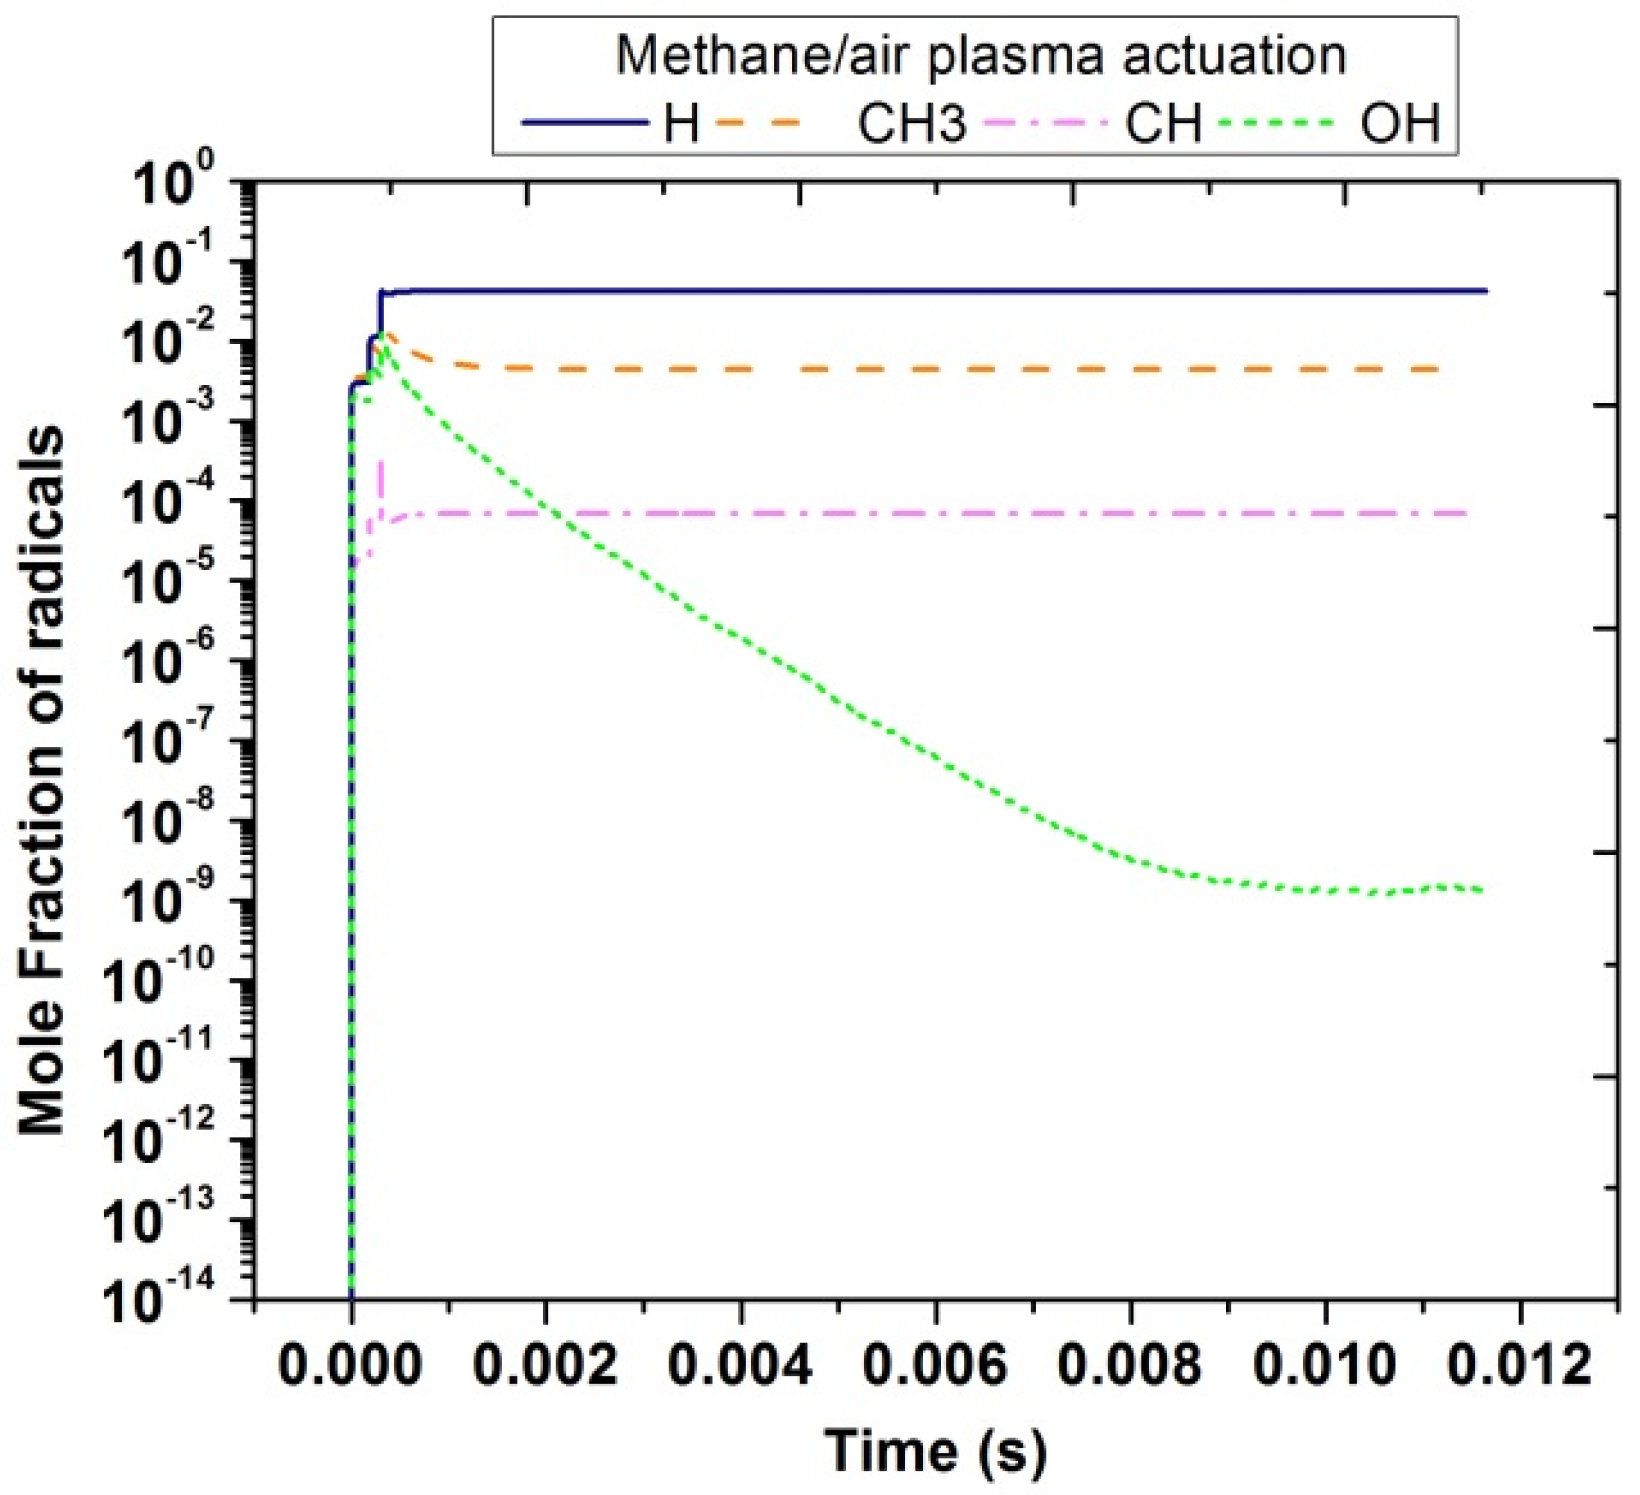
In contrast with plasma discharges in air, in the case of methane/air, other important radicals were produced that could enhance the combustion process. Figure 13 shows the temporal evolution of H, CH3, CH, and OH radicals. It was noticed that the concentration of H species is the highest among all and lies nearly 10−1. The concentration peak of CH3 and OH was almost the same; however, OH species were suddenly reduced because it was unstable and very reactive to form other radicals. CH concentration was between 10−4 to 10−3.
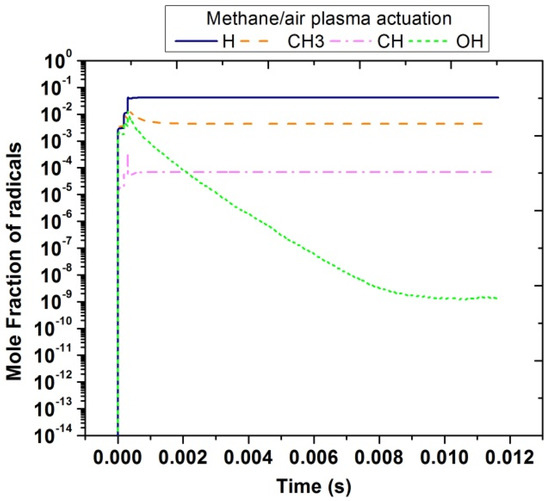
Figure 13.
Temporal evolution of H, CH, CH3 and OH in methane/air at 10,000 Hz and EN = 200 Td.
4.3. CHEMKIN Results: Effects of Pulses Number on Flame Ignition Characteristics
The ignition delay timings are predicted by means of time required for achieving the flame temperature, which could be enough for the combustion process. Successful ignition was only achieved when the temperature reached the threshold value of chain branching of methane. Plasma discharges give energy directly to the free electrons in the plasma. Later, electron energy was converted into bond energy of neutral radicals. Finally, during the ignition, the bond energy of intermediates was transformed into internal energy, which could endorse the combustion augmentation. Furthermore, plasma has a significant impact on the fluid dynamics, such as induced flow velocity, which created the recirculation zone near the corners of the combustor, which improved the mixing performance of the mixture, ultimately resulting in the reduction of ignition delay timings.
The effects of the number of pulses on the ignition delay timings were numerically investigated at EN = 200 Td, in accordance with the value experimentally estimated by the electrical characterization in Section 4.1.1; in the previous section, it was concluded that by using nanosecond repetitively pulsed discharges, a fast heating process was present, resulting in the rise of the temperature of the mixture, and the estimated results obtained from the ZDPlasKin in the form of fuel and air decomposition and rise in the temperature of the mixture, reported in Table 3, were introduced into the CHEMKIN to characterize the flame ignition process.
The chemical kinetic reaction model was comprised of gas-phase and combustion reactions from the GRI-Mech v3.08 mechanism. The ozone reaction list reported in [45] was also added to the combustion kinetics scheme to consider the production and decomposition reactions of ozone, oxidation of ozone, HO2 formation, ozone reactions of NO, CH3, N, and H2O, and methane–ozone reactions. In addition, the neutral radicals and ozone produced from the plasma discharge of air and methane/air mixture were considered, because it was also noticed that ozone was increased in both air and methane/air plasma actuation. The closed homogenous batch reactor (CHBR) solver was selected to predict the effects of air and methane/air plasma actuation on ignition enhancement by comparing with the clean baseline case without plasma actuation at different low inlet temperature and pressure keeping 1 atm. Two major control factors were set to monitor the ignition process, such as the temperature inflection point and the maximum production of OH particles. The ignition delay timings were computed by using these two kinds of techniques; for each condition, comparisons were performed between the clean case (without plasma) with two plasma assisted ignitions, one with plasma actuation in the mixture of methane/air and the other acting only in the air.
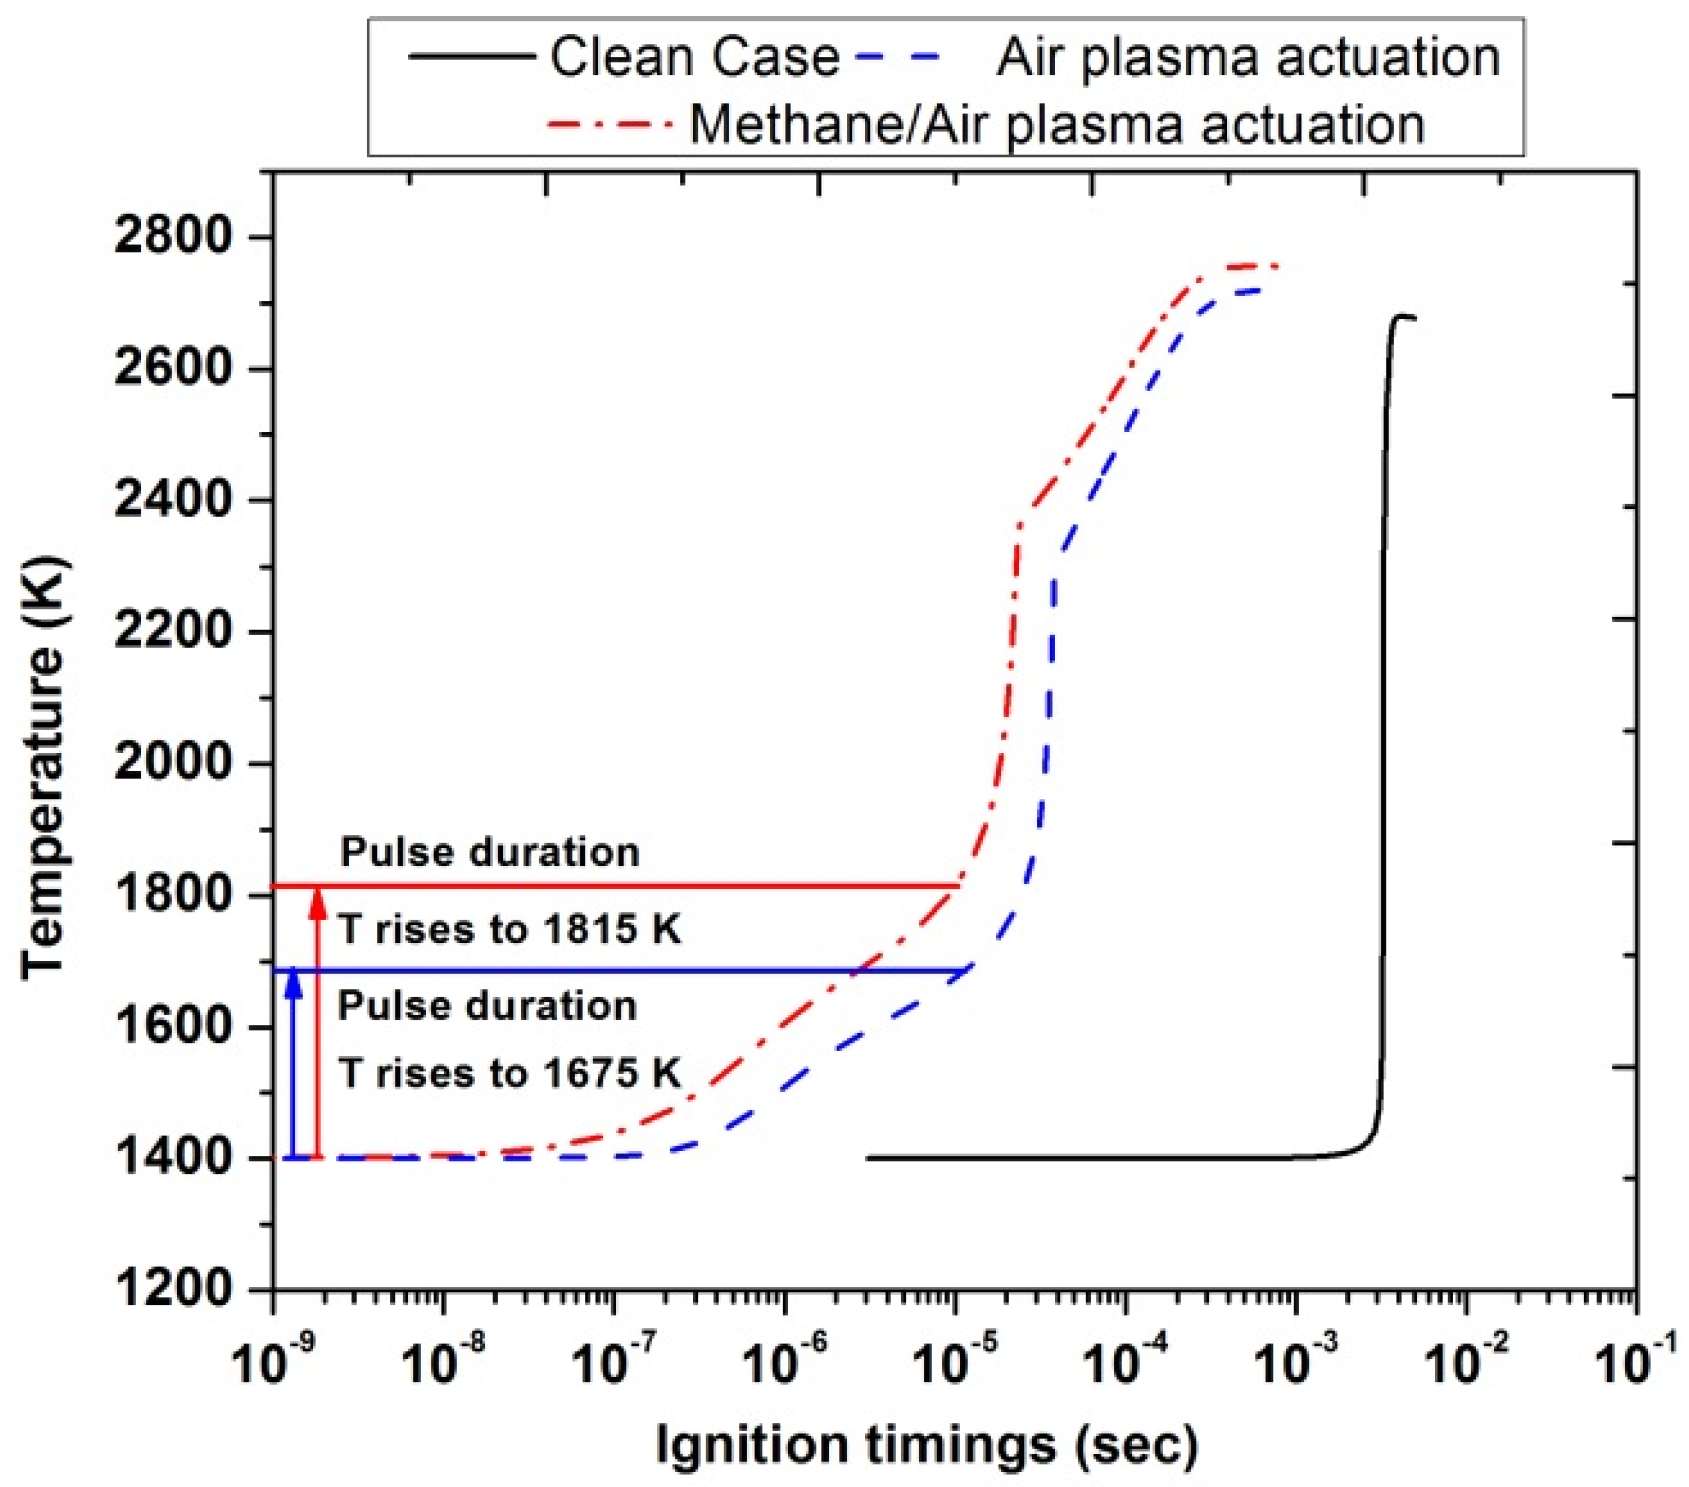
Figure 14 highlights the ignition delay timings for air plasma actuation and methane/air plasma actuation with a single pulse discharge at an inlet temperature of 1400 K. This temperature value was chosen because it was the minimum value to have ignition in the case without plasma actuation (clean case). It has been observed that during the pulse discharge, the temperature gradually increased for both types of actuations. The horizontal red and blue line corresponded to the end of the plasma discharge. The rise in temperature in the case of methane/air activation (1815 K) is higher than the air activation (1675 K) as shown by the vertical red and blue lines. The ignition timings significantly reduced nearly up to (10−5 s) as compared with\ clean case (10−3 s). Furthermore, the peak temperature of air activation (2718 K) and methane/air activation (2754 K) was also increased in comparison with the clean case (2677 K), but the difference was slightly low between the two actuated cases.
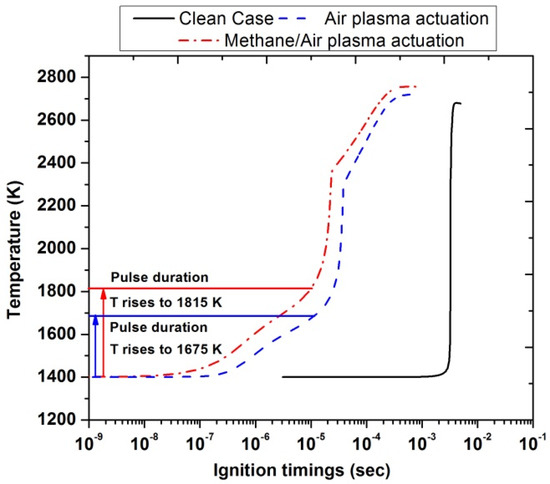
Figure 14.
Ignition timings analysis by comparing the clean case without plasma (black), and plasma actuation in air (blue) and in methane/air (red) after a single pulse discharge at Ti =1400 K, EN = 200 Td, and stoichiometric conditions.
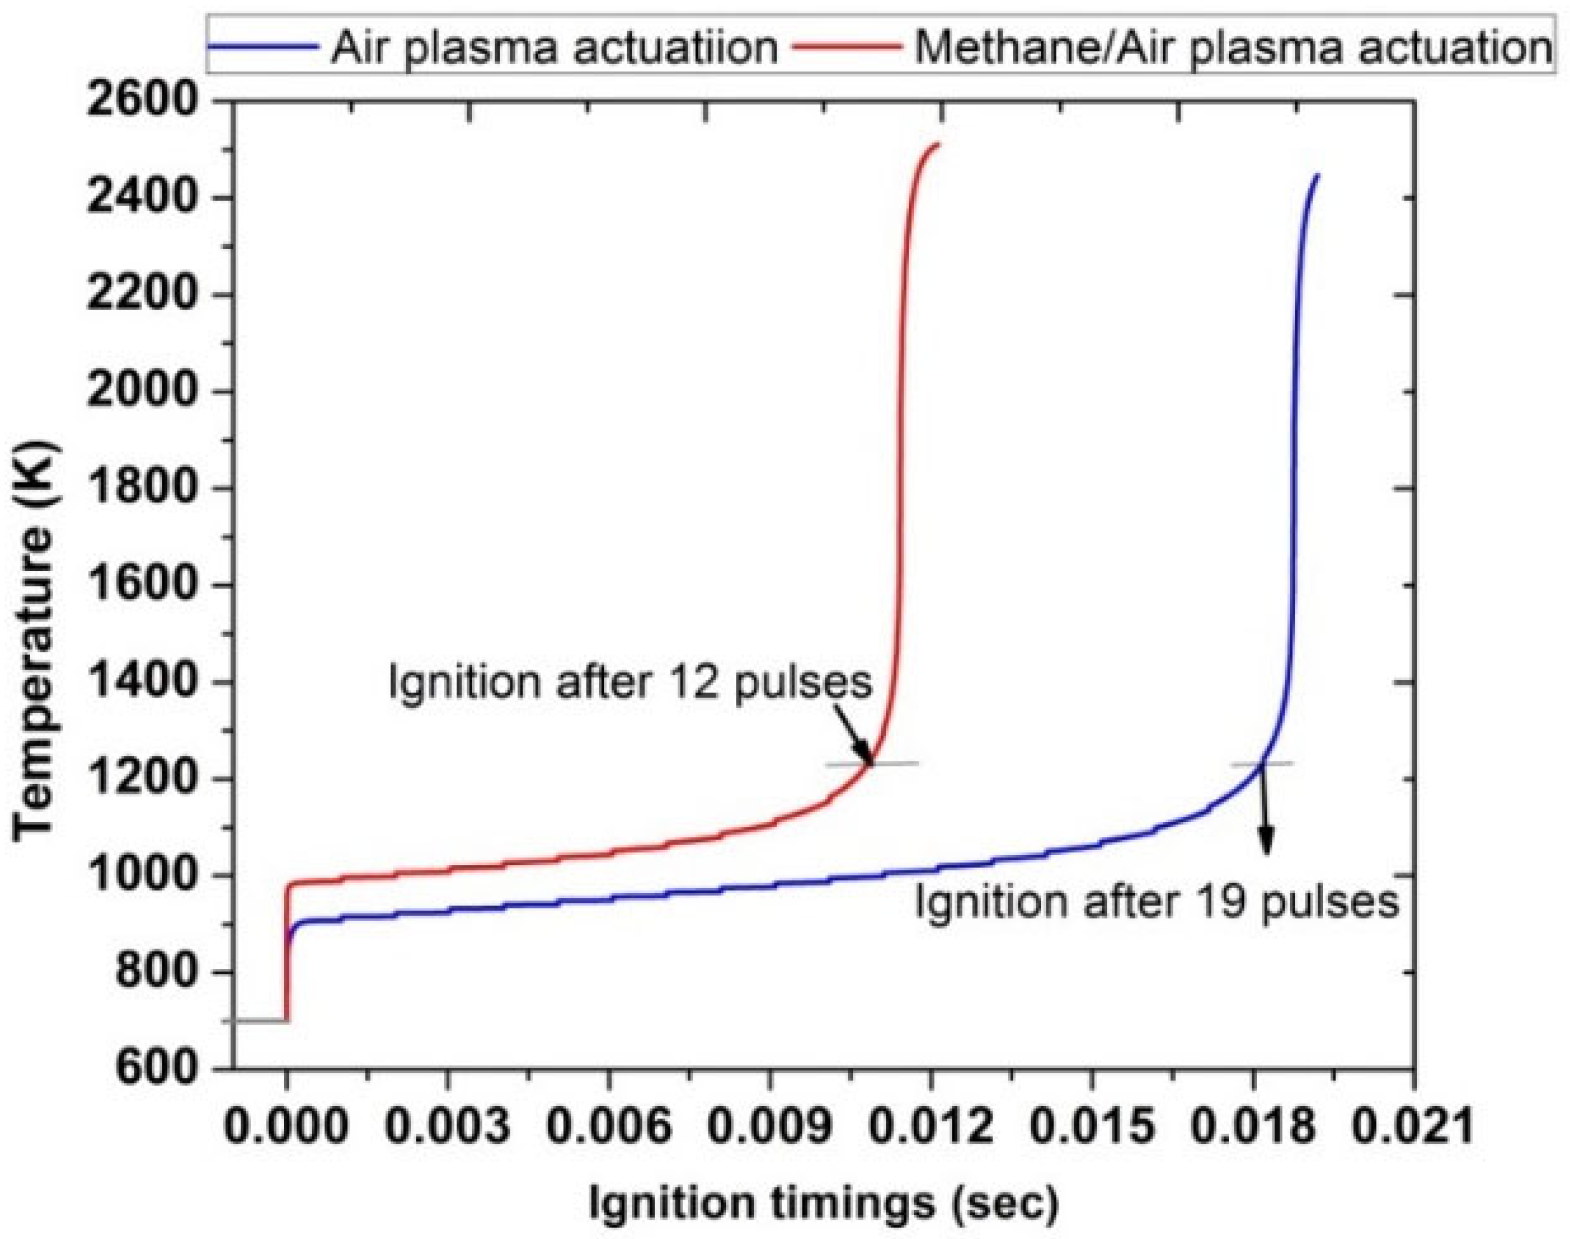
In contrast to the case with Ti = 1400 K, the comparison of ignition timings at inlet temperature Ti = 700 K shows a significant improvement when plasma is used for the activation of methane/air mixture as compared with air, as shown in Figure 15. Ignition timings were 0.01 s for methane/air while in the case of air, ignition was achieved at 0.018 s. Besides this, in the methane/air case, 12 pulses were required to achieve successful ignition; however, in air, 19 pulses were needed to ignite.

Figure 15.
Ignition timings analysis by comparing plasma actuation in air (blue) and in methane/air (red) at fixed low inlet temperature 700 K, fixed EN = 200 Td, fixed frequency 10,000 Hz, and stoichiometric conditions.
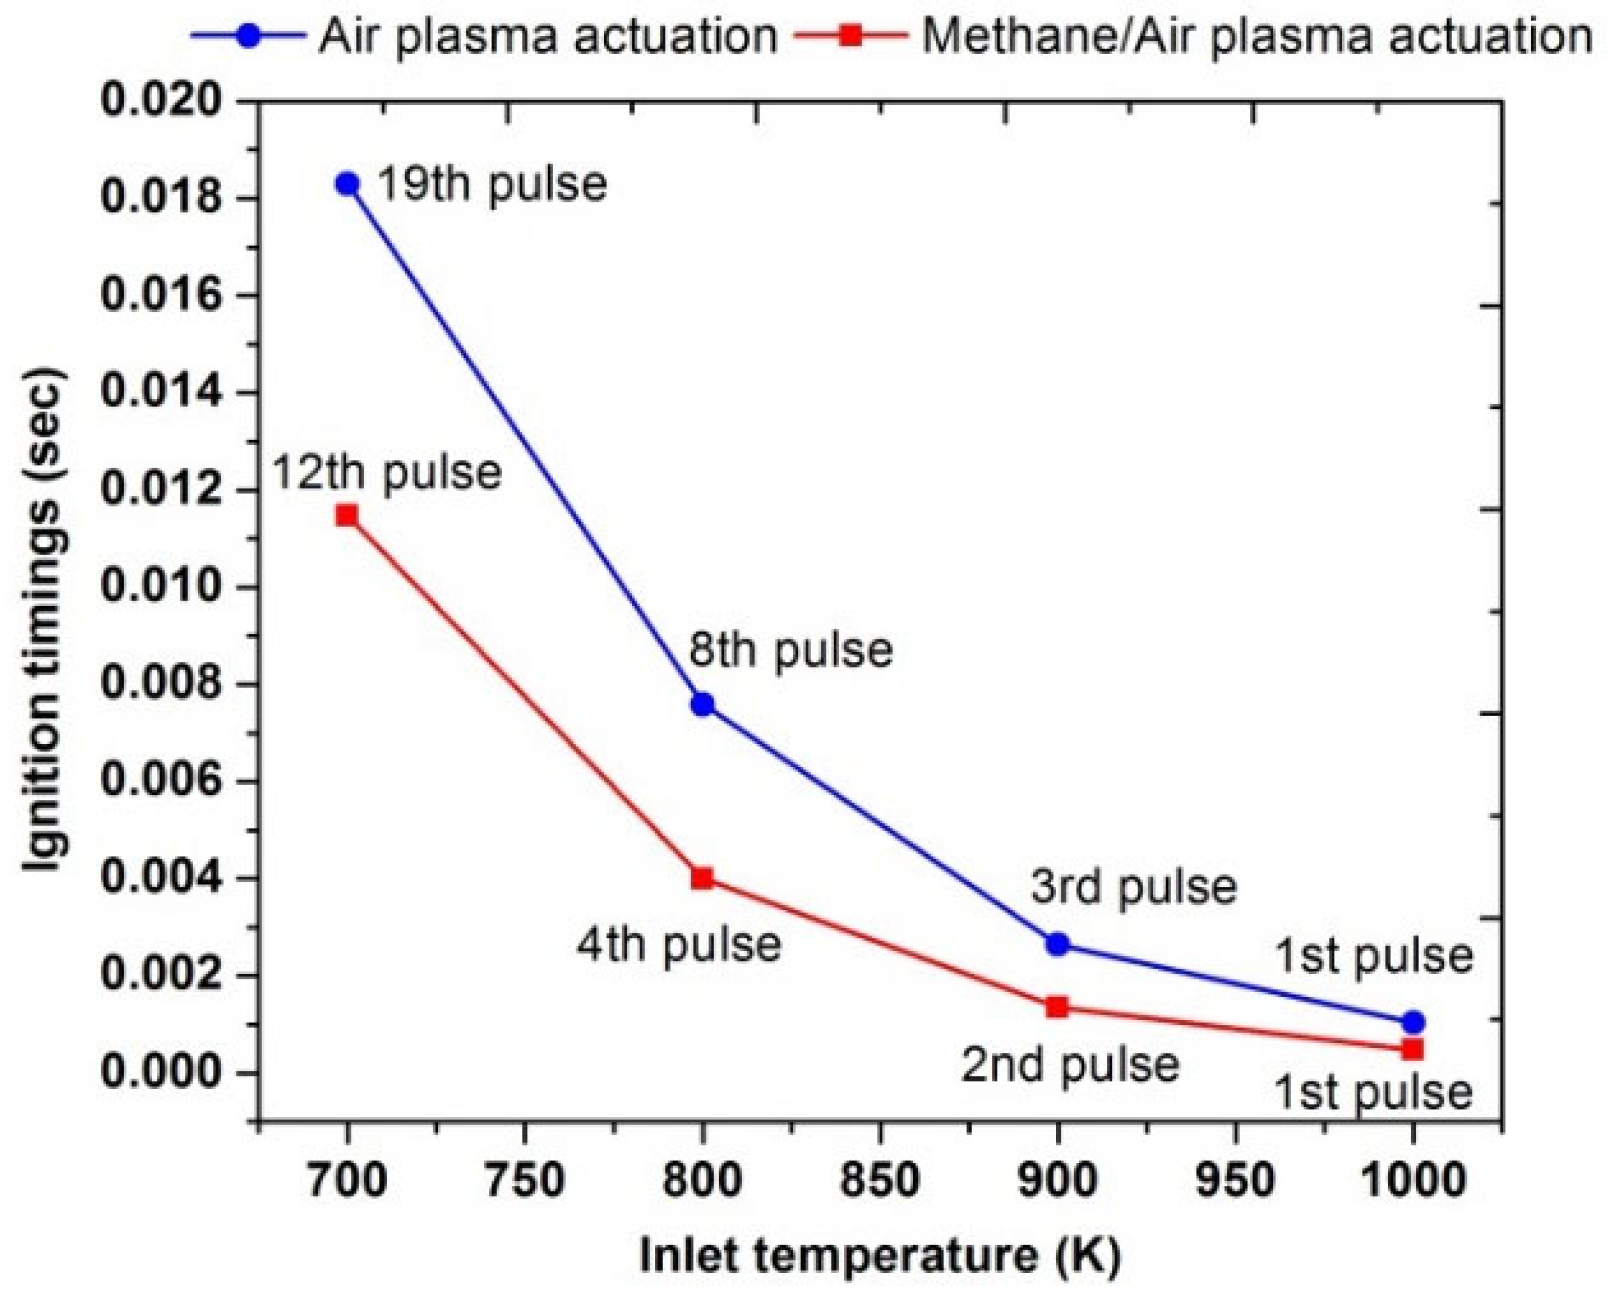
A parametric study was performed to compute the effects of different pulses numbers on the ignition enhancement at different values of the inlet temperature. Figure 16 showed that at a low inlet temperature, such as at 700 K, the plasma actuation in the air required 19 pulses to achieve flame ignition. However, during the methane/air plasma actuation, the ignition has been reached after the 12th pulse discharge; below this number, just a rise in temperature of the combustible mixture was observed due to plasma discharge. The total energy consumed for the plasma activation of the methane/air mixture and air were 5.04 J and 6.27, respectively. It means that ignition is even possible at inlet temperatures lower than 700 K, but it consumed more energy because it required several pulses. Moreover, it was also concluded that ignition delay timings and pulses numbers are heavily reduced in methane/air activations as compared to air activations. Meanwhile, as the inlet temperature is increased, the number of pulses, as well as the ignition timings, were also reduced. Therefore, at 1000 K, ignition occurred after the first pulse in both types of plasma activations.
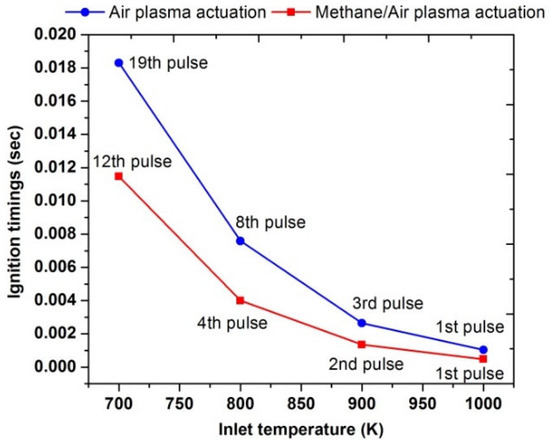
Figure 16.
Comparative analysis of ignition timings of plasma actuation in air (blue) and in methane/air (red) by varying pulses number at different parametric temperature, fixed EN = 200 Td, fixed frequency = 10,000 Hz, and stoichiometric conditions.
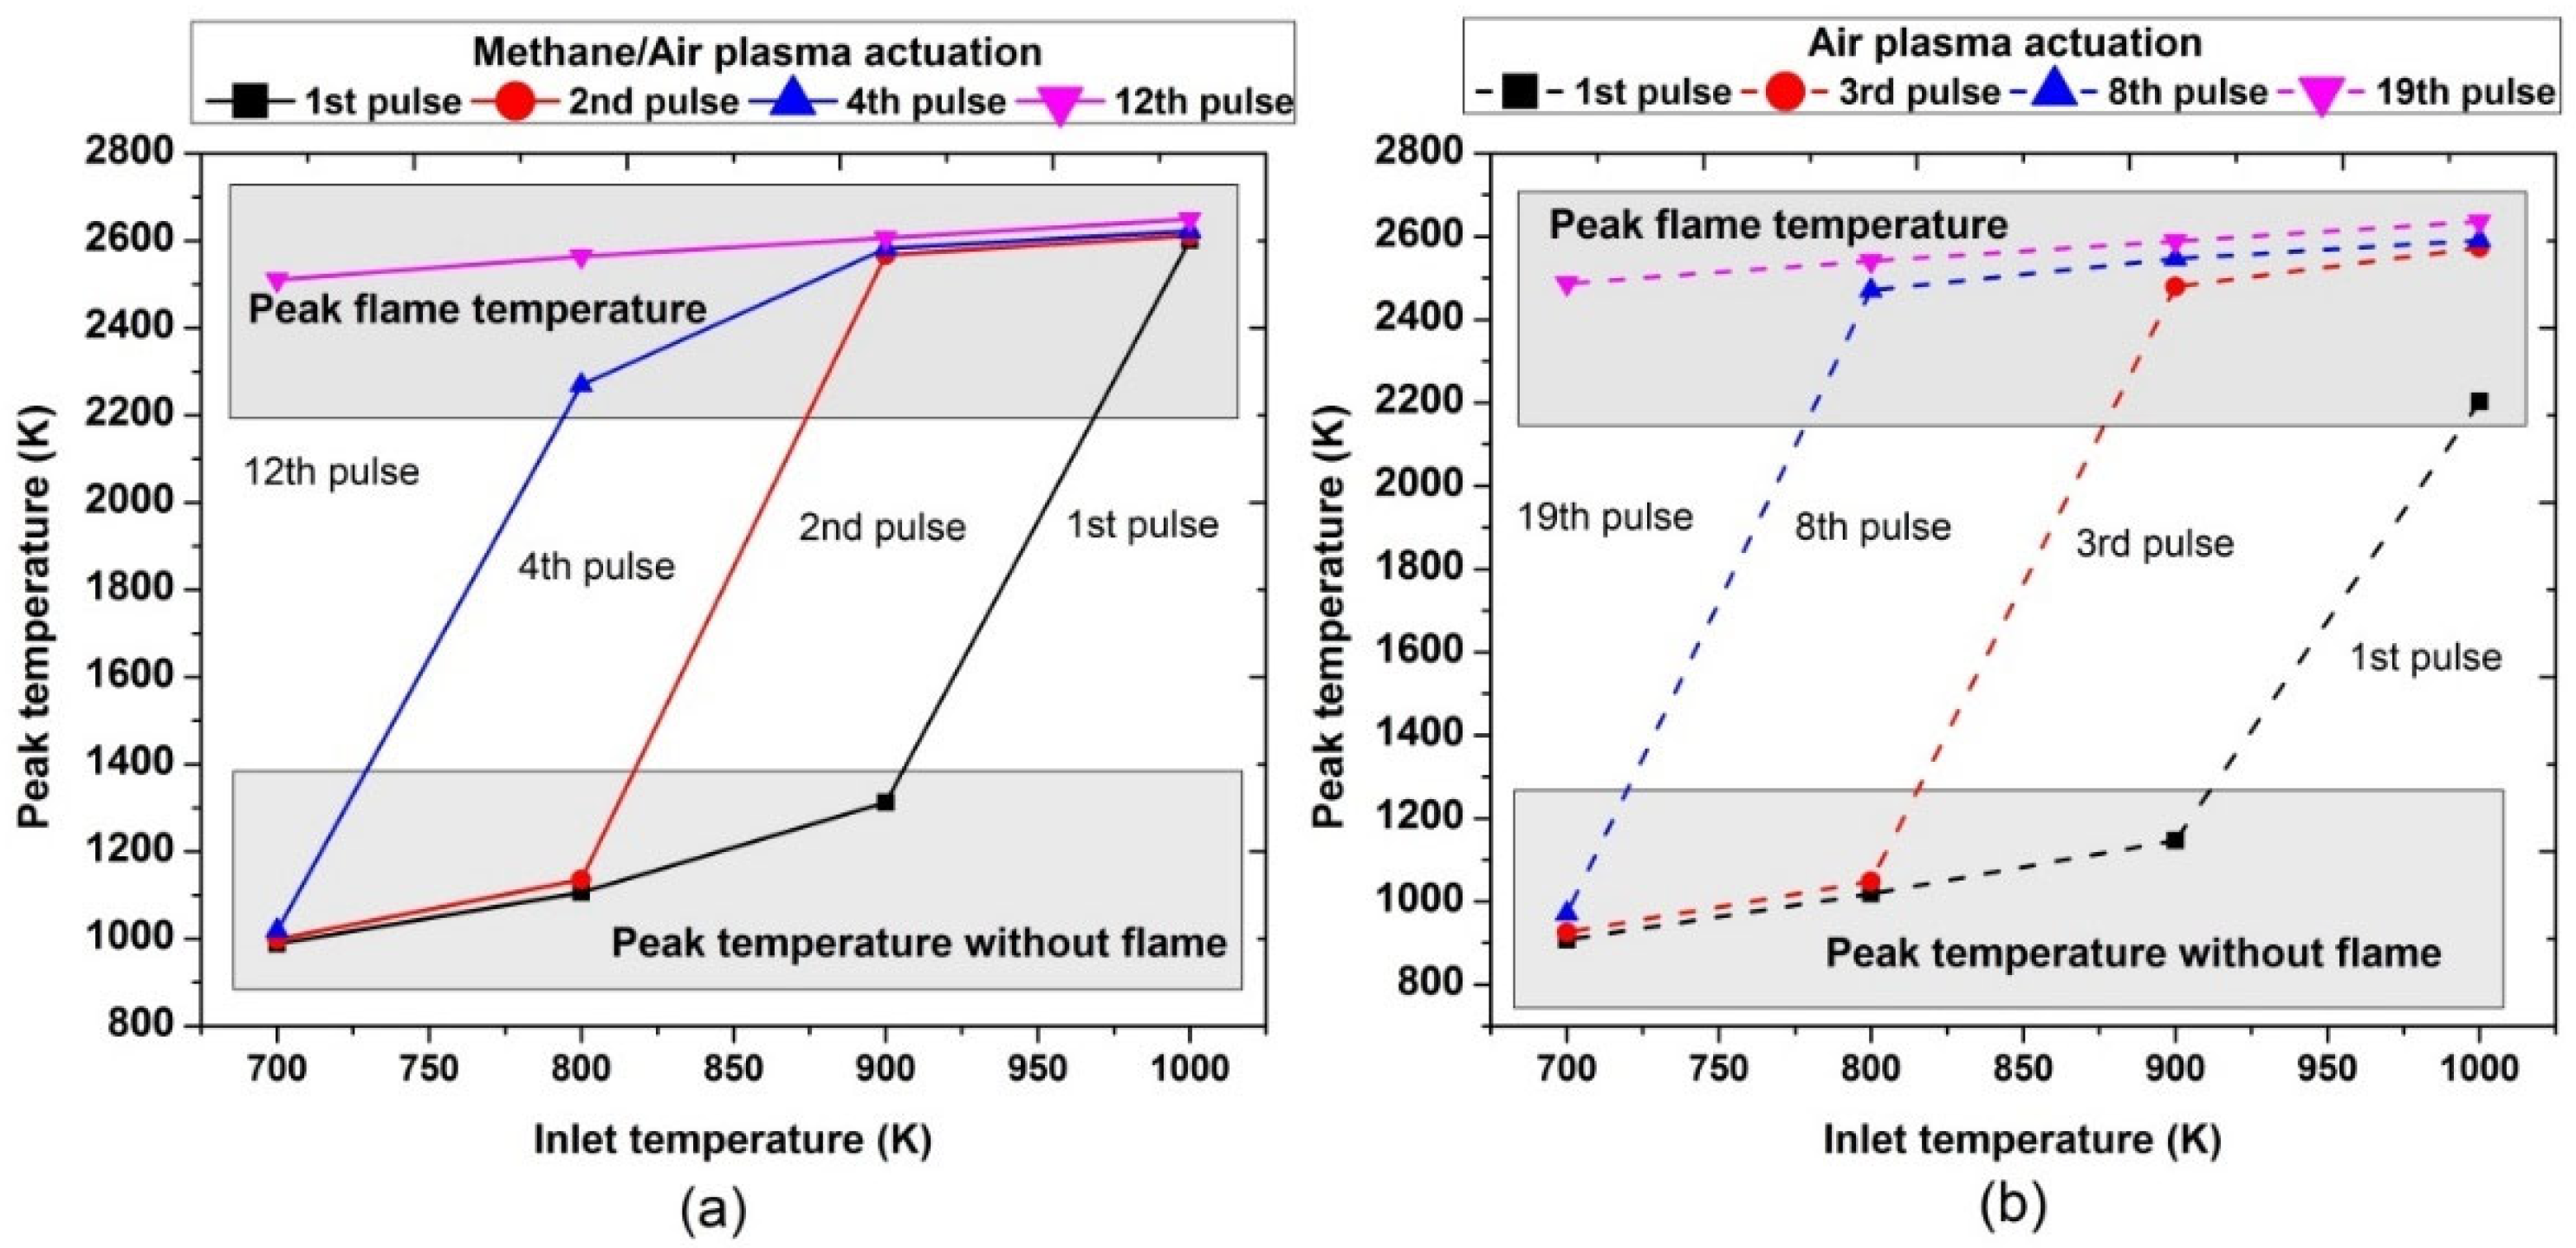
Figure 17 shows the peak temperature values of the mixture after a certain amount of pulses at different inlet reactant temperatures. It was found that one pulse is sufficient to activate combustion only if the inlet temperature is 1000 K or higher. At this condition, the peak flame temperature in the presence of methane/air plasma actuation (2500 K) was higher than the air activation (2170 K); while at lower inlet temperatures (700, 800, and 900 K), only a small rise in the mixture temperature was observed and there was no flame after the first pulse in both air and methane/air.
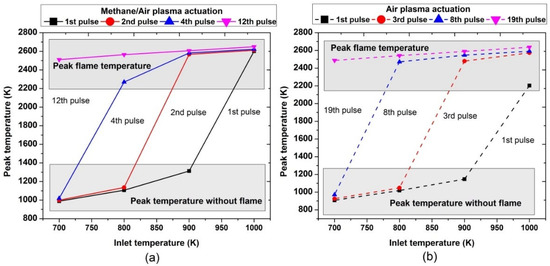
Figure 17.
Comparative analysis of peak temperature achieved during the ignition process by varying pulses number at different parametric temperatures, fixed EN = 200 Td, fixed frequency = 10,000 Hz, and stoichiometric conditions: (a) methane/air plasma activation (solid lines), (b) air plasma activation (dashed line).
At the inlet temperature of 700 K, a single pulse took the mixture to 1000 K; at 800 K, the pulse took it to 1050 K. At 900 K, the pulse increased the temperature to 1200 K; while at 1000 K, ignition occurred and the resultant mixture temperature was 2600 K. Furthermore, at 700 K, the combustion occurred after 12 and 19 continuous successful pulses for methane/air and air, respectively, leading to the peak flame temperature at almost around 2500 K; at an inlet temperature of 800 K, the combustion was achieved after the 2nd and 3rd continuous pulses for plasma discharges in methane/air and air, respectively.
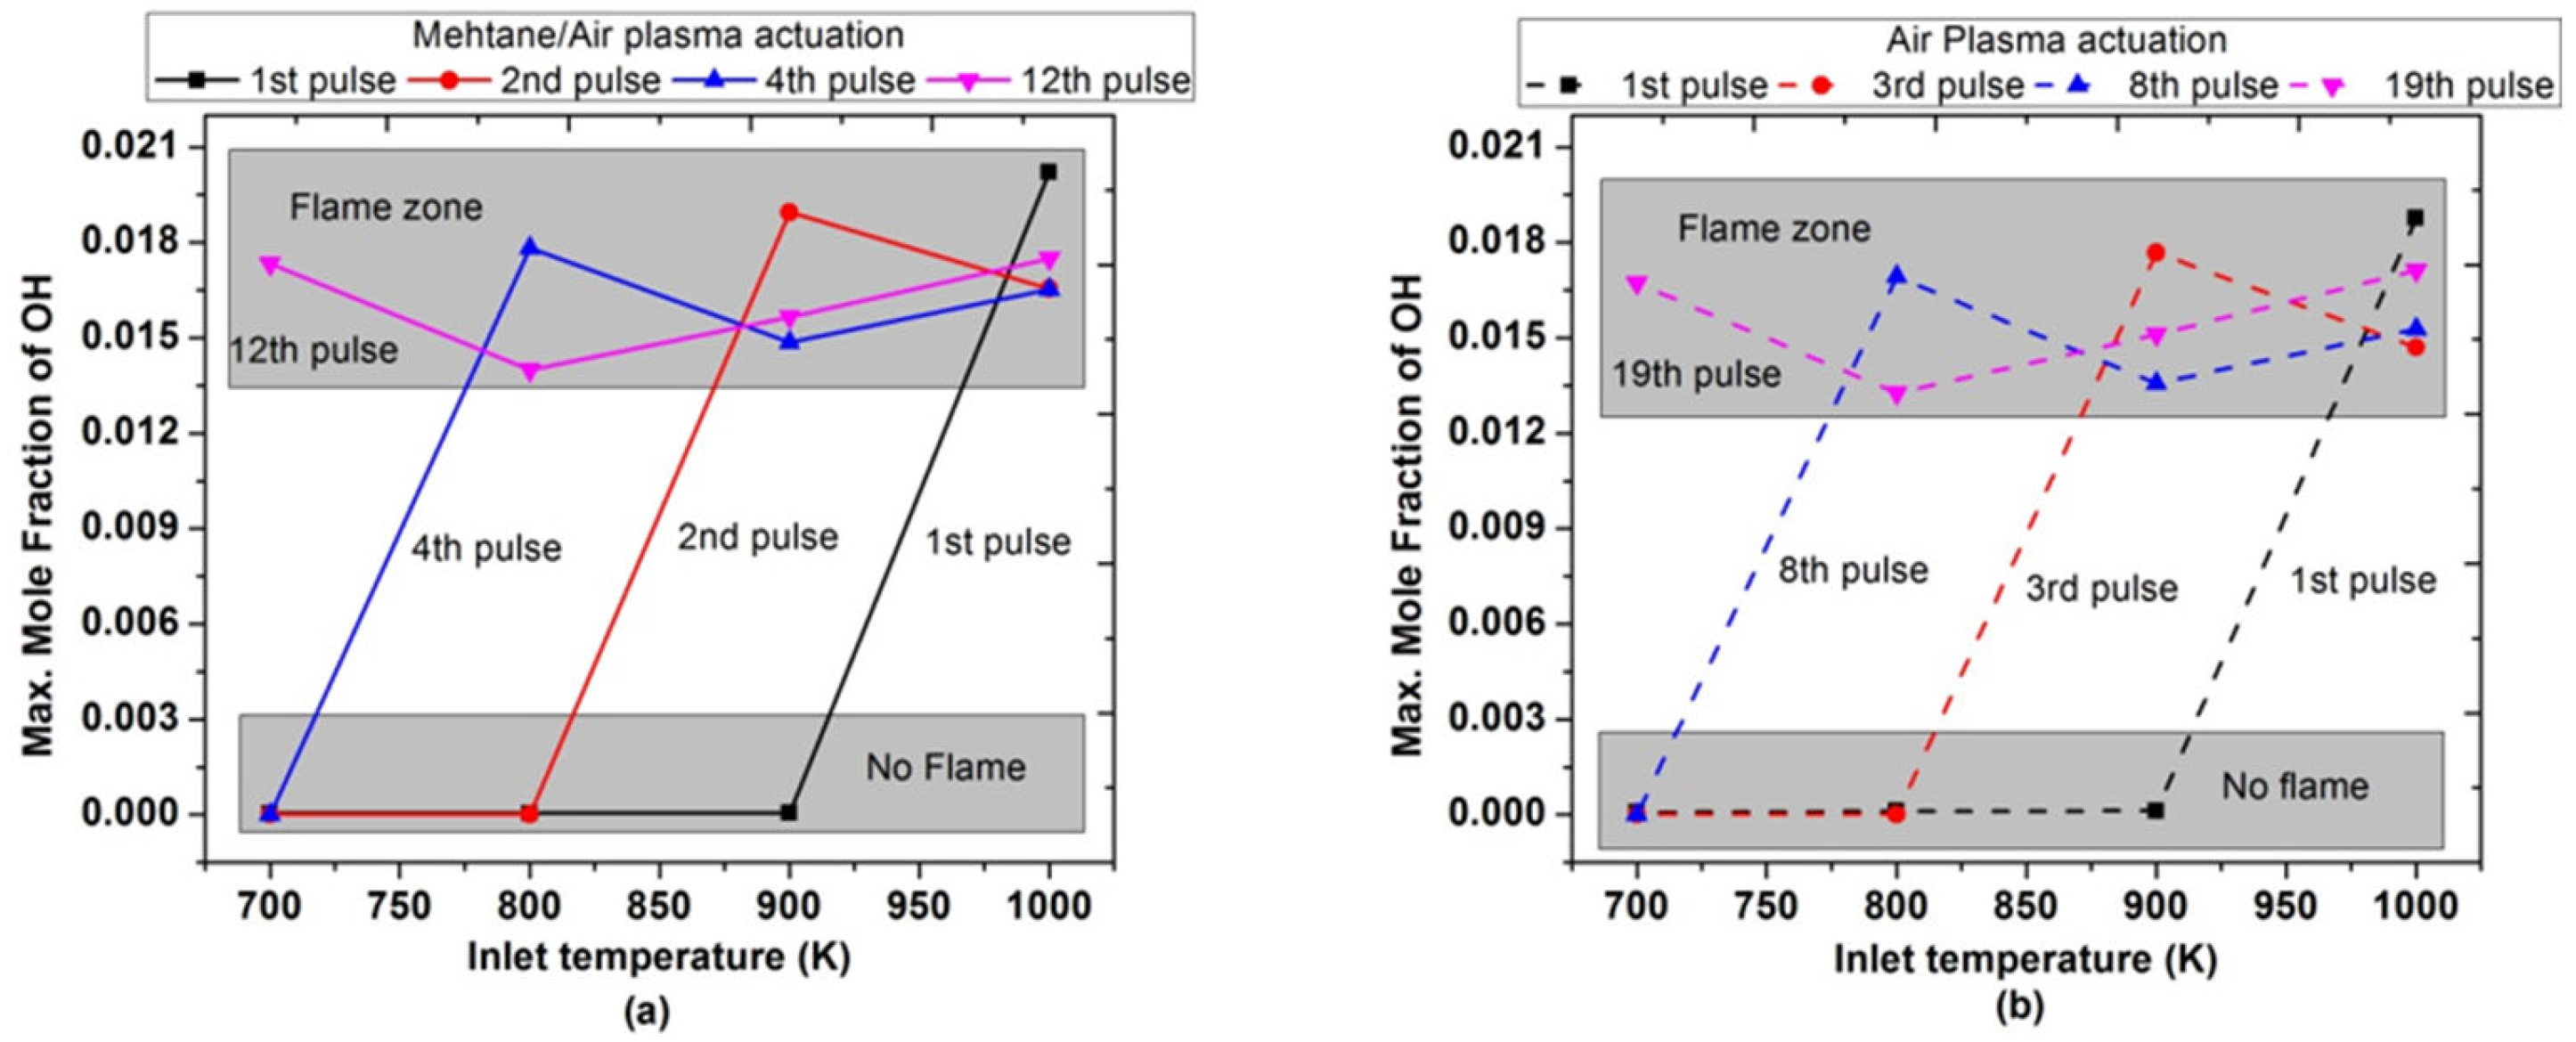
Figure 18 shows the maximum molar fraction of OH achieved during the combustion by varying pulses numbers at low inlet temperature. It was observed that after the 1st pulse, maximum OH concentrations is only possible when the inlet temperature is 1000 K; while for a lower inlet temperature (700, 800, and 900 K), there is a slight rise in temperature during the 1st pulse in both air and methane/air. Finally, when the inlet temperature was 700 K, the maximum molar fractions of OH were observed after the 12th and 19th successful pluses for methane/air and air, respectively. The trend of OH concentrations also endorsed the behavior of ignition timings and peak flame temperature with the number of pulses.
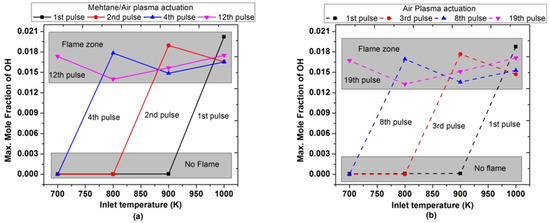
Figure 18.
Maximum molar fraction of OH achieved during the combustion by varying pulses number at different parametric temperature, fixed EN = 200 Td, fixed frequency = 10,000 Hz, and stoichiometric conditions: (a) methane/air plasma activation (solid lines), (b) air plasma activation (dashed lines).
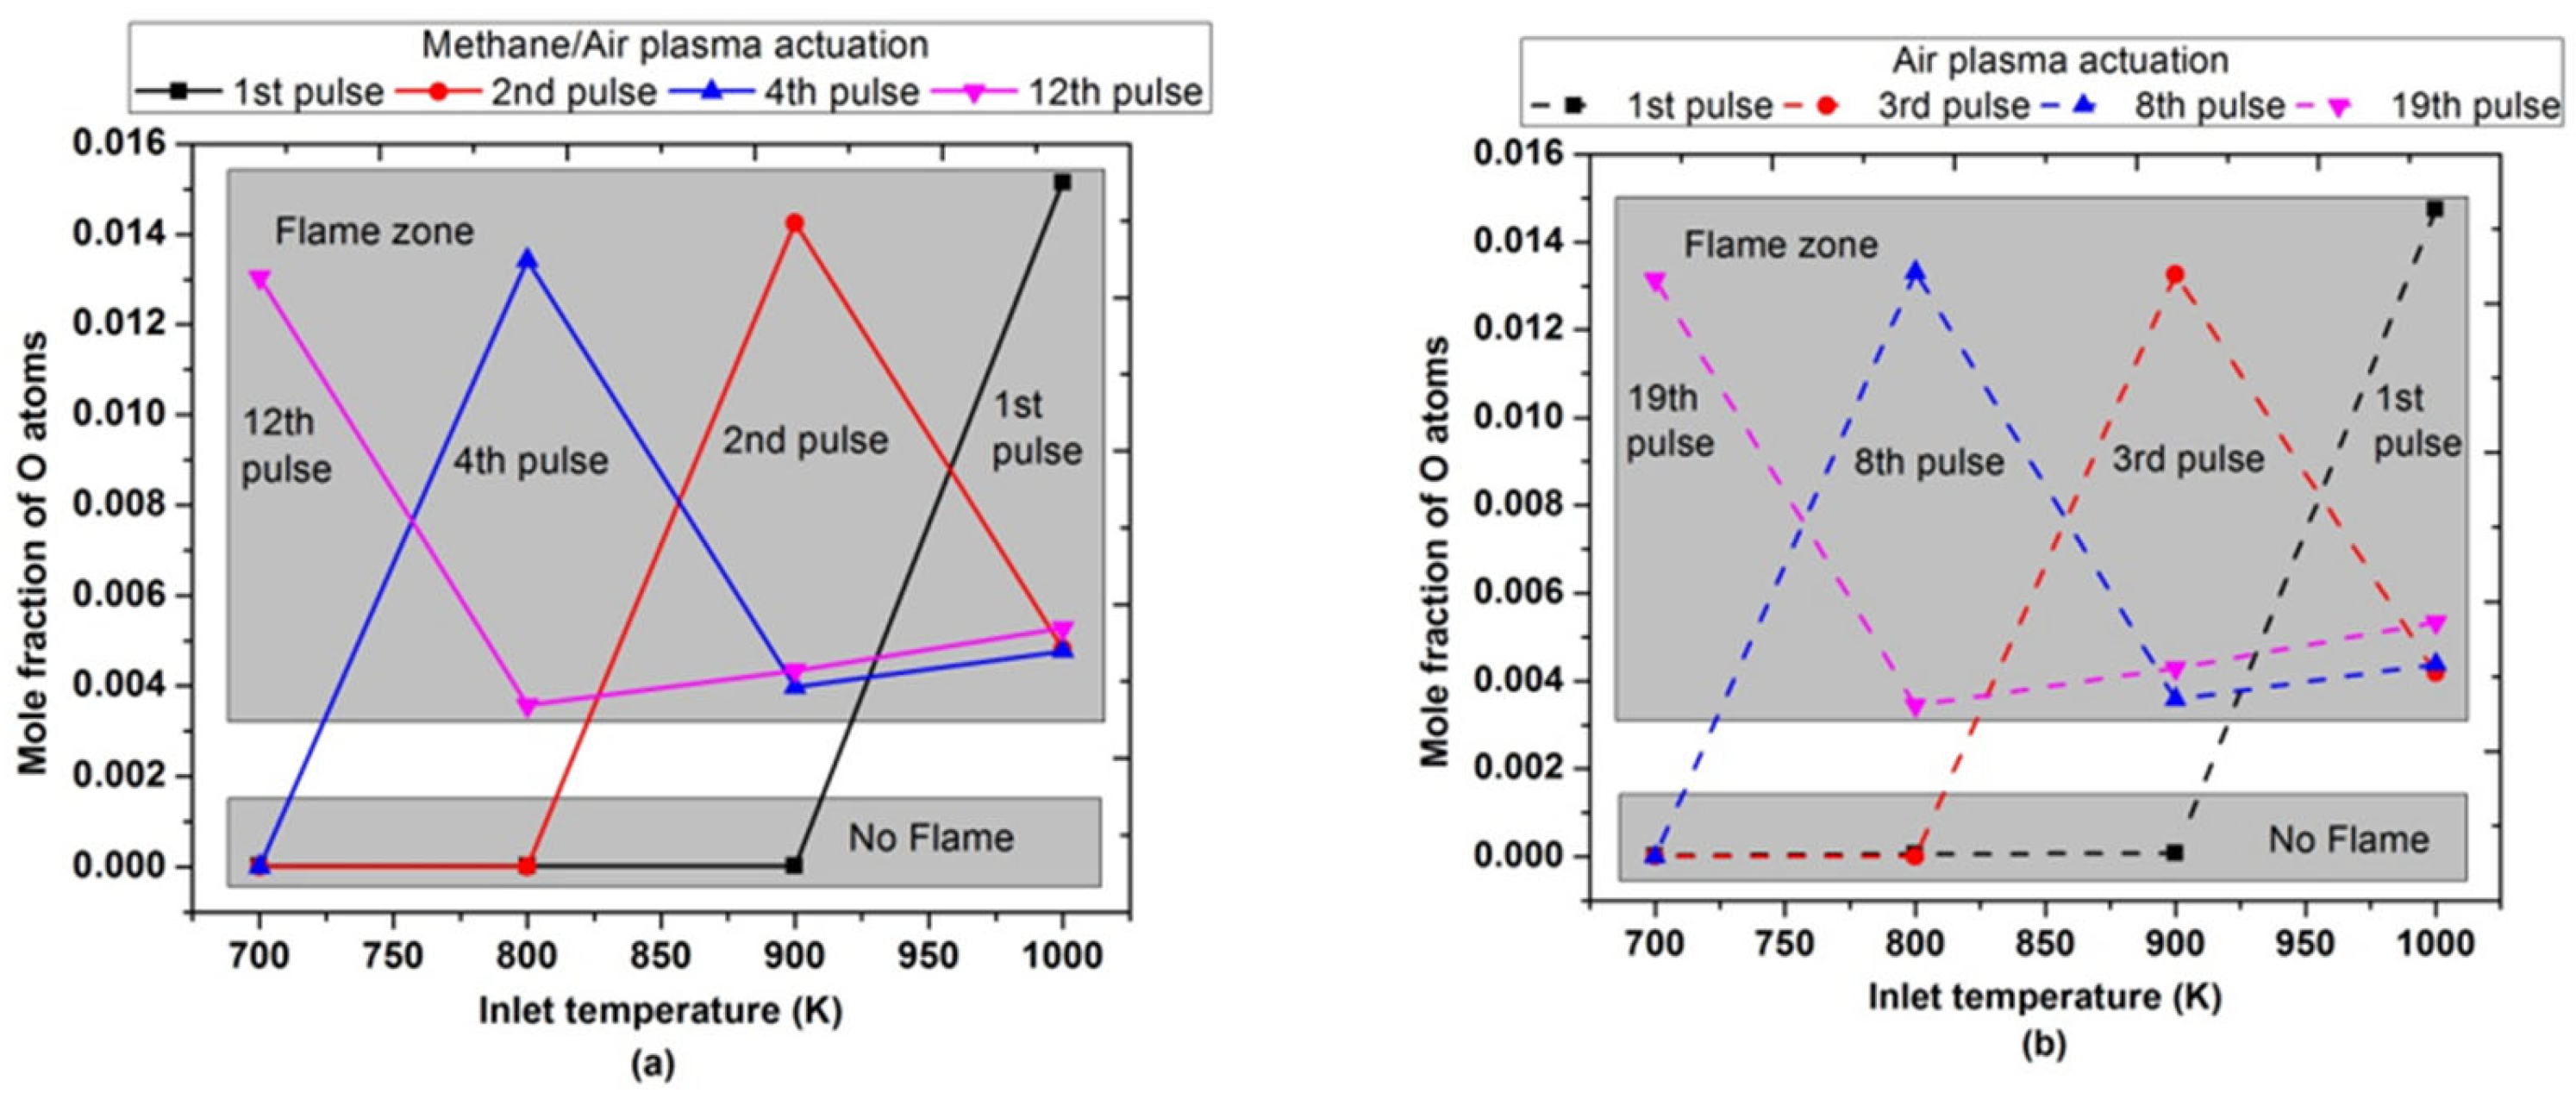
Figure 19 showed the maximum mole fraction of O atoms after a certain number of pulses at different inlet temperatures. The maximum mole fractions of O atoms were observed after the 1st pulse, only when the inlet temperature was 1000 K or higher for both air and methane/air plasma actuation. It endorsed the same trend of peak flame temperature and OH concentrations, as shown above in Figure 17 and Figure 18. When the inlet temperature was reduced, the number of pulses required to achieve the maximum O atoms increased. For example, when the inlet temperature was 700 K, a peak concentration of O atoms was observed after the 12th and 19th successful pulses for methane/air and air, respectively, to activate the combustion.
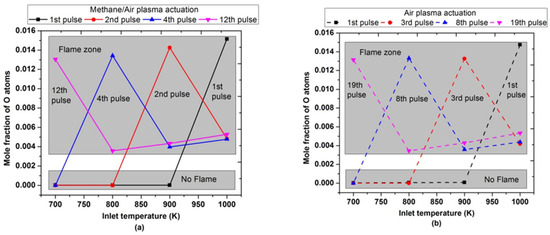
Figure 19.
Maximum molar fraction of O atoms achieved during the combustion by varying pulses number at different parametric temperatures, fixed EN = 200 Td, fixed frequency = 10,000 Hz, and stoichiometric conditions: (a) methane/air plasma activation (solid lines), (b) air plasma activation (dashed lines).
Figure 20 shows the value of the total pulse energy consumed to achieve successful ignition for both methane/air and air actuation at different inlet temperatures. It has been observed that when the inlet temperature was 1000 K, almost the same pulse energy was used for flame ignition in both methane/air and air actuation configurations. However, at low inlet temperature (700 K, 800 K and, 900 K), air plasma actuation required more energy consumption than the methane/air plasma actuation, which was due to the more pulses required for the ignition. Air plasma actuation leads to fewer excited species and combustion radicals than methane/air actuation; furthermore, it requires more pulses to reach the same OH* concentration values, as shown in Figure 18. As the inlet temperature reduced, the total pulse energy consumption was increased. At 700 K, the total pulse energy required for ignition of methane/air and air was 5.04 J/cm3 and 6.27 J/cm3, respectively.
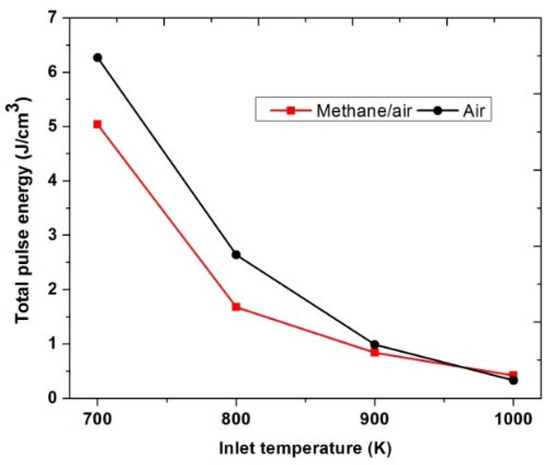
Figure 20.
Total pulse energy used to achieve successful ignition for methane/air and air actuation at low inlet temperatures, considering fixed EN = 200 Td, fixed frequency = 10,000 Hz, and stoichiometric conditions.
5. Conclusions
This study investigated the experimental and numerical characterization of flow dynamics and combustion characteristics in a rectangular burner. Plasma has a significant impact on the fluid dynamics, such as increased induced flow velocity, which created the recirculation zone near the corners of the combustor which improved the mixing performance of the mixture, and ultimately resulted in the reduction of ignition delay timings. It has been observed that energy and power utilized for methane/air actuation are higher than the pure air actuation. This could be due to the excitation and ionization of methane that required more energy deposition and power. The mole fraction of O atoms and ozone was higher in the air than the methane/air actuation. However, O atoms were produced in a very short time interval of 10−7 to 10−6; on the contrary, the concentration of ozone was gradually increased with the time interval, and the peak was observed around 10−1. Methane/air plasma actuation also produced the other important radicals that played a key role to enhance the combustion process. It was noticed that the concentration of H species is the highest among all radicals and lies at nearly 10−1. The concentration peak of CH3 and OH was almost the same, 10−2. Finally, the comparative behavior of ignition characteristics considering low inlet temperature values by subjecting different numbers of pulses was analyzed for both air and methane/air plasma actuation. Ignition timings were significantly reduced up to 0.01 s for methane/air, while in the case of air, ignition was achieved at 0.018 s. Besides this, in the methane/air case, 12 continuous pulses were required to achieve successful ignition; however, in air, 19 continuous pulses were needed to ignite. This means that ignition is even possible at low inlet temperature, but it requires excessive energy in the form of total pulse energy. However, as the inlet temperature is increased, the number of pulses required for ignition is decreased, and not only the number of pulses but ignition timings are also reduced.
Furthermore, at 700 K, the total pulse energy required for ignition of methane/air and air was 5.04 J/cm3 and 6.27 J/cm3, respectively. Therefore, it was possible to reach flame ignition at inlet temperature lower than the minimum required temperature in the absence of plasma actuation, which means ignition was even possible in cold flow conditions, which could be important to address the re-ignition problems of aeroengines at high altitudes.
Author Contributions
Conceptualization, M.G.D.G.; methodology, M.G.D.G.; software, G.M.; validation, G.M.; formal analysis, S.B., G.M. and M.G.D.G.; investigation, S.B., G.M. and M.G.D.G.; data curation, S.B. and G.M.; writing—original draft preparation, S.B. and G.M.; writing—review and editing, M.G.D.G.; visualization, S.B.; supervision, M.G.D.G.; project administration, M.G.D.G.; funding acquisition, M.G.D.G. All authors have read and agreed to the published version of the manuscript.
Funding
This project has received funding from the Clean Sky 2 Joint Undertaking (JU) under grant agreement No. 831881 (CHAiRLIFT). The JU receives support from the European Union’s Horizon 2020 research and innovation programme and the Clean Sky 2 JU members other than the Union.

Institutional Review Board Statement
Not applicable.
Informed Consent Statement
Not applicable.
Data Availability Statement
Not applicable.
Acknowledgments
We thank Sabina Spagnolo for assistance during the construction of the experimental set-up and testing activities.
Conflicts of Interest
The authors declare no conflict of interest.
References
- Oh, J.; Noh, D. Flame characteristics of a non-premixed oxy-fuel jet in a lab-scale furnace. Energy 2015, 81, 328–343. [Google Scholar] [CrossRef]
- Lee, S.; Padilla, R.; Dunn-Rankin, D.; Pham, T.; Kwon, O.C. Extinction limits and structure of counter flow non premixed H2O-laden CH4/air flames. Energy 2015, 93, 442–450. [Google Scholar] [CrossRef] [Green Version]
- Egolfopoulos, F.N.; Holley, A.T.; Law, C.K. An assessment of the lean flammability limits of CH4/air and C3H8/air mixtures at engin*10-like conditions. Proc. Combust. Inst. 2007, 31, 3015–3022. [Google Scholar] [CrossRef]
- Cha, M.S.; Chung, S.H. Characteristics of lifted flames in non-premixed turbulent confined jets. Symp. Int. Combust. 1996, 26, 121–128. [Google Scholar] [CrossRef]
- Stange, S.; Kim, Y.; Ferreri, V.; Rosocha, L.; Coates, D. Flame images indicating combustion enhancement by dielectric barrier discharges. IEEE Trans. Plasma Sci. 2005, 33, 316–317. [Google Scholar] [CrossRef]
- de Giorgi, M.G.; Sciolti, A.; Campilongo, S.; Pescini, E.; Ficarella, A.; Martini, L.M.; Tosi, P.; Dilecce, G. Plasma assisted flame stabilization in a non-premixed lean burner. Energy Proc. 2015, 82, 410–416. [Google Scholar] [CrossRef] [Green Version]
- De Giorgi, M.G.; Sciolti, A.; Campilongo, S.; Pescini, E.; Ficarella, A.; Lovascio, S.; Dilecce, G. Lean Blowout Sensing and Plasma Actuation of Non-Premixed Flames. IEEE Sens. J. 2016, 16, 3896–3903. [Google Scholar] [CrossRef]
- De Giorgi, M.G.; Ficarella, A.; Sciolti, A.; Campilongo, S.; Pescini, E.; Dilecce, G. Effect of actuation parameters on stabilization of methane diffusive flames using plasma actuators. In Proceedings of the XXXVIII Meeting of the Italian Section of the Combustion Institute, Lecce, Italy, 20–23 September 2015. [Google Scholar] [CrossRef]
- Huang, D.Q.; Yu, J.L.; Wang, S.B.; Li, Q.Y.; He, L.M. The experiment investigation on the characteristics of pre-combustion plasma jet ignition. High Volt. Eng. 2018, 44, 3068–3075. [Google Scholar]
- Mintoussov, E.; Pancheshnyi, S.; Starikovskii, A. Propane-Air Flame Control by Non-Equilibrium Low-temperature Pulsed Nanosecond Barrier Discharge. In Proceedings of the 42nd AIAA Aerospace Sciences Meeting and Exhibit, Reno, NV, USA, 5–8 January 2004. [Google Scholar]
- Bak, M.S.; Im, S.-K.; Mungal, M.G.; Cappelli, M.A. Studies on the stability limit extension of premixed and jet diffusion flames of methane, ethane, and propane using nanosecond repetitive pulsed discharge plasmas. Combust. Flame 2013, 160, 2396–2403. [Google Scholar] [CrossRef]
- Ruma, M.; Ahasan, H.; Ranipet, H.B. A Survey of non-thermal plasma and their generation methods. Int. J. Renew. Energy Environ. Eng. 2016, 4, 6–12. [Google Scholar]
- Starikovskiy, A.; Aleksandrov, N. Mechanism of Plasma-Assisted Ignition for H2 and C1-C5 Hydrocarbons. In Proceedings of the 55th AIAA Aerospace Sciences Meeting, Grapevine, TX, USA, 9–13 January 2017. AIAA Paper 2017-1977. [Google Scholar]
- Ju, Y.; Sun, W. Plasma assisted combustion: Dynamics and chemistry. Prog. Energy Combust. Sci. 2015, 48, 21–83. [Google Scholar] [CrossRef]
- Tholin, F.; Lacoste, D.A.; Bourdon, A. Influence of Fast-Heating Processes and OAtom Production by a Nanosecond Spark Discharge on the Ignition of a Lean H2-Air Premixed Flame. Combust. Flame 2014, 161, 1235–1246. [Google Scholar] [CrossRef]
- Aleksandrov, N.L.; Kindysheva, S.V.; Kukaev, E.N.; Starikovskaya, S.M.; Starikovskii, A.Y. Simulation of the ignition of a methane-air mixture by a high-voltage nanosecond discharge. Plasma Phys. Rep. 2009, 35, 867–882. [Google Scholar] [CrossRef]
- Kosarev, I.; Aleksandrov, N.; Kindysheva, S.; Starikovskaia, S.; Starikovskii, A. Kinetics of ignition of saturated hydrocarbons by nonequilibrium plasma: CH4-containing mixtures. Combust. Flame 2008, 154, 569–586. [Google Scholar] [CrossRef]
- Yang, S.; Nagaraja, S.; Sun, W.; Yang, V. Multiscale modeling and general theory of non-equilibrium plasma-assisted ignition and combustion. J. Phys. D Appl. Phys. 2017, 50, 433001. [Google Scholar] [CrossRef]
- Xu, C.H.; Li, L. Electric Effects on the Pre-Mixing Process in DBD Assisted Combustions. Appl. Mech. Mater. 2015, 722, 235–238. [Google Scholar] [CrossRef]
- Benard, N.; Braud, P.; Pons, J.; Touchard, G.; Moreau, E. Quasi-steady and unsteady actuation by surface non-thermal plasma discharge for control of a turbulent round air jet. J. Turbul. 2007, 8, N49. [Google Scholar] [CrossRef]
- Benard, N.; Bonnet, J.P.; Touchard, G.; Moreau, E. Flow Control by Dielectric Barrier Discharge Actuators: Jet Mixing Enhancement. AIAA J. 2008, 46, 2293–2305. [Google Scholar] [CrossRef]
- De Giorgi, M.G.; Ficarella, A.; Fontanarosa, D.; Pescini, E.; Suma, A. Investigation of the Effects of Plasma Discharges on Methane Decomposition for Combustion Enhancement of a Lean Flame. Energies 2020, 13, 1452. [Google Scholar] [CrossRef] [Green Version]
- Pescini, E.; Martínez, D.; De Giorgi, M.G.; Ficarella, A. Characterization of the effects of a dielectric barrier discharge plasma actuator on a coaxial jet in a Bunsen burner. Exp. Therm. Fluid Sci. 2018, 91, 292–305. [Google Scholar] [CrossRef]
- De Giorgi, M.G.; Ficarella, A.; Sciolti, A.; Pescini, E.; Campilongo, S.; Di Lecce, G. Improvement of lean flame stability of inverse methane/air diffusion flame by using coaxial dielectric plasma discharge actuators. Energy 2017, 126, 689–706. [Google Scholar] [CrossRef]
- Rosocha, L.A.; Kim, Y.; Anderson, G.K.; Abbate, S. Combustion enhancement using silent electrical discharges. Int. J. Plasma Environ. Sci. Technol. 2007, 1, 8–13. [Google Scholar]
- Zhang, X.; Cha, M.S. Electron-induced dry reforming of methane in a temperature-controlled dielectric barrier discharge reactor. J. Phys. D Appl. Phys. 2013, 46, 415205. [Google Scholar] [CrossRef]
- Zhang, X.; Cha, M.S. Partial oxidation of methane in a temperature-controlled dielectric barrier discharge reactor. Proc. Combust. Inst. 2014, 35, 3447–3454. [Google Scholar] [CrossRef]
- Mu, H.; Yu, L.; Li, P.; Tang, C.; Wang, J.; Zhang, G.; Haibao, M.; Lin, Y.; Ping, L.; Chenglong, T.; et al. Study on the Enhancement Effect of Dielectric Barrier Discharge on the Premixed Methane/Oxygen/Helium Flame Velocity. Plasma Sci. Technol. 2015, 17, 1019–1026. [Google Scholar] [CrossRef]
- Pescini, E.; Francioso, L.; De Giorgi, M.G.; Ficarella, A. Investigation of a Micro Dielectric Barrier Discharge Plasma Actuator for Regional Aircraft Active Flow Control. IEEE Trans. Plasma Sci. 2015, 43, 3668–3680. [Google Scholar] [CrossRef]
- Pescini, E.; De Giorgi, M.G.; Francioso, L.; Sciolti, A.; Ficarella, A. Effect of a micro dielectric barrier discharge plasma actuator on quiescent flow. IET Sci. Meas. Technol. 2014, 8, 135–142. [Google Scholar] [CrossRef]
- Pancheshnyi, S.; Eismann, B.; Hagelaar, G.J.M.; Pitchford, L.C. 2008. Available online: http://www.zdplaskin.laplace.univ-tlse.fr (accessed on 14 June 2021).
- Lutz, A.E.; Kee, R.J.; Miller, J.A. SENKIN: A FORTRAN Program for Predicting Homogeneous Gas Phase Chemical Kinetics with Sensitivity Analysis; Sandia National Labs.: Livermore, CA, USA, 1988.
- Lefkowitz, J.K.; Guo, P.; Rousso, A.; Ju, Y. Species and temperature measurements of methane oxidation in a nanosecond repetitively pulsed discharge. Philos. Trans. R. Soc. A Math. Phys. Eng. Sci. 2015, 373, 20140333. [Google Scholar] [CrossRef] [Green Version]
- Wang, Y.; Guo, P.; Chen, H.; Chen, Z. Numerical modeling of ignition enhancement using repetitive nanosecond discharge in a hydrogen/air mixture I: Calculations assuming homogeneous ignition. J. Phys. D Appl. Phys. 2021, 54, 065501. [Google Scholar] [CrossRef]
- Capitelli, M.; Ferreira, C.M.; Gordiets, B.F.; Osipov, I.A. Plasma Kinetics in Atmospheric Gases. Plasma Phys. Control. Fusion 2001, 43, 371–372. [Google Scholar] [CrossRef]
- Flitti, A.; Pancheshnyi, S. Gas heating in fast pulsed discharges in N2–O2mixtures. Eur. Phys. J. Appl. Phys. 2009, 45, 21001. [Google Scholar] [CrossRef] [Green Version]
- Mao, X.; Rousso, A.; Chen, Q.; Ju, Y. Numerical modeling of ignition enhancement of CH4/O2/He mixtures using a hybrid repetitive nanosecond and DC discharge. Proc. Combust. Inst. 2019, 37, 5545–5552. [Google Scholar] [CrossRef]
- Mao, X.; Chen, Q.; Guo, C. Methane pyrolysis with N2/Ar/He diluents in a repetitively-pulsed nanosecond discharge: Kinetics development for plasma assisted combustion and fuel reforming. Energy Convers. Manag. 2019, 200, 112018. [Google Scholar] [CrossRef]
- DeFilippo, A.C. Microwave-Assisted Ignition for Improved Internal Combustion Engine Efficiency. Ph.D. Thesis, University of California, Berkeley, CA, USA, 2013. [Google Scholar]
- Fontanarosa, D.; Mehdi, G.; De Giorgi, M.G.; Ficarella, A. Assessment of the impact of nanosecond plasma discharge on the combustion of methane air flames. E3S Web Conf. 2020, 197, 10001. [Google Scholar] [CrossRef]
- Patel, R.B.; Oommen, C.; Thomas, M.J. Influence of Reduced Electric Field (E/N) on Plasma-Assisted Low-Temperature Oxidation. J. Propuls. Power 2020, 36, 235–247. [Google Scholar] [CrossRef]
- Zuiderveld, K. Contrast Limited Adaptive Histogram Equalization. Graph. Gems IV 1994, 474–485. [Google Scholar] [CrossRef]
- Thielicke, W. The Flapping Flight of Birds—Analysis and Application. Ph.D. Thesis, University of Groningen, Groningen, The Netherlands, 2014. Available online: http://irs.ub.rug.nl/ppn/382783069 (accessed on 14 June 2021).
- Uddi, M.; Jiang, N.; Mintusov, E.; Adamovich, I.; Lempert, W.R. Atomic oxygen measurements in air and air/fuel nanosecond pulse discharges by two photon laser induced fluorescence. Proc. Combust. Inst. 2009, 32, 929–936. [Google Scholar] [CrossRef]
- Halter, F.; Higelin, P.; Dagaut, P. Experimental and Detailed Kinetic Modeling Study of the Effect of Ozone on the Combustion of Methane. Energy Fuels 2011, 25, 2909–2916. [Google Scholar] [CrossRef]


Publisher’s Note: MDPI stays neutral with regard to jurisdictional claims in published maps and institutional affiliations. |
© 2021 by the authors. Licensee MDPI, Basel, Switzerland. This article is an open access article distributed under the terms and conditions of the Creative Commons Attribution (CC BY) license (https://creativecommons.org/licenses/by/4.0/).