Abstract
Process planning in manufacturing today focuses on optimizing the conflicting targets of cost, quality, and time. Due to increasing social awareness and subsequent governmental regulation, environmental impact becomes a fourth major aspect. Eventually, sustainability in manufacturing ensures future competitiveness. In this paper, a framework for the planning of sustainable manufacturing is proposed. It is based on the abstraction and generalization of manufacturing resources and part descriptions, which are matched and ranked using a multi-criteria decision analysis method. Manufacturing resources provide values for cost, quality, time and environmental impacts, which multiply with their usage within a manufacturing task for a specific part. The framework is validated with a detailed modeling of a laser machine as a resource revealing benefits and optimization potential of the underlying data model. Finally, the framework is applied to a use case of a flange part with two different manufacturing strategies, i.e., laser metal-wire deposition and conventional milling. The most influential parameters regarding the environmental impacts are the raw material input, the manufacturing energy consumption and the machine production itself. In general, the framework enabled the identification of non-predetermined manufacturing possibilities and the comprehensive comparison of production resources.
1. Introduction
The trend of personalization, growing global competition, and volatile market demands require increasingly flexible and adaptable production systems [1]. To remain competitive, service providers must balance production costs, time to delivery and product quality. This is an immense challenge, since the three parameters often show contrary effects. Today’s most promising approach is to handle this complexity by the digitalization of production systems and subsequent optimization [2], e.g., by virtual commissioning during the planning phase, automated sourcing activities during operation or numerical simulation to predict production on the process level.
In addition to the three mentioned optimization goals, neglecting ecological aspects is going to be an increasingly important disadvantage in the future: Satisfying the growing ecological awareness of customers and complying with increasingly stringent environmental legislation is imperative to ensure future competitiveness [3,4]. Therefore, sustainability in manufacturing must be included in the decision-making during process planning.
A current and major limitation for the integration of environmental impacts is the low comparability of ecological indicators for individual production processes, since the system boundaries differ greatly for different manufacturing process types, part geometries and materials [5]. Thus, to include the environmental impacts comprehensively the whole product life-cycle needs to be covered, including the production of intermediates, consumables and the power consumption on the manufacturing site. Consequently, a digital representation of production resources and manufacturing capabilities is indispensable to enable objective comparability as a basis for the determination and optimization of process plans [6]. It is, therefore, required to propose solutions, which incorporate environmental impacts as an additional measure into digital optimization tools for manufacturing [7].
In this paper, a framework is described for sustainable manufacturing to include ecological aspects, represented by carbon dioxide equivalents (-eq.), into process planning. Modeling production resources and part descriptions enables calculating the resulting ecological metrics in addition to monetary and time metrics for production of a specific part. In the presented approach the required part quality is ensured by explicitly defined constraints derived from CAD models and not used as an optimization parameter. All information compiled in the framework are subsequently used in a multiple-criteria decision analysis to rank the possible manufacturing solutions. As a result, not only production resources fulfilling the part constraints, but also resources which are resource-saving, time-optimal and cost-efficient can be identified and ranked.
2. Literature Review
The following section provides an overview of research activities on computer-aided process planning (CAPP) and approaches to integrate environmental aspects as an additional dimension of optimization into process planning.
2.1. Computer-Aided Process Planning
The basic principle of CAPP is an abstraction and generalization of manufacturing capabilities to match product requirements with available resources. Therefore, CAPP is seen as a key technology to enable the shift from production-oriented manufacturing to a service-oriented manufacturing [8,9], also known as Manufacturing-as-a-Service [10]. This means that companies offer services rather than finished products in line with the growing demand for personalized products with individualized features. This shift demands more flexibility and shorter reaction time from manufacturers, a challenge which can be addressed with CAPP. Järvenpää et al. [10] developed an ontology to represent the capabilities of manufacturing resources in a generalized form. This is a mandatory feature of CAPP to automatically identify production options for short-term changing requirements of a product. The focus of this work was on modeling resource capabilities and matchmaking with product requirements to help system integrators and end users to identify in short time which of their resources and resource combinations are best suited for a manufacturing task. Ameri et al. [11] propose a manufacturing service description language (MSDL). This ontology enables the description of supply and demand entities as the primitive building blocks of manufacturing services. MSDL addresses virtual enterprises in the manufacturing business to improve communication by providing a common language. The authors show that MSDL is well suited for service description on different abstraction levels, i.e., machine, cell or factory level, and highlight its flexibility and adaptability to evolve with the users’ demands. The ontology is applied in a subsequent work [12] for a web-based digital manufacturing market, where manufacturing process capacity can be traded, creating an agile supply chain platform. The multi-agent framework connects buyers and sellers, using MSDL as its semantic language, and includes a matchmaking methodology to bring together supply and demand based on the similarities of needs and capabilities. Mourtzis et al. [13] developed a service-oriented framework for dynamic process planning. The system comprises two services. The first service is designed for an adaptive process planning using event-driven function blocks and a genetic algorithm. The second service is used for monitoring and data acquisition on shop-floor level. It gathers real-time data over the status of machine tools and their availability. An information fusion technique then processes the data and provides input for the process-planning service. Mourtzis et al. validated their framework with a small-scale use case, which reveals how the real-time monitoring of machine status and availability is beneficial for quick response in process planning.
2.2. Integration of Energy Consumption into CAPP
In the following, ontologies and frameworks covering specifically energy consumption are described. Newman et al. [14] present a framework to validate the introduction of energy consumption in the objectives of process planning for CNC machining. The authors investigated and discussed two experiments proving that the energy consumption of two interchangeable cutting processes may differ considerably. Consequently, it is shown that energy consumption can be added to multiple-criteria process-planning systems as a valid objective. However, no actual process-planning tool is implemented and no additional processes are considered. He et al. [15] introduce a green manufacturing approach by optimizing multiple criteria as part of the planning process. The objective of the presented software system is to reduce the raw material consumption, secondary material consumption, energy consumption, and environmental impacts of production. The system was implemented and validated into a machining tool factory. Gould et al. [16] developed a framework for material flow assessment, which aims at finding resource efficient material flows by adjusting the product assembly design. By changing the product design, retooling can be avoided, contributing to an improved resource efficiency. Shojaeipour [17] presents an automated evaluation tool, which aims at identifying and quantifying environmental impacts to select a near-optimal, but predefined process plan from a given set. The analytic hierarchy process (AHP), a multiple-criteria analysis method, is used to evaluate the given process plans in dependence of emission, waste production, and hazardous materials. Dai et al. [18] propose a mathematical model with the goal to find an optimal solution between the energy consumption and the makespan of machines from job shops by the selection of process plans and an optimized scheduling. For this purpose, a hybrid optimization approach based on honey-bee mating and annealing processes is used. The authors demonstrated that the selected approach outperforms conventional optimization algorithms and can improve the total energy consumption for manufacturing parts using conventional milling processes. Li et al. [19] present a methodology based on a genetic algorithm for optimizing process plans and the corresponding scheduling of machining operations. The process plans and machine scheduling are optimized in terms of energy consumption, makespan and a balanced machine use. In this work, conventional machining processes are studied. The consideration of energy consumption in the works of Li et al. and Dai et al. is limited to machines and the respective machine phases. Other factors influencing the overall sustainability, such as consumables and the material itself are not considered.
2.3. Assessment of Environmental Impacts within Process Planning
Today, most environmental impacts from production are driven by the energy consumption [5]. With increasingly decarbonized energy systems however, their impact is going to decline, and other influencing parameters must be considered and monitored in the future as well. To broaden the scope from energy consumption to a comprehensive environmental assessment the entire life-cycle of a product needs to be included. Alting [20] introduced the concept of life-cycle thinking to the sector of sustainable production in 1991 and since then the guiding principle was applied from different perspectives. Veleva et al. [21] offer a theoretical framework on sustainable production including life-cycle thinking, resulting in a tool to promote business sustainability based on 22 core indicators covering all aspects of sustainability. Yet, already raising concerns regarding the data availability. Favi et al. [22] describe a plant-based evaluation of environmental impacts of manufacturing processes starting from identifying and classifying the main plant fluxes. Shortcomings of the work are the interoperability between different plants and a software implementation. In a meta-analysis, Duflou et al. [23] describe parameters for systematic efficiency based on the energy consumption and identify improvement measures on the different system levels, from unit process to supply chain. The most extensive integration of the life-cycle view into the decision-making processes in production known to the authors was conducted by Rödger et al. [24]. The authors used manufacturing system simulation and life-cycle assessment (LCA) to assess different manufacturing scenarios with a focus on the machine level. The results are validated based on four different flange use cases.
Due to personalization and the linked rise of additive manufacturing technologies, the integration of environmental impacts based on life-cycle thinking compared to a mere focus on energy consumption is becoming even more important as the driving parameters shift from material input to process energy [5]. Thus, the comparability of different manufacturing paradigms can be ensured. In existing LCA studies within the field of additive manufacturing, the goal often is to assess the environmental hot spots of the technology itself. Examples for a non-comparative LCA study of an additive manufacturing technology can be found in Faludi et al. [25] and Torres-Carillo et al. [26] for selective laser melting (SLM). Peng et al. [27] conducted an assessment of a SLM process as well and included a summary of different conducted LCAs on additive manufacturing technologies. In addition to comprehensive LCA studies, assessments are often only based on process energy efficiency analyses, e.g., by Catalano et al. [28] for a laser metal-wire deposition (LMWD) process. Although stand-alone LCA studies often induce comparability by, e.g., assessing the same impact categories or even using similar system boundaries, they are not meant to be used for direct comparison. Although some studies such as Wang et al. [29] compare the environmental impacts of specific processes, i.e., SLM and conventional manufacturing, a generic framework on the manufacturing process level is needed to integrate environmental aspects into the process-planning process.
2.4. Integration of Environmental Impacts into Manufacturing Systems and Process Planning
For the assessment of different production options, a unified description of resources (machines) and parts is needed. This data structure must be capable of additive as well as conventional manufacturing processes to ensure reliability of the absolute numbers as well as comparability. Generic and qualitative descriptions of the sustainability of manufacturing processes, as described by Abdulrahman [30] for the LMWD process, provide a basis for such a data structure. Further manufacturing use cases for the synchronization of system boundaries and methodological choices are provided. Morrow et al. [31] for example provide a detailed comparison of the conventional manufacturing (milling) and additive manufacturing of a tooling part. A framework for the LCA of additive manufacturing is proposed by Ribeiro et al. [32]. Said framework includes all life-cycle phases from raw material extraction to end-of-life. For conventional manufacturing, the production, including extraction of resources, is the key driver of environmental impacts. For additive manufacturing the manufacturing process, i.e., shaping activities, itself become the main source of environmental impacts as shown by Saade et al. [5] in a meta-analysis. The main drivers of the environmental impacts are further specified by Cerdas et al. [33] for a polypropylene printing process in a distributed manufacturing system. The main parameters are energy efficiency, electricity type, material and process quality. In contradiction, Rödgers et al. [24] concluded that the process energy efficiency is not a key driver for the environmental impacts.
The field of CAPP is populated with several robust frameworks, each tailored for specific use cases and applications. Yet, a joint standard data information model or ontology has not been agreed on. Furthermore, the integration of environmental aspects is often limited to energy related effects and this only to certain parts of the production system, mostly the energy consumption of material-removing machining processes. All studies known to the authors, focus on the simulation of single manufacturing technologies and often are not flexible, detailed, and extendable enough to map especially non-value-adding process steps or different parameter sets of one machine. A high-level comparison of different manufacturing options considering environmental aspects could be done within the existing frameworks but would be difficult and time-consuming for the end user. If it is necessary to assess environmental impacts at an early stage, e.g., in the product development process, the time factor is very important [34] and tools are required, which enable an easy and fast day-to-day decision-making considering multiple indicators [35]. Therefore, a comprehensive and flexible, but easy to use process-planning framework would be highly beneficial to ensure the competitiveness when facing the trends of personalization, growing global competition, and volatile markets.
3. Materials and Methods
The overall goal of the approach is to identify the combination of resource skills needed to manufacture a part in compliance with defined constraints, which represent the required part quality, while having the best evaluation in price, time, and emission of -equivalents. This requires the matching and evaluation of part definitions in the form of manufacturing possibilities and digitized resources. A skill-based engineering approach [36] is used to describe the resources that have the capability to handle or modify a product, and the product itself (here called part). Resources and parts are the two central models, compiling all relevant information as shown in Figure 1. The part definition and resource information are modeled in a generic way to map all kind of possible characteristics. To do so, an ontology is introduced in Section 3.1. These models are used by service providers to describe available resources (e.g., machines and materials) and resource skills that are linked with the respective resource (e.g., cutting, printing etc.). Resource skills can be enriched with more detailed information about abilities, such as achievable surface roughness (i.e., a metric of quality), and consumables used for the manufacturing process (e.g., coolant). In a next step, a customer wanting to manufacture a part, defines the required process steps in collaboration with a manufacturing expert. Hereby, different manufacturing possibilities can be specified. For example, a part can be milled from solid or first buildup using additive manufacturing technologies and subsequently reworked. Constraints can be added to every part process step to detail the requirements, which must be fulfilled by the corresponding resource skill abilities. It should be noted that in the future these steps could also be performed by volume decomposition and feature extraction algorithms [37] to automatically identify possible process steps. After the definition phase, a fully automated matching (Section 3.2) and evaluation (Section 3.3) is performed by the framework.
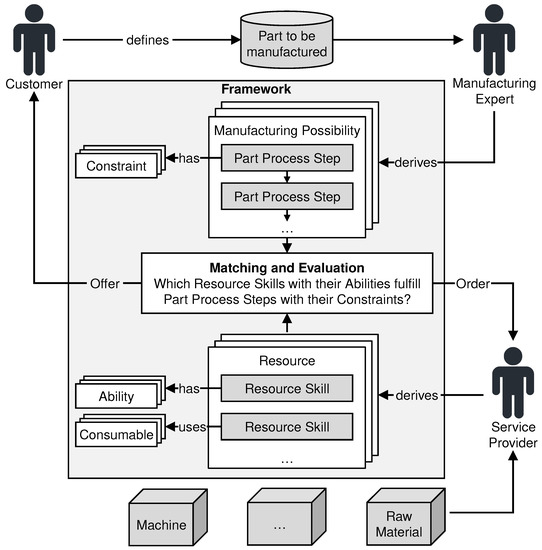
Figure 1.
Overview of the process planning workflow.
3.1. Ontology for the Manufacturing Framework
Models are used to organize and store information in a standardized way. In this context, the models provide the base to implement matching and evaluation algorithms independent of the actual data inserted in a later step. This enables an automated execution of the application, once the necessary information is available. The meaning of the main terms is described in the following. Figure 2 shows the relationships and dependencies of the mentioned models.
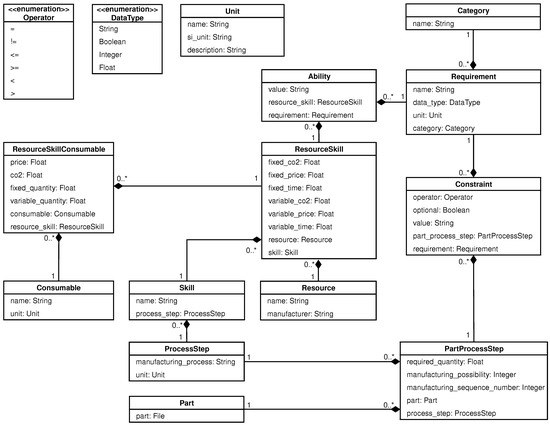
Figure 2.
Simplified class diagram for the data structure of the framework. Note: Generic fields (e.g., id, created at, updated at, description, etc.) are not represented in the diagram for clarity.
Part: A part is the high-level object to be manufactured for a customer. A part itself is defined by part process steps grouped into single manufacturing possibilities.
Resource: A resource is the representation of a machine, material, or other infrastructure in a production environment. A resource is defined by its resource skills.
Requirement: A requirement is the base class for constraints and abilities. Requirements define the name, unit, and data type. A requirement can be for example material of data type string with no unit.
Constraint: A constraint is the specific requirement of a part process step, which must be fulfilled by the resource skill abilities. A constraint for the exemplary requirement material could be AlMg5. The operator determines whether the value of the ability must be greater, less or equal to this condition. In the case of material, the values must match (operator: =).
Ability: An ability is the capability of a resource skill to fulfill constraints. An ability can be for example AlMg5 for the requirement material and would fulfill the constraint mentioned above.
Process Step: A process step is the generic representation of a manufacturing process according to DIN 8580. Next to the name of the manufacturing process (e.g., separation), the unit of the process step is defined. For example: separation in (e.g., cutting) or separation in (e.g., milling). Note, next to manufacturing processes defined in DIN 8580, additional process steps could be inserted in future (e.g., moving with gripper).
Part Process Step: The part process step contains the required quantity of a process step (e.g., 50 of separation) as well as the specified constraints to create a part. Each part process step belongs to a manufacturing possibility. Multiple possibilities to manufacture the part can be defined.
Skill: A skill is the abstract capability of a resource to perform a certain process step. For example, the skill of a milling machine could be cutting.
Resource Skill: The resource skill is a specific skill of a resource. Here, the actual costs, required time, and emitted -eq. for performing one unit of the skill are defined. The unit is given by the underlying process step.
Consumable: The consumable is the abstract representation of a medium and its unit consumed by a resource to perform a certain resource skill (e.g., water, electricity, cutting fluid etc.).
Resource Skill Consumable: Resource skill consumables are the representation of a medium consumed by a specific resource to perform a resource skill. For example, cutting consumes a defined quantity of electricity and cutting fluid per performed unit of the resource skill. The resource skill consumables also have costs (price and -eq.) for the usage of one unit of the underlying consumable.
The parameters price, time, and -eq. of resource skills are separated into fixed and variable metrics. The fixed variables are used to map costs, which are considered once, when using the according resource skill. Variable costs are multiplied with the required quantity of the part process step. The parameter quality is addressed as a prerequisite for the different manufacturing possibilities in the Ability.
3.2. Solution-Finding Process
Based on the provided information in the framework, the goal of the solution-finding process is to identify a combination of resource skills that can conduct the needed part process steps. The chain of resource skills is defined in the manufacturing possibilities, based on the necessary process steps defined by experts. Then, the different possibilities are evaluated based on their ability to fulfill all required constraints to manufacture the part. A constraint for example could be that the requirement material (name) must be (operator: =) AlMg5 (value). Every resource skill with the ability AlMg5 (value) can fulfill this constraint. If a single part process step cannot be carried out by any resource skill since constraints cannot be fulfilled, the complete manufacturing possibility is discarded and not taken further into account. By not only matching abilities and constraints individually, but also the process step of the resource skill and part process step, the manufacturing process of a part can be defined more accurately, and a high degree of automation can be achieved after the definition of the possibilities. Figure 3 shows the workflow for finding all possible resource skills for a list of given part process steps.
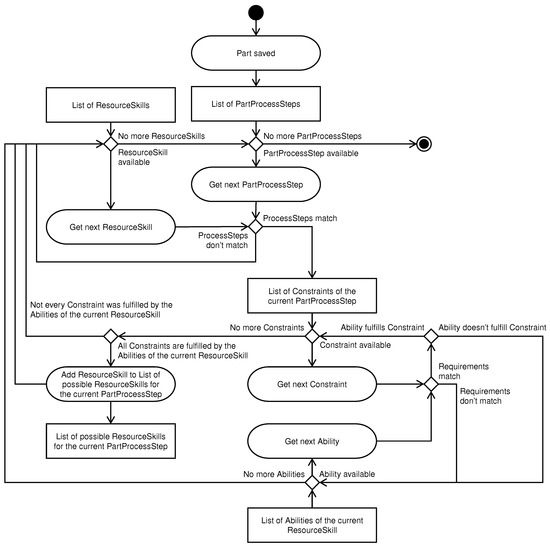
Figure 3.
Activity diagram of the solution-finding algorithm taking into consideration Resource Skills, Part Process Steps, and Constraints.
Once it is determined, which part process step can be executed by which resource skill, all possible permutations are created. A permutation is a unique combination of resource skills to fulfill all part process steps n of a manufacturing possibility as schematically shown in Figure 4. For every permutation, comparative factors (price, time, and -eq.) are calculated by summing up the expenses of the individual resource skills.
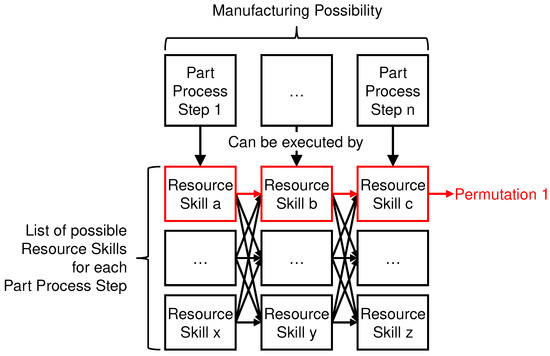
Figure 4.
Visualization of a permutation in the set of possible resource skills for a manufacturing possibility.
This procedure is exemplary shown for the complete price of a permutation as follows
With the price of a resource skill
where the price for all used consumables m of a specific resource skill i is
As a result, the overall price, time, -eq. and consumables required by the permutation are known. This information is used in the next step to rank the individual permutations using multiple-criteria decision analysis.
3.3. Multiple-Criteria Decision Analysis
Since the set of m permutations i must be evaluated regarding a set n of multiple criteria j (e.g., price, time, and -eq.), multiple-criteria decision analysis methods are used for decision-making. The multiple-criteria decision analysis aims at finding the best manufacturing possibility in a set of alternatives. In this context, best means low price, low time, and low -eq. at the same time. It should be pointed out that the criteria to be evaluated can be easily extended. In future, additional metrics, such as the distance between customer and resource location can be considered or integrated into the environmental considerations based on possible transport means. For the multiple-criteria decision analysis two different methods are described, the weighted evaluation and the CRITIC method [38].
The first integrated method is the weighted evaluation. In the beginning, the criteria values must be normalized to make the independent variables comparable. For this purpose, we use the min-max normalization for scaling to the range . In this case, 0 is the best (e.g., cheapest) and 1 is the worst (e.g., most expensive) permutation. After rescaling the value of every criterion j from every permutation i, the normalized value is multiplied with a user-defined weight and summed up to calculate the comparative value as follows
The permutation with the lowest value is in this case the one with the best performance. With the possibility of adjusting the weights, it can be directly defined, which variable is currently most important for the user. However, finding weights can be difficult, especially when the importance cannot be expressed in a defined value. To consider all factors, but also find objective weights we use the so-called CRITIC method. The CRITIC method calculates the contrast intensity and the conflicting character of the evaluation criteria for determining meaningful weights. A detailed explanation can be found in [38]. For the calculation of the weights according to the CRITIC method, the standard deviations of the normalized criteria values are determined first. The Pearson coefficient represents the linear correlation between two sets of data and is calculated by the covariance of two variables, divided by the product of their standard deviations. The Pearson correlation coefficient is calculated for every combination of variables (price and time, price and -eq., time and -eq.). In the next step, the amount of information given as
is determined. Subsequently, the weight can be calculated as follows
The determined weights can now be used to calculate the multiple-criteria score in accordance with Equation (4). Finally, the permutations can be ranked in dependence of their respective score.
3.4. Identification and Calculation of Environmental Impacts
The identification of price and time is a standard procedure in production planning. In contrast, the identification and calculation of environmental impacts is more sensitive and complex and thus explained separately in this section. The main challenge is to identify suitable background data for the different processes within the manufacturing framework to contribute robust results for the different sustainability indicators, i.e., -eq. and its impact on climate change. Background data describes data on environmental impacts that are not directly occurring on site. This includes scope 2 emissions from energy consumption and scope 3 emission from pretreated materials such as consumables or intermediate materials, that do not occur directly on the production site. The integrated environmental indicators are based on the methodology of life-cycle assessment (LCA) which is regulated by the 11 standards issued in ISO/TC 207/SC 5 Subcommittee. LCA is a tool and scientific method to assess environmental impacts (damages to ecosystem, human health and resources), while taking into consideration all life-cycle stages of a product or process (from raw materials, production, operation trough to use and end-of-life) [39,40]. By quantifying all flows across the border between the life-cycle of a product (technosphere) and the environment (ecosphere) a comprehensive assessment is conducted [41]. The covered flows usually include energy use and input materials as well as released emissions and produced waste. The key advantages of LCA are the prevention of burden shifting between the life-cycle stages and the coverage of a broad range of impact categories (e.g., climate change, water use, resource depletion) [41]. Despite the unlimited theoretical scope, a LCA study is eventually defined by the limited resources for the conduction, restricted to a certain research or study question. According to the framework’s scope of the process planning, a cradle-to-gate approach is selected, considering the product as far as its production, but not regarding the use or recycling. The following life-cycle stages of the product life-cycle are included based on [32] and discussed in Section 2. In contrast to [32] the life-cycle stages design, use, maintenance, and end-of-life are excluded in accordance with the cradle-to-gate approach:
- Raw material extraction
- Material preparation
- Production
- Post-processing incl. production waste
Figure 5 shows the included life-cycle phases. Relevant information for the life-cycle impacts is stored in the models for Resource Skill Consumables and Resource Skills.
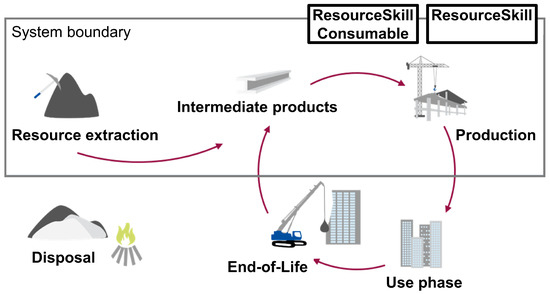
Figure 5.
System boundary for the assessment of production processes.
The process description in the framework fulfills the role of the foreground system modeling in the LCA, where a comprehensive inventory of inputs and outputs (inventory analysis) of the manufacturing processes are created. The data collection process for a life-cycle assessment is standardized in the standards ISO14040 [39] and ISO14044 [40] and in guidelines, such as the International Reference Life-Cycle Data System (ILCD) handbooks [41]. In general, the goal is to quantify all elementary flows, so the flows between the technical systems and the environment are not altered before they enter or after they leave the technical system. It is not practical to identify every single elementary flow for each studied product system individually and not practical to accomplish in the process descriptions in the framework. Thus, LCA databases are used to obtain the elementary flow, based on the technical flows described in the Resource Skill Consumables and Resource Skills. The link between technical flows and elementary flows takes place in the so-called background system modeling.
Based on the process of an LCA study and the pre-existing knowledge from other literature sources, see Section 2.3 and Section 2.4, the following parameters subsequently need to be covered in the assessment framework:
- Process parameters including and focusing on energy consumption,
- Location of manufacturing resources and electricity type,
- Input material type, properties, and quantities, and
- Aspired process quality.
Along the example of energy input, this would mean the right energy source (technology), the appropriate location, e.g., the German grid mix (geographical) and a recent distribution between the technologies (time). For the integration into the framework the relevant data includes direct production emission, operating material, energy consumption, and investments for the machine production as well as material inputs (as production material and semi-finished products). For additive technologies, the material inputs are modeled as production material inputs and for conventional inputs as semi-finished products and thus as a resource. Figure 6 shows the different product flows and its position in the information model. The different product flows are also assigned to the different scopes based on the greenhouse gas emissions protocol [42].
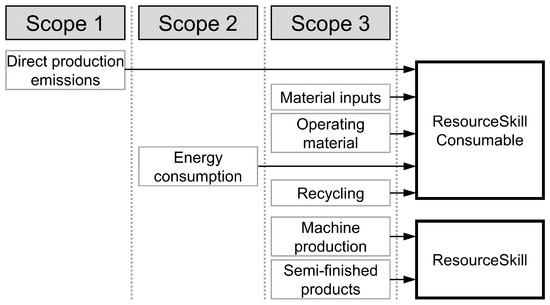
Figure 6.
Mapping of environmental impacts to the corresponding information in the framework and classification according to the respective scopes.
The introduced approach is implemented using Django, a high-level Python web framework. This enables the fast and easy setup of a working system since Django provides an interface to interact with the underlying database content. Furthermore, the application can be easily adjusted or extended while meeting the requirements of a future-oriented system architecture. The web-based approach enables the sharing of the provided service with multiple users. In this way, not only service providers can offer their resources, but also end users can model their possible manufacturing process steps and search for fitting solutions, fulfilling the defined requirements with respect to ecologically metrics. Furthermore, it is possible to integrate the framework into external applications. The models described in Section 3.1 serve as the basis for the generation of the necessary database tables. Each model is a single table and each attribute an according database field. In the same way, the solution-finding and evaluation algorithms are implemented.
4. Results
In this section, insights are provided into the mapping of resources using laser metal-wire deposition (LMWD) as an exemplary process. The process was analyzed in detail and consumables were measured. Furthermore, a use case is described for evaluation of strengths and weaknesses of the system.
4.1. Mapping of Resources
Exemplary resource information was inserted into the Django implementation to assess the integrity of the design and to highlight the required information for a sound mapping. Laser metal-wire deposition (LMWD) performed on a universal laser machine at the IFSW was chosen as an exemplary manufacturing process. LMWD is a generative process based on laser welding with filler wire. The used welding optics CoaxPrinter from Precitec is specifically designed to form a ring-shaped beam focus around the wire for a coaxial wire feed. This allows for an omnidirectional feed vector and therefore provides the required flexibility for a generative buildup process of complex parts.
The LMWD process can be operated in a multi-dimensional range of settings and resulting workpiece properties. In practice, a manufacturing process would be setup to perform either a high-accuracy low-volume rate buildup or a low-accuracy high-volume rate buildup. Both aspects are interdependent, because the highest volume rates can only be achieved by increased feed in combination with an up-scaling in weld bead width and height, i.e., lateral and vertical step-over. For design assessment of the framework, the universal laser machine is modeled as a resource and a LMWD process in high-accuracy regime as an affiliated resource skill.
Wherever possible, data from the real process was captured and used to map the process. In all other cases, general open-access data were used and referenced. This specifically concerns ecological information. The accurate capturing of such data for a unique resource requires specific knowledge and expertise, which cannot be expected to be provided by the intended user group of the framework, but can be obtained from LCA databases (see Section 3.4).
The resource of interest is a custom-built universal laser machine at the IFSW. To perform an LMWD process, a controlled wire feed unit and a coaxial optic is mounted to the work head. The laser beam source is a spatially separated solid state laser, but both laser and machine are regarded as a compound system within the given context and created as a single resource. As described in Section 3.1, a resource skill is defined by a general skill description, fixed and usage dependent (variable) values for time demand, costs and environmental impact, as well as consumables and abilities. In the following, such a definition is provided and explained in detail for the LMWD process.
To generally categorize the LMWD process, it is assigned to the process step of ’primary shaping’. The fixed time demand comprises machine setup, tool adjustment, building platform arrangement and thermalization of beam source and cooling plate, which sums up to half an hour. Process parameters optimized for high-accuracy yield a buildup rate of 43.2 mm*/s. Its reciprocal value describes the variable time demand, i.e., the required time to process one base unit (mm). The asterisk is used hereafter to distinguish the unit of buildup volume from other consumables. Fixed and variable parts of the production costs for a LMWD part stem from machine depreciation (71.0 EUR and 9.13 × 10⁻⁴ EUR/mm) and the consumables’ costs (in sum 0.74 EUR and 3.22 × 10⁻⁴ EUR/mm). Costs and environmental impact of the consumables are further detailed in the following section. It must be noted that all values are measured or otherwise determined for the operation of the specific universal laser machine at the IFSW, which was also used for demonstration of the LMWD process. The machine, however, was designed and custom-built for research purposes on laser processes, making the shown data not representative for an industrial application of an LMWD process in general.
4.1.1. LMWD Consumables
To completely map the LMWD process, seven different consumables are required. Table 1 includes all the relevant consumables, sorted by descending variable costs.

Table 1.
Relevant consumables for a LMWD process performed on the universal laser machine at the IFSW. Variable values are related to a buildup volume of one dm³ (L*) of aluminum wire. Data related to electrical energy is based on Germany’s electricity grid mix.
Nitrogen gas: The LMWD process is a welding process, which requires shielding gas around the melt pool. Nitrogen gas is used in this case. The value is based on a constant volume rate of 35 l/min used during process. The error of the control valve is estimated to be ±10 %. Costs and -eq. can vary accordingly.
Protective glass: The focusing laser optic is protected by a glass plate against physical process emission. Contamination from weld spatter can deteriorate the beam quality and subsequently the process result. The glass plate is therefore regularly replaced every 24 h of production. In the case of a failure, the protective glass can wear prematurely and require a replacement much earlier. Because the costs for this replacement part contribute significantly to the total variable costs, this must be considered.
Aluminum wire: The buildup material is provided as AlMg5 welding wire with a diameter of 1 mm. During machine setup, one meter of wire is wasted for beam alignment checks and adjustment of the wire straightener. Its variable value is precisely 1 mm/mm because the required wire volume during the process closely equals the buildup volume. Losses due to spatter and evaporation are negligible.
Energy consumption: This value includes the total power consumption of the universal laser machine with drives and electronics, the operator panel (constant 580 W) and the power consumption of the laser. The energy demand of the machine and the laser was measured during the LMWD process. As described above, machine and laser are two spatially separated units, hence both have their own power supply lines. During the first phase, the power input of the universal laser machine was measured over six hours of operation. The graph in Figure 7a shows a one-minute average of the power consumption. Three different levels can be distinguished, which are marked with dashed lines in the graph. These levels match the operation modes of the machine, which are standby (590 W), control (700 W) and process (770 W). During control all the drives are activated as opposed to standby. Whenever the drives are moving the machine is in process mode. The levels approximate the power consumption for all three modes with an accuracy of ±10% (min-max). Deviations for e.g., the process mode result from acceleration, speed and load dependent power consumption of the drives which correlates with the complexity of the tool path. The distinction between control and process mode is not required for an accurate mapping of the process. In a production run, the machine would be set up in standby mode followed immediately by the LMWD process in process mode. Hence, machine and operator panel require 1.17 kW during setup (half an hour, which equals to 0.585 kWh) and 1.35 kW during process. Likewise, the graph in Figure 7b of the laser source shows three levels of standby at 3000 W, active state at 6180 W and process at 9900 W. Although the power consumption is constant during standby and active state, the graph shows a sloping trend during the process. This is in line with the beam power demand of the LMWD process, which decreases with buildup height to compensate for heat accumulation within the work piece. The maximum deviation is ±4% for this LMWD process regime. To map the laser half an hour at 3000 W during setup and 6180 W for nine minutes of post-process active state is used yielding 2.43 kWh fixed energy consumption. During process the mean value of 9900 W is used. The source of the energy is a key aspect for the assessment of the environmental impacts and is further discussed in Section 4.2. Table 1 provides price [43] and -eq. data under ’Energy consumption’ and ’Cooling’ related to German electricity grid mix.
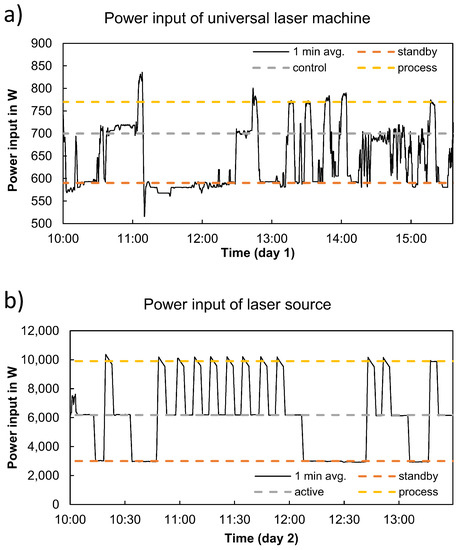
Figure 7.
Power demand of (a) the universal laser machine and (b) the beam source during interrupted LMWD process.
Wire nozzle: A copper nozzle guides the aluminum wire through the focusing lens to the melt pool. Due to abrasion within the nozzle and subsequent loss of guiding precision, the nozzle is replaced every 10 kg of aluminum wire throughput. The nozzle is a wearing part and as with the protective glass, failures during the process can reduce replacement intervals. However, costs and environmental impact of the nozzle are below the uncertainty of other consumables.
Cooling: The building platform on the machine has internal cooling channels to drain heat from the part. The fluid is provided by an intricate cooling system within the facility. To map the energy demand of the cooling for this process, a reference value of 290 W based on a stationary chiller is used.
Compressed Air: To extend the replacement period of the protective glass, a cross jet is mounted underneath to blow away material emissions from the process. A value of 2.1 ct/m³ at standard atmosphere was used to map the costs.
The LMWD as a generative process requires a solid base to adhere the first weld beads to. Two different scenarios are possible. It can be used to manufacture a blank similar to a casting process. In this case, a sacrificial building plate is used during the LMWD process to build up the material. This building plate is removed in a subsequent process and then reused or recycled. A continuously reused base does not contribute to the environmental impact of the process. Its costs can be neglected over a sufficiently long lifetime. However, for the considered LMWD system the building plate is a recycling product. Every building plate is laser cut from sheet metal and its material is recycled after sawing it from the blank. In such an application, every mm of building plate contributes with 2.59 × 10⁻⁵ kg -eq. to the environmental impact and with 2.55 × 10⁻⁴ EUR to the costs of the LMWD process. This can be mapped by adding a building plate consumable to the LMWD resource. In a different scenario, LMWD could be used to add a geometrical feature to a pre-existing semi-finished part. No separate building plate would be required in this case.
As shown, all consumables are defined by fixed values, which represent the quantity required during process initialization, and variable values that scale linearly with the usage of the skill. Such a classification is an important feature of the data model to distinguish between costs, which occur once per process step and costs, which are generated continuously during the process. Additionally, it allows differentiating between the electrical energy consumption during standby and during operation, as shown in the LMWD example. Generally, this model is well suited to map all kinds of consumables, whose usage is mainly dependent on the process regime and the process duration. In contrast, those who depend on the part‘s geometry can only be mapped using a mean or typical value, and therefor may cause inaccuracy of the results for a specific part. Another source of error is the determination of the actual buildup volume. Although at first glance it seems valid to deduce this volume from the part’s model, in practice it shows that the required material volume can deviate from the model to a large extent. On the one hand, lightweight parts are often produced with internal cavities to reduce mass, production time and raw material consumption. This can be pushed to an extreme by reducing the material placement solely to an outer hull leaving a geometry whose complexity can only be realized with generative technologies. On the other hand, additive manufacturing and the LMWD process in particular require additional material for process-related geometrical features, such as structures for improved adhesion on the building platform, heat sinks, support for overhangs, or machining allowance. The higher the complexity of the outer shape of a part the more additional material is needed. A deep understanding of the process itself and the requirements for the finished part are needed to determine the actual buildup volume and in consequence enable the framework to produce valid results regarding the best manufacturing technology for a given case.
4.1.2. LMWD Abilities
As described above, a main part of the skill model is the definition of consumables and abilities. The consumables are used to determine costs and environmental impact of the process. Abilities in contrast are used to assess whether the skill of a resource can perform the intended part modification with the needed quality. Every ability is quantified by a single scalar value to allow matching between the part modification and all available skills. The three abilities, working space, accuracy, and material are considered for the LMWD process. As shown below, modeling working space and accuracy with a scalar value only, implies major limitations.
Different materials are defined as unique abilities. The user of the framework has the freedom to define specific materials, which can be process with LMWD, but also exclude them if they are not available as welding wire.
The working space of the universal laser machine is limited by the travel of all three linear axes, which is 1 m, 0.8 m, and 0.5 m respectively, yielding a volume of 0.4 m³. The order of magnitude of the volume gives a rough estimation of the capabilities of the machine and can be easily compared to other machines and the volume of the component to be manufactured. However, LMWD is often used for manufacturing large thin free-form components such as rotor blades, wheel carriers, or organic-shaped support beams. In these cases, the mere scalar value of material volume is insufficient to evaluate the workspace needed. For such parts, at least a bounding box model should be used to assess the manufacturability. A more sophisticated approach could be to implement algorithms to geometrically fit the 3d model into the workspace considering requirements regarding built orientation.
For the definition of the ability of the achievable accuracy of LMWD, it must be distinguished between areal surface roughness and geometrical accuracy on a macroscopic scale. The roughness of LMWD parts varies across the surfaces depending on the built orientation. On the bottom, the part adheres to the building plate, which prevents the specification of roughness. On the top, roughness is determined by the cross-sectional geometry of the weld beads and their horizontal distance. Along the side walls, the vertical layer height defines the surface characteristics. To quantify the achievable surface roughness with a single value, the worst case must be considered. For the process regime of the described skill, steep overhangs show a deviation of up to 1 mm from the designed shape.
The geometrical or macroscopic accuracy is primarily determined by layer height, weld bead geometry, and thermal distortion and serves as a measure of the minimum feature size that can be produced. Its value for the given process is ±2 mm. This kind of geometrical error of the part is unique to generative processes and must be considered not as an ability, but as additional allowance while determining the required buildup volume.
4.2. Determination of the LCA Background Model
Paralleling the section structure of the framework description, the determination of the LCA background model is detailed for the resource skill described above. The selection of the LCA background data was conducted according to the approach described in Section 3.4 based on the technical, geographical, and time representativity with a focus on the technical representativity, due to the generic character of the framework. The mapping is necessary for all skill consumables (operational material and material in additive processes) (see Table A3) and resources (material in conventional processes and machine production) (see Table A4 and Table A5). The LCA databases Gabi [44] and ecoinvent [45] were used with the impact category Global Warming Potential based on the impact methodology Environmental Footprint. Note: The additional resources for the use case are covered in the tables described above as well, but more details can be found in Section 4.3.
Table A3 shows the selected background data for the operation materials on the framework level of skill consumables. The skill consumables are implemented in a way that they can be customized to specific locations or also supplier preferences or availability. In this case, the used energy was varied for the LMWD process and thus, assuming two different locations or operational energy sources/choices (see Section 4.3):
- The German electricity grid mix with a carbon footprint of 575 g -eq. was assumed for the generic LMWD process.
- A specific electricity mix based on energy from photovoltaics with a carbon footprint of 69.6 g -eq. was used for the process ’LMWD (eco)’.
On the consumables level, two specific modeling approaches for end-of-life scenarios were implemented due to the restrictions of the framework:
- For operational materials, which are used but not consumed in the manufacturing process, the recycling or disposal efforts are considered in combination with the production impacts. Due to the resource and skill specific consumable level, different particularities can be taken into consideration.
- Recyclable material (e.g., mill chippings) is modeled as a skill consumable with negative impacts. Thus, a skill consumable with a negative value can, generally, be considered to be an output, following the process perspective. This is in line with an avoided-burden approach in LCA (see Section 3.4).
Skill consumables required for the specific manufacturing process (e.g., block size) are modeled as resources. Table A4 shows the selected background data for the intermediate materials, necessary for conventional manufacturing steps, such as milling. Table A5 shows the selected data set for the impacts from the production of the machinery resources. The calculation assumptions are based on the calculation of the capital cost of research machinery equipment:
- Lifetime: 3 years
- Working days per year: 220 days
- Shift system/working machine hours per day: 8 h
4.3. Use Case
To demonstrate the modeling of an exemplary part, a flange was designed, modeled, and evaluated. The flange is made from aluminum, with the dimensions shown in Figure 8. The top of the flange is defined with a surface roughness of Rz = 25 m and a hole with a diameter of 7 mm to receive a connecting rod. It expands to an 80 mm by 80 mm mounting plate with a pattern of M6 through holes. Four reinforcing ribs improve strength against side loads. Figure 8b,c show the semi-finished and finished part when manufactured with laser-based processes including LMWD.
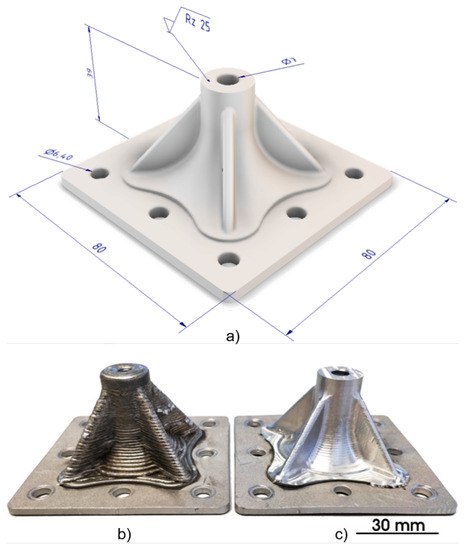
Figure 8.
Example flange part for illustrating the modeling of part process steps. (a) The main dimensions and part constraints; (b) The part after the LMWD process; (c) The part after the post-processing.
Two possible paths for manufacturing this part were described with the framework. Figure 9 shows the corresponding part process steps. Both arrows indicate the chronological order of subsequent process steps, each of them is defined by a quantity value and a corresponding unit, as well as a textual description. The first manufacturing possibility is based on laser technology primarily, which was used to actually manufacture the part for demonstration purposes. The base plate with through holes was separated from a 4 mm metal sheet using laser cutting. Subsequently, the flange feature was added using LMWD with appropriate allowance. The result is shown in Figure 8b. The top face, the bore and the outer contour were milled to the final geometry in a post-processing step. The finished part is shown in Figure 8c. This post-processing step has no constraints regarding the final surface finishing. The last process step was the surface finishing to achieve the required surface roughness on the top of the flange. The second manufacturing possibility starts with a semi-finished aluminum cuboid. This cuboid is subsequently milled, which includes the bores in the base plate. Finally, the upper surface of the flange is processed with the same constraints as in manufacturing possibility 1 to achieve the required surface roughness.
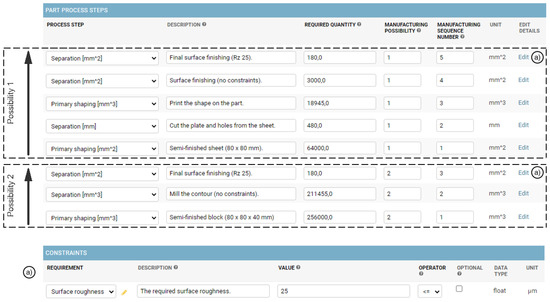
Figure 9.
Screenshot of the manufacturing possibilities of the sample part and the underlying part process steps. (a) shows the constraint of the process step for the final surface finishing.
To compare the impact of different sources for the electrical energy, a second LMWD (eco) process was added. It is an additional skill of the universal laser machine resource, but powered by electrical energy from renewable sources, i.e., photovoltaics. This change raises the costs from 22.45 ct/kWh to 22.62 ct/kWh [43] and reduces the -eq. from 0.575 kg/kWh to 6.96 × 10⁻² kg/kWh [44].
In addition to the universal laser machine described in detail in Section 4.1, three additional resources were inserted into the framework to calculate both possibilities. These are the required raw material, a laser cutting cell, and a milling machine with different skills. The resources were modeled in a simplified way and do not have the same level of detail as the LMWD process. However, the values of the resources were selected carefully to ensure the comparability of the assessments. The values used for this purpose were compiled from publications or estimated to the best of the authors’ knowledge. Accordingly, these are by no means representative values. They serve exclusively to demonstrate the framework presented here. The modeled resources and according values can be found in Appendix A.1.
After inserting the part information, the evaluation is executed within the framework and the results are stored in a dedicated database table. During the process, every possible permutation is identified, and the resulting values are determined using the procedure introduced in Section 3.2. The results of the multiple-criteria decision analysis are shown in Table 2. For this exemplary use case, the algorithm identified four permutations of available resource skills, which are potentially able to manufacture the part. All permutations are ranked by their score from best (1) to worst (4). The possibility column shows, on which of the both initial possibilities the permutation is based on, i.e., ’1’, ’2’ or automatically identified ’-’. In the center, all resource skills of the permutations are shown in subsequent order, from top to bottom. On the right are the final values for price, time, and -eq.
Table 2.
Results of the multiple-criteria decision analysis.
5. Discussion
In the previous section, the results of a specific use case where shown. To put them into perspective and examine the validity of the output is the goal in the following. The best ranked (1) permutation shown in Table 2 was automatically identified by the system, based on the available resources and resource skills. It was not manually described in advance. The system recommends combining a semi-finished sheet and a semi-finished block to manufacture the flange. The permutation on rank 2 is based on the predefined possibility 2, which is manufacturing the flange from a solid block of aluminum. Both permutations on rank 3 and 4 describe the same process of laser cutting a semi-finished sheet and printing the remaining material using the LMWD process. Although the permutation on rank 3 uses a LMWD (eco) process with electrical energy generated from renewable sources, the permutation on rank 4 uses conventional energy sources for all processes. The fact that a completely new permutation (rank 1) was automatically identified, based on the information available within the framework, highlights the advantages and capabilities of the developed system. Identifying possible manufacturing sequences and alternative manufacturing possibilities for a given part, especially for an increasing number of resources and resource skills, is a valuable feature for users to optimize their production. However, the automatically identified permutation is flawed, because the required processes to join the semi-finished sheet to the block are not considered and not considered for the calculation. The result likely does not represent the total values of price, time, and -eq. to be expected for this permutation. The permutation may be falsely ranked best. This outcome indicates that additional constraints are required to accurately map possible subsequent processes and therefore improve the quality of automatically designed permutations.
To further analyze the results in terms of the calculated environmental impact, Figure 10 shows -eq. in kg for the two permutations on rank 2 and 3. Additionally, the information is broken down by the subsequent resource skills from bottom to top. The conventional manufacturing on rank 2 yields a total of 11.8 kg -eq., while laser-based manufacturing yields 14.8 kg. This means, manufacturing the demonstration part, using the milling process strategy, generates less -eq. emissions taking all considerations into account. Within possibility 1 the LMWD process is further detailed into a part that stems from machine production and the contributions from consumables used during the process. In this case, machine production makes up 77% of the LMWD (eco) impact, mainly due to the assumption of machine deprecation time made in Section 4.2. Consumables for the process, including the wire material to produce the flange and allowance for subsequent milling, only contribute 1.24 kg in total. The environmental impact is strongly dependent on the actual energy consumption of the additive process. Literature references for the carbon footprint of additive manufacturing can differ based on the electricity mix by the factor 20 (process “laser machining, metal, with CO-laser, 6000 W power” in Canada vs. Europe [45]) or by the manufacturing setup by the factor of 15 (SLM process with multiple parts vs. single part manufactured simultaneously [46]. A reference value for LMWD is not known to the authors.
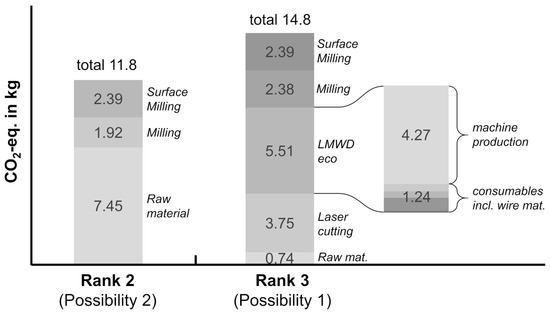
Figure 10.
Environmental impact of permutations from rank 2 and 3 in -equivalents. The LMWD process within possibility 1 is further detailed showing the parts from machine production and the required consumables on the right.
In possibility 2, the main part with 7.45 kg, is contributed by the solid block of aluminum raw material with an initial size of 256 cm (80.5 by 80.5 by 39.5 mm). The following milling process removes 211 cm to finish all outer contours, except the top surface, to size. In contrast, the milling process within possibility 1 only removes the allowance of 3 cm from the previous LMWD process. However, negative -eq. of chip material, due to recycling overcompensate the longer milling time and increased consumable demand during bulk milling in possibility 2. This leads to a -eq. of 1.95 kg compared to 2.38 kg for the short milling operation in possibility 1.
The surface milling is the same process in both possibilities and yields the same amount of 2.39 kg of -equivalents.
Considering all assumptions put into the framework and the modeling of the part, the results shown are valid and comprehensible. Different manufacturing technologies were evaluated producing the same part, but yielding different outcomes in terms of price, time, and environmental impact in -equivalents. It was shown that the system can propose solutions based on the experts manufacturing plan, as well as evaluate new strategies, as seen in the example. However, the framework can only optimize within the boundaries given by the initially defined resources. Although this is a practical approach to optimize manufacturing for a given part and manufacturing situation, it does not take into account the optimization potential, which might lie in up-to-date resources and technologies. Regarding future competitiveness of a production, it still lies in the hand of the user to add improved capabilities to the shop floor and hence to the framework database as new skills.
6. Conclusions
With the sustainable manufacturing framework, the paper proposes an ontology for production resources and part descriptions to realize process planning under consideration of ecologically aspects. The introduced framework and its workflows describe the matching of resource skills, and process steps and uses methods of multiple-criteria decision analysis to evaluate possible combinations of resources regarding resulting costs, required time, and -eq., as an indicator for sustainability for the manufacturing of a specific part. The part quality is ensured by explicitly defined constraints and not used as an optimization parameter. The logic of the framework is implemented into a web-based platform, allowing service providers to offer their resources and customers to access them directly, by externalizing the expert knowledge of process planning. The functionalities of the framework are validated with a use case of an aluminum flange. In addition to a LMWD process modeled in detail, a milling and laser cutting process were added to define alternative manufacturing possibilities. The framework was not only able to identify preferable manufacturing possibilities based on the data input of the use case, but also propose the best production resources for the specific manufacturing steps. The framework is intended to support an automated manufacturing decision-making, based on different possible manufacturing resources and thus reduce the complexity of finding suitable production resources regarding the required quality, resulting costs, required time, and -eq. for an individual part. However, no generalized and universal conclusion should be drawn regarding the absolute environmental impacts of the different manufacturing possibilities due to (a) the different levels of detail for the process descriptions in the framework and (b) the simplicity of the use case.
Although the framework offers valuable insights for the studied use case, some limitations of the framework were identified and are listed below:
- The data placement, in particular at the start of the framework implementation, relies on the expertise of manufacturing and LCA experts.
- Consumables are not directly geometry dependent (e.g., aluminum wire ’overhead’).
- Waste flows cannot be integrated as outputs for conventional manufacturing (i.e., intermediates as resources).
- Link of process parameters to environmental impacts cannot be shown directly, but must be embedded in the data filled in by experts for every resource skill.
- The scheduling of machining operations is not considered in this work. However, as mentioned in the literature review, this could offer potentials to further improve the overall energy efficiency and thus the environmental impacts.
The proposed framework is capable of including environmental aspects into the decision-making process. Yet, the data structure is not capable of demonstrating the causation between the process parameters and its impacts:
- The environmental impact is mainly influenced by the background data and cannot be directly influenced and confirmed by the owner of the framework. Thus, the results hold a significant uncertainty.
- The environmental assessment is currently limited to the consideration of the Global Warming Potential (-eq.). This could easily be extended to other impact categories. Yet, due to the goal to cover a wide range of manufacturing possibilities, the used background data would be too unspecific.
The described limitations and findings lead to multiple potentials for improvement and research gaps. Currently, a manufacturing expert is required to model manufacturing possibilities of a part. This step can be time-consuming and complex since a part can possibly be manufactured in many different ways. A solution would be the implementation of a volume decomposition and feature extraction algorithm, which suggests possible manufacturing processes, including the required constraints. By doing so, the evaluation could already take place during the design phase of a part and provide helpful feedback about the manufacturability and the resulting costs, the required time, and -equivalents. As a result, direct adjustments could be made to reduce environmental impacts. Resource properties, such as the energy consumption, could be directly gathered by connecting the machine control and the underlying sensor systems with the platform. Furthermore, an automated determination and mapping of -eq., based on the described but manually conducted procedure would be time-saving. Therefore, an interface to LCA databases must be developed and a mapping strategy for the junction of consumable information and information from the LCA databases is needed. Finally, the validation should be scaled up to more resources and parts to prove applicability in a real industrial setting.
Author Contributions
Conceptualization, C.R., M.B., T.B. and V.O.; methodology, C.R., M.B., T.B. and M.H.; software, C.R.; validation, C.R., M.B. and T.B.; formal analysis, C.R., M.B. and T.B.; investigation, C.R., M.B. and T.B.; resources, C.R., M.B. and T.B.; data curation, C.R., M.B. and T.B.; writing—original draft preparation, C.R., M.B., T.B. and M.H.; writing—review and editing, C.R., M.B., T.B., M.H., D.W. and O.R.; visualization, C.R. and M.B.; supervision, V.O., O.R.; project administration, O.R.; funding acquisition, O.R. and V.O. All authors have read and agreed to the published version of the manuscript.
Funding
This research was funded by the Ministry of Science, Research and Arts of the Federal State of Baden-Württemberg and the University of Stuttgart within the High-Performance Center for Mass Personalization in Stuttgart.
Institutional Review Board Statement
Not applicable.
Informed Consent Statement
Not applicable.
Data Availability Statement
Data available in a publicly accessible repository that does not issue DOIs Publicly available datasets were analyzed in this study. This data can be found here: [https://github.com/iswunistuttgart/plafosus accessed on 12 August 2021].
Conflicts of Interest
The authors declare no conflict of interest.
Abbreviations
The following abbreviations are used in this manuscript:
| -eq. | Carbon dioxide equivalent |
| HSC | High-speed cutting |
| LCA | Life-cycle assessment |
| LMWD | Laser metal-wire deposition |
Appendix A
The Appendix A.1 includes information about additional resources used for the demonstration of the use case and Appendix A.2 includes background data for the assessment of the environmental impacts.
Appendix A.1. Additional Resources, Resource Skills and Consumables
The consumables for the milling machine were derived from [47]. The work from Diaz et al. introduces a life-cycle energy consumption analysis for milling machines. We used the provided data for a Mori Seiki DuraVertical 5060 machine, located in a job shop, to calculate the consumption of energy and cutting fluid. The investigated machine manufactured 871 parts were 157,753 mm of AISI 1018 steel must be removed. The machine required 1000 kj/Part for the part production. This value is used for the regular milling skill. The machine consumed 1960 gal/year of oil-based cutting fluid and 12,000 gal/year water-based cutting fluid when used in a job shop environment with a yearly production of 217,750 parts (871 parts/day with 250 working days). These values were mapped to calculate the average consumption of these consumables for removing 1 mm material using the milling skill.
For the price of the raw material of AlMgSi0.5 we assumed 9.40 EUR/kg. For a sheet with the thickness of 4 mm, this corresponds to a price of 1.02 × 10⁻⁴ EUR/mm, where 2.7 × 10⁻⁶ kg/mm is the density of AlMgSi0.5. For a block, the costs are 2.54 × 10⁻⁵ EUR/mm. For the price of recyclable AlMgSi0.5 we assumed an average price of 0.7 EUR/kg, which is 3.46 × 10⁻¹¹ EUR/mm.
For determining the variable costs of the milling processes, we compared estimated costs of online platforms offering on-demand manufacturing capabilities. For this purpose, we removed the assumed material costs of 6.33 EUR for a block of 80 × 80 × 39 mm of AlMgSi0.5 from the offered price. The average price for the manufacturing of the described sample part was 383.58 EUR . Consequently, for processing the average milling process, the estimated price is 1.78 × 10⁻³ EUR/mm. For the surface milling mode, we assumed a 10% higher price.
The variable time for an average milling process is estimated with a removal rate of 120 cm/min based on [48]. For the surface milling mode, we estimate the variable time with 100 cm/min [48]. To map the machine preparation time (CAM, part fixing, tool changing, material removal etc.), we add a fixed time of 30 min per process.
Table A1 shows the information for the resource skills for the additional resources and Table A2 the information on the consumables for the additional resource skills.
Table A1.
Additional resources and their resource skills.
Table A1.
Additional resources and their resource skills.
| Resource | Resource Skill | Unit | Fixed Price in [EUR] | Fixed Time in [s] | Fixed -eq. [kg] | Variable Price | Variable Time | Variable -eq. |
|---|---|---|---|---|---|---|---|---|
| Milling machine | Milling | mm | 0 | 1800 | 2.390 | 1.78 × 10⁻³ EUR/mm | 4.16 × 10⁻⁴ s/mm | 6 × 10⁻⁷ kg/mm |
| Milling machine | Surface milling mode | mm | 0 | 1800 | 2.391 | 1.96 × 10⁻³ EUR/mm | 6 × 10⁻³ s/mm | 7 × 10⁻⁷ kg/mm |
| Laser cutting cell | Quality cut | mm | 7.11 | 300 | 1.275 | 3.55 × 10⁻⁴ EUR/mm | 1.5 × 10⁻² s/mm | 3.03 × 10⁻⁵ kg/mm |
| Raw material | Semi-finished sheet (4 mm) | mm | 0 | 0 | 0 | 1.02 × 10⁻⁴ EUR/mm | 0 s/mm | 1.164 × 10⁻⁴ kg/mm |
| Raw material | Semi-finished block | mm | 0 | 0 | 0 | 2.54 × 10⁻⁵ EUR/mm | 0 s/mm | 2.91 × 10⁻⁵ kg/mm |
| Universal laser machine | LMWD | mm | 71.01 | 1800 | 9.13 × 10⁻⁴ | 9.13 × 10⁻⁴ EUR/mm | 2.31 × 10⁻² s/mm | 4.67 × 10⁻⁵ kg/mm |
| Universal laser machine | LMWD eco | mm | 71.01 | 1800 | 9.13 × 10⁻⁴ | 9.13 × 10⁻⁴ EUR/mm | 2.31 × 10⁻² s/mm | 4.67 × 10⁻⁵ kg/mm |
Table A2.
Resource skills and their consumables.
Table A2.
Resource skills and their consumables.
| Resource Skill | Consumable | Unit | Fixed Quantity | Variable Quantity | Price | -eq. |
|---|---|---|---|---|---|---|
| Milling | Energy consumption | kWh | 0 kWh | 1.76 × 10⁻⁹ kWh/mm | 0.2245 EUR/kWh | 0.575 kg/kWh |
| Surface milling mode | Energy consumption | kWh | 0 kWh | 1.58 × 10⁻⁹ kWh/mm | 0.2245 EUR/kWh | 0.575 kg/kWh |
| Quality cut | Energy consumption | kWh | 4.17 kWh | 2.08 × 10⁻⁴ kWh/mm | 0.2245 EUR/kWh | 0.575 kg/kWh |
| Quality cut | Nitrogen | m³ | 0 m³ | 5 × 10⁻⁶ m³/mm | 12.3 EUR/m³ | 0.108 kg/m³ |
| Milling | Cutting fluid (water) | L | 0 L | 1.322 × 10⁻⁶ L/mm | 0.002 EUR/L | 9.275 × 10⁻⁵ kg/L |
| Milling | Cutting fluid (oil) | L | 0 L | 2.16 × 10⁻⁷ L/mm | 4 EUR/L | 1.807 kg/L |
| Milling | Recyclable AlMgSi0.5 | mm | 0 mm | 1 mm/mm | −3.46 × 10⁻¹¹ EUR/mm | −3.2 × 10⁻⁶ kg/mm |
Appendix A.2. Background Data for the Assessment of the Environmental Impacts
Table A3, Table A4 and Table A5 list the information on the selected LCA background data sets for the skill consumables and resources. The used LCA databases are the GaBi database by Sphera with its service pack version 40 [44] and the ecoinvent database with its version 3.7.1 [44].
Table A3.
LCA background data for the skill consumables—operation material.
Table A3.
LCA background data for the skill consumables—operation material.
| Resource | Skill | Skill Consumable | LCA Process | Geo Scope | Source | Comment |
|---|---|---|---|---|---|---|
| Universal laser maschine | LMWD + LMWD (eco) | Nitrogen | Nitrogen (gaseous) | DE | Sphera, GaBi DB SP40 | |
| Universal laser maschine | LMWD + LMWD (eco) | Protective glass | Borosilicate glass production | EU | Sphera, GaBi DB SP40 | |
| Universal laser maschine | LMWD + LMWD (eco) | Wire material | Aluminum sheet (AlMg4.5) | EU | Sphera, GaBi DB SP40 | AlMg4.5 as a proxy for AlMg5 |
| Universal laser maschine | LMWD + LMWD (eco) | Wire nozzle | Copper nozzle | DE | Sphera, GaBi DB SP40 | The used dataset is a modeled manufactured copper part. |
| Universal laser maschine | LMWD + LMWD (eco) | Compressed air | Compressed air | EU | Sphera, GaBi DB SP40 | |
| Universal laser maschine | LMWD | Energy consumption (building plate chiller) | Electricity grid mix | DE | Sphera, GaBi DB SP40 | |
| Universal laser maschine | LMWD (eco) | Energy consumption (building plate chiller) | Electricity from photovoltaic | DE | Sphera, GaBi DB SP40 | |
| Universal laser maschine | LMWD | Energy consumption (total energy demand for laser) | Electricity grid mix | DE | Sphera, GaBi DB SP40 | |
| Universal laser maschine | LMWD (eco) | Energy consumption (total energy demand for laser) | Electricity from photovoltaic | DE | Sphera, GaBi DB SP40 | |
| Laser cutting cell | Quality cut | Nitrogen | Nitrogen (gaseous) | DE | Sphera, GaBi DB SP40 | |
| Laser cutting cell | Quality cut | Electical energy | Electricity grid mix | DE | Sphera, GaBi DB SP40 | |
| Milling machine ISW | Milling level 1 | Cutting fluid (water) | Tap water from groundwater | DE | Sphera, GaBi DB SP40 | |
| Milling machine ISW | Milling level 1 | Cutting fluid (oil) | Lubricants at refinery + Used oil | DE | Sphera, GaBi DB SP40 | The modeled oil includes the end-of life treatment. |
| Milling machine ISW | Milling level 1 | Recycable AlMgSi0,5 | Recycling potential aluminum sheet | DE | Sphera, GaBi DB SP40 | |
| Milling machine ISW | Milling level 1 | Energy Consumption | Electricity grid mix | DE | Sphera, GaBi DB SP40 | |
| Milling machine ISW | Surface milling mode | Energy Consumption | Electricity grid mix | DE | Sphera, GaBi DB SP40 |
Table A4.
LCA background data for the skill consumables—intermediates.
Table A4.
LCA background data for the skill consumables—intermediates.
| Resource | Skill | Skill Consumable | LCA Process | Geo Scope | Source | Comment |
|---|---|---|---|---|---|---|
| Semi-finished raw material | Semi-finished block | AlMgSi0,5 | Aluminum ingot (AlMgSi0.5) | DE | Sphera, GaBi DB SP40 | |
| Semi-finished raw material | Semi-finished sheet | AlMgSi0,5 | Aluminum extrusion profile (AlMgSi0.5) | DE | Sphera, GaBi DB SP40 | Extrusion profile as a proxy for a sheet. |
Table A5.
LCA background data for resources.
Table A5.
LCA background data for resources.
| Resource | Skill | Machine Weight | Weight Source | LCA Process | Source | Comment |
|---|---|---|---|---|---|---|
| Universal laser machine | LMWD | 6200 kg + 1400 kg Laser unit | IFSW | Metal working machine, unspecified | Ecoinvent DB 3.7 | Allocation based on machine weight |
| Laser cutting cell | Quality cut | 16,000 kg | Estimation based on machinio.de | Metal working machine, unspecified | Ecoinvent DB 3.7 | Allocation based on machine weight |
| Milling machine | Milling level 1 | 5000 kg | Estimation based on machinio.de | Metal working machine, unspecified | Ecoinvent DB 3.7 | Allocation based on machine weight |
References
- Koren, Y.; Shpitalni, M. Design of reconfigurable manufacturing systems. J. Manuf. Syst. 2010, 29, 130–141. [Google Scholar] [CrossRef]
- Schuh, G.; Behr, M.; Brecher, C.; Bührig-Polaczek, A.; Michaeli, W.; Schmitt, R.; Arnoscht, J.; Bohl, A.; Buchbinder, D.; Bültmann, J.; et al. Individualised Production. In Integrative Production Technology for High-Wage Countries; Brecher, C., Ed.; Springer: Berlin/Heidelberg, Germany, 2012; pp. 77–239. [Google Scholar] [CrossRef]
- Hillary, R. Small and Medium-Sized Enterprises and the Environment: Business Imperatives; Routledge: London, UK, 2017. [Google Scholar]
- Ocampo, L.A.; Clark, E.E. Developing a framework for sustainable manufacturing strategies selection. DLSU Bus. Econ. Rev. 2014, 23, 115–131. [Google Scholar]
- Saade, M.R.M.; Yahia, A.; Amor, B. How has LCA been applied to 3D printing? A systematic literature review and recommendations for future studies. J. Clean. Prod. 2020, 244, 118803. [Google Scholar] [CrossRef]
- Barni, A.; Pietraroia, D.; Züst, S.; West, S.; Stoll, O. Digital Twin Based Optimization of a Manufacturing Execution System to Handle High Degrees of Customer Specifications. J. Manuf. Mater. Process. 2020, 4, 109. [Google Scholar] [CrossRef]
- WBGU—German Advisory Council on Global Change. Towards Our Common Digital Future: Flagship Report; WBGU: Berlin, Germany, 2019. [Google Scholar]
- Xu, X. From cloud computing to cloud manufacturing. Robot.-Comput.-Integr. Manuf. 2012, 28, 75–86. [Google Scholar] [CrossRef]
- Gao, J.; Yao, Y.; Zhu, V.C.Y.; Sun, L.; Lin, L. Service-oriented manufacturing: A new product pattern and manufacturing paradigm. J. Intell. Manuf. 2011, 22, 435–446. [Google Scholar] [CrossRef]
- Järvenpää, E.; Siltala, N.; Hylli, O.; Lanz, M. The development of an ontology for describing the capabilities of manufacturing resources. J. Intell. Manuf. 2019, 30, 959–978. [Google Scholar] [CrossRef]
- Ameri, F.; Dutta, D. An Upper Ontology for Manufacturing Service Description. In Proceedings of the 26th Computers and Information in Engineering Conference, ASMEDC, Philadelphia, PA, USA, 10–13 September 2006; Volume 3, pp. 651–661. [Google Scholar] [CrossRef]
- Ameri, F.; Patil, L. Digital manufacturing market: A semantic web-based framework for agile supply chain deployment. J. Intell. Manuf. 2012, 23, 1817–1832. [Google Scholar] [CrossRef]
- Mourtzis, D.; Vlachou, E.; Xanthopoulos, N.; Givehchi, M.; Wang, L. Cloud-based adaptive process planning considering availability and capabilities of machine tools. J. Manuf. Syst. 2016, 39, 1–8. [Google Scholar] [CrossRef]
- Newman, S.T.; Nassehi, A.; Imani-Asrai, R.; Dhokia, V. Energy efficient process planning for CNC machining. Cirp J. Manuf. Sci. Technol. 2012, 5, 127–136. [Google Scholar] [CrossRef]
- He, Y.; Liu, F.; Cao, H.; Zhang, H. Process Planning Support System for Green Manufacturing and its application. Front. Mech. Eng. China 2007, 2, 104–109. [Google Scholar] [CrossRef]
- Gould, O.; Simeone, A.; Colwill, J.; Woolley, E.; Willey, R.; Rahimifard, S. Optimized assembly design for resource efficient production in a multiproduct manufacturing system. Procedia CIRP 2017, 62, 523–528. [Google Scholar] [CrossRef][Green Version]
- Shojaeipour, S. Sustainable manufacturing process planning. Int. J. Adv. Manuf. Technol. 2015, 78, 1347–1360. [Google Scholar] [CrossRef]
- Dai, M.; Tang, D.B.; Xu, Y.C.; Li, W.D. Energy-aware Integrated Process Planning and Scheduling for Job Shops. In Sustainable Manufacturing and Remanufacturing Management: Process Planning, Optimization and Applications; Li, W., Wang, S., Eds.; Springer International Publishing: Cham, Switzerland, 2019; pp. 13–36. [Google Scholar] [CrossRef]
- Li, X.X.; Li, W.D.; Cai, X.; He, F. A hybrid optimization approach for sustainable process planning and scheduling. Integr.-Comput.-Aided Eng. 2015, 22, 311–326. [Google Scholar] [CrossRef]
- Alting, D.L.; Jøgensen, D.J. The Life Cycle Concept as a Basis for Sustainable Industrial Production. CIRP Ann. 1993, 42, 163–167. [Google Scholar] [CrossRef]
- Veleva, V.; Ellenbecker, M. Indicators of sustainable production: Framework and methodology. J. Clean. Prod. 2001, 9, 519–549. [Google Scholar] [CrossRef]
- Favi, C.; Germani, M.; Mandolini, M.; Marconi, M. PLANTLCA: A Lifecycle Approach to Map and Characterize Resource Consumptions and Environmental Impacts of Manufacturing Plants. Procedia CIRP 2016, 48, 146–151. [Google Scholar] [CrossRef]
- Duflou, J.R.; Sutherland, J.W.; Dornfeld, D.; Herrmann, C.; Jeswiet, J.; Kara, S.; Hauschild, M.; Kellens, K. Towards energy and resource efficient manufacturing: A processes and systems approach. CIRP Ann. 2012, 61, 587–609. [Google Scholar] [CrossRef]
- Rödger, J.M.; Beier, J.; Schönemann, M.; Schulze, C.; Thiede, S.; Bey, N.; Herrmann, C.; Hauschild, M.Z. Combining Life Cycle Assessment and Manufacturing System Simulation: Evaluating Dynamic Impacts from Renewable Energy Supply on Product-Specific Environmental Footprints. Int. J. Precis. Eng. Manuf.-Green Technol. 2020, 8, 1007–1026. [Google Scholar] [CrossRef]
- Faludi, J.; Baumers, M.; Maskery, I.; Hague, R. Environmental Impacts of Selective Laser Melting: Do Printer, Powder, or Power Dominate? J. Ind. Ecol. 2017, 21, S144–S156. [Google Scholar] [CrossRef]
- Torres-Carrillo, S.; Siller, H.R.; Vila, C.; López, C.; Rodríguez, C.A. Environmental analysis of selective laser melting in the manufacturing of aeronautical turbine blades. J. Clean. Prod. 2020, 246, 119068. [Google Scholar] [CrossRef]
- Peng, T.; Wang, Y.; Zhu, Y.; Yang, Y.; Yang, Y.; Tang, R. Life cycle assessment of selective-laser-melting-produced hydraulic valve body with integrated design and manufacturing optimization: A cradle-to-gate study. Addit. Manuf. 2020, 36, 101530. [Google Scholar] [CrossRef]
- Catalano, A.R.; Lunetto, V.; Priarone, P.C.; Settineri, L. A Survey on Energy Efficiency in Metal Wire Deposition Processes. Sustainable Design and Manufacturing 2019. In Smart Innovation, Systems and Technologies; Ball, P., Huaccho Huatuco, L., Howlett, R.J., Setchi, R., Eds.; Springer: Singapore, 2019; Volume 155, pp. 311–322. [Google Scholar] [CrossRef]
- Wang, Y.; Peng, T.; Zhu, Y.; Yang, Y.; Tang, R. A comparative life cycle assessment of a selective-laser-melting-produced hydraulic valve body using design for Property. Procedia CIRP 2020, 90, 220–225. [Google Scholar] [CrossRef]
- Abdulrahman, K.O.; Akinlabi, E.T.; Mahamood, R.M. Laser metal deposition technique: Sustainability and environmental impact. Procedia Manuf. 2018, 21, 109–116. [Google Scholar] [CrossRef]
- Morrow, W.R.; Qi, H.; Kim, I.; Mazumder, J.; Skerlos, S.J. Environmental aspects of laser-based and conventional tool and die manufacturing. J. Clean. Prod. 2007, 15, 932–943. [Google Scholar] [CrossRef]
- Ribeiro, I.; Matos, F.; Jacinto, C.; Salman, H.; Cardeal, G.; Carvalho, H.; Godina, R.; Peças, P. Framework for Life Cycle Sustainability Assessment of Additive Manufacturing. Sustainability 2020, 12, 929. [Google Scholar] [CrossRef]
- Cerdas, F.; Juraschek, M.; Thiede, S.; Herrmann, C. Life Cycle Assessment of 3D Printed Products in a Distributed Manufacturing System. J. Ind. Ecol. 2017, 21, S80–S93. [Google Scholar] [CrossRef]
- Wehner, D. Ordnungsrahmen und Ansätze für das Ökologische Risikomanagement bei der Produktentwicklung; Forschungsergebnisse aus der Bauphysik; Fraunhofer Verlag: Stuttgart, Germany, 2020; Volume 40. [Google Scholar]
- Bonvoisin, J.; Stark, R.; Seliger, G. Field of Research in Sustainable Manufacturing. In Sustainable Manufacturing; Stark, R., Seliger, G., Bonvoisin, J., Eds.; Sustainable Production, Life Cycle Engineering and Management; Springer International Publishing: Cham, Switzerland, 2017; pp. 3–20. [Google Scholar] [CrossRef]
- Malakuti, S.; Bock, J.; Weser, M.; Venet, P.; Zimmermann, P.; Wiegand, M.; Grothoff, J.; Wagner, C.; Bayha, A. Challenges in Skill-based Engineering of Industrial Automation Systems *. In Proceedings of the 2018 IEEE 23rd International Conference on Emerging Technologies and Factory Automation (ETFA), Turin, Italy, 4–7 September 2018; pp. 67–74. [Google Scholar] [CrossRef]
- Lin, A.C.; Lin, S.Y. A volume decomposition approach to process planning for prismatic parts with depression and protrusion design features. Int. J. Comput. Integr. Manuf. 1998, 11, 548–563. [Google Scholar] [CrossRef]
- Diakoulaki, D.; Mavrotas, G.; Papayannakis, L. Determining objective weights in multiple criteria problems: The critic method. Comput. Oper. Res. 1995, 22, 763–770. [Google Scholar] [CrossRef]
- German Institute for Standardization. Environmental Management—Life Cycle Assessment—Principles and Framework; ISO 14040:2021-02; Beuth-Verlag: Berlin, Germany, 2021. [Google Scholar] [CrossRef]
- German Institute for Standardization. Environmental Management—Life Cycle Assessment—Requirements and Guidelines; ISO 14044:2021-02; Beuth-Verlag: Berlin, Germany, 2021. [Google Scholar] [CrossRef]
- European Commission—Joint Research Centre—Institute for Environment and Sustainability. International Reference Life Cycle Data System (ILCD) Handbook—General Guide for Life Cycle Assessment—Detailed Guidance; EUR (Luxembourg), Publications Office of the European Union: Luxembourg, 2010; p. 24708. [Google Scholar]
- Smith, B. The Greenhouse Gas Protocol: A Corporate Accounting and Reporting Standard, rev. ed.; World Resources Institute and World Business Council for Sustainable Development: Washington, DC, USA; Conches, Geneva, 2004. [Google Scholar]
- EON. Industriestrom: Vergleich für Unternehmen. Available online: https://www.eon.de/de/gk/strom/industriestrom.html (accessed on 1 June 2021).
- Sphera. Gabi Database: Version: SP40. Available online: https://gabi.sphera.com/international/databases/gabi-databases (accessed on 1 June 2021).
- Ecoinvent. Ecoinvent Database: Version: 3.7.1. Available online: https://www.ecoinvent.org/database/database.html (accessed on 1 June 2021).
- Faludi, J.; Bayley, C.; Bhogal, S.; Iribarne, M. Comparing environmental impacts of additive manufacturing vs traditional machining via life-cycle assessment. Rapid Prototyp. J. 2015, 21, 14–33. [Google Scholar] [CrossRef]
- Diaz, N.; Helu, M.; Jayanathan, S.; Chen, Y.; Horvath, A.; Dornfeld, D. Environmental analysis of milling machine tool use in various manufacturing environments. In Proceedings of the 2010 IEEE International Symposium on Sustainable Systems and Technology (ISSST 2010), Arlington, VA, USA, 17–19 May 2010; IEEE: Piscataway, NJ, USA, 2010; pp. 1–6. [Google Scholar] [CrossRef]
- Saric, T.; Simunovic, G.; Simunovic, K. Estimation of Machining Time for CNC Manufacturing Using Neural Computing. Int. J. Simul. Model. 2016, 15, 663–675. [Google Scholar] [CrossRef]


Publisher’s Note: MDPI stays neutral with regard to jurisdictional claims in published maps and institutional affiliations. |
© 2021 by the authors. Licensee MDPI, Basel, Switzerland. This article is an open access article distributed under the terms and conditions of the Creative Commons Attribution (CC BY) license (https://creativecommons.org/licenses/by/4.0/).