Article

Exploring and Predicting the Knowledge Development in the Field of Energy Storage: Evidence from the Emerging Startup Landscape

Endicott College of International Studies, Woosong University, 171 Dongdaejeon-ro, Jung-gu, Daejeon 34606, Korea
Energies 2021, 14(18), 5822; https://doi.org/10.3390/en14185822
Submission received: 22 July 2021 / Revised: 9 September 2021 / Accepted: 11 September 2021 / Published: 14 September 2021
(This article belongs to the Section D: Energy Storage and Application)

Abstract

:
The distribution and deployment of energy storage systems on a larger scale will be a key element of successfully managing the sustainable energy transition by balancing the power generation capability and load demand. In this context, it is crucial for researchers and policy makers to understand the underlying knowledge structure and key interaction dynamics that could shape the future innovation trajectory. A data-driven approach is used to analyze the evolving characteristics of knowledge dynamics from static, dynamic and future-oriented perspective. To this end, a network analysis was performed to determine the influence of individual knowledge areas. Subsequently, an interaction trend analysis based on emergence indicators was conducted to highlight the promising relations. Finally, the formation of new knowledge interactions is predicted using a link prediction technique. The findings show that ensuring the energy efficiency is a key issue that has persisted over time. In future, knowledge areas related to digital technologies are expected to gain relevance and lead the transformative change. The derived insights can assist R&D managers and policy makers to design more targeted and informed strategic initiatives to foster the adoption of energy storage solutions.

1. Introduction

With ever-increasing energy consumption and power generation from variable renewable sources, the availability of effective energy storage system plays an important role in balancing the electricity supply and demand discrepancies as well as in the process of decarbonizing the global economy [1,2]. Many experts view affordable energy storage as the missing link between intermittent renewables and power system flexibility [3,4]. A joint report by the European Patent Office (EPO) and International Energy Agency (IEA) estimated that approximately 50 times the size of the current gigawatt-hours of energy storage capacity will be expected globally by 2040 to meet the sustainable energy goals [5].
Against such a background, a high importance is attached to the development of sophisticated energy storage solutions to increase the proportion of renewable energy sources within the energy mix. Although energy storage can be achieved in a number of ways, rechargeable batteries have become one of the most important enablers of a low-carbon economy and can be deployed in a modular and distributed fashion to maximize flexibility [1,6]. In fact, batteries account for 88% of all patenting activity in the area of electricity storage between 2000 and 2018 [5]. This feature is also reflected in the recent growth in behind-the-meter energy storage applications, which are small-scale battery storage installed with rooftop solar photovoltaic (PV) devices [7]. Moreover, advanced battery technology is critical when it comes to meeting the demand for vehicle electrification and greening the transport sector, making the market for batteries a very strategic one [8,9]. For example, the European Commission has identified batteries as a strategic value chain for the future of Europe, where critical investments are needed to generate positive spill-over effects across industrial sectors and enable breakthrough innovation on next-generation battery technology [10].
In this context, the speed and scope of underlying energy storage research and development (R&D) landscape are changing at a rapid pace [11]. Especially, the sustained rise in battery-based energy storage innovation highlights the strategic imperative of building up large-scale battery development and production capacity in the global race to ensure the transition towards a climate neutral economy [12,13]. Continuous technical advances (e.g., advanced materials, battery chemistries, optimized manufacturing processes and recycling) are creating new opportunities to address practicality issues, while emerging start-ups come up with disruptive ideas, contributing to the commercialization of lab-scale technologies [14]. Hence, it is crucial for researchers and policy makers to be aware of the key knowledge relationships and dynamics of business environment that could have a positive impact on the subsequent knowledge generation and foster research into the next generations of high-performing batteries.
As patents are considered an early indicator of future technology trends, previous studies have mainly focused on the analysis of patent landscape to obtain a comprehensive view of the evolving characteristics of technological innovations and evaluate the influence of specific knowledge interactions to the subsequent technological development [15,16,17]. Stephan et al. [18] identified the importance of intersectoral knowledge flows in generating positive externalities in case of lithium-ion batteries (LIBs). Typically, a knowledge flow refers to the diffusion of knowledge from one field to another, whereby patent citation information can be used as an indicator of knowledge flow (Note: The concept of knowledge flow is discussed more in detail in Section 2.3.). Feng et al. [19] have proposed a novel framework to explore promising convergence relationships and topics in the domain of electric vehicle, highlighting the significance of battery arrangement and protection for promoting electric vehicle. Lee and Su [20] applied several patent-based combination indicators to study the innovation strategies and competitiveness of LIBs at firm-level.
Although these studies are inspiring and have provided useful insights into technology intelligence of energy storage solutions, they only considered the technical dimension of knowledge relationships to explore the potential innovation implications. The rapidly changing knowledge dynamics at market level cannot be adequately studied using patent information only, as not all inventive and commercialization activities can be captured. The existing literature did not pay sufficient attention to the role of startups and their knowledge relatedness on the subsequent development opportunities. Hence, there is a need to move beyond patent data to generate a more comprehensive picture of the R&D landscape.
In particular, data on young startups can provide a differentiated view on scouting new market trends, such as investigating the influence of digital technologies on industrial ecology [21]. The ability to identify and predict the evolving market dynamics is critical for directing future R&D efforts and designing balanced innovation and deployment policies [22]. There is a great interest in generating evidence for defining future R&D priorities and policy recommendations from capturing the potential of energy storage technologies [23].
Hence, this study aims to analyze and quantify the degree of competitive market dynamics in the field of energy storage using startup information. An exploratory approach is taken to investigate the past chronology of knowledge accumulation trajectory and highlight the impact of relevant knowledge areas. Moreover, newly emerging links between previously not associated pairs of knowledge areas are predicted to contribute to enhanced knowledge management capabilities. To this end, the link prediction based on machine learning approach is performed to generate a future-oriented view on the development of energy storage sector. The purpose of this paper is to help research scientists and policy makers design more appropriate strategic initiatives and reduce uncertainty in future knowledge exploration and market development through an increased awareness of competitive market intelligence.
The main findings of this study are listed as follows: First, this study complements other patent-based analysis of innovation in the energy storage sector based on the insights gained from the analysis of startup landscape. Second, we uncovered the emergence of newly interacting knowledge areas, with the main drivers being “renewable energy”, “electric vehicles” and “digital technologies”. Third, the proposed analysis framework provides other researchers a novel perspective to study the market signals that might promote the cross-sectoral research initiative. Furthermore, accurate monitoring of battery functional status and developing intelligent responsive battery management system are promising relations to watch out in future.
The remainder of this paper is organized as follows: Following this introduction, Section 2 outlines the data collection, analysis framework and associated empirical methods. In Section 3, we present the empirical findings by highlighting the dynamic and future-oriented perspective of knowledge interactions. Section 4 discusses the findings in comparison with previous results from other studies. Conclusions and outlook for future research and policy implications are provided in Section 5.

2. Data and Methods

2.1. Data

We extracted the relevant data from Crunchbase, which is a widely-used commercial database for finding business information about new startups and related investment operations [21]. It is viewed as the leading source of intelligence on technology-based startups and provides comprehensive insights into venture development and financing models [24]. For practitioners, Crunchbase serves as a reference point for discovering innovative ventures to invest in and connecting with like-minded individuals to achieve business goals [25]. In particular, the database offers a wide spectrum of information, including number of employees, number of funding rounds, total funding amount, estimated revenue range, founded date, categories that describe the industry sector the venture operates in and more [26]. According to Dalle et al. [27], Crunchbase has been used as a reliable data source in over 90 scientific publications, implying that many scholars have already verified its potential for advancing entrepreneurship and management research. Although Crunchbase is a community-driven platform that relies on the input of external contributors (e.g., investment firms) and users to update and maintain its database, the data quality is ensured by artificial intelligence and machine learning algorithms that validate data accuracy and inconsistency. Moreover, a manual data validation and curation process is introduced to improve data integrity. Hence, compared to other databases covering similar information, data contained in Crunchbase are characterized by an added value [28].
In the current study, we combined a keyword-based search with classification-based search query to compile a list of relevant startups. Depending on the product or service offered, a startup can be assigned multiple industry category codes. The industry category codes can be understood as a classification scheme similar to the Standard Industrial Classification (SIC) codes, which categorize companies by their business activity with varying levels of detail and specificity [21]. Consequently, we collected data on startups with industry category codes that included at least one of the following categories “Energy Storage” and “Battery”, as well as when the full description contained keywords such as battery, batteries or energy storage.
We decided to limit the scope of the analysis to the years 2010 to 2018 in order to capture the most recent developments and to include startups in their early stages. (Note: The probability of a startup to be recorded in the database is affected by multiple factors. For example, it could be dependent on the funding levels or the innovation potential. If a startup receives a large investment, it is more likely to be discovered and registered by the venture capitalist. Hence, the number of startups for the years 2019 and 2020 may vary significantly from its actual values. To avoid this bias, we decided to include only data up to 2018.) The data retrieval took place in June 2021. A total of 1910 startup companies were initially identified. After performing pre-processing step (e.g., removal of noisy data and incomplete entries), 1735 startups remained for further analysis.

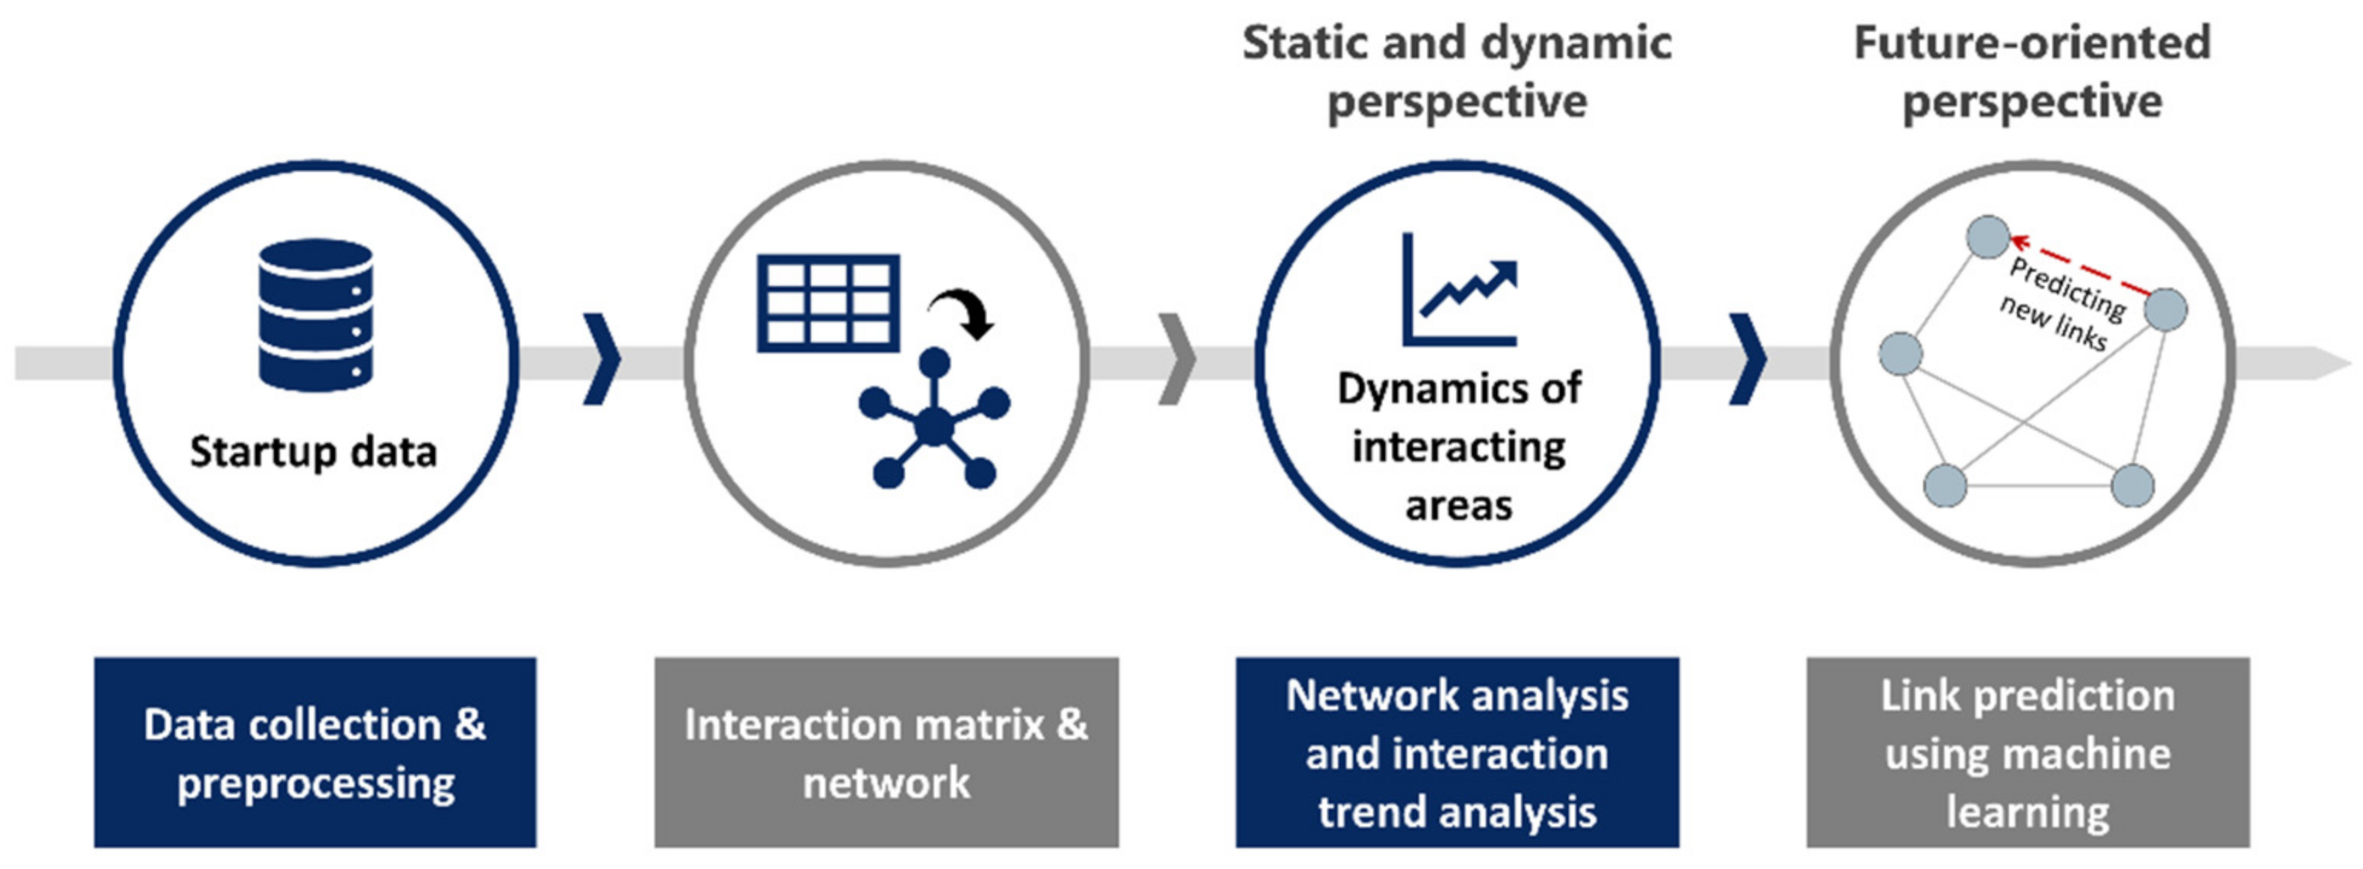
2.2. Analysis Framework

The overall analysis framework consists of the following four analysis steps (Figure 1). After an introductory overview of this framework, each methodological procedure is explained in more detail. In the first step, startup data are collected and pre-processed to facilitate the subsequent data presentations and analyses (see Section 2.1 for details). The second step involves the construction of the interaction matrix and the corresponding interaction network to visualize the interrelation among industry category codes. In the third step, network-based centrality analysis is performed to measure the coreness and betweenness of interconnections. Simultaneously, an interaction trend analysis is conducted to highlight the promising interaction relations that might drive the market development of energy storage sector. Finally, a link prediction approach is applied to anticipate the possible emergence of future knowledge links between previously not related industry category codes. In sum, this framework allows us to analyze the evolving characteristics of knowledge dynamics from static, dynamic and future-oriented perspective.

2.3. Construction of a Knowledge Interaction Matrix and Network

To investigate the competitive market dynamics in the field of energy storage, we adopted the concept of knowledge flow. In general, knowledge flows (or knowledge interactions) refer to the diffusion of technological or market knowledge among individuals participating in innovation activities [29]. They are found to have a positive effect on the subsequent knowledge discovery and expanding the interdisciplinary knowledge stock [30]. In the domain of technology management, many scholars have relied on the measurement of technological knowledge flows to examine how the technological knowledge structures are interconnected [31] and to investigate the technological impact of various technology areas on technology ecology [32]. Knowledge flows can be either directed or undirected, depending on whether the dependency between the sending and receiving party can be clearly specified or not.
Typically, knowledge flows occur in a diverse set of exchange objects, such as patent co-ownership, citation relation, strategic alliance and human interaction. Hence, a knowledge flow can be measured by a number of proxy variables. In particular, the analysis of co-occurring patent classification codes has played a central role in outlining the technological knowledge flows [33]. The patent co-classification analysis refers to the investigation of co-occurring classification codes within a data set [34]. Since each classification code represents a specialized technological knowledge area, patterns of knowledge flows can be identified when studying their interrelationships. In the presence of multiple classification codes, a dependency between these codes is assumed, resulting in a knowledge interaction (note: in the following, we use the term knowledge interaction instead of knowledge flow to denote the undirected knowledge relationship).
Accordingly, we made use of the co-classification approach to construct the knowledge interaction matrix, which is then transformed into a knowledge interaction network to help us make sense out of data. Although data derived from Crunchbase do not provide ready-to-use information on knowledge interactions, they can be generated by measuring the co-occurrence of industry category codes. As previously stated in data collection, startups are assigned with multiple industry category codes, which can be regarded as equivalent to patent classification codes for understanding the position of an organization’s technological knowledge portfolio. They are a suitable descriptor variable for describing the knowledge base in which the startup operates. Hence, each industry category code can illustrate a specialized knowledge area. For example, startup 1 operates in the field where knowledge related to “Battery”, “Energy”, “Energy Storage” and “Renewable Energy” is required. This implies that startup 1 relies on a battery-based energy storage system to enable renewable integration and create customer value. In this respect, the relation between two co-occurring industry category code can serve as a proxy for measuring the knowledge interaction. Figure 2 shows the conceptual design of illustrating how the knowledge interaction matrix is constructed and being translated into a network.
The interaction matrix is created by aggregating the number of linkages among the interacting industry codes. Herein, the frequency with which two distinct codes co-occur can be interpreted as an indication of the strength of the relationships in terms of knowledge interactions. The resulting matrix has a symmetric n × n structure, whereby n denotes the number of individual industry category codes present in the data set. The figures in the matrix cell represent the frequency of interactions.
The next step is to generate the interaction network from the matrix, where the nodes denote the industry category codes and the links indicate the intensity of the relationships. The thickness of the links is proportional to the intensity of interactions. The network visualization is crucial for a more efficient exploration of trends and calling out points of interest given the scale and complexity of data. Past studies have confirmed that network visualization can help make data more natural to the human mind to generate insights about high-dimensional data as well as graphically represent complex knowledge structures [35,36,37]. To visualize the network, we employed the open-source visualization software Gephi.

2.4. Network and Interaction Trend Analysis

Network analysis has been extensively used across a range of disciplines to study patterns of innovation diffusion, technology development, knowledge transfer and research collaborations [38,39,40,41]. It encompasses a set of techniques to study the topological properties (e.g., how the nodes and links are arranged) and relevant sub-structures within a network [42]. It also serves as a means to reveal hidden channels of information flow and can guide the strategic decision making by exploiting information opportunities [43]. In the domain of technology and innovation management, it has proven to be effective at understanding the relationships between interconnected technical domains [44] and the technology convergence relationships [45] as well as determining the impact of industry sectors within the business ecosystem [36].
In general, a network consists of a set of nodes and a set of links (or edges) that connect those nodes. Networks can be analyzed in several different ways. For example, the measurement of shortest path allows us to analyze the information spreading performance [46] and evaluate the mechanism of interdisciplinary knowledge flow [47]. Centrality analysis is used to estimate the influence of nodes or links on the connectivity of the network. There are several statistically based measurements of node centralities, whereby each measure has its own definition of importance. For example, the degree centrality is the most basic centrality measure, which simply assigns an importance score based on the number of direct links upon a node and portrays a local measure of node importance.
In this study, various centrality-based network metrics are calculated to rank the relative importance of individual nodes and examine their roles in knowledge exchange. Based on these, we can identify which knowledge area has a central or mediating role within the network. To this end, we considered the following two centrality measures: betweenness centrality and eigenvector centrality.
Betweenness centrality is a metric based on the measurement of indirect connectedness using geodesic paths. It is calculated by the number of times a node lies on the shortest path between two other nodes and reflect a node’s capacity to broker or control information flow [48]. Thus, a node with high betweenness centrality score can play a brokerage role. Following equation can be used to calculate the betweenness centrality of a node CB(i), where σst(i) is the number of shortest paths between a pair of nodes j and k that pass through i and σst represents the total number of shortest paths between j and k [49].
C B i = σ s t i σ s t
Eigenvector centrality measures the degree to which a node is connected to other central nodes in the network, thereby reflecting the global importance of a node. It captures a node’s influence while considering the importance of its neighboring nodes. A node with high eigenvector centrality score is well-connected to other nodes with a high number of links, thus capable of exerting influence over the whole network, not just on those directly connected to it [50]. Following equation can be used to calculate the eigenvector centrality of a node CE(i), where Aij represents the network’s adjacency matrix, N the total number of nodes in the network, xj the relative centrality score of nodes connected to i and λ is the eigenvalue [49]:
C E i = 1 λ j = 1 N A i j x j
The subsequent analysis step is concerned with the study of knowledge interactions (e.g., links) over time. While the previous calculations were focused on describing node properties, it is also crucial to pay attention to continuously evolving and relevance-increasing interaction pairs of knowledge areas. The generated network is of static nature and is suitable for capturing the importance of nodes for the entire analysis period. In this static perspective, a network might contain several links that are not more present or relevant at the most recent time point of analysis. However, if the network evolves over time, it is important to keep in mind that certain links may be transient, as interactions between nodes could change constantly with the insertion and deletion of links. This process can have an impact on the final network structure and its topological properties. Hence, by adopting a dynamic perspective, we can uncover patterns that would otherwise remain hidden when using a static approach. Here, the specific focus lies on detecting the evolutionary trend of promising knowledge interactions. Therefore, the interval-specific knowledge interaction matrices were created to track the variation in interaction rate over different time intervals. To highlight the promising knowledge interactions, we modified and operationalized the initial criteria proposed by Rotolo et al. [51]. Consequently, the following selection criteria have been applied: growth, persistence and novelty. We extracted promising relations that show high growth along with evidence of persistence and novelty.
Growth is a metric that tracks the changes in interaction rate between two interacting knowledge areas over the examined intervals. It analyzes whether a specific interaction has grown in prominence over the course of analysis period. If the sum of all proportional interaction rate differences between the periods j and j − 1 (j = 2011, 2012 … 2018) is positive, the corresponding knowledge interaction is taken as a candidate for a promising relation.
Persistence is a metric that records whether a specific knowledge interaction has persisted over the years. It requires a threshold-value to be set, which helps distinguish interacting knowledge areas that are still in demand from those that appear inconsistently throughout analysis period [52]. The threshold-value in this study is 6, implying that the interaction must have occurred within the last 6 consecutive years of the analysis period. For example, if the final year of the analysis period is 2018, the interaction must have continuously occurred between 2013 and 2018.
Novelty is a metric that gives more impact to abruptly increased interactions in recent years. It emphasizes the identification of disruptive change patterns and reflects the perception that knowledge interactions with a high potential for future relevance do not tend to appear frequently in the early stage of the entire analysis time frame. It also requires a threshold-value to be set. The threshold-value in this study is 20, implying that at least 20% of a specific interaction must have occurred in the most recent year of analysis time frame.
In sum, promising knowledge interactions can be interpreted as fast-growing and novel pairs of industry categories characterized by a certain degree of persistence over time and with the potential to exert a considerable impact on the development of startup landscape.

2.5. Link Prediction

With an increasing amount of available network-structured data across numerous scientific disciplines, the study of complex networks and their prediction has drawn considerable attention in recent years [53,54]. Link prediction is a technique for determining the probability of the existence of a link between two nodes based on observable links and node properties [55]. It deals with a “missing data” problem, where the main objective is to infer which non-existing links among nodes may appear in the future given a snapshot of the existing network structure [56]. Link prediction can provide meaningful results in developing intelligent decision support solutions, as the mining of information in networks can discover previously unknown user behaviors or technology development paths [57,58].
The link prediction problem can be formulated as follows: Given an undirected network G = (N, E), where N is the set of nodes and E is the set of links, a network within a certain interval t can be characterized as Gt = (Nt, Et) [59]. In this context, Nt varies depending on the embedded environment and external influences. Subsequently, the problem is to estimate the probability of potential links in Et+1 originating from Nt. In line with previous studies, we treated link prediction as a binary classification problem using a supervised machine learning algorithm [59,60], whereby the emergence of a new link is coded with a positive class label (1 for existence) and missing links are coded with a negative class label (0 for non-existence).
The predictive model is constructed by: (1) splitting the data into training and validation sets, (2) data standardization, (3) choosing an appropriate classifier algorithm, (4) applying the algorithm on the training set and testing it on the validation set, and (5) evaluating the reliability of the results [60]. To select the optimal machine learning algorithm, we tested and compared several different classification algorithms, including support vector machine (SVM), decision tree, adaptive boosting, random forest, extra-trees, gradient boosting, multilayer perceptron (MLP), k-nearest neighbors, logistic regression, gaussian naïve bayes, eXtreme gradient boosting (XGB) and light gradient boosting machine (LGBM) (note: a comparison of model performance can be found in Appendix A). A 10-fold cross validation test with stratified sampling was performed to ensure the reliability [59,60]. The performance of each model was evaluated using accuracy, precision, recall and f1-score. In this study, we opted for reducing the false positive predictions, as high false positive predictions might lead to more biased insights. Hence, the parameters for the chosen model were optimized to improve the precision score. MLP classifier was found as a suitable algorithm for the predictions.
In terms of generating predictor variables, network similarity-based metrics are calculated, which are generally used in link prediction studies. These similarity-based metrics compute a score for a pair of nodes, whereby the derived score is representative of proximity between those nodes based on the graph topology [61]. To minimize information loss, we chose to combine the following global and local predictors, namely the Jaccard Coefficient, Common Neighbors, Rooted PageRank, Adamic Adar, Preferential Attachment, SimRank, Katz, and Resource Allocation as input variables for the classifier. A detailed discussion on the definitions and properties of these metrics can be found in following studies [55,56,61]. Sampled at random, 70% of the input data were used to train the chosen classifier, whereas the evaluation was performed with remaining 30%.
To this end, the data were grouped into three equally-spaced time intervals (2010–2012; 2013–2015; 2016–2018). The proposed approach aims at predicting changes in the network interaction dynamics for an upcoming interval, which would span from 2019 to 2021. For each interval, we extracted all possible links for the nodes within the subnetwork and calculated the predictors for each possible link. The analytical procedures were coded in Python 3.7. The predictors were calculated with networkx and the linkpred library in Python.

3. Results

3.1. Descriptive Statistics

This section provides a brief overview of summary information on selected variables to describe the basic features of data and assist us in better understanding the startup landscape. In particular, we focused on presenting the annual number of new startups founded, the geographic distribution of startups and the distribution of the most frequently occurring industry category codes. Figure 3 shows the number of newly founded startups over the last 20 years.
Overall, their number has increased with a fluctuating trend till 2014. However, from 2015 onwards, it has fallen steadily. The downward trend has become more pronounced in recent years. As already stated, this phenomenon is related to the probability of a startup being recognized and recorded in a database. There is a certain lagged effect, which implies that not all new ventures are immediately captured by the underlying entrepreneurial ecosystem upon establishment. Hence, the number represented for the years 2019 and 2020 may not represent the reality and should not necessarily be equated with rapidly declining entrepreneurial activities. Nevertheless, the decreasing number of startups might hint at a stagnating growth of entrepreneurial culture in the field of energy storage, which in turn is related to the high upfront capital requirements and high technology risk [62]. For further analyses, we decided to only include startups founded between 2010 and 2018 in order to create a more reliable picture and to take into account the latest developments.
Figure 4 shows the geographical distribution of startups on a national basis, whereby the intensity of the color scale is proportional to the number of startups. Our analysis revealed a great geographical variation in the absolute number of startup foundations. It stands out directly that the majority of startups originated from USA, followed by United Kingdom, Canada, India and China. USA is home to several innovative startups that deal with the development of next-generation battery technologies. For example, prominent automotive original equipment manufacturers (OEMs) made significant investments (e.g., Ford in Solid Power; Volkswagen in QuantumScape; Daimler in Sila Nanotechnologies) to speed up the development of fast-charging batteries with longevity [63]. Contrary to expectations, except for China, the number of startups emanating from Japan and South Korea (which play a leading role in battery R&D and manufacturing) is not significant. This could be due to the fact that they have a well-established value chain of battery manufacturing, making it more difficult for startups to address pain points with appropriate specificity in a commoditized, high volume battery business [62]. Moreover, recent improvements in battery capacity have largely been the result of incremental changes implemented by large corporations.
Figure 5 shows the top 20 most frequently occurring industry category codes within the energy storage sector. In total, there are 386 different industry category codes that have some relevance for characterizing the knowledge areas involved in the energy storage business. Because the vast majority of analyzed startups is labeled by more than one code, the sum of its frequencies is greater than the number of identified startups. Hence, the energy storage industry is a very diverse one, with startups relying on interdisciplinary approaches.
The first five most common codes are “Energy”, “Manufacturing”, “Battery”, “Energy Storage” and “Renewable Energy”. Since the data set is generated based on the “Energy Storage” and “Battery”, the corresponding industry category codes are well represented across the data. The observed industry category codes can roughly be categorized into four parts: (1) areas related to sustainable energy and its storage, (2) areas related to the manufacturing of energy storage solutions, (3) areas related to transportation and (4) areas related to digital technologies. This finding suggests that the majority of startups are dealing with the energy storage of renewable energies (especially “Solar” energy), whereby the vehicle electrification also plays a key role in terms of practical applications. The relatively high presence of “Manufacturing” and “Electronics” might point to the need of closing a gap between lab-scale technology and technology compatible with benchmark values. Moreover, the integration of modern digital technologies, such as “Mobile” and “Internet of Things”, had a notable influence on the emergence and development of efficient energy management systems, which is necessary to optimize the load demand variations [64].

3.2. Network Analysis

In this subsection, the network centrality analysis has been applied to determine the impact of distinct knowledge areas within the network. Figure 6 outlines the complete interaction network, which provides a static snapshot of connected knowledge areas over the entire analysis period. However, due to the high complexity of network topologies, intuitive insights are difficult to obtain. To overcome this issue, we highlighted the top 5% of most frequent interactions on the right side of Figure 6. These are focal interactions that deserve further attention. The interaction network was visualized with the Fruchterman-Reingold layout, which is a force-directed algorithm and positions the more strongly connected sets of nodes in closer proximity [65]. The node’s color scale indicates the magnitude of node degree. The darker the color, the higher the number of links connected to the node.
The depicted network consists of 386 nodes and 3959 links. The average degree, which is the average number of links per node in the network, equals 20.513. As a result, we may state that there are lots of well-connected nodes in the network graph. Table 1 summarizes the top 20 frequently interacting pairs of knowledge areas that involve either “Battery” or “Energy Storage” to focus the discussion and to study about the knowledge relations around the energy storage.
The values in Table 1 are derived from the interaction network through quantification and can highlight whether the knowledge areas under consideration show exceptional patterns of boundary-spanning activities. The relative frequency indicates the normalized amount of interaction dynamics. According to Table 1, “Battery” has the highest interaction with “Manufacturing”, followed by “Energy” and “Energy Storage”. Because these knowledge areas have a significant degree of thematic similarity, these interactions were quite predictable. In addition, the knowledge areas pertaining to automotive applications are strongly represented. In terms of practical applications, they are leading the entrepreneurial efforts. The future uptake of electric vehicles might trigger change in competitiveness over time, provoking competition to drive down cost benchmarks [66]. Since startups are less tied to existing production techniques, they might help integrate new cost-effective materials into battery market. Moreover, energy management, which deals with the goal of optimizing efficient energy use, has shown a good connectivity to “Battery”. This is in line with the recent observation that the preferred technology focus of energy startups lies on “Energy Management”, and they enjoy a high digital-technology penetration [67].
A similar pattern was observed in case of interactions involving “Energy Storage”. The five most frequently interacting knowledge areas are “Energy”, “Renewable Energy”, “Battery”, “Energy Management” and “Solar”. As “Energy Storage” is a broader concept than “Battery”, knowledge interactions related to sustainable energy operations are more pronounced. Interestingly, “Internet of Things”, which refers to digitally connected physical objects to improve the timely planning, control and coordination of the supply chain processes [68], is leading over the other frontrunner digital technologies, such as artificial intelligence or blockchain. In practice, Internet of Things-technology (IoT-technology) can be used to facilitate optimal scheduling of energy storages and power trading with wholesale markets [69]. The importance of automotive applications was also evident. The findings so far suggest that the analysis of interacting knowledge areas supports our basic theoretical perspective on knowledge diffusion and is a useful approach for understanding the interdisciplinary nature of knowledge structure.
Table 2 summarizes the calculated betweenness and eigenvector centrality values, which are used to determine the influence of individual nodes. Herein, only the top 20 highest centrality values are listed. Overall, the centrality analysis helps generates a differentiated view on the topological features of a network.
It is worth mentioning that both centrality metrics show a strong correlation (r = 0.7577, p-value < 0.001) to each other. Hence, coreness (which describes the impact of a knowledge area on others in a network) and intermediary capability could be jointly considered using a single metric [70]. The measurements suggest that “Software” has the highest betweenness and eigenvector centrality value. Hence, it plays the strongest brokerage role among all knowledge areas, thereby controlling the global knowledge interaction dynamics. Simultaneously, “Software” represents a very prominent node that has both direct and indirect influence over all other knowledge areas within the network. The second highest centrality value was assigned to “Manufacturing”. This indicates that the majority of start-ups are dealing with hardware innovation. In contrast, both “Energy” and “Information Technology” have a comparably low betweenness centrality score despite having a high eigenvector centrality score. This implies that these knowledge areas have a less intermediary capability to promote knowledge interactions within the whole network. In line with the previous observations, knowledge areas related to electric mobility appear to exert a significant influence on the knowledge structure of energy storage sector. Moreover, the high proportion of advanced digital solutions, such as “Internet of Things”, “Artificial Intelligence” and “Big Data”, underline the importance of embracing digital transformation to derive novel insights at a scale that no human or traditional computing methods could possibly achieve. These knowledge areas mainly help achieve energy efficiency by optimal resource utilization and demand forecasting.

3.3. Interaction Trend Analysis

Although the previous analysis step was critical to figure out the relevance of individual knowledge areas, it only provided a static representation of the underlying knowledge network. A static view does not reflect the changing rates of interactions over time and limits its adequacy in explaining the evolutionary significance. To offer a dynamic perspective on the knowledge accumulation trajectory, we performed an interaction trend analysis. In this way, we can emphasize the promising interactions that have gained more relevance and could possibly attract more attention in near future. Table 3 summarizes the main findings of interaction trend analysis. Here, only the top 20 promising interactions are outlined.
Growth is a metric that quantifies the positive changes in interaction rate over the entire analysis period. Persistence and novelty are used as an information filter to further distinguish the promising signals. Persistence was evaluated as being present, if the considered interaction had persisted over the last 6 consecutive years. Accordingly, the interaction between “Energy” and “Renewable Energy” showed the highest growth, followed by the interaction pairs “Energy Efficiency—Renewable Energy” and “Energy—Energy Efficiency”. Overall, the need to accelerate the low-carbon transitions seems to be the primary driver behind this finding. Especially, the interaction between “Energy Efficiency” and “Renewable Energy” demonstrated a novelty score of 42.5365. This means that about 42% of all interactions would alone fall in year 2018, highlighting its recency. The growing relevance of “Clean Energy” also points out that the focus of startups clearly lies on promoting the sustainable energy transition pathway. Moreover, knowledge areas related to “Energy Management” and “Energy Efficiency” showed a promising growth potential for the future. In this context, we also observed the importance of “Software”, “Machine Learning” and “Internet of Things”, as these digital tools are a prerequisite for successfully addressing energy efficiency challenges [71]. As the current industrial environment encourages the generation of large amounts of data, the need for implementing an intelligent energy management system based on these digital tools will intensify [72].

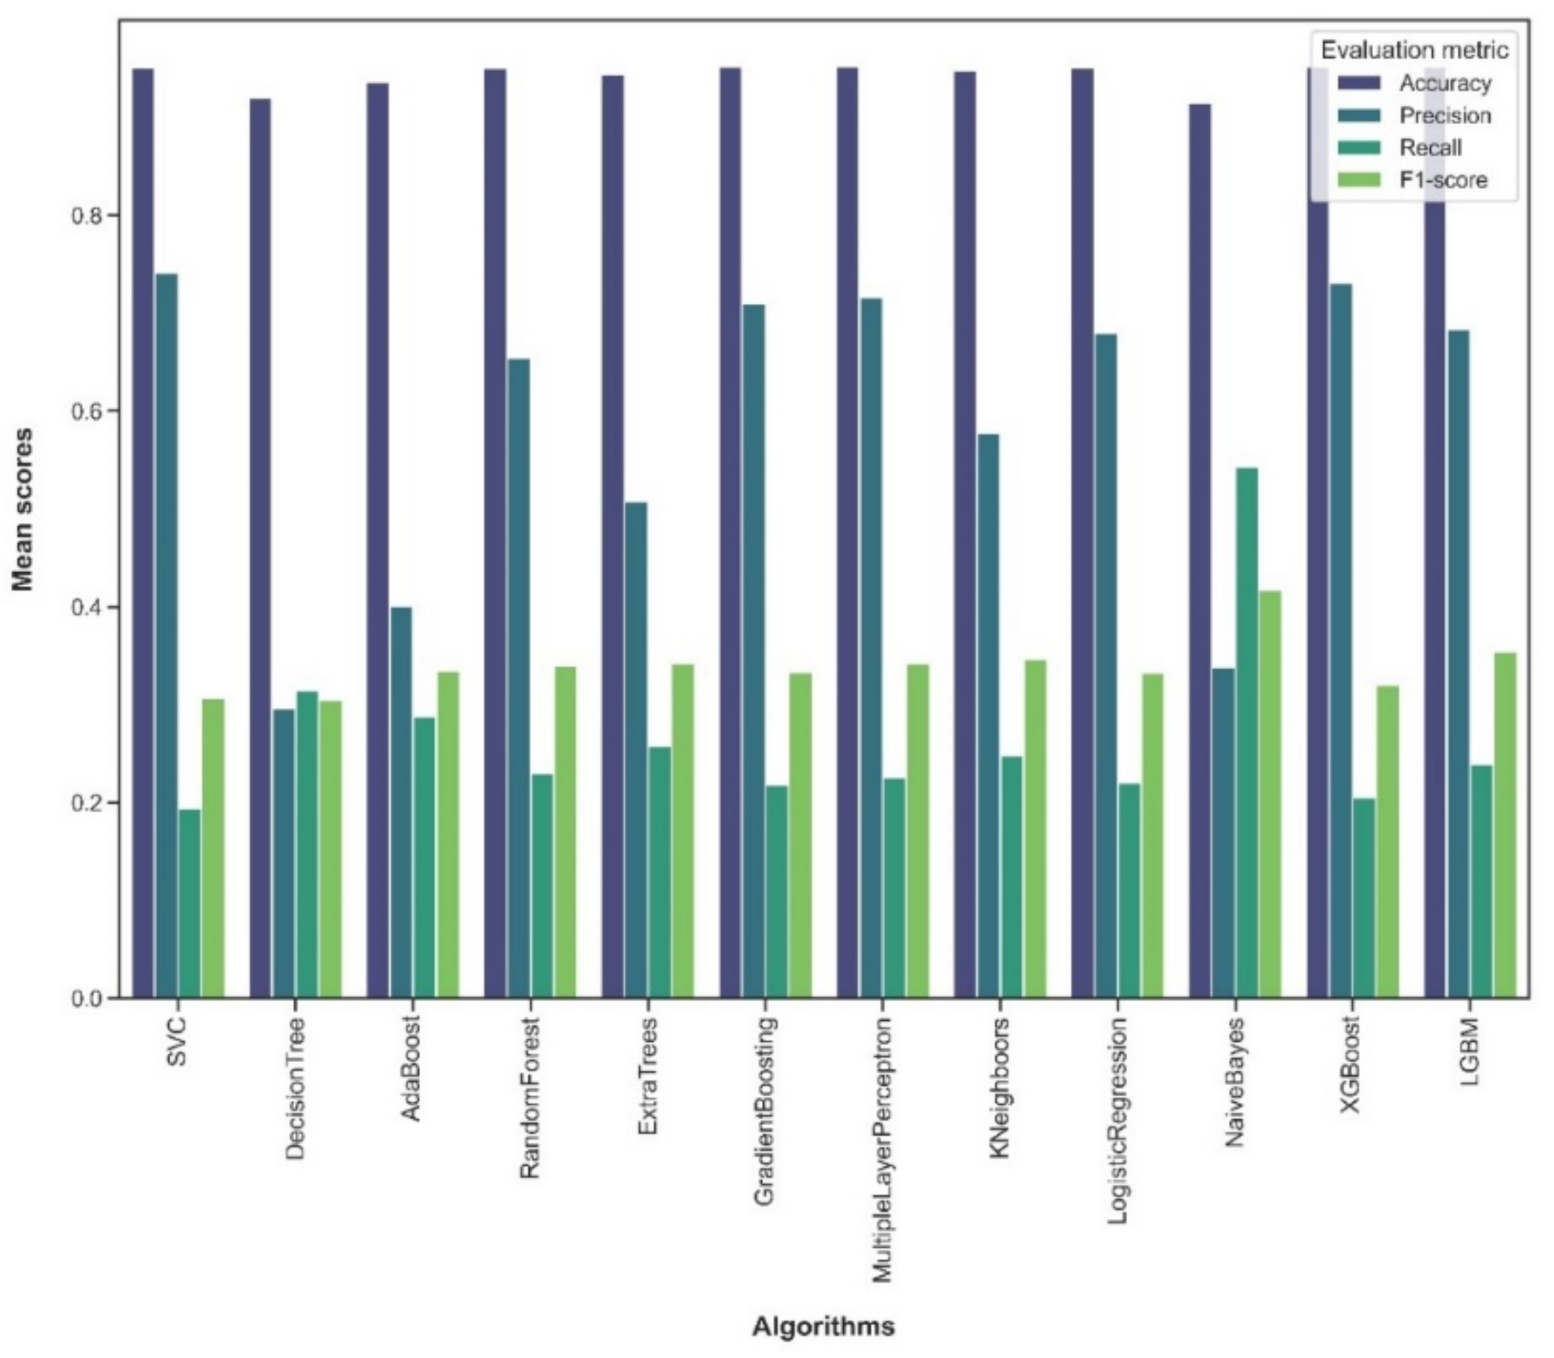
3.4. Link Prediction Analysis

In this subsection, a predictive analysis is performed to reveal newly emerging links that were not observed in the depicted knowledge interaction network. This allows the development of a future-oriented perspective with the aim of anticipating future links for evolving networks. To this end, the data were grouped into three equally-spaced time intervals (2010–2012; 2013–2015; 2016–2018). For each interval, we extracted all possible links for the network’s nodes and calculated the predictors for them. The proposed approach aims at predicting changes in the network interaction dynamics for an upcoming interval, which would span from 2019 to 2021. An MLP classifier was used for predictive analytics, because it showed a better overall performance compared to other classifiers tested during the experiment. The trained classifier produced an accuracy of 95.19%, a precision of 71.63%, a recall of 22.56% and a f1-score of 34.17%, demonstrating a reasonable predictive strength. Figure 7 highlights the newly emerging links for the upcoming interval (2019–2021), whereby the green links indicate the emerging interactions.
Overall, we could predict 36 new interacting pairs between previously disconnected knowledge areas. The predicted interactions are ones that could play a more significant role in future knowledge development within the startup landscape. Upon inspecting these interactions, we could classify them into five thematically related categories. These are: (1) energy storage, (2) digital technologies, (3) energy management, (4) transportation & consumer electronics, and (5) miscellaneous. Table 4 summarizes the interactions into respective groups.
Interestingly, most of the newly emerging interactions come from the adoption of digital technologies. Especially, the “Big Data” and “Machine Learning” would gain relevance in the grid optimization and renewable energy interaction [73]. The anticipated interaction of “Battery” with “Smart Cities” and “Smart Home” underpins the importance of decentralized urban energy system to improve energy security [74]. The proliferation of intelligent measurement devices can intensify the smart grid integration and enhance the customer experience, giving them greater insights into energy use and billing information. In case of “Automotive”, it is predicted to interact with “Solar” and “Sharing Economy”. The possibility of charging battery electric vehicles using solar energy has been already discussed in the academic setting and could provide a sustainable way to cope with the increase in the power demand of EV [75]. In fact, sharing economy can drive new business model innovation to increase the profitability of energy storage system operations [76]. In addition,” Environmental Engineering” and “Environmental Consulting”, which provide professional services to solve problems related to environmental management (e.g., environmental impact assessment), would newly emerge as a promising interaction within the field of energy storage to legitimate government efforts to implement environmental policies [77].

4. Discussion

The energy storage market is expected to experience a considerable growth in the coming years due to the decarbonization strategy of local energy mix [78]. The convergence of multiple factors, such as vehicle electrification, decreasing battery manufacturing costs and increased penetration of renewable energy, has inspired a surge in research and market deployments of energy storage across diverse industry sectors [79,80].
For supporting technology management and policy planning, it is vital to understand how the underlying knowledge structure has evolved over time. There is a considerable interest in tapping the knowledge on the status and prospects of developmental progress in the energy storage sector beyond the mere technical aspects. It is equally important to explore and analyze how the knowledge areas at market level are intertwined, since this might shape the future knowledge interaction pattern and translate to further market innovation. However, past studies have mainly focused on the emergence of new technologies or knowledge flows based on the science and technology studies.
Using several indicators, this study relied on the analysis of startup data to characterize the knowledge interaction dynamics and to emphasize the emerging knowledge interactions capable of triggering new domain of application. The results of this study promise valuable intelligence to assist the determination of R&D priorities and policy recommendations and led to the following key findings:
(1)
In terms of static view, the knowledge areas related to the digital technologies such as “Software”, “Internet of Things”, “Artificial Intelligence” and “Big Data” play a significant role in the commercialization of energy storage solutions. They are deeply involved in controlling the overall information flow and hold the key positions for the subsequent knowledge development. This complements the findings from the analysis of patent landscape, which focused only on the characterization of the technical and material aspects of battery components [17,21]. The accelerated adoption of digital transformation can help R&D managers simulate the properties and behaviors of both materials’ development and energy demand, outperforming human expertise in interpretation and characterization of the data. Hence, this static perspective provides a compact overview of how the essential knowledge are linked to each other.
(2)
In terms of dynamic view, this study proposed three metrics (growth, persistence and novelty) to track the promising knowledge interactions that are expected to gain more significance in the energy storage domain. By monitoring these relations, R&D managers can avoid potential technological surprises and better prepare for the formulation of policies directed towards supporting the green growth. Especially, ensuring energy efficiency when integrating renewable energy sources seems to be a crucial issue that has serious implications for the deployment of energy storage devices [81]. The quantified metrics represent a viable emergence indicator that offers an alternative approach to estimate the trends of knowledge diffusion at market level [21].
(3)
In terms of future-oriented view, the energy storage sector needs to leverage digital capabilities with domain-specific technology insights to optimize the deployment and maintenance of smart monitoring infrastructure. While previous studies of knowledge flows were mainly conducted in a retrospective and descriptive manner, this study provides a practical means to separate future signals from ongoing market transactions [16]. The results can assist practitioners to make more informed decisions, allowing them to proactively engage in dialogue with value chain partners. Hence, a cross-sectoral learning is recommended to reach consensus and to achieve shared vision for the promotion of energy storage.
In sum, the proposed analysis framework can broaden the existing toolbox of analyzing the competitive market dynamics and help reduce the uncertainty in future market development projections by overcoming the limitations of using only patent-based indicators.

5. Conclusions

By adopting a data-driven approach, this study provides a comprehensive investigation of knowledge interaction dynamics outlined by the emerging startups. To the best of our knowledge, this is one of the first of its kind to report on the progress of energy storage through the analysis of startup landscape. We hope that this study can enrich opportunities to more reliably identify emerging topics that are of interest to R&D managers and funding bodies. The quantifiable indicators can further enrich policy perspectives and serve diverse technology management and innovation policy purposes.
Despite its contributions, this study is subject to some limitations, offering suggestions for future research. To obtain a more accurate picture of knowledge dynamics, it is necessary to integrate additional data sources, as the perspectives of incumbents are missing. Hence, the coupling of multiple data sources could increase the validity of research findings. Moreover, the studied knowledge dynamics do not explain the cause-effect relationships. Hence, it might be useful to qualitatively investigate the driving forces behind the occurrence of specific interaction dynamics. Lastly, the level of detail in describing the industry category codes is rather weak compared to the patent classification codes. To achieve the desired granularity of results, text mining techniques could be used to generate additional tags that can complement the depth of industry category codes.

Funding

This research is supported by Woosong University Academic Research in 2021.

Institutional Review Board Statement

Not applicable.

Informed Consent Statement

Not applicable.

Data Availability Statement

Restrictions apply to the availability of these data. Data were obtained from Crunchbase Pro and are available from the authors with the permission of Crunchbase, Inc.

Acknowledgments

This research is supported by Woosong University Academic Research in 2021. The author would like to thank the anonymous reviewers and the editors for their insightful comments and feedback on this research.

Conflicts of Interest

The authors declare no conflict of interest. The funders had no role in the design of the study; in the collection, analyses, or interpretation of data; in the writing of the manuscript, or in the decision to publish the results.

Appendix A

Figure A1. Comparison of model performance for different classifier models.
Energies 14 05822 g0a1

References

  1. Comello, S.; Reichelstein, S. The emergence of cost effective battery storage. Nat. Commun. 2019, 10, 2038. [Google Scholar] [CrossRef] [Green Version]
  2. Gielen, D.; Boshell, F.; Saygin, D.; Bazilian, M.D.; Wagner, N.; Gorini, R. The role of renewable energy in the global energy transformation. Energy Strategy Rev. 2019, 24, 38–50. [Google Scholar] [CrossRef]
  3. Rawa, M.; Abusorrah, A.; Al-Turki, Y.; Mekhilef, S.; Mostafa, M.H.; Ali, Z.M.; Aleem, S.H.E.A. Optimal Allocation and Economic Analysis of Battery Energy Storage Systems: Self-Consumption Rate and Hosting Capacity Enhancement for Microgrids with High Renewable Penetration. Sustainability 2020, 12, 10144. [Google Scholar] [CrossRef]
  4. Lund, P.D. Improving the Economics of Battery Storage. Joule 2020, 4, 2543–2545. [Google Scholar] [CrossRef]
  5. IEA. Innovation in Batteries and Electricity Storage; IEA: Paris, France, 2020. [Google Scholar]
  6. Salim, H.K.; Stewart, R.A.; Sahin, O.; Dudley, M. Drivers, barriers and enablers to end-of-life management of solar photovoltaic and battery energy storage systems: A systematic literature review. J. Clean. Prod. 2019, 211, 537–554. [Google Scholar] [CrossRef]
  7. Hesse, H.; Martins, R.; Musilek, P.; Naumann, M.; Truong, C.; Jossen, A. Economic Optimization of Component Sizing for Residential Battery Storage Systems. Energies 2017, 10, 835. [Google Scholar] [CrossRef]
  8. Crabtree, G. The coming electric vehicle transformation. Science 2019, 366, 422–424. [Google Scholar] [CrossRef] [PubMed] [Green Version]
  9. Sun, Y.-K. Promising All-Solid-State Batteries for Future Electric Vehicles. ACS Energy Lett. 2020, 5, 3221–3223. [Google Scholar] [CrossRef]
  10. Beuse, M.; Schmidt, T.S.; Wood, V. A “technology-smart” battery policy strategy for Europe. Science 2018, 361, 1075–1077. [Google Scholar] [CrossRef]
  11. Baumann, M.; Domnik, T.; Haase, M.; Wulf, C.; Emmerich, P.; Rösch, C.; Zapp, P.; Naegler, T.; Weil, M. Comparative patent analysis for the identification of global research trends for the case of battery storage, hydrogen and bioenergy. Technol. Forecast. Soc. Chang. 2021, 165, 120505. [Google Scholar] [CrossRef]
  12. Aaldering, L.J.; Leker, J.; Song, C.H. Analysis of technological knowledge stock and prediction of its future development potential: The case of lithium-ion batteries. J. Clean. Prod. 2019, 223, 301–311. [Google Scholar] [CrossRef]
  13. Duffner, F.; Kronemeyer, N.; Tübke, J.; Leker, J.; Winter, M.; Schmuch, R. Post-lithium-ion battery cell production and its compatibility with lithium-ion cell production infrastructure. Nat. Energy 2021, 6, 123–134. [Google Scholar] [CrossRef]
  14. Armand, M.; Axmann, P.; Bresser, D.; Copley, M.; Edström, K.; Ekberg, C.; Guyomard, D.; Lestriez, B.; Novák, P.; Petranikova, M.; et al. Lithium-ion batteries—Current state of the art and anticipated developments. J. Power Sources 2020, 479, 228708. [Google Scholar] [CrossRef]
  15. Shubbak, M.H. Advances in solar photovoltaics: Technology review and patent trends. Renew. Sustain. Energy Rev. 2019, 115, 109383. [Google Scholar] [CrossRef]
  16. Mejia, C.; Kajikawa, Y. Emerging topics in energy storage based on a large-scale analysis of academic articles and patents. Appl. Energy 2020, 263, 114625. [Google Scholar] [CrossRef]
  17. Mueller, S.C.; Sandner, P.G.; Welpe, I.M. Monitoring innovation in electrochemical energy storage technologies: A patent-based approach. Appl. Energy 2015, 137, 537–544. [Google Scholar] [CrossRef] [Green Version]
  18. Stephan, A.; Bening, C.R.; Schmidt, T.S.; Schwarz, M.; Hoffmann, V.H. The role of inter-sectoral knowledge spillovers in technological innovations: The case of lithium-ion batteries. Technol. Forecast. Soc. Chang. 2019, 148, 119718. [Google Scholar] [CrossRef]
  19. Feng, S.; An, H.; Li, H.; Qi, Y.; Wang, Z.; Guan, Q.; Li, Y.; Qi, Y. The technology convergence of electric vehicles: Exploring promising and potential technology convergence relationships and topics. J. Clean. Prod. 2020, 260, 120992. [Google Scholar] [CrossRef]
  20. Lee, M.-T.; Su, W.-N. Search for the Developing Trends by Patent Analysis: A Case Study of Lithium-Ion Battery Electrolytes. Appl. Sci. 2020, 10, 952. [Google Scholar] [CrossRef] [Green Version]
  21. Aaldering, L.J.; Song, C.H. Of leaders and laggards—Towards digitalization of the process industries. Technovation 2021, 105, 102211. [Google Scholar] [CrossRef]
  22. Cassetta, E.; Marra, A.; Pozzi, C.; Antonelli, P. Emerging technological trajectories and new mobility solutions. A large-scale investigation on transport-related innovative start-ups and implications for policy. Transp. Res. Part A Policy Pract. 2017, 106, 1–11. [Google Scholar] [CrossRef]
  23. Zame, K.K.; Brehm, C.A.; Nitica, A.T.; Richard, C.L.; Schweitzer III, G.D. Smart grid and energy storage: Policy recommendations. Renew. Sustain. Energy Rev. 2018, 82, 1646–1654. [Google Scholar] [CrossRef]
  24. Marra, A.; Antonelli, P.; Pozzi, C. Emerging green-tech specializations and clusters—A network analysis on technological innovation at the metropolitan level. Renew. Sustain. Energy Rev. 2017, 67, 1037–1046. [Google Scholar] [CrossRef]
  25. Breschi, S.; Lassébie, J.; Menon, C. A Portrait of Innovative Start-Ups Across Countries; OECD Publishing: Paris, France, 2018. [Google Scholar]
  26. Żbikowski, K.; Antosiuk, P. A machine learning, bias-free approach for predicting business success using Crunchbase data. Inf. Process. Manag. 2021, 58, 102555. [Google Scholar] [CrossRef]
  27. Dalle, J.-M.; Den Besten, M.; Menon, C. Using Crunchbase for Economic and Managerial Research; OECD Science, Technology and Industry Working Papers; OECD Publishing: Paris, France, 2017. [Google Scholar]
  28. Marra, A.; Carlei, V.; Baldassari, C. Exploring networks of proximity for partner selection, firms’ collaboration and knowledge exchange. The case of clean-tech industry. Bus. Strategy Environ. 2020, 29, 1034–1044. [Google Scholar] [CrossRef]
  29. Gupta, A.K.; Govindarajan, V. Knowledge Flows and the Structure of Control Within Multinational Corporations. Acad. Manag. Rev. 1991, 16, 768–792. [Google Scholar] [CrossRef]
  30. Caloghirou, Y.; Giotopoulos, I.; Korra, E.; Tsakanikas, A. How do employee training and knowledge stocks affect product innovation? Econ. Innov. New Technol. 2018, 27, 343–360. [Google Scholar] [CrossRef]
  31. Song, C.H.; Elvers, D.; Leker, J. Anticipation of converging technology areas—A refined approach for the identification of attractive fields of innovation. Technol. Forecast. Soc. Chang. 2017, 116, 98–115. [Google Scholar] [CrossRef]
  32. Ko, S.-S.; Ko, N.; Kim, D.; Park, H.; Yoon, J. Analyzing technology impact networks for R&D planning using patents: Combined application of network approaches. Scientometrics 2014, 101, 917–936. [Google Scholar] [CrossRef]
  33. Lim, H.; Park, Y. Identification of technological knowledge intermediaries. Scientometrics 2010, 84, 543–561. [Google Scholar] [CrossRef]
  34. Mun, C.; Yoon, S.; Park, H. Structural decomposition of technological domain using patent co-classification and classification hierarchy. Scientometrics 2019, 121, 633–652. [Google Scholar] [CrossRef]
  35. Aaldering, L.J.; Leker, J.; Song, C.H. Uncovering the dynamics of market convergence through M&A. Technol. Forecast. Soc. Chang. 2019, 138, 95–114. [Google Scholar] [CrossRef]
  36. Aaldering, L.J.; Leker, J.; Song, C.H. Analyzing the impact of industry sectors on the composition of business ecosystem: A combined approach using ARM and DEMATEL. Expert Syst. Appl. 2018, 100, 17–29. [Google Scholar] [CrossRef]
  37. Basole, R.C.; Park, H.; Chao, R.O. Visual Analysis of Venture Similarity in Entrepreneurial Ecosystems. IEEE Trans. Eng. Manag. 2019, 66, 568–582. [Google Scholar] [CrossRef]
  38. Turkina, E.; Oreshkin, B. The Impact of Co-Inventor Networks on Smart Cleantech Innovation: The Case of Montreal Agglomeration. Sustainability 2021, 13, 7270. [Google Scholar] [CrossRef]
  39. Cho, I.; Park, J.; Heo, E. Measuring Knowledge Diffusion in Water Resources Research and Development: The Case of Korea. Sustainability 2018, 10, 2944. [Google Scholar] [CrossRef] [Green Version]
  40. Tang, Y.; Lou, X.; Chen, Z.; Zhang, C. A Study on Dynamic Patterns of Technology Convergence with IPC Co-Occurrence-Based Analysis: The Case of 3D Printing. Sustainability 2020, 12, 2655. [Google Scholar] [CrossRef] [Green Version]
  41. Choe, H.; Lee, D.H. The structure and change of the research collaboration network in Korea (2000–2011): Network analysis of joint patents. Scientometrics 2017, 111, 917–939. [Google Scholar] [CrossRef]
  42. Haythornthwaite, C. Social network analysis: An approach and technique for the study of information exchange. Libr. Inf. Sci. Res. 1996, 18, 323–342. [Google Scholar] [CrossRef]
  43. Cvitanovic, C.; Cunningham, R.; Dowd, A.-M.; Howden, S.M.; van Putten, E.I. Using Social Network Analysis to Monitor and Assess the Effectiveness of Knowledge Brokers at Connecting Scientists and Decision-Makers: An Australian case study. Environ. Policy Gov. 2017, 27, 256–269. [Google Scholar] [CrossRef]
  44. Ko, N.; Yoon, J.; Seo, W. Analyzing interdisciplinarity of technology fusion using knowledge flows of patents. Expert Syst. Appl. 2014, 41, 1955–1963. [Google Scholar] [CrossRef]
  45. Kim, K.; Jung, S.; Hwang, J. Technology convergence capability and firm innovation in the manufacturing sector: An approach based on patent network analysis. R&D Manag. 2019, 49, 595–606. [Google Scholar] [CrossRef]
  46. Gong, M.; Li, G.; Wang, Z.; Ma, L.; Tian, D. An efficient shortest path approach for social networks based on community structure. CAAI Trans. Intell. Technol. 2016, 1, 114–123. [Google Scholar] [CrossRef] [Green Version]
  47. Yan, E. Finding knowledge paths among scientific disciplines. J. Assoc. Inf. Sci. Technol. 2014, 65, 2331–2347. [Google Scholar] [CrossRef] [Green Version]
  48. Leydesdorff, L. Betweenness centrality as an indicator of the interdisciplinarity of scientific journals. J. Am. Soc. Inf. Sci. Technol. 2007, 58, 1303–1319. [Google Scholar] [CrossRef] [Green Version]
  49. Das, K.; Samanta, S.; Pal, M. Study on centrality measures in social networks: A survey. Soc. Netw. Anal. Min. 2018, 8, 13. [Google Scholar] [CrossRef]
  50. Bonacich, P. Some unique properties of eigenvector centrality. Soc. Netw. 2007, 29, 555–564. [Google Scholar] [CrossRef]
  51. Rotolo, D.; Hicks, D.; Martin, B.R. What is an emerging technology? Res. Policy 2015, 44, 1827–1843. [Google Scholar] [CrossRef] [Green Version]
  52. Porter, A.L.; Garner, J.; Carley, S.F.; Newman, N.C. Emergence scoring to identify frontier R&D topics and key players. Technol. Forecast. Soc. Chang. 2019, 146, 628–643. [Google Scholar] [CrossRef]
  53. Oh, S.; Choi, J.; Ko, N.; Yoon, J. Predicting product development directions for new product planning using patent classification-based link prediction. Scientometrics 2020, 125, 1833–1876. [Google Scholar] [CrossRef]
  54. Choi, J.; Yoon, J.; Chung, J.; Coh, B.-Y.; Lee, J.-M. Social media analytics and business intelligence research: A systematic review. Inf. Process. Manag. 2020, 57, 102279. [Google Scholar] [CrossRef]
  55. Lü, L.; Zhou, T. Link prediction in complex networks: A survey. Phys. A Stat. Mech. Appl. 2011, 390, 1150–1170. [Google Scholar] [CrossRef] [Green Version]
  56. Liben-Nowell, D.; Kleinberg, J. The link-prediction problem for social networks. J. Am. Soc. Inf. Sci. Technol. 2007, 58, 1019–1031. [Google Scholar] [CrossRef] [Green Version]
  57. Xie, F.; Chen, Z.; Shang, J.; Feng, X.; Li, J. A link prediction approach for item recommendation with complex number. Knowl.-Based Syst. 2015, 81, 148–158. [Google Scholar] [CrossRef]
  58. Kim, J.; Geum, Y. How to develop data-driven technology roadmaps:The integration of topic modeling and link prediction. Technol. Forecast. Soc. Chang. 2021, 171, 120972. [Google Scholar] [CrossRef]
  59. Aaldering, L.J.; Leker, J.; Song, C.H. Competition or collaboration?—Analysis of technological knowledge ecosystem within the field of alternative powertrain systems: A patent-based approach. J. Clean. Prod. 2019, 212, 362–371. [Google Scholar] [CrossRef]
  60. Aaldering, L.J.; Song, C.H. Tracing the technological development trajectory in post-lithium-ion battery technologies: A patent-based approach. J. Clean. Prod. 2019, 241, 118343. [Google Scholar] [CrossRef]
  61. Wang, P.; Xu, B.; Wu, Y.; Zhou, X. Link prediction in social networks: The state-of-the-art. Sci. China Inf. Sci. 2015, 58, 1–38. [Google Scholar] [CrossRef] [Green Version]
  62. Hanson, E.D.; Mayekar, S.; Dravid, V.P. Applying insights from the pharma innovation model to battery commercialization—Pros, cons, and pitfalls. MRS Energy Sustain. 2017, 4, 10. [Google Scholar] [CrossRef]
  63. Bindra, A. Electric Vehicle Batteries Eye Solid-State Technology: Prototypes Promise Lower Cost, Faster Charging, and Greater Safety. IEEE Power Electron. Mag. 2020, 7, 16–19. [Google Scholar] [CrossRef]
  64. Hemmati, R. Technical and economic analysis of home energy management system incorporating small-scale wind turbine and battery energy storage system. J. Clean. Prod. 2017, 159, 106–118. [Google Scholar] [CrossRef]
  65. Fruchterman, T.M.J.; Reingold, E.M. Graph drawing by force-directed placement. Softw. Pract. Exp. 1991, 21, 1129–1164. [Google Scholar] [CrossRef]
  66. Beuse, M.; Steffen, B.; Schmidt, T.S. Projecting the Competition between Energy-Storage Technologies in the Electricity Sector. Joule 2020, 4, 2162–2184. [Google Scholar] [CrossRef]
  67. Singh, M.; Jiao, J.; Klobasa, M.; Frietsch, R. Making Energy-transition headway: A Data driven assessment of German energy startups. Sustain. Energy Technol. Assess. 2021, 47, 101322. [Google Scholar] [CrossRef]
  68. Ben-Daya, M.; Hassini, E.; Bahroun, Z. Internet of things and supply chain management: A literature review. Int. J. Prod. Res. 2019, 57, 4719–4742. [Google Scholar] [CrossRef] [Green Version]
  69. Golpîra, H.; Bahramara, S. Internet-of-things-based optimal smart city energy management considering shiftable loads and energy storage. J. Clean. Prod. 2020, 264, 121620. [Google Scholar] [CrossRef]
  70. Park, H.; Yoon, J. Assessing coreness and intermediarity of technology sectors using patent co-classification analysis: The case of Korean national R&D. Scientometrics 2014, 98, 853–890. [Google Scholar] [CrossRef]
  71. Narciso, D.A.C.; Martins, F.G. Application of machine learning tools for energy efficiency in industry: A review. Energy Rep. 2020, 6, 1181–1199. [Google Scholar] [CrossRef]
  72. Zekić-Sušac, M.; Mitrović, S.; Has, A. Machine learning based system for managing energy efficiency of public sector as an approach towards smart cities. Int. J. Inf. Manag. 2021, 58, 102074. [Google Scholar] [CrossRef]
  73. Tu, C.; He, X.; Shuai, Z.; Jiang, F. Big data issues in smart grid—A review. Renew. Sustain. Energy Rev. 2017, 79, 1099–1107. [Google Scholar] [CrossRef]
  74. Bögel, P.M.; Upham, P.; Shahrokni, H.; Kordas, O. What is needed for citizen-centered urban energy transitions: Insights on attitudes towards decentralized energy storage. Energy Policy 2021, 149, 112032. [Google Scholar] [CrossRef]
  75. Ye, B.; Jiang, J.; Miao, L.; Yang, P.; Li, J.; Shen, B. Feasibility Study of a Solar-Powered Electric Vehicle Charging Station Model. Energies 2015, 8, 13265–13283. [Google Scholar] [CrossRef] [Green Version]
  76. Plewnia, F. The Energy System and the Sharing Economy: Interfaces and Overlaps and what to Learn from them. Energies 2019, 12, 339. [Google Scholar] [CrossRef] [Green Version]
  77. Dougherty, M.L. Boom times for technocrats? How environmental consulting companies shape mining governance. Extr. Ind. Soc. 2019, 6, 443–453. [Google Scholar] [CrossRef]
  78. Laugs, G.A.H.; Benders, R.M.J.; Moll, H.C. Balancing responsibilities: Effects of growth of variable renewable energy, storage, and undue grid interaction. Energy Policy 2020, 139, 111203. [Google Scholar] [CrossRef]
  79. Sharma, P.; Kolhe, M.; Sharma, A. Economic performance assessment of building integrated photovoltaic system with battery energy storage under grid constraints. Renew. Energy 2020, 145, 1901–1909. [Google Scholar] [CrossRef]
  80. Goebel, C.; Cheng, V.; Jacobsen, H.-A. Profitability of Residential Battery Energy Storage Combined with Solar Photovoltaics. Energies 2017, 10, 976. [Google Scholar] [CrossRef] [Green Version]
  81. Ali, S.S.; Choi, B.J. State-of-the-Art Artificial Intelligence Techniques for Distributed Smart Grids: A Review. Electronics 2020, 9, 1030. [Google Scholar] [CrossRef]
Figure 1. Overview of the analysis framework.
Energies 14 05822 g001
Figure 2. Sequential process involving the computation of knowledge interaction matrix and the generation of corresponding knowledge interaction network. (Note: For the sake of simplicity, abbreviations are used to delineate the industry category codes).
Energies 14 05822 g002
Figure 3. Annual development trend of newly founded startups within the energy storage sector. (Note: The x-axis represents the founding year of startups, while the y-axis represents the number of startups).
Energies 14 05822 g003
Figure 4. Geographic distribution of startups within the energy storage sector.
Energies 14 05822 g004
Figure 5. Top 20 frequently occurring industry category codes (note: industry category codes refer to knowledge areas in subsequent mentions).
Energies 14 05822 g005
Figure 6. Visualization of knowledge interaction network (2010–2018).
Energies 14 05822 g006
Figure 7. Visualization of predicted knowledge interaction network for the interval 2019–2021.
Energies 14 05822 g007
Table 1. Top 20 Interacting pairs of knowledge areas involving “Battery” and “Energy Storage”.
Interactions Including
“Battery”
Relative
Frequency
Interactions Including
“Energy Storage” (ES)
Relative
Frequency
Battery—Manufacturing0.1113ES—Energy0.1649
Battery—Energy0.0972ES—Renewable Energy0.1059
Battery—Energy Storage0.0739ES—Battery0.059
Battery—Renewable Energy0.0648ES—Energy Management0.0574
Battery—Electronics0.0587ES—Solar0.0566
Battery—Electric Vehicle0.0547ES—Clean Energy0.0477
Battery—Automotive0.0405ES—Manufacturing0.0437
Battery—Software0.0263ES—Energy Efficiency0.0412
Battery—E-Commerce0.0263ES—Electric Vehicle0.0275
Battery—Clean Energy0.0253ES—Electronics0.0267
Battery—Solar0.0213ES—Software0.0218
Battery—Hardware0.0192ES—CleanTech0.021
Battery—Energy Management0.0192ES—Power Grid0.0202
Battery—Energy Efficiency0.0182ES—Oil and Gas0.017
Battery—Information Technology0.0172ES—Automotive0.0137
Battery—Consumer Electronics0.0162ES—Information Technology0.0113
Battery—CleanTech0.0142ES—Internet of Things0.0097
Battery—Nanotechnology0.0111ES—Advanced Materials0.0097
Battery—Retail0.0111ES—Nanotechnology0.0081
Battery—Power Grid0.0101ES—Electrical Distribution0.0073
Table 2. Summary of node centrality analysis (sorted by eigenvector centrality).
Knowledge AreaBetweenness CentralityEigenvector Centrality
Software0.0990.1895
Manufacturing0.08520.1809
Energy0.05150.1807
Internet of Things0.08560.1801
Energy Storage0.07230.1754
Information Technology0.04620.1709
Battery0.0510.1699
Renewable Energy0.04420.1673
Electronics0.0440.1573
Hardware0.03860.1538
Electric Vehicle0.02570.1520
Automotive0.0140.1437
Solar0.02180.1432
Consumer Electronics0.04760.1424
Clean Energy0.0130.1371
Artificial Intelligence0.01040.1276
Big Data0.01070.1266
Energy Efficiency0.00930.1257
Mobile0.03650.1242
Energy Management0.00480.1216
Table 3. Summary of interaction trend analysis (sorted by the metric “growth”).
Interacting Pairs of Knowledge AreaGrowthPersistenceNovelty
Energy StorageRenewable Energy0.0733present20.6333
Energy EfficiencyRenewable Energy0.0702present42.5365
EnergyEnergy Efficiency0.0659present31.8876
Energy EfficiencyEnergy Storage0.0534present28.902
Clean EnergyRenewable Energy0.0469present24.9006
Clean EnergyEnergy0.0447present25.532
Information TechnologySoftware0.0424present25.0197
Energy ManagementRenewable Energy0.0373present23.1173
Clean EnergyEnergy Storage0.0367present22.6158
BatterySoftware0.0344present28.2386
Energy EfficiencyEnergy Management0.0337present26.364
Energy EfficiencySolar0.0329present33.8732
EnergySoftware0.0293present22.2842
Energy StorageSoftware0.0227present22.8215
BatteryEnergy Management0.0212present27.0835
ElectronicsSoftware0.0197present21.5874
Machine LearningSoftware0.0197present33.7993
EnergyPower Grid0.0191present32.6937
Power GridRenewable Energy0.0146present24.0286
Energy ManagementInternet of Things0.0132present21.6313
Table 4. Topic-wise classification of predicted emerging interactions. (Note: The sum of emerging links is equal to 72, because the network is undirected.).
CategoriesAssociated Knowledge AreasNumber of
Emerging Links
Energy storageBattery, Energy Storage, Manufacturing7
Digital technologiesMachine Learning, Artificial Intelligence, Internet of Things, Big Data, Software, Information Technology, Internet, Smart Home, Smart Building, Smart Cities, Mobile Apps23
Energy managementEnergy, Energy Efficiency, Energy Management, CleanTech, Renewable Energy, Power Grid, Clean Energy15
Transportation & Consumer electronicsAutomotive, Electric Vehicle, Electronics, Consumer Electronics8
MiscellaneousAdvanced Materials, Chemical, Solar, Water, Nanotechnology, Sharing Economy, Hardware, Environmental Engineering, Environmental Consulting19
Publisher’s Note: MDPI stays neutral with regard to jurisdictional claims in published maps and institutional affiliations.

