Article

A Process Intensification Approach for CO2 Absorption Using Amino Acid Solutions and a Guanidine Compound

1
Oak Ridge National Laboratory, Oak Ridge, TN 37831, USA
2
School of Civil and Environmental Engineering, Georgia Institute of Technology, Atlanta, GA 30332, USA
3
Department of Chemical Engineering, Prairie View A&M University, Prairie View, TX 77446, USA
*
Authors to whom correspondence should be addressed.
Energies 2021, 14(18), 5821; https://doi.org/10.3390/en14185821
Submission received: 1 August 2021 / Revised: 24 August 2021 / Accepted: 7 September 2021 / Published: 14 September 2021
(This article belongs to the Special Issue Novel Technologies for Carbon Dioxide Sequestration)

Abstract

:
Environmentally friendly amino-acid salt solutions are used for the absorption of carbon dioxide from concentrated flue-gas streams via chemical absorption. Process intensification reduces operating and capital costs by combining chemical reactions and separation operations. Here, we present a new process-intensification approach that combines the CO2 capture and the amino-acid regeneration steps into a single process carried out in a slurry three-phase reactor. The absorbed CO2 precipitates as a solid carbonated guanidine compound. The cycle is completed by separation of the solid precipitate to strip the CO2 and regenerate the guanidine compound, while the liquid solution is recycled to the slurry reactor. The process was studied by modifying a model developed by the authors for a gas-liquid bubble column without the presence of the guanidine compound. The guanidine precipitation reaction was accounted for using kinetic parameters calculated by the authors in another study. The proposed model was implemented by modifying an existing computer code used for the simulation of gas-liquid bubble columns. The calculated results showed that the proposed cycle can significantly reduce energy, equipment, and operating costs and can make an important contribution to developing a competitive cost-effective large-scale process for CO2 capture.

Graphical Abstract

1. Introduction

The effects of climate change can be decreased only by major reductions in anthropogenic CO2 emissions [1,2,3]. One of the most important industrial processes for carbon dioxide capture is chemical absorption by amines or blends of different amines as absorption solvents ([4,5,6,7,8], among others). A stripping step that regenerates the solvents and releases the CO2 completes a separation cycle. The most important shortcomings of the process are the high energy budget required for CO2 stripping [4] and the toxicity of some of the solvents used [7].
Recently, many authors have studied the use of amino acid salt solutions as absorbents for CO2 sequestration [9,10,11,12,13,14,15,16], among others. Several authors reported the kinetics of CO2 absorption by amino acid salt solutions [9,10,11,12,13]. Values of the kinetic parameters have been experimentally determined using the stopped flow technique [14,15]. Other researchers studied different processes using different contactors to increase the mass transfer rate between the gas and liquid phases [16,17].
Amino acid salt solutions present several advantages over traditionally used solvents. For example, aqueous amino acid solutions are less volatile, less corrosive, and more stable to oxidation than most amine solvents [15,18].
There is a need to design economic and efficient industrial processes that allow successful implementation of these novel concepts. Gabitto et al. [19] presented dynamic models for CO2 absorption in a two-phase batch reactor and in a bubble column reactor. The authors also reported a complete reaction scheme for the different chemical species participating in the process. Gabitto et al. [19] implemented computationally the developed models and discussed some applications for design, optimization, and control purposes.
Kasturi et al. [17] experimentally and theoretically studied the CO2 absorption from flue gas streams produced in power-plants using amino acid salt solutions. The authors studied the process using a bubble column contactor. The main process parameters, e.g., bubble size, liquid-phase dispersion coefficient, and gas hold-up were experimentally determined. Kasturi et al. [17] used Gabitto et al.’s model [19] to simulate the two-phase bubble reactor operation. The simulation results agreed well with equivalent experimental data. Brethomè et al. [16] reported a process for direct CO2 absorption from air using glycine and sarcosine alkaline salt solutions. A complete cycle was proposed by reaction of the produced heavy carbonated solutions with a guanidine compound. This compound crystallizes as a very insoluble carbonate salt and regenerates the amino acid sorbent [16]. This process significantly reduces energy demand because the regeneration step is carried out by light heating of a solid instead of the entire bulk solution. Stripping of the captured CO2 to regenerate the liquid solvents is an energy intensive process typically used in industrial operations [4]. Some studies confirmed that the use of guanidine compounds can significantly reduce the energy budget of the regeneration process and lead to the design of energy-efficient and cost-effective carbon-sequestration technologies [16,20,21]. These research projects studied the chemistry of several guanidine compounds that crystallize as heavily carbonated precipitates. These carbonated compounds can release the CO2 and regenerate the original guanidine compound by only light heating (120 °C) in an oven. Williams et al. [21] reported that the minimum energy required for the regeneration of glyoxal-bis(iminoguanidine) (GBIG) is 151.5 kJ/mol CO2. This value is 24% lower than the regeneration energy of MEA, a typical industrial sorbent. Kasturi et al. [22] experimentally and theoretically studied the glycine regeneration by crystallization of a heavy carbonated guanidine compound (GBIGH22+(HCO3)2(H2O)2). The authors developed a simulation model and determined the regeneration mechanism by comparing model predictions and experimental data. Kasturi et al. [22] concluded that the thermodynamic driving force for the glycine regeneration is provided by the GBIGH22+ bicarbonate crystallization step while the rate-limiting step is the protonation of GBIG to form GBIGH22+.
Process intensification, a new subject in process engineering, is focused on reducing operating and capital costs by combining reaction and separation operations [23]. The goal of this research project is to present a novel process-intensification approach that combines the CO2 absorption and the amino-acid regeneration steps into a single process carried out in a slurry three-phase bubble column.

2. Materials and Methods

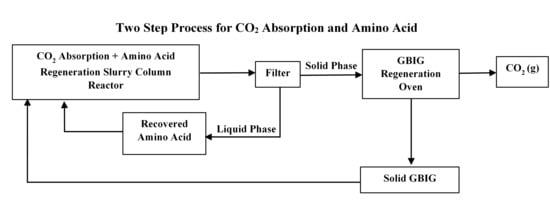
2.1. Model Organization

A similar approach to the one used by Gabitto et al. [8,19] in their simulation of the absorption/desorption of carbon dioxide in a gas-liquid bubble column will be followed. First, a reaction mechanism will be proposed. Second, a process model for a three-phase (gas-liquid-solid) bubble column will be presented. Finally, the reaction mechanism will be combined with the process model to simulate CO2 capture in the slurry bubble column.

2.2. Reaction Scheme

In this section we present a summary of the most important reactions to be considered. In the Appendix we present all the reactions involved. A detailed analysis of the mechanism can be found in Gabitto et al. [19]. One important part of the proposed model is the formulation of the chemical reactions involving the amino acid salts, the solvents, and CO2. Kasturi et al. [22] found that glycine suffers non-negligible decomposition during the heating process; therefore, a more stable amino acid salt, sarcosine, was used in this work. The reaction of sarcosine ( CH 3 NHCH 2 CO 2 H ) with CO2 has been studied by several authors [10,24,25]. A two-step mechanism has been proposed. The first step leads to the formation of a zwitterion intermediate:
CO 2   ( aq . ) + CH 3 NHCH 2 COO   K 1   CH 3 NH + ( CO 2 ) CH 2 COO .
Equation (1) is considered the rate controlling step. It is followed by a proton transfer to a base [19]:
CH 3 NH + ( CO 2 ) CH 2 COO +   B   K 1   CH 3 N ( CO 2 ) CH 2 COO + BH .
All bases present in the liquid phase will participate in reaction (2). For high amino acid concentration, the rate expression simplifies to [26]:
r 1 = k 1 [ CO 2 ]   [ CH 3 NHCH 2 COO ] .
Equation (1) is considered the main reaction in the absorption of CO2 in high concentration aqueous amino acid solutions. The amino acid salts (anions) also react reversibly with bicarbonate to generate carbamate ions by [25],
HCO 3   ( aq . ) + CH 3 NHCH 2 COO   K 2   CH 3 N ( CO 2 ) CH 2 COO + H 2 O .
Protonated and non-protonated carbamate ions follow the equilibrium given by:
CH 3 N ( CO 2 ) CH 2 COO +   H +   K 3   CH 3 N (   CO 2 H   ) CH 2 COO .
CO2 can also react with other bases present in the solution, OH- and H2O for example, by,
CO 2   ( aq . ) + OH   K 4   HCO 3   ( aq . ) ,
CO 2   ( aq . ) + H 2 O K 5   HCO 3 + H +   ( aq . ) .
Reaction (6) is the main reaction in alkaline aqueous solutions. Reaction (7) is very slow and makes a negligible contribution to CO2 absorption in most cases [4,10].
Kasturi et al. [22] found that in the presence of sarcosine, GBIG crystallizes as a heavily carbonated precipitate by the following mechanism:
GBIG   ( aq . ) + 2   SARH   K 9   GBIGH 2 2 + + 2   SAR ,
GBIGH 2 2 + + 2   HCO 3 + 2   H 2 O   K 10   ( GBIGH 2 2 + )   ( HCO 3 ) 2 ( H 2 O ) 2 ( s ) .
All bases in the liquid phase compete to protonate GBIG. The weakest base (strongest conjugated acid) will donate the proton. In the case of water, the base is OH, and the conjugated acid is H2O (pKa = 14). Amino acids, pKa about 9–10, are far weaker bases than OH, thus the amino acid donates the proton to the guanidine compound. The rate-limiting process is the hydrogenation of GBIG, Equation (8), while Equation (9) provides the thermodynamic driving force for the regeneration process. The global reaction is given by:
GBIG ( aq . ) + 2   HCO 3 + 2   SARH + 2   H 2 O K 11 ( GBIGH 2 2 + ) ( HCO 3 ) 2 ( H 2 O ) 2 ( s ) + 2   SAR .
In the reaction scheme the overall rates of reaction (Rai) were calculated using,
Rai = rfi − rri.
Here, rfi and rri are the forward and reverse reaction rates, respectively.
The generation terms (Rgen, i) that appear in the mass balance equations for every chemical species are calculated from Equations (1)–(11) by molar balances [4,19]. The equations to calculate all generation terms (Rgen,i) are given in the Appendix. All information related to the reaction scheme appears in the Appendix. Table A1 includes all chemical compounds. The values of all kinetic parameters used in this work are listed in Table A2.

2.3. Reactive Mass Transfer

The two-film model is used to account for gas-liquid reactive mass transfer. This model assumes the presence of two stagnant thin layers on both sides of the gas-liquid interphase. Mass transfer occurs by molecular diffusion through the two thin layers [27]. Two mass transfer coefficients, one in each thin layer (kg and kl), are defined by the model. The presence of a chemical reaction increases mass transport, which is calculated by using an enhancement factor (E) [28].
The ionic species always remain in liquid phase, while the gaseous and volatile chemical compounds move between both phases. Gas-phase only mass transfer resistance is considered for water while liquid only mass transfer resistance applies to the other gas species. However, both resistances must be considered for CO2. In our model, we consider this situation by using a global mass transfer coefficient given by,
1 K CO 2 l = 1 E   k CO 2 l + H cc k CO 2 g .
Here, K CO 2 l is the overall mass transfer coefficient based upon liquid phase concentrations, k CO 2 l is the liquid phase mass transfer coefficient, k CO 2 g is the gas phase mass transfer coefficient, H cc =   C i l / C i g , is the concentration based Henry’s constant, C i l and   C i g , are the liquid and gas phase i-species concentrations, respectively, and E is the enhancement factor. The enhancement number is a function of the dimensionless Hatta (Ha) number, which is a ratio of the component mass transfer with and without chemical reaction. When Ha > 2, the enhancement factor E is equal to the Ha number [28] so, the CO2 molar flow term ( N CO 2 , diff ) is calculated by [4,29,30]:
N CO 2 , diff =   k CO 2 l   E   a w   H cc   C CO 2 g .
Here, aw is the gas-liquid interphase area per unit volume.

2.4. Slurry Bubble Column Model

2.4.1. Mass Balances

A mass balance for the i-component in the liquid-phase of the slurry bubble column shown in Figure 1 is given by [4,19,30],
C i l t =   D l 2 C i l z 2 + u l C i l z N i , diff   k s , i   a s   ( C i l C i s ) + R gen , i l .
Here, u l is the liquid phase superficial velocity, D l is the liquid phase dispersion coefficient, C i s is the volumetric concentration of the i-component on the liquid-solid interface,   a s is the solid-phase holdup, and k s , i   is the liquid to solid phase mass transfer coefficient for the i-component. Replacing Equation (14), the interfacial liquid-gas mass transfer ( N i , diff ) using Equation (25) in reference [19] leads to,
C i l t =   D l 2 C i l z 2 + u l C i l z + k l , i   a w   ( C i l , * C i l )   k s , i   a s   ( C i l C i s ) +   R gen , i .
Here, k l ,   i is the i-component gas-liquid mass transfer coefficient, C i l , * is the equilibrium gas-liquid interface concentration of the i-component, and C i l is the i-component liquid phase concentration.
At steady state, a mass balance for the i-component in the liquid-solid interface is given by,
k s , i   a s   ( C i l C i s ) a s   R gen , i s = 0 .
Here, R gen , i s is the production of the i-component by reaction at the liquid-solid interface. These generation terms affect only the chemical species that participate in the precipitation reaction, Equations (8) and (9). Introducing Equation (16) into (15) leads to,
C i l t = { D l 2 C i l z 2 + u l C i l z } + k l , i   E   a w   ( C i l , * C i l ) a s   R gen , i s + R gen , i .
In the gas phase a mass balance for species-i leads to
C i g t = D g 2 C i g z 2 u g C i g z + N i , diff l .
Here D g is the gas phase dispersion coefficient. Replacing N i , diff in Equation (18) using [19] leads to,
C i g t =   D g 2 C i g z 2 u g C i g z k l   a w   ( C i l , * C i l ) .

2.4.2. Parameter Estimation

The implementation of the slurry bubble column model requires the evaluation of several parameters including the overall gas hold-up εg, overall solid hold-up εs, the volumetric mass transfer coefficient k1aw, the liquid side mass transfer coefficient kl, the volumetric interfacial area aw, the gas and liquid dispersion coefficients D g and D l , the bubble size dbs, the bubble distribution throughout the column, and the solid GBIG distribution throughout the column. The model parameters required for simulation of the slurry bubble column were calculated using literature information [31,32,33,34]. Our slurry bubble column operates in the homogeneous regime characterized by small bubbles with diameters between 1 and 7 mm and narrow bubble size distribution [34]. We also assumed homogeneous concentration of solid particles throughout the column. In some cases where literature data were not available, we used experimentally measured values of these parameters [22].
The average gas hold-up ( ε g ) is calculated using [33],
ε g = 0.00494   ρ L 0.42   ρ G 0.18 μ L 0.17   σ L 0.27   u g 0.55 ( P T P T   P S ) 0.20 ( D C D C + 1 ) 0.12 Γ 0.05   exp ( 2.23   C v 0.16   ρ p   d p 0.24   X w ) .
Here, D C is the column diameter, P T is the total pressure, P S is the saturation vapor pressure, u G is the superficial gas velocity, ρ G is the gas density,   ρ L is the liquid phase density, μ L is the liquid phase viscosity,   σ L is the liquid phase surface tension, ρ p is the solid particles density,   d p is the solid particles diameter, ρ p is the solid particles density, C v is the volumetric solid concentration, X w is the mass percentage of the solvent in a liquid mixture, and Γ   is the sparger coefficient calculated using,
Γ =   K d   N O   d O α .
Here, K d is a sparger constant, N O is the number of distributor orifices, d O is the diameter of the distributor orifices, and the exponent a is constant calculated from Equation (26) in ref. [33].
The specific gas-liquid interphase area ( a w ) is calculated using [32]:
a w = 6   ε g ( 1   ε g )   d bs   .
The Sauter mean diameter of the bubbles ( d bs ) is given by [32],
d bs = 37.19   μ L 0.08   σ L 0.22   ρ G 0.02 ρ L 1.52   M w gas 0.12   u g 0.14   ( D C D C + 1 ) 0.30 ( 1 ε g ) 1.56   Γ 0.02   exp ( 2.81   C v + 2.77   ρ p   d p 2.29   X w ) .
The liquid-layer mass transfer coefficient ( k l a w ) is calculated from [34]:
k l a w ( 1 ε g ) = 6.14   x   10 4   μ L 0.12   ρ L 0.26   ε G 1.21 D A B 0.50 σ L 0.52 ρ G 0.06 u G 0.12   d b s 0.05     T 0.68 ( D C D C + 1 ) 0.40 Γ 0.11 .
Here, D AB is the diffusivity of A-species into the liquid phase.
The liquid axial dispersion coefficient ( D l ) is given by [33]:
D L = 0.35   D c 4 / 3   ( g   u g ) 1 / 3 .
Since the gas bubbles in the homogeneous regime are relatively small, we assumed that the gas bubbles dispersion coefficient is equal to the liquid dispersion coefficient [35], ( D G   D L ).

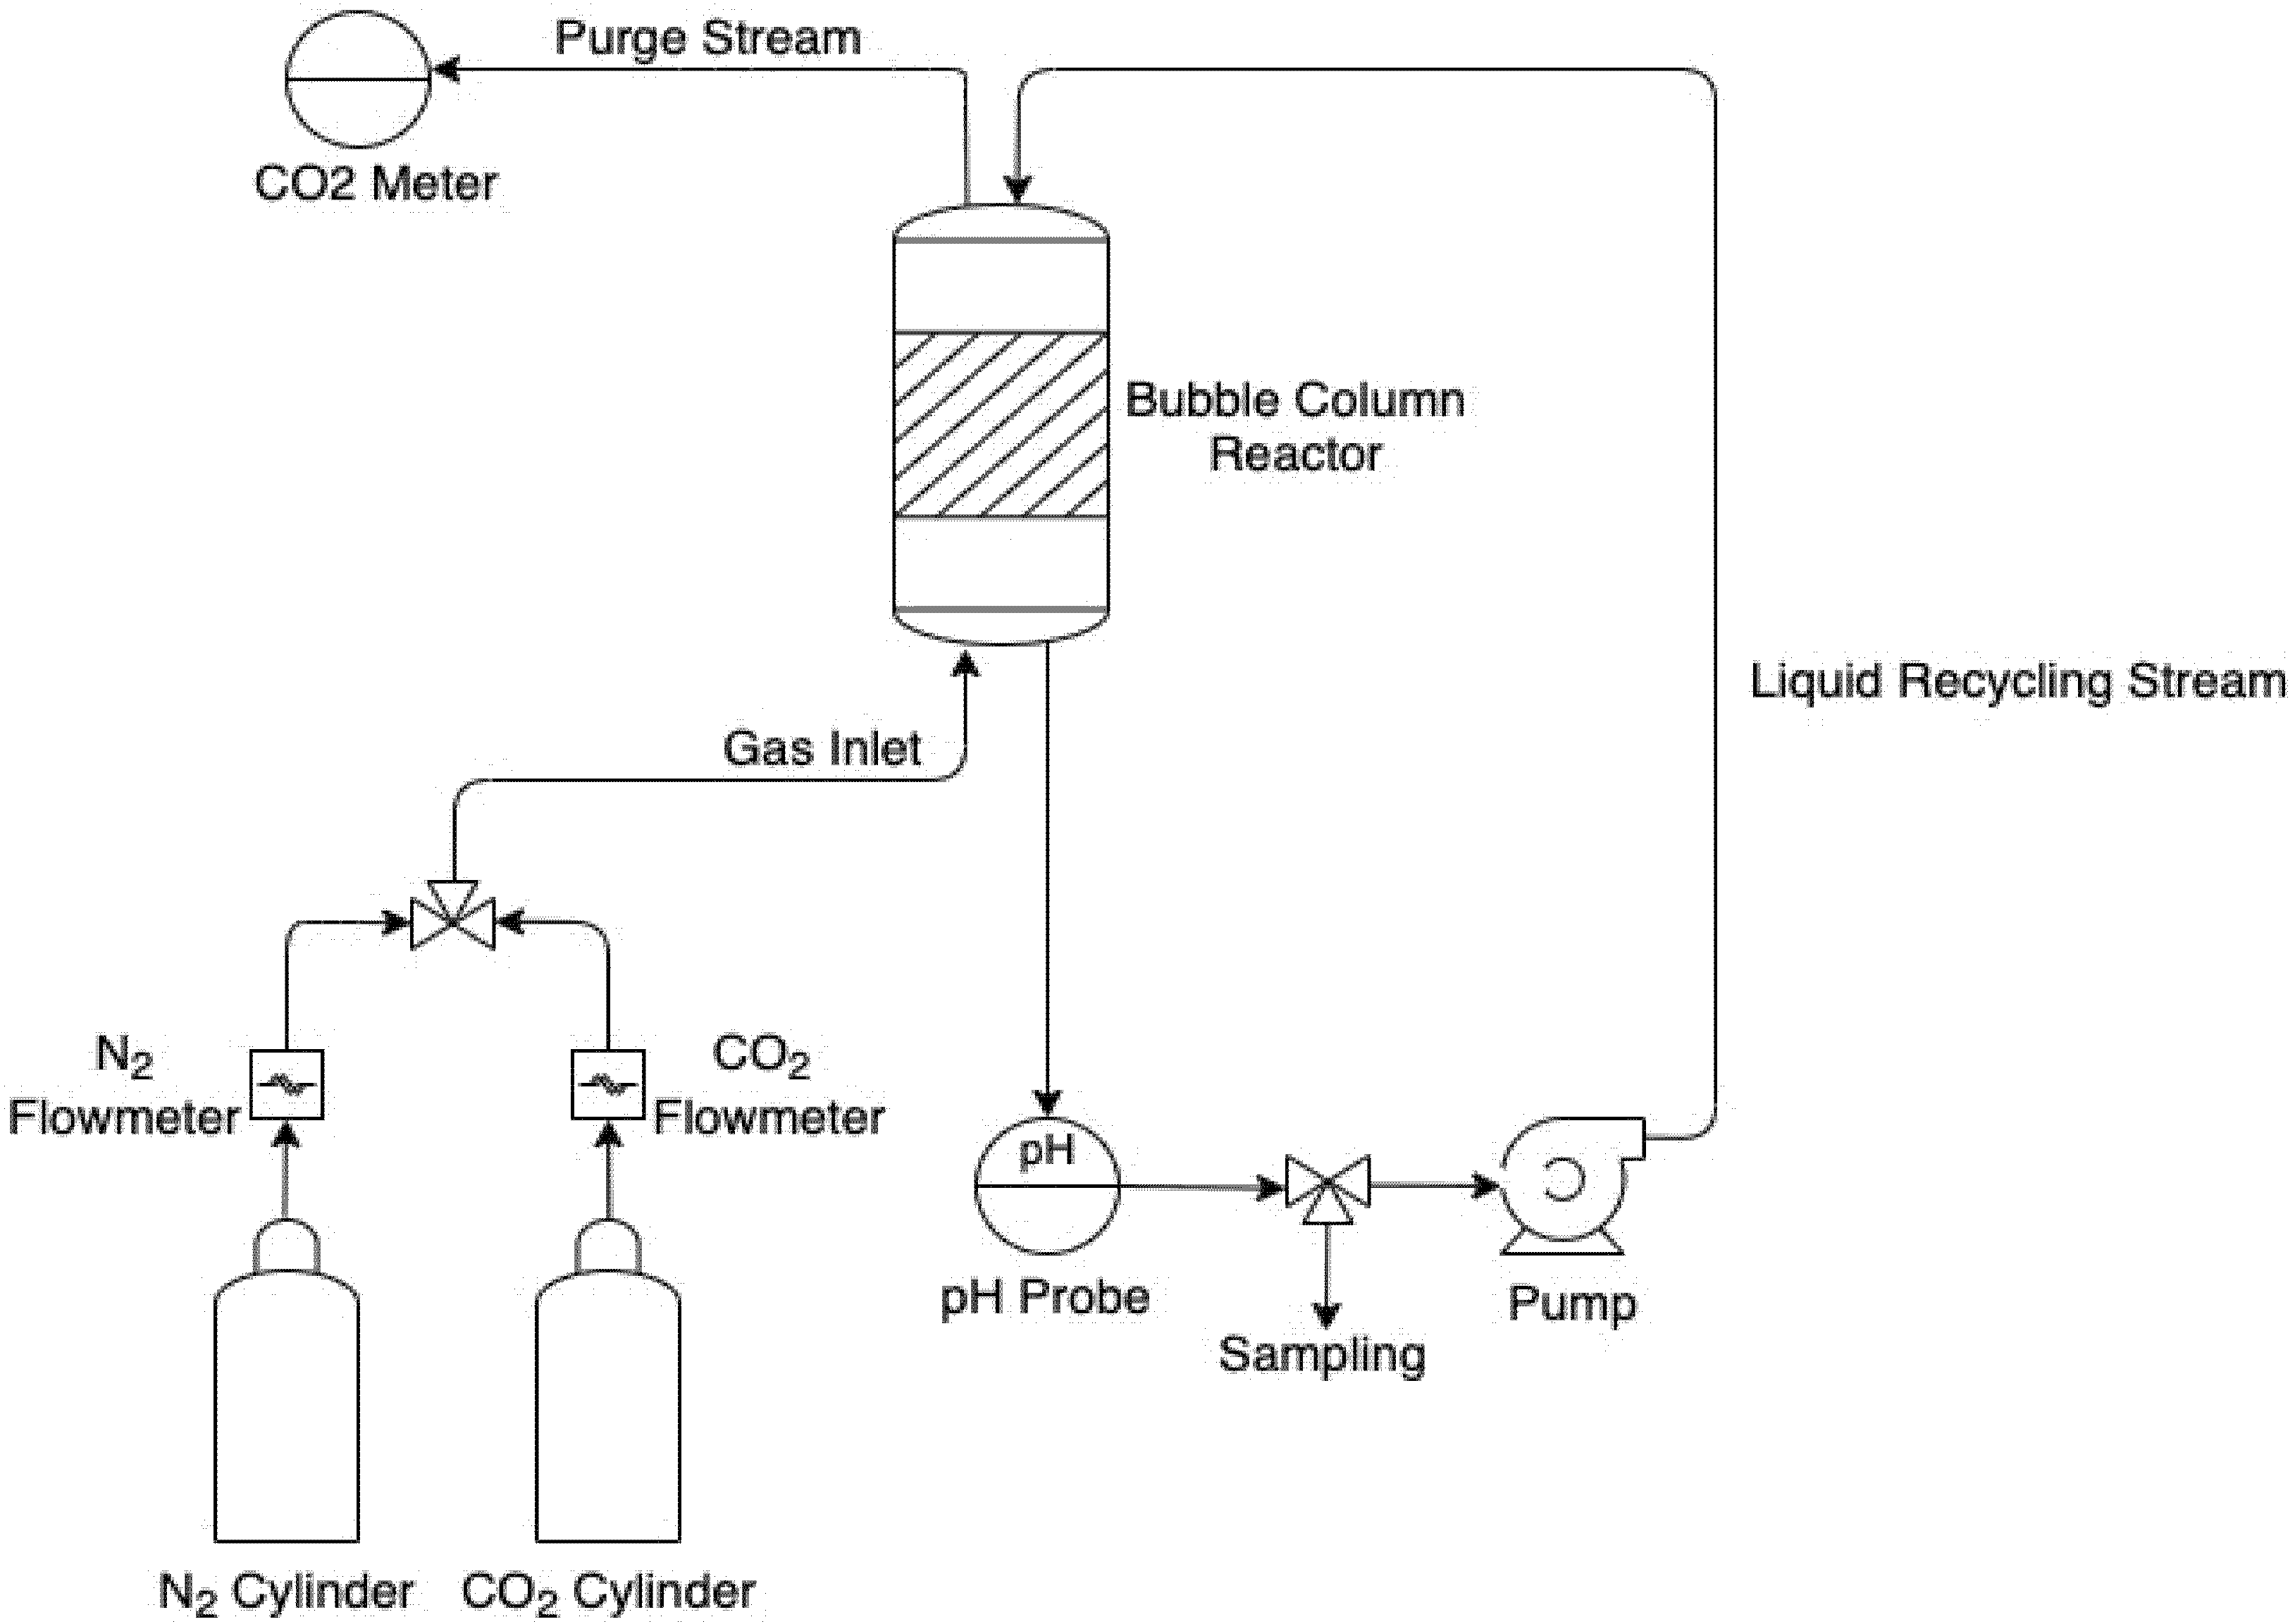
2.5. Experimental Part

Experimental data were measured using the experimental set-up reported by Kasturi et al. [17] as shown in Figure 1. In our experiments we prepared 3 L of 1 M potassium hydroxide purchased from Fisher Chemicals (Fair Lawn, NJ, USA) by dilution of a 45 weight% potassium hydroxide solution. We promoted diluted potassium hydroxide solutions by mixing 1 M equivalent of sarcosine. We purchased sarcosine (>99% purity) from Sigma Aldrich (Milwaukee, WI, USA). We prepared a simulated flue gas stream by combining individual gaseous streams of CO2 and N2 obtained from their respective gas cylinders purchased from Airgas (Atlanta, GA, USA). The input 14% (v/v) CO2 stream was prepared by adjusting the flow rates of CO2 and N2 until the desired values were obtained. The total gas flowrate was 5 Lmin−1. Liquid samples were taken at the bottom of the bubble column reactor and then analyzed for total carbonate concentration using a Dionex ICS-5000+ ion chromatography and for pH using an Acumet 50 pH-meter. The output CO2 gaseous concentration at the top of the column was measured using a CM-0003 CO2 m from CO2Meter (Ormond Beach, FL, USA). Experimental data were used to support and validate process simulations. We measured gas and solid hold-up values (eg and es) by taking pictures of the column sections at different times.

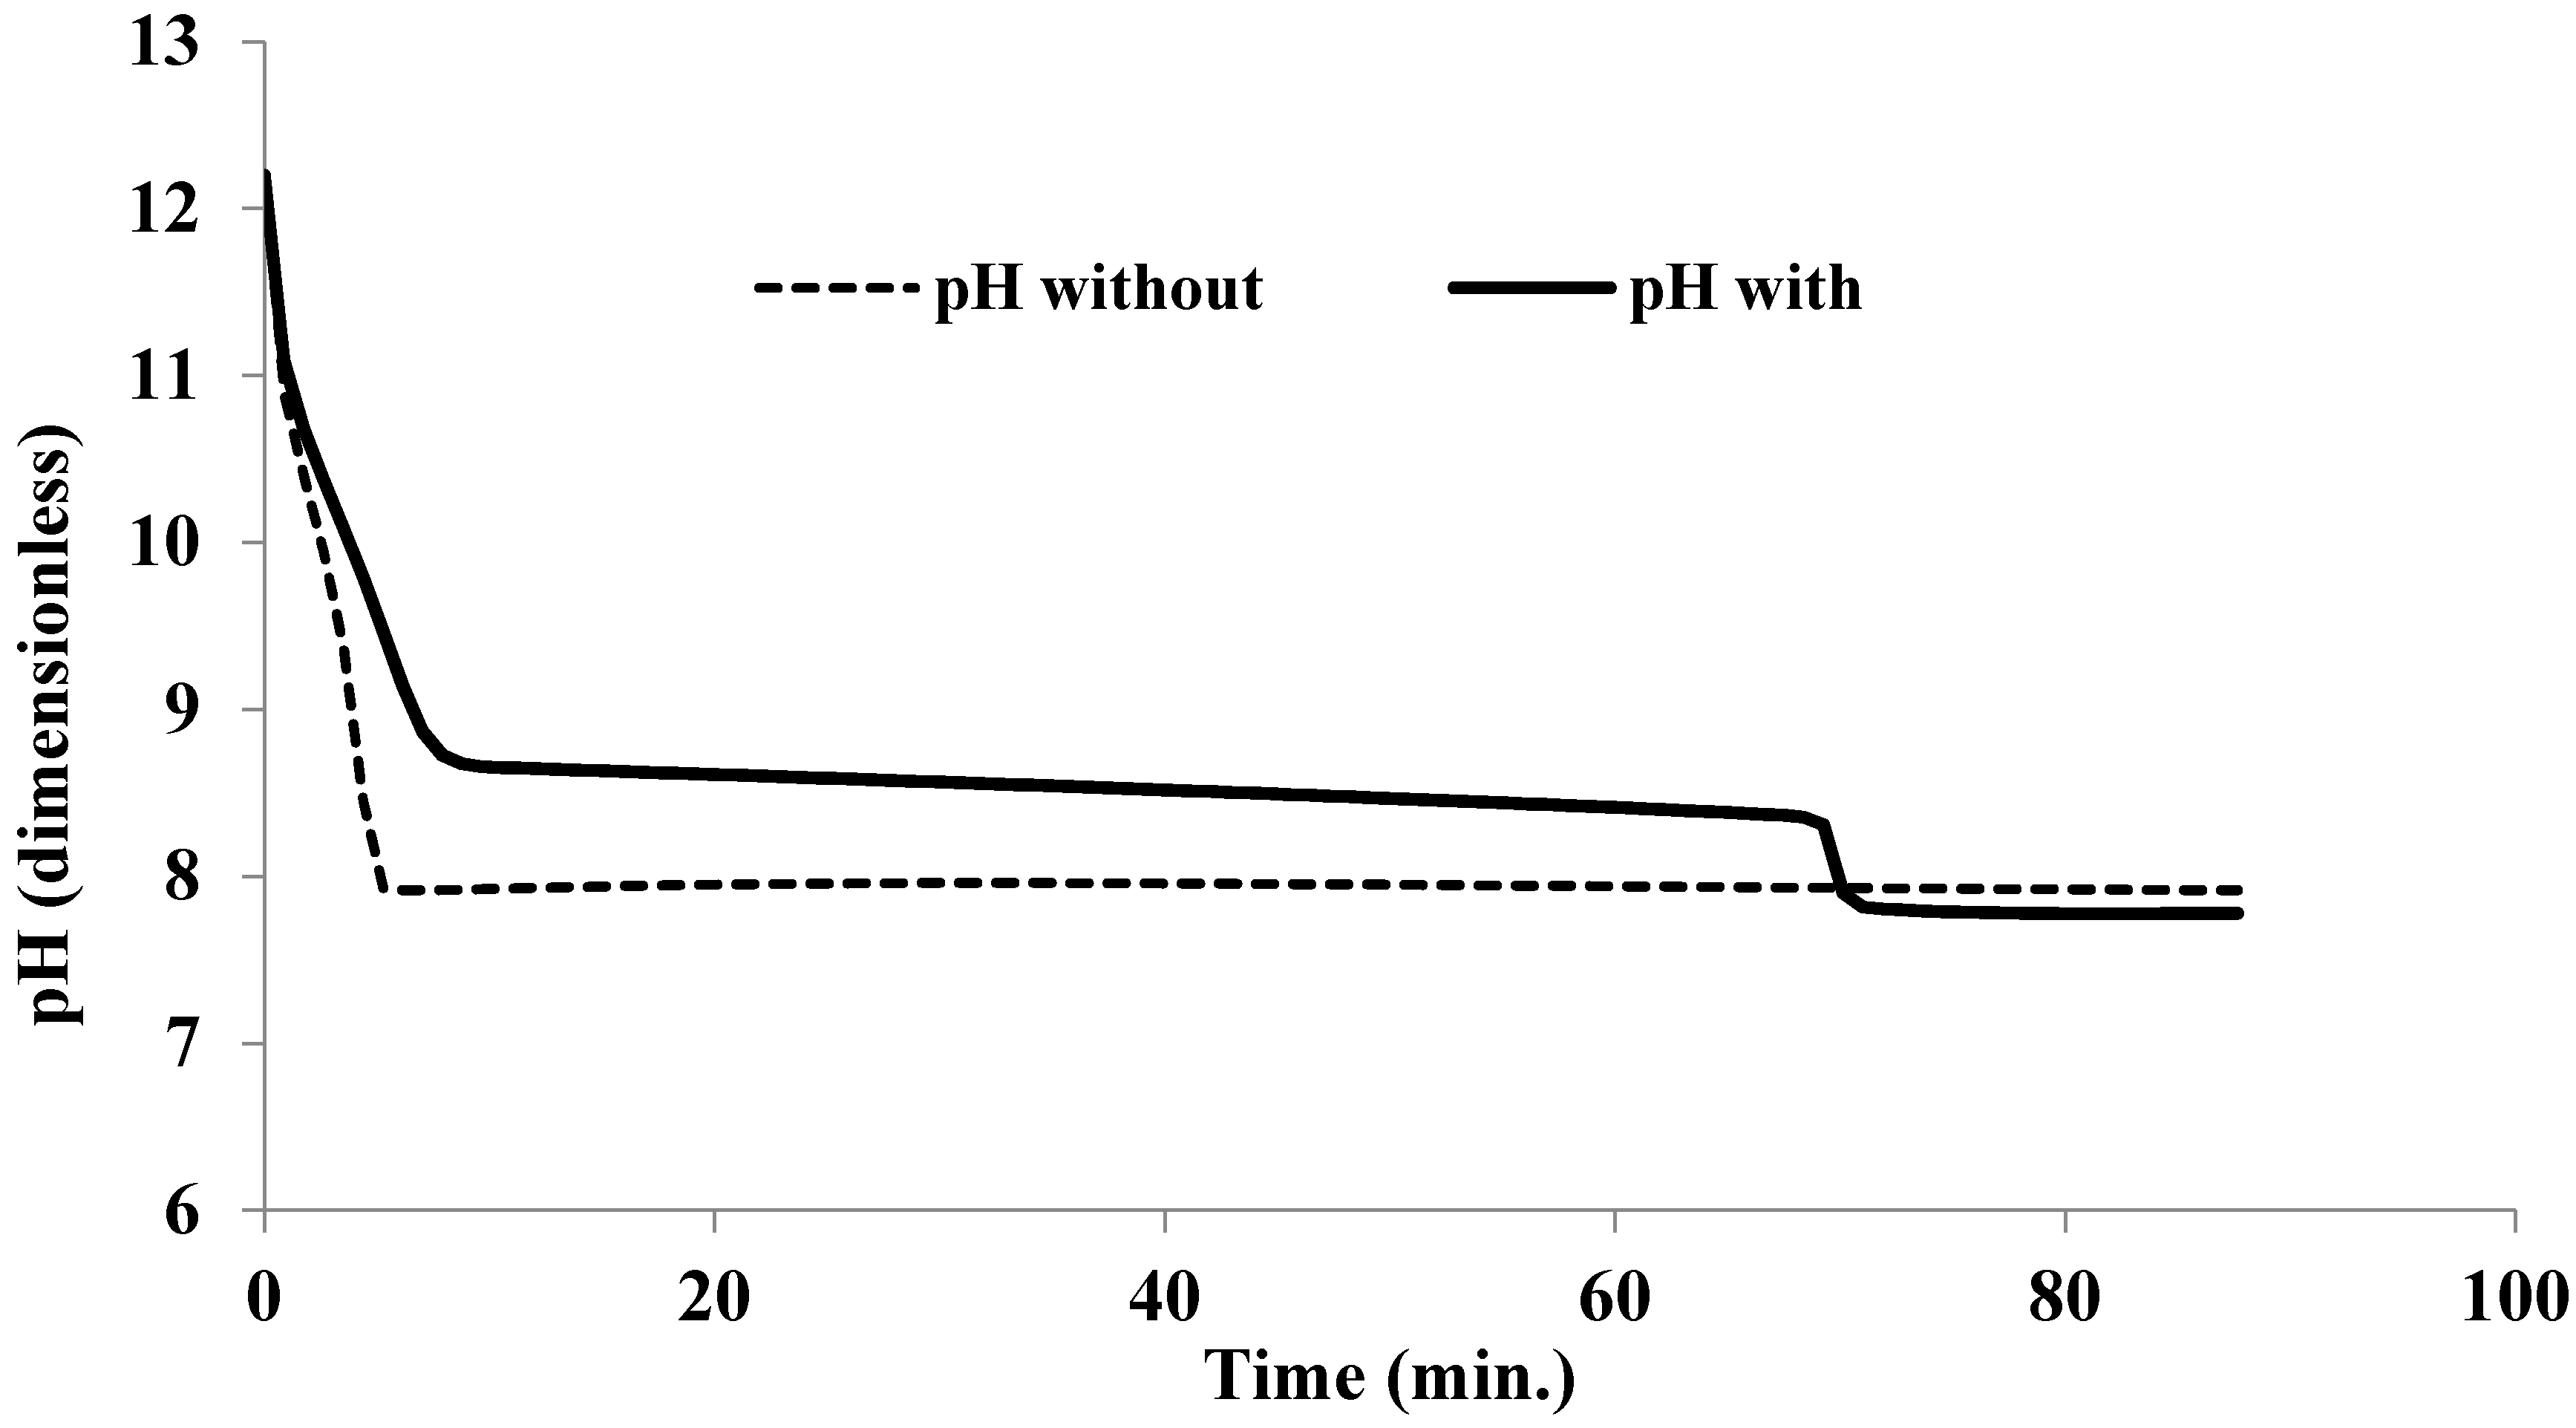
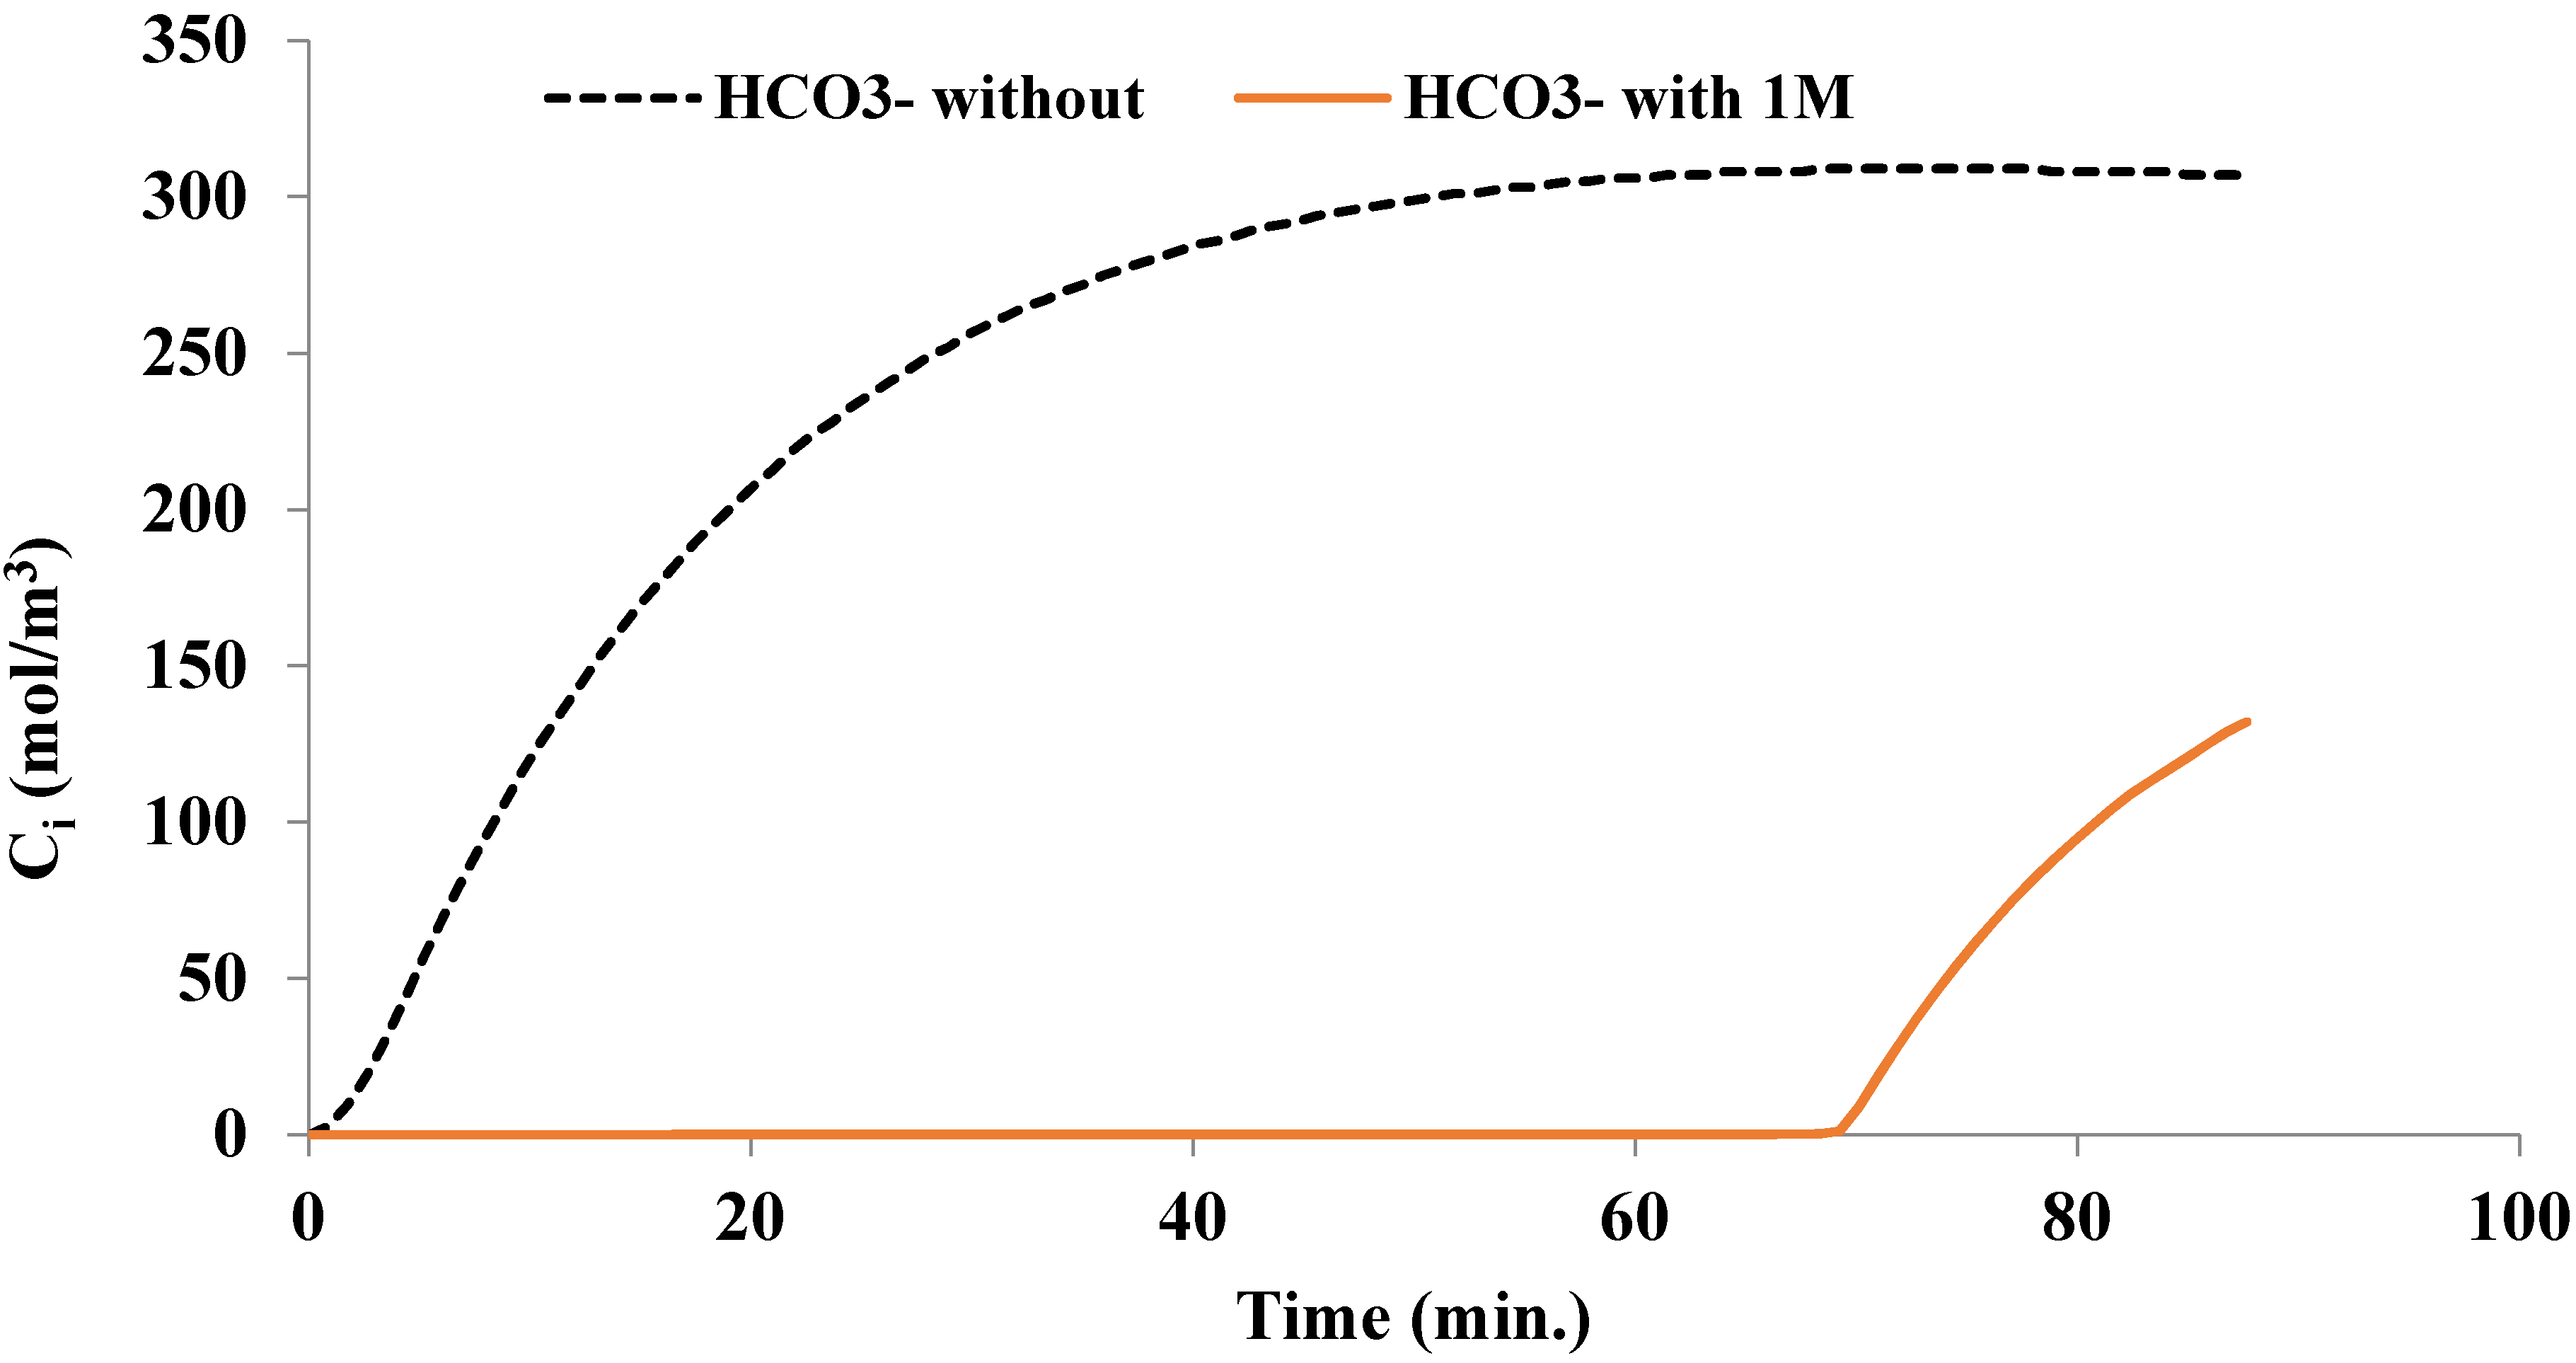
3. Results and Discussion

The model presented in the theoretical section was implemented by modifying the custom-made FORTRAN computer code developed by Gabitto et al. [19,22]. More details can be found in the references. The experimental data from Kasturi et al. [17] showed that the bubble diameter changes with position and time in a very complex way. The presence of the solid phase introduces further changes in gas bubble size and distribution. A simulation model considering the formation and coalescence of bubbles is needed for accurate simulation of this behavior. Such a model, however, is beyond the scope of this work. Therefore, it was decided to fit the experimental data using a constant bubble diameter for the whole experiment instead of trying complex functions of bubble size with axial position and time. Typical results are plotted in Figure 2, Figure 3, Figure 4 and Figure 5. The operating values used in the simulations are shown in Table A3 in the Appendix.
Figure 2 shows typical values of exit CO2 concentration in gas phase vs. time with and without GBIG. The designation “without” means no GBIG is present in the system; therefore, no GBIGH 2 2 + ( HCO 3 ) 2 ( H 2 O ) 2 solid precipitates. The simulation results show that the presence of the guanidine compound significantly delays breakthrough behavior compared with the case without the guanidine compound. The area above both curves is proportional to the amount of CO2 absorbed in liquid-phase; therefore, there is significantly more CO2 absorbed when the guanidine compound is present. Several authors found that the CO2 concentration in the gas phase decreases as the amino acid salt concentration increases due to the counterflow operation of the column [17,19]. However, caution needs to be exerted as in this work the experiments were run by continuously recycling the slurry phase. Therefore, as time increases, the input concentration of the amino acid salt at the top of the column decreases while the gas phase input concentration at the bottom remains constant.
Kasturi et al. [17,22] reported that the values of the concentration of the different amino acid forms, the concentration of the products of the different reactions with CO2, and the pH are strongly related. The simulation results are shown in Figure 3, Figure 4 and Figure 5.
Figure 3 shows the time variation of the concentration of the different amino acid compounds at the bottom of the column. The predominant form of the amino acid at high pH is the alkaline salt (SAR). This compound is consumed throughout the column by reaction with CO2 to produce the carbamate form, SAR(CO2). The amino acid concentration (SAR) is higher with GBIG present than without. It is shown in Figure 3 that the total carbamate (SARCO2/SARCO2H) concentration is significantly higher with than without GBIG present. This ratio is equal to the stoichiometric ratio, Equation (1), with GBIG present while it is smaller without. After consumption of GBIG the system reverts to the behavior without GBIG.
The simulation results depicted in Figure 4 show that the pH value at the column bottom drops fast with time as the amino acid salt is consumed. After a high decrease in the amino acid concentration the pH remains relatively constant. When GBIG is consumed the pH decreases up to similar values than without GBIG present. We can also see that the pH is higher with GBIG present than without.
Figure 5 shows the variation of the concentration of HCO3- with time. The presence of GBIG significantly delays bicarbonate increase in liquid phase. When GBIG is present HCO3 is consumed to form the carbonated GBIG precipitate. As the amount of GBIG is entirely consumed the system behaves similarly to the case without GBIG. Inspection of the results reported in Figure 4 shows that the pH decrease is caused by the bicarbonate ion concentration increase.
The simulation results shown in Figure 2, Figure 3, Figure 4 and Figure 5 show that the decrease in CO2 absorption with time is produced by the decrease in the concentration of the alkaline form of the amino acid. This decrease is produced by formation of a carbamate compound, and by the decrease in pH which favors the formation of the protonated form of the amino acid, as shown in Figure 3. The simulation results shown in Figure 2, Figure 3, Figure 4 and Figure 5 lead us to propose the following description of the CO2 absorption process. At short times, a big amount of CO2 is absorbed by carbamate formation. This process is fast and in approximately 10 min most of the amino acid has been transformed into the carbamate form by the reaction given by Equation (1) or into the protonated form of the amino acid due to the decrease in pH. The protonated form of the amino acid does not actively participate in CO2 absorption [26]. This step produces a significant decrease in the pH value. The results presented in Figure 2 show that after this period ends there is a sharp increase in CO2 concentration without GBIG present while in the presence of GBIG the CO2 concentration remains relatively constant. CO2 is still absorbed by the alkaline aqueous solution, Equation (6); however, this step is relatively slow and produces only a slight decrease in pH, but neither the concentration of bicarbonate increases, nor the pH decreases further because the guanidine compound reacts with HCO3- to produce the carbonated precipitate and regenerates some amino acid salt. This step produces the slight increase in the exit gaseous CO2 concentration shown in Figure 2 from time = 10 to 70 min in the presence of GBIG. After 70 min, the amount of the guanidine compound has been significantly reduced and the system behaves as the system without guanidine. Changes in bubble size and bubble size distribution can also affect the behavior observed in these simulation results.
The presented simulation results established qualitative trends for the variation of the main chemical compounds participating in the complex reactions associated with the CO2 absorption by amino acid salts. Quantitative agreement between simulation results and experimental data can only be achieved by using the bubble size as an adjustable parameter because the model presented in this work lacks a subroutine to calculate bubble size and bubble size distributions. The comparison of our simulations results with Kasturi et al. [22] is shown in Figure 6 and Figure 7.
Figure 6 shows good agreement between experimental data and simulation results for very short and long times. At intermediate times, from 4 to 40 min, the agreement is not as good. The variation in bubble size distribution with time and position was considered the reason behind the difference in experimental and simulation results at intermediate time scales. Kasturi et al. [22] reported similar results for experiments without the presence of the guanidine compound.
A comparison with experimental results for pH is shown in Figure 7. The simulation results depicted in the Figure show that there is very good agreement for very short and long times. However, once again there is only fair agreement for intermediate times, from 4 to 20 min. A theoretical model that calculates bubble sizes and distributions is needed to improve the predictions.

4. Conclusions

A simulation model for CO2 capture in a slurry bubble column combining an absorption step and a regeneration step has been developed. The model has been implemented by writing a custom-made computer code. The interactions among amino acid forms, pH, and different carbonated products have been studied. Breakthrough behavior for output carbon dioxide concentration in gas phase has been observed. The breakthrough behavior is produced by significant amino acid consumption and pH decrease at very short times. Simulation results and experimental data agree well for very short and long periods of time. The agreement is only fair at intermediate times. The lack of a theoretical model that represents the bubble size changes with time and position is considered the reason for the discrepancy at intermediate times. Comparison between simulation results and experimental data with and without the guanidine compound (GBIG) shows that the presence of the guanidine compound significantly increases the amount of CO2 captured and the pH. The increase in pH and the precipitation of the extra amount of bicarbonate ion formed by alkaline absorption are considered the main reasons for the improved operation.
In conclusion, the results presented in this work show that it is possible to implement a combined CO2 sequestration and amino acid regeneration process with improved efficiency compared to a process without simultaneous regeneration. It should also be emphasized that, although the model and experiments were performed using a bubble column, the same conclusions are applicable for other types of absorbers, such as packed columns, which are designed to operate with lower pressure drop.

Author Contributions

A.K. participated in investigation and visualization; J.F.G. participated in methodology, software, validation, and writing—original draft; R.C. participated in conceptualization, funding acquisition, and writing—review and editing; and C.T. participated in conceptualization, funding acquisition, project supervision, and writing—review and editing. All authors have read and agreed to the published version of the manuscript.

Funding

This research was supported by the U.S. Department of Energy, Office of Technology Transitions, through a Technology Commercialization Fund supported by the Office of Fossil Energy and Carbon Management. Partial support (Jorge Gabitto) by a RISE Grant from the office of the Vice-President of Research at PVAMU is kindly acknowledged. This study was conducted at Prairie View A&M University and the Oak Ridge National Laboratory (ORNL). ORNL is managed by UT-Battelle, LLC under Contract No. DE-AC05-00OR22725 with the U.S. Department of Energy.

Data Availability Statement

See notice below concerning the policies from the USA government related to data generate in US agencies.

Conflicts of Interest

The authors declare no conflict of interest. This manuscript has been authored by UT-Battelle, LLC under Contract No. DE-AC05-00OR22725 with the U.S. Department of Energy. The United States Government retains and the publisher, by accepting the article for publication, acknowledges that the United States Government retains a non-exclusive, paid-up, irrevocable, world-wide license to publish or reproduce the published form of this manuscript, or allow others to do so, for United States Government purposes. The Department of Energy will provide public access to these results of federally sponsored research in accordance with the DOE Public Access Plan. (http://energy.gov/downloads/doe-public-access-plan).

Appendix

Reactions
CO 2   ( aq . ) + 2   SAR   K 1   SAR ( CO 2 ) + SARH ,
HCO 3   ( aq . ) + SAR   K 2   SAR ( CO 2 ) + H 2 O ,
SAR ( CO 2 ) +   H +   K 3   SAR ( CO 2 H ) ,
CO 2   ( aq . ) + OH   K 4   HCO 3   ( aq . ) ,
CO 2   ( aq . ) + H 2 O K 5   HCO 3 + H +   ( aq . ) ,
H 2 O   K 6   H + + OH
HCO 3 + OH   ( aq . ) K 7   CO 3 = +   H 2 O ,
SARH   + OH   ( aq . ) K 8   SAR +   H 2 O ,
GBIG   ( aq . ) + 2   SARH   K 9   GBIGH 2 2 + + 2   SAR ,
GBIGH 2 2 + + 2   HCO 3 + 2   H 2 O   K 10   ( GBIGH 2 2 + )   ( HCO 3 ) 2 ( H 2 O ) 2 ( s ) .
Generation Terms
Assuming the pseudo-steady state for every chemical species, we can calculate the generation terms that appear in the chemical species mass balances. To simplify the calculations, we determined an overall rate per reaction according to,
Rai = rif − rir.
Every generation term (Rgeni) is calculated by a molar balance using:
Rgen1 = −Ra1 − 2 Ra2 + Ra8 + 2 Ra9 (SAR-),
R gen 2 = R a 1 + R a 2 R a 3   ( S A R ( C O 2 ) ) ,
R gen 3 = R a 3   S A R ( C O 2 H ) ,
R gen 4 = R a 1 R a 4   R a 5   C O 2   ( a q . ) ,
R gen 5 = 0   H 2 O ,
R gen 6 = R a 2 R a 7 2   R a 10 + R a 4   + R a 5   ( H C O 3 ) ,
R gen 7 = R a 6   R a 4 R a 7   R a 8   ( O H ) ,
R gen 8 = R a 3 + R a 5   + R a 6   ( H + ) ,
R gen 9 = R a 7   ( C O 3 2 ) ,
Rgen10 = Ra1 − Ra8 (SARH),
R gen 11 = R a 9   R a 10   ( G B I G H 2 2 + ) ,
R gen 12 = R a 10   ( ( G B I G H 2 2 + ) ( H C O 3 ) 2 ( H 2 O ) 2 ) .
Table A1 lists all the chemical compounds participating in reactions (A1) to (A10).
Table A1. List of compounds participating in the reaction scheme.
Compound N°GasLiquid
1N2 (g)SAR-
2O2 (g)SAR(CO2)
3CO2 (g)SAR(CO2H)
4H2O (g)CO2 (aq.)
5-H2O
6-HCO3
7-OH
8-H+
9-CO32−
10-SARH (aq.)
11-GBIGH22+(aq.)
12-GBIGH2(HCO3)2(H2O)2
Kinetic Data
Table A2 summarizes all the kinetic parameters for the rate equations used in the model. The first number in the first column is the equation number used in the Appendix. The second number refers to the original equation number used in the article. (-) means that the equation has not been listed in the article, but it has been included in the model for completeness.
Table A2. Kinetic information used in solving the proposed reaction model.
Eqn. No/ReactionForward Rate (kfi)Equilibrium ConstantReverse Rate (kri)
A1 (1 + 2)k1f = 9.5 × 10¹¹ (mM−1s−1) exp(−7348/Tl)K1 = 11.78 × exp(721.7/Tl) × 10(909.1/Tl)k1r = k1f/K1
A2 (4)k2f = 3.59 × 10⁵ (mM−1s−1) exp(−7400/Tl)K2 = k2f/k2rk2r = 4931.6 (mM−1 s−1) × exp(−8004/Tl) (s−1)
A3 (5)k3f = 4.52 × 10⁷ (mM−1 s−1) × 10(−909.1/Tl)K3 = 4.52E10 (M−1) × 10(−909.1/Tl)
(mM−1)
k3r = (k3f)/K3
A4 (6)k4f = 1.88 × 10¹² × exp[−7698./Tl] (mM−1s−1)K4 = k4f/k4rk4r = 2.491 × 10¹⁶ × exp[−1.367E4/Tl] (s−1)
A5 (7)k5f = 4.32 × 10⁻⁷ (s−1)K5 =10(3404.7/Tl ) + 0.032786 × Tl + 14.8435) (mM)K5r = (k5f)/K6
A6 (-)k6f = 3.6 × 10⁻¹⁰ (s−1 mM)K6 = 1.58 × 10⁻³ (mM2) × exp(−6832/Tl)k6r = (k6f)/K6
A7 (-)k7f = 0.1 (mM1s−1)K7= 4.474 × 10⁻³ (mM−1) × exp(5325./T)k7r = (k7f)/K7
A8 (-)k8f = 0.1 (mM1s−1)K8= 2.83 × 10⁻⁵ (mM−1) × exp(6832./T)k8r = (k8f)/K8
A9 (8)k9f = 2 × 10⁻⁵ Tl (mM−2 s−1)K9= 2.26 × 10⁻⁵ (mM−1)k9r = (k9f)/K9
A10 (9)k10f = 8.95 × 10⁻³ (mM1s−1)K10 = 0.54 (mM−3)k10r = (k10f)/K10
Simulation Parameters
Table A3 contains a list of the parameters and operating conditions used in our simulations.
Table A3. Values used in the simulations.
NotationParameterValue/RangeUnits
Q g Gas phase flow rate1–5L min−1
Q l Liquid phase flow rate0.1–1L min−1
L c Column height0.9m
D C Column diameter0.08m
d b s Gas bubble Sauter diameter1 × 10−3–5 × 10⁻³m
V S Solid volume fraction0.04–0.1(-)
X g , C O 2 0 Initial CO2 volume fraction in gas-phase0.05–0.14(-)
V T a n k Liquid feed tank volume0.5 × 10−3–4 ×10⁻³m3
C l , S A R 0 Initial amino acid concentration0.1–1M
C l , G B I G 0 Initial GBIG concentration0.1–1M
P T Total pressure1.1 × 10−5Pa
T Temperature293K
pHPotential of hydrogen10.2–12.5(-)

References

  1. Masson-Delmotte, V.; Zhai, P.; Pörtner, H.O.; Roberts, D.; Skea, J.; Shukla, P.R.; Pirani, A.; Moufouma-Okia, W.; Péan, C.; Pidcock, R.; et al. Global Warming of 1.5 °C; An IPCC Special Report on the Impacts of Global Warming of 1.5 °C above Pre-Industrial Levels and Related Global Greenhouse Gas Emission Pathways, in the Context of Strengthening the Global Response to the Threat of Climate Change, Sustainable Development, and Efforts to Eradicate Poverty; IPCC: Geneva, Switzerland, 2018. [Google Scholar]
  2. Blunden, J.; Arndt, D.S. State of the climate in 2018. Bull. Am. Meteorol. Soc. 2019, 100, Si–S306. [Google Scholar] [CrossRef] [Green Version]
  3. Aaron, D.; Tsouris, C. Separation of CO2 from Flue Gas: A Review. Sep. Sci. Technol. 2005, 40, 321–348. [Google Scholar] [CrossRef]
  4. Greer, T. Modeling and Simulation of Post Combustion CO2 Capturing. Master’s Thesis, Telemark University College, Faculty of Technology, Porsgrunn, Norway, 2008. [Google Scholar]
  5. Bosch, H.; Versteeg, G.F.; van Swaaij, W.P.M. Gas-Liquid Mass Transfer with Parallel Reversible Reactions-III. Absorption of CO2 into Solutions of Blends of Amines. Chem. Eng. Sci. 1989, 44, 2745–2750. [Google Scholar] [CrossRef] [Green Version]
  6. Hagewiesche, D.P.; Ashour, S.S.; Al-Ghawas, H.A.; Sandall, O.C. Absorption of Carbon Dioxide into Aqueous Blends of Monoethanolamine and Methyldiethanolamine. Chem. Eng. Sci. 1995, 50, 1071–1079. [Google Scholar] [CrossRef]
  7. Sakwattanapong, R.; Aroonwilas, A.; Veawab, A. Reaction Rate of CO2 in Aqueous MEA-AMP Solution: Experiment and Modeling. Energ. Procedia 2009, 1, 217–224. [Google Scholar] [CrossRef] [Green Version]
  8. Gabitto, J.; Tsouris, C. Carbon Dioxide Absorption Modeling for Off-Gas Treatment in the Nuclear Fuel Cycle. Int. J. Chem. Eng. 2018, 2018, 3158147. [Google Scholar] [CrossRef]
  9. Versteeg, G.F.; Holst, J.V.; Politiek, P.P.; Niederer, J.P. CO2 Capture from Flue Gas using Amino Acid Salt Solutions [Online], June 2006. Available online: http://www.co2-cato.nl/doc.php?lid=317 (accessed on 4 September 2018).
  10. van Holst, J.; Versteeg, G.F.; Brilman, D.W.F.; Hogendoorn, J.A. Kinetic Study of CO2 with Various Amino Acid Salts in Aqueous Solution. Chem. Eng. Sci. 2009, 64, 59–68. [Google Scholar] [CrossRef]
  11. Vaidya, P.D.; Konduru, P.; Vaidyanathan, M.; Kenig, E.Y. Kinetics of Carbon Dioxide Removal by Aqueous Alkaline Amino Acid salts. Ind. Eng. Chem. Res. 2010, 49, 11067–11072. [Google Scholar] [CrossRef]
  12. Portugal, A.F.; Derks, P.W.J.; Versteeg, G.F.; Magalhães, F.D.; Mendes, A. Characterization of Potassium Glycinate for Carbon Dioxide Absorption Purposes. Chem. Eng. Sci. 2007, 62, 6534–6547. [Google Scholar] [CrossRef]
  13. Shen, S.; Yang, Y.N.; Bian, Y.; Zhao, Y. Kinetics of CO2 Absorption into Aqueous Basic Amino Acid Salt: Potassium Salt of Lysine Solution. Environ. Sci. Technol. 2016, 50, 2054–2063. [Google Scholar] [CrossRef] [PubMed]
  14. Benamor, A.; JaberAl-Marri, M.; Khraisheh, M.; Nasser, M.S.; Tontiwachwuthikul, P. Reaction Kinetics of Carbon Dioxide in Aqueous Blends of N-methyl-diethanolamine and Glycine using the Stopped Flow Technique. J. Nat. Gas Sci. Eng. 2016, 33, 186–195. [Google Scholar] [CrossRef]
  15. Mahmud, N.; Benamor, A.; Nasser, M.S.; Al-Marri, M.J.; Qiblawey, H.; Tontiwachwuthikul, P. Reaction Kinetics of Carbon Dioxide with Aqueous Solutions of L-Arginine, Glycine & Sarcosine using the Stopped Flow Technique. Int. J. Greenh. Gas Control 2017, 63, 47–58. [Google Scholar]
  16. Brethomé, F.M.; Williams, N.J.; Seipp, C.A.; Kidder, M.K.; Custelcean, R. Direct Air Capture of CO2 via Aqueous-Phase Absorption and Crystalline-Phase Release using Concentrated Solar Power. Nat. Energy 2018, 3, 553–559. [Google Scholar] [CrossRef]
  17. Kasturi, A.S.; Ladshaw, A.; Yiacoumi, S.; Gabitto, J.; Garrabrant, K.; Custelcean, R.; Tsouris, C. CO2 Absorption from Simulated Flue Gas in a Bubble Column. Sep. Sci. Technol. 2019, 54, 2034–2046. [Google Scholar] [CrossRef]
  18. Jockenhöevel, T.; Schneider, R.; Rode, H. Development of an Economic Post-Combustion Carbon Capture Process. Energy Procedia 2009, 1, 1043–1050. [Google Scholar] [CrossRef] [Green Version]
  19. Gabitto, J.; Custelcean, R.; Tsouris, C. Simulation of Carbon Dioxide Absorption by Amino Acids in Two-Phase Batch and Bubble Column Reactors. Sep. Sci. Technol. 2019, 54, 2013–2025. [Google Scholar] [CrossRef]
  20. Seipp, C.A.; Williams, N.J.; Kidder, M.K.; Custelcean, R. CO2 Capture from Ambient Air by Crystallization with a Guanidine Sorbent. Angew. Chem. Int. Ed. Engl. 2017, 56, 1042–1045. [Google Scholar] [CrossRef] [PubMed]
  21. Williams, N.J.; Seipp, C.A.; Brethomé, F.M.; Ma, Y.-Z.; Ivanov, A.S.; Bryantsev, V.S.; Kidder, M.K.; Martin, H.J.; Holguin, E.; Garrabrant, K.A.; et al. CO2 Capture via Crystalline Hydrogen-Bonded Bicarbonate Dimers. Chem 2019, 5, 719–730. [Google Scholar] [CrossRef] [Green Version]
  22. Kasturi, A.; Gabitto, J.; Tsouris, C.; Custelcean, R. Carbon Dioxide Capture with Aqueous Amino Acids: Mechanistic Study of Amino Acid Regeneration by Guanidine Crystallization and Process Intensification. Sep. Purif. Technol. 2021, 271, 118839. [Google Scholar] [CrossRef]
  23. Kim, Y.-H.; Park, L.K.; Yiacoumi, S.; Tsouris, C. Modular Chemical Process Intensification: A Review. Annu. Rev. Chem. Biomol. Eng. 2017, 8, 359–380. [Google Scholar] [CrossRef] [PubMed]
  24. Simons, K.; Brilman, D.W.F.; Mengers, H.; Nijmeijer, K.; Wessling, M. Kinetics of CO2 Absorption in Aqueous Sarcosine Salt Solutions: Influence of Concentration, Temperature, and CO2 Loading. Ind. Eng. Chem. Res. 2010, 49, 9693–9702. [Google Scholar] [CrossRef]
  25. Xiang, Q.; Fang, M.; Yu, H.; Maeder, M. Kinetics of the Reversible Reaction of CO2 (aq) and HCO3- with Sarcosine Salt in Aqueous Solution. J. Phys. Chem. A 2012, 116, 10276–10284. [Google Scholar] [CrossRef] [PubMed]
  26. Versteeg, G.F.; van Swaaij, W.P.M. On the Kinetics between CO2 and Alkanolamines both in Aqueous and Non-Aqueous Solutions-I. Primary and Secondary Amines. Chem. Eng. Sci. 1988, 43, 573–585. [Google Scholar] [CrossRef] [Green Version]
  27. Morsi, B.I.; Basha, O.M. Mass Transfer in Multiphase Systems. In Mass Transfer-Advancement in Process Modelling; Solecki, M., Ed.; IntechOpen: London, UK, 2017. [Google Scholar]
  28. Perry, R.H.; Green, D.W. Chemical Engineers Handbook, 7th ed.; McGraw-Hill: New York, NY, USA, 1999. [Google Scholar]
  29. Greer, T.; Bedelbayev, A.; Igreja, J.M.; Pereira Gomes, J.F.; Lie, B. A Dynamic Model for the De-Absorption of Carbon Dioxide from Monoethanolamine Solution. Proc. SIMS 2008, 2008, 7–8. [Google Scholar]
  30. Tavlarides, L.L.; Lin, R.; Nan, Y.; Yiacoumi, S.; Tsouris, C.; Ladshaw, A.; Sharma, K.; Gabitto, J.; DePaoli, D. Sorption Modeling and Verification for Off-Gas Treatment; NEUP: Atlanta, GA, USA, 2015. Available online: https://neup.inl.gov/ (accessed on 4 July 2021). [CrossRef]
  31. Fukuma, M.; Muroyama, K.; Yasunishi, A. Properties of Bubble Swarms in a Slurry Bubble Column. J. Chem. Eng. Jpn. 1987, 20, 20–33. [Google Scholar] [CrossRef] [Green Version]
  32. Lemoine, R.; Behkish, A.; Sehabiague, L.; Heintz, Y.; Oukaci, R.; Morsi, B.I. An Algorithm for Predicting the Hydrodynamic and Mass Transfer Parameters in Bubble Column and Slurry in Bubble Column Reactors. Fuel Proc. Technol. 2008, 29, 322–343. [Google Scholar] [CrossRef]
  33. Sehabiague, L.; Lemoine, R.; Behkish, A.; Heintz, Y.; Sanoja, M.; Oukaci, R.; Morsi, B.I. Modeling and Optimization of a Large-Scale Bubble Column Reactor for Producing 10,000 bbl/day of Fischer-Tropsch Liquid Hydrocarbons. J. Chin. Inst. Chem. Eng. 2008, 38, 169–179. [Google Scholar] [CrossRef]
  34. Götz, M.; Lefevre, J.; Mörs, F.; Ortloff, F.; Reimert, R.; Bajohr, S. Novel Gas Holdup Correlation for Slurry Bubble Column Reactors Operated in the Homogeneous Regime. Chem. Eng. J. 2017, 308, 1209–1224. [Google Scholar] [CrossRef]
  35. de Swart, J.W.A.; an Vliet, R.E.; Krishna, R. Size, Structure and Dynamics of ‘Large’ Bubbles in a Two-Dimensional Slurry Bubble Column. Chem. Eng. Sci. 1996, 51, 4619. [Google Scholar] [CrossRef]
Figure 1. Experimental setup used for CO2 absorption experiments.
Energies 14 05821 g001
Figure 2. Time variation of CO2 concentration in gas phase measured at exit stream with and without GBIG.
Energies 14 05821 g002
Figure 3. Time evolution of amino acid compounds in liquid phase, red with GBIG present, black without GBIG present.
Energies 14 05821 g003
Figure 4. pH variation with time with and without GBIG present.
Energies 14 05821 g004
Figure 5. HCO3 concentration as a function of time with and without GBIG.
Energies 14 05821 g005
Figure 6. Comparison between experimental data and simulation results.
Energies 14 05821 g006
Figure 7. Comparison of the time variation of pH for experimental data and simulation results.
Energies 14 05821 g007
Publisher’s Note: MDPI stays neutral with regard to jurisdictional claims in published maps and institutional affiliations.

