Article

Influence of Fuel Type and Water Content Variation on Pollutant Emission Characteristics of a Biomass Circulating Fluidized Bed Boiler

School of Agricultural Engineering and Food Science, Shandong University of Technology, Zibo 255000, China
*
Author to whom correspondence should be addressed.
Energies 2021, 14(18), 5962; https://doi.org/10.3390/en14185962
Submission received: 9 August 2021 / Revised: 12 September 2021 / Accepted: 16 September 2021 / Published: 20 September 2021

Abstract

:
In general, the biomass raw materials burned by biomass power plants generally have the characteristics of variable fuel types, high moisture content, and high volatile content. In this paper, a 130 t/h biomass circulating fluidized bed (BCFB) model was established on the MWorks platform with Modelica language. The influence of biomass type changes on operation parameters, the corresponding steady-state characteristics, and the dynamic characteristics of the BCFB were carried out. The temperature corresponding to the combustion of pine was overall higher than that of the other fuels, and the flue gas from the combustion of pine had the highest concentration of SO2, up to 520.49 mg/Nm3. The flue gas from the combustion of pure cotton sticks had the highest concentration of NO, up to 254.34 mg/Nm3. The changes of fuel type and moisture content all have a great influence on the operation of BCFBs. The emission of pollutants was not only related to the element content of fuel, but also closely related to the furnace temperature. The fuel moisture content also indirectly affects the pollutant emission concentration and the steam-water system.

1. Introduction

Energy is an important material basis for the survival and development of human society. The extensive use of fossil energy has greatly promoted the development of society, but has also caused serious environmental pollution and greenhouse gas emissions [1]. Therefore, it has become the consensus of many countries to regard renewable energy and clean energy as an important part of the national energy structure. Among them, the utilization of biomass resources is considered to be one of the important ways to achieve carbon neutrality or negative CO2 emissions, which is of great significance to ecological environmental protection, climate change mitigation and energy security [2,3,4]. At present, the direct combustion is the most economical and effective technology for the large-scale utilization of biomass energy [5].
The global energy demand is expected to grow by 53% from current levels by 2030, with 70% coming from China, India and other developing countries, while carbon dioxide emissions will increase by 55% [6]. In the long run, replacing fossil fuels with more biomass fuels can significantly reduce the greenhouse effect and reduce the impact of energy shortages [7]. Replacing coal power generation with biomass power generation can significantly reduce environmental pollution. Many countries have also formulated relevant goals and roadmaps to gradually realize the transformation from coal-fired power plants to biomass power generation [8]. China is also trying to reduce the proportion of coal-fired power generation, encouraging the use of biomass instead of coal-fired power generation. By the end of 2020, the total installed capacity of biomass power generation in China has reached 15 million kilowatts [9].
With its unique advantages of fuel flexibility, low NOx emissions and high sulfur capture efficiency, the circulating fluidized bed (CFB) technology is expected to continue to be one of the main furnace types for biomass direct-fired power generation units in the future [10]. However, the biomass burned in the furnace generally has the characteristics of variable fuel types, high moisture content, high volatile fraction, high alkali metal and chlorine content, and low calorific value [11]. In particular, the variation of fuel type and quality will cause drastic changes in combustion process variables (such as the furnace temperature, main steam pressure and temperature, flue gas composition, emission pollutants, etc.). This easily leads to combustion instability, heating surface corrosion and slagging, and even bed material agglomeration causing fluidization state failure. It brings serious challenges to the safe and stable operation of the generation units and low pollutant emission. A thorough understanding of the dynamic characteristics of CFB boilers is the basis of operation optimization and parameter adjustment. However, due to the restriction of the safe operation and test costs of power plant units, modeling simulation has become an important tool to study the characteristics of power plant systems.
In the modeling of biomass circulating fluidized beds, the current research mainly focuses on the system modeling of biomass in coal mixed fuel, and the research on pure biomass direct combustion circulating fluidized bed systems is less. Krzywansk et al. [12,13,14] mainly studied the mixed combustion of coal-fired and biomass, and studied the effect of different proportions of the material and pulverized coal on the combustion characteristics and the generation of pollutants. It was concluded that the SO2 concentration increases with increasing the proportion of coal combustion, and it was pointed out that the precipitation of volatile fraction from biomass combustion is not instantaneous and varies with the combustion temperature, as well as the height of the furnace. Gungor [15] established a 2-D model of a circulating fluidized bed biomass combustion chamber with three aspects of flow, heat transfer, and combustion. The axial and radial distributions of porosity, particle size distribution, pressure drop, gas emission, and temperature of gas phase and solid phase in the bottom and upper regions at different time intervals were simulated. The experimental results of small and industrial biomass combustors with different biomass fuels were compared.
Modelica is an object-oriented declarative physical modeling language based on C language. In addition, Modelica inherits the advantages of many previous domain modeling languages, and integrates the object-oriented mechanism of Java language and the array expression mechanism of Matlab. Based on the idea of non-causal modeling, the Modelica language uses mathematical equations (groups) and object-oriented structures to promote the reuse of model knowledge [16]. Therefore, the mathematical model of a biomass circulating fluidized bed (BCFB) boiler system was constructed by using Modelica language in this paper.
Compared with coal, the content of chlorine in biomass is high, and the chloride gas generated during the combustion process causes the high-temperature corrosion of various alloys. However, many previous modeling work did not consider the precipitation and release of chlorine during biomass combustion. Therefore, the overall model of a 130 t/h BCFB was established on the Mworks with Modelica language in this paper. The release of the chlorine element was considered. The effects of different types and quality of biomass fuel on the furnace temperature, steam and water system, and pollutant emissions in the flue gas were studied.

2. Modeling

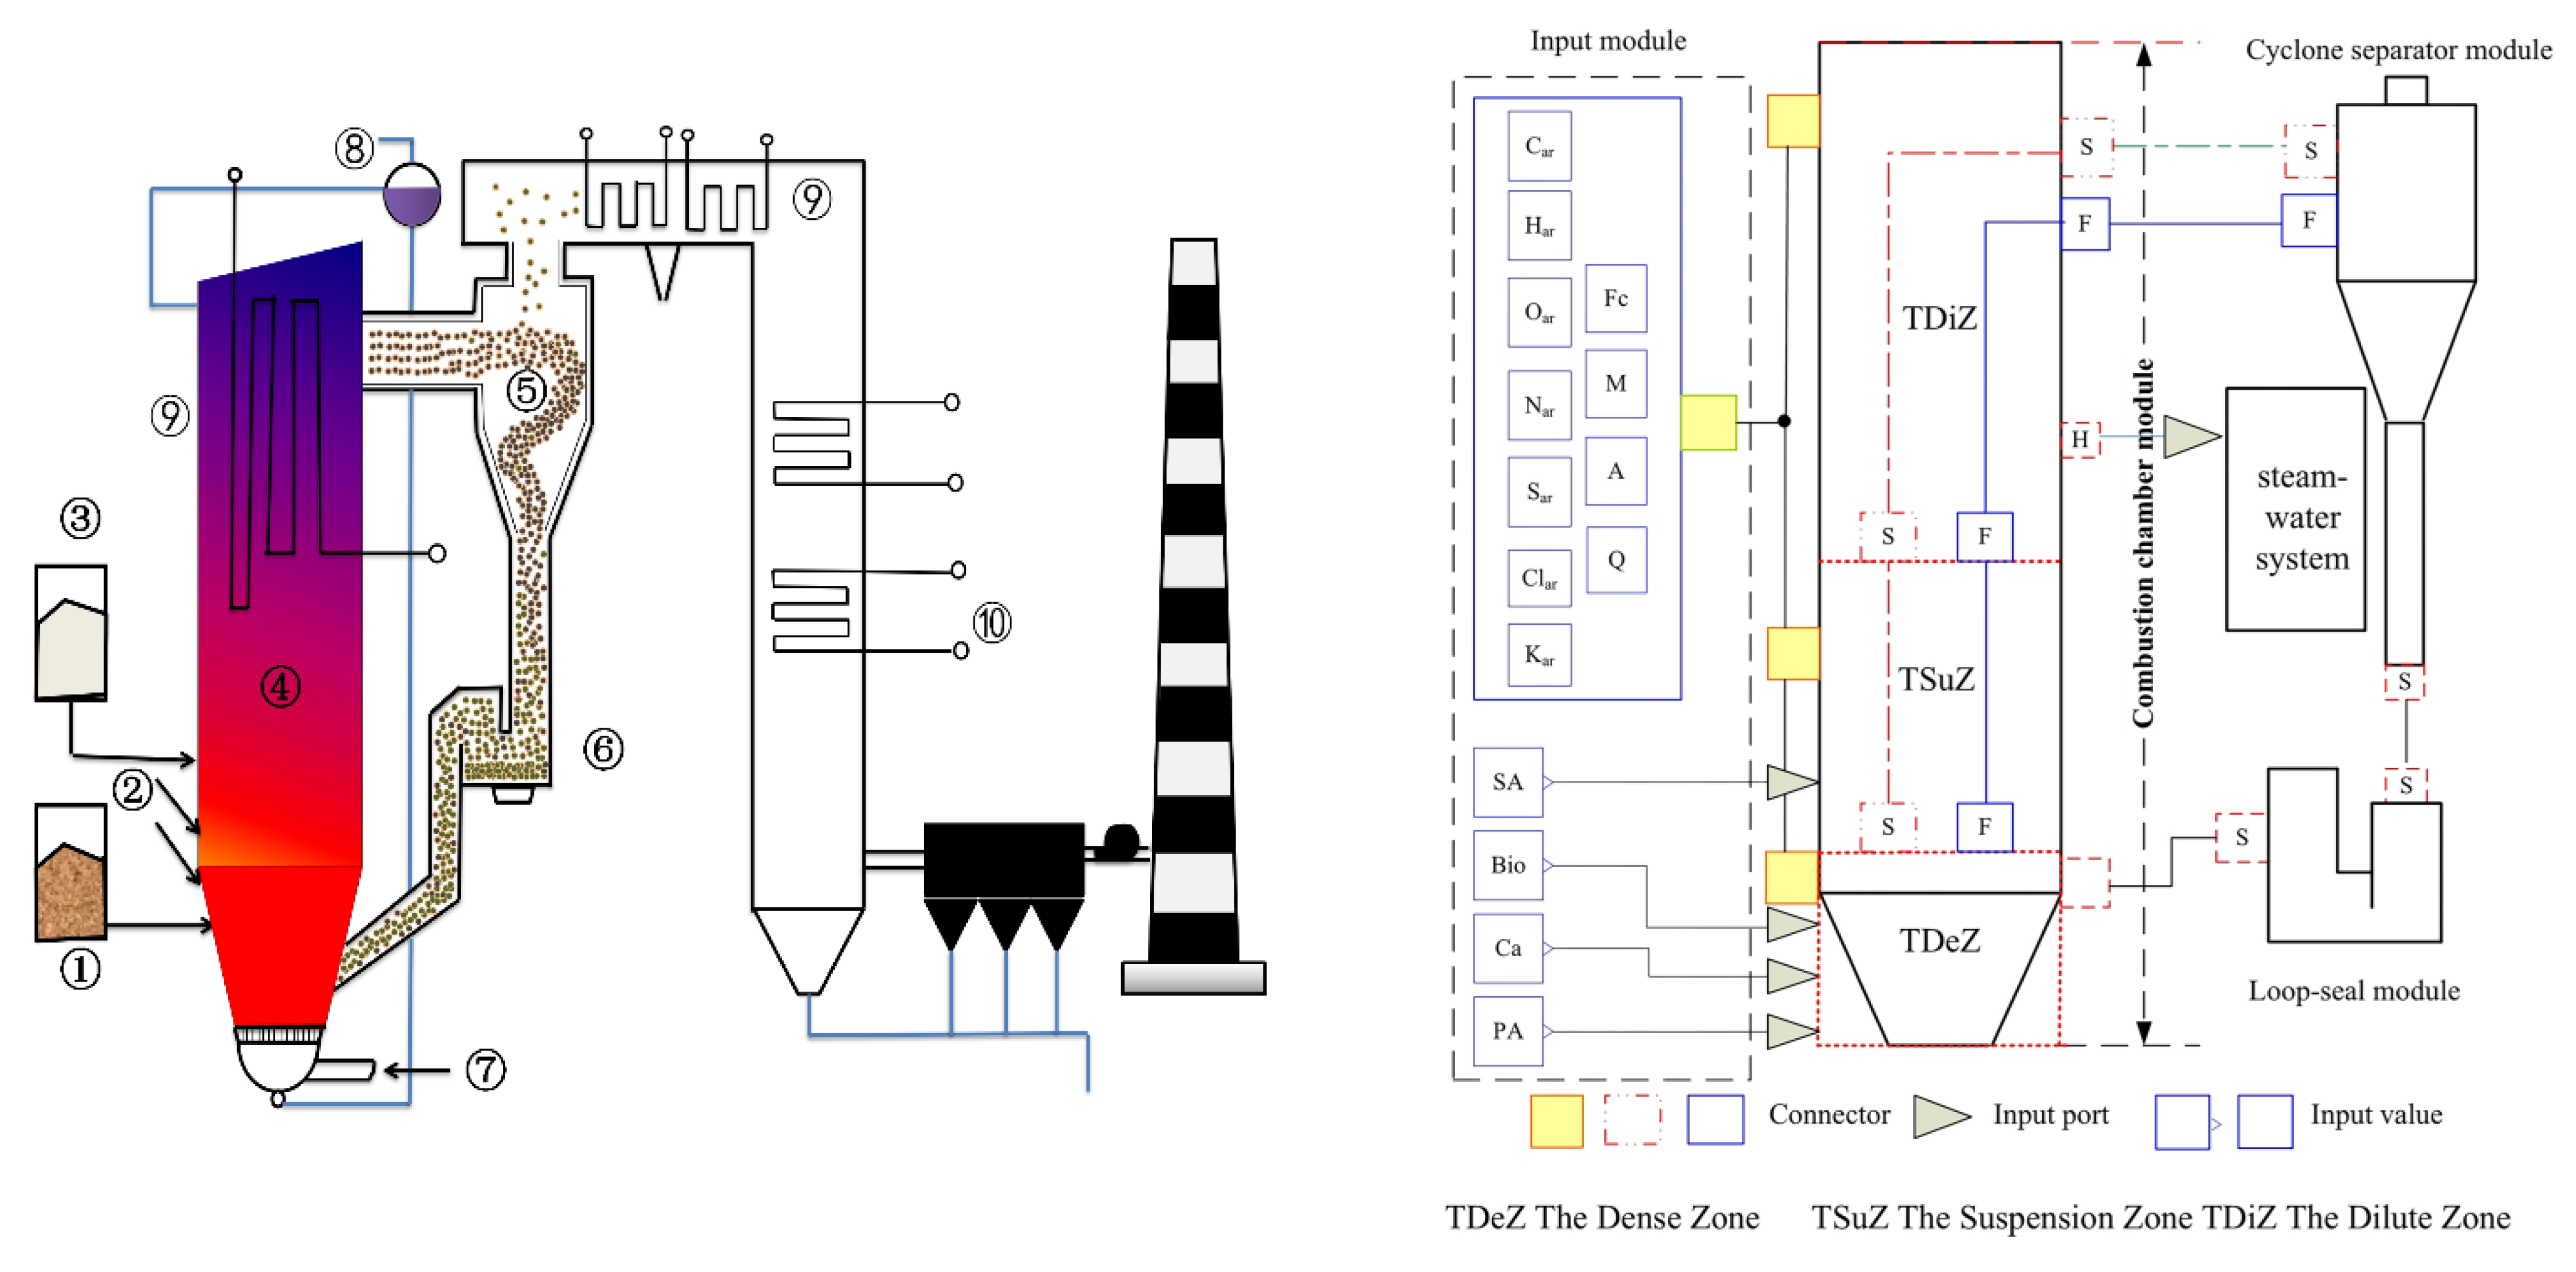
2.1. Combustion System Model

The furnace of a BCFB is a very complex system, including combustion, flow, heat transfer, and other physical and chemical processes in the furnace. Through reasonable simplification and assumptions, a mathematical model reflecting its dynamic characteristics was established, including a flow process model, combustion model, heat transfer model, desulfurization model, and an equal sub-model of mass and energy conservation.

2.1.1. Flow Model

The fluid dynamic characteristics determine the fluidization velocity in the circulating fluidized bed and the limit of variable working conditions, the energy consumption of the auxiliary machine, the heat transfer in the bed, the temperature distribution, the bed memory material, and the wear of the heating surface. Therefore, the gas-solid, two-phase fluid dynamics is the basis of the heat and mass transfer in the CFB.
The average diameter of bubbles at the interface of the dense phase zone is treated by bubble bed [17], and the calculation formula is as follows:
d B = 0.54 μ g 0.2 U 0 U m f 0.4 h d e n + 4 A B N n o s 0.8
where, h d e n   is the height of the dense phase region. N n o s   is the number of nozzles for distributors. A B   is the cross-sectional area of the furnace in zone. U m f Critical fluidization velocity.   U 0 is the apparent velocity of dense-phase bed gas. μ g is the dynamic viscosity of gas.
The critical fluidization velocity (Umf) is the minimum velocity that the fixed bed begins to transform to the fluidized bed. The calculation formula is [18]:
U m f = 0.249 d p 0.584 ϑ g 0.056 ρ p ρ g ρ g 0.528
where, d p , ϑ g , ρ p ,     ρ g are the bed material particle size, kinematic viscosity of fluidized gas, bed material particle density, and gas phase density, respectively.
The axial void fraction distribution in the dilute phase region proposed by Kunii et al is [19].
ε s = ε s , + ε s , d ε s , e a h h d e n
The product of the superficial gas velocity and the decay index is a constant.
a u 0 = c o n s t
a u 0 = 2 ~ 5 d s < 88   u m a u 0 = 4 ~ 12 d s 88   u m
Hiller gives an empirical correlation for calculating the decay index, which is considered to be related only to the apparent gas velocity and the diameter of the particles.
a U 0 = 200 d p 0.572
The volume fraction of solid particles above transport disengaging height (TDH) is:
ε s , = 1 + 6.15 ρ s g d p 0.5 u 0 u t 0.5 1 4.7

2.1.2. Combustion Model

Biomass combustion is divided into volatile combustion and coke combustion. The volatiles mainly include CO, CO2, H2, CH4, and C2H6. The combustion reaction equation and its kinetic equation are shown in Table 1 [20,21,22,23].
Where,   N C   is   the   number   of   particles , Φ   is a chemical reaction mechanical factor, which determines the concentration balance between CO and CO2, and is related to coke particle diameter dc and coke surface temperature Tc. K d   is diffusion reaction rate. K s   is the surface chemical reaction rate of coke.
The conversion rate of fuel NO can be calculated by the following empirical formula [24]:
X N O = 2.8412 × 10 4 Z 3 + 0.0136 Z 2 0.3063 Z + 15.756
where, Z = 100 X V P 30.637.   X N O is the conversion of NO, %.  X V P is the volatile content.
Assuming that all the sulfur elements contained in biomass are oxidized to SO2 and released in the dense phase region. The reaction processes are as follows [25]:
S + O 2 S O 2
C a C O 3 C a O + C O 2
C a O + S O 2 + 1 2 O 2 C a S O 4  
The SO2 removal rate is as follows:
r S O 2 = γ S O 2 64 M C a ρ C a k v C SO 2
k v = 490 exp 17500 R T S R γ 1  
where, r S O 2 is removal rate of SO2, mol/(m3•s). M C a is the limestone accumulation amount, kg. ρ C a is the density of limestone, kg/m3>. γ 1 is the activity coefficient of limestone, γ 1 = 0.035 . C S O 2 is the molar of SO2 in flue gas, mol/m3. S R = 5.6 × 10 4 38.4 T , if T 1253. S R = 3.67 × 10 4 35.9 T , if T > 1253 K.
At present, a large number of studies [26,27,28,29] show that the chlorine mainly enters the gas phase in the form of HCl and KCl during the biomass combustion. At 700–900 °C, almost 100% chlorine enters the gas phase, while the potassium part enters the gas phase [30,31,32,33].
It is assumed that the chlorine is released in the dense phase region of the BCFB. The kinetic equation of solid chlorine conversion to gaseous chlorine is:
d X d τ = 3.32 × 10 2 e x p 18.8437 × 10 3 R T B 273.15 1 X
In this formula, X is the precipitation amount of chlorine in fuel of unit mass.   τ represents time. R is the ideal gas constant, 8.314 J/(mol•K). TB is the temperature of dense phase region, K.
The ratios of solid potassium to gaseous potassium in biomass fuels were 5% (700 °C), 10% (800 °C) and 30% (900 °C), respectively. The proportion of gaseous potassium at different temperatures was determined by the interpolation method. The yields of HCl and KCl in gas phase were calculated by the mass conservation method of each element.

2.1.3. Heat Transfer Model

The heat transfer coefficient between the fluidized bed and the heated surface is usually divided into three components.
h = h g c + h p c + h r a d
where h g c is the convective heat transfer coefficient of gas. h p c is the convective heat transfer coefficient of particles, and h r a d is the radiation heat transfer coefficient.
Gas convective heat transfer coefficient is calculated by the following formula [34]:
h g c = 0.009 λ g d p P r 1 / 3 A r 1 / 2
Prandt number P r and Archimedes number A r are calculated as follows:
P r = C p g μ g λ g
A r = ρ g ρ p ρ g g d p 3 μ g 2    
λ g = 0.02284 + 0.8445 × 10 4 T 273 + 0.1735 × 10 8 T 273 2    
where d p is the equivalent average particle size of gas-solid two-phase flow material. C p g is the constant pressure specific heat of flue gas.
Solid particle convective heat transfer below the formula calculation [35].
h p c = λ g d g 1 ε Z 1 e N
Z = ρ p C p 6 λ g g d p 3 ε ε m f 5 1 ε m f 1 ε
N = 4 1 + 2 σ d p ln 1 + d p 2 σ 1 C K Z
σ = 2 2 π R T M m λ g P 2 C p R M m 2 γ 1
γ = 1 1 + e 0.6 1000 T + 1 C A
where, ε is the average porosity. C A is a constant, and the value is 2.85. C p is the specific heat of the material. λ g is the flue gas thermal conductivity. σ is the average free travel of gas molecules. C K is constant, 2.6 in dense phase and 2.0 in dilute phase. R is a gas constant. T is the gas temperature. M m is the average molecular weight. P is pressure.
The radiative heat transfer between the bed and the heated surface occurs mainly between the high temperature particles and the heated surface. The radiative heat transfer in the CFB is not only related to the temperature of the heated surface, but also to the bed particle density, bed temperature, and other related and other physical quantities [36].
h r a d = σ T B 4 T W 4 1 ε b + 1 ε w 1 T B T W
where, T B is bed temperature. T W is the wall temperature of heating surface. σ is the Boltzmann constant, and the value is 5.672 × 10 8 W / m 2 K 4 .   ε b is the equivalent effective emissivities of the bed, 0.8. ε w is the effective emissivities of the wall, 0.78.

2.1.4. Mass and Energy Conservation Models

The mass conservation of solid in each interval is as follows:
d M i d τ = W i n , i W r , i + W g , i W o u t , i
where, M i is the accumulation of i interval solid.   W i n is the solid flow entering the i interval and W o u t , i is the solid flow leaving the i interval. W r , i is the solid amount consumed by the reaction in interval i, and W g , i is the amount of reaction production of solid in the i interval.
The following are the energy conservation equations for each region.
d T k d τ M p , k c p , k = Q f u e l , k + Q a i r , k + Q i n , k + Q Q o u t , k Q e x c , k
where,   T k is the temperature in each zone, K. M p , k is the inventory of solids in each zone, kg. c p , k is specific heat at constant pressure in each zone, J/(kg•k). Q f u e l , k is the energy that the fuel brings into each zone, J. Q air , k is the energy that air brings into each zone, J. Q in , k is the energy entering each zone, J. Q is the heat released by fuel combustion, J. Q o u t , k is the energy leaving each zone, J. Q e x c , k is the amount of heat exchanged between each zone and the heat exchange equipment, J.

2.2. Steam-Water System

2.2.1. Economizer Model

The economizer, superheater, and reheater of the BCFB boiler are important parts of the steam-water system. The working fluids in the heating surface are a unidirectional medium. The heat transfer process and characteristics are similar, that is, no phase transition occurs in the heat transfer process [37]. In the modeling process, a simplified modeling method was adopted. The working fluid is regarded as a homogeneous medium, and the system modeling is carried out by using the piecewise lumped parameter method. The modeling process of the economizer is as follows:
The mass conservation equation is as follows:
V s m d ρ d τ = D s m 1 D s m 2  
where V s m represents the total volume of economizer, m3. d ρ   is   the   differential   of   the   water   supply   density .   τ represents time, s. D s m 1 and D s m 2 represent the import flow and export flow of economizer respectively, kg/s.
The following is the energy conservation equation:
V s m d   ρ H s m 2   d τ = D s m 1 H s m 1 D s m 2 H s m 2 + Q s m  
where, H s m 1 and H s m 2 represent the enthalpy of economizer inlet and outlet, respectively, kJ/kg. Q s m is the heat absorption of water supply in economizer from the wall metal, kJ/s.
The heat transfer formula is shown in (28)
Q s m = D s m 2   H s d H s m 1  
where, H s d   is the set value of economizer outlet under 100% BMCR, kJ/kg.

2.2.2. Second-Order Model of Evaporation Zone

The pressure change model is a typical second-order model, that is, the model contains two state variables. When the second-order model is used for the evaporation zone, the pressure dynamic characteristics under water supply disturbance, fuel disturbance, and load disturbance can be simulated in a real way. When the evaporation zone is described by a more complex model, it can be refined on the basis of the above second-order model [38]. The mass and energy conservation equations for two working fluids in the evaporation zone are listed below.
The mass conservation equation is as follows:
D s m D q b = d d τ   V l ρ l + V v ρ v
where, D s m represents the working fluid flow rate of the economizer into the evaporation zone, kg/s. D q b is the working fluid flow out of the evaporation zone, kg/s. V l   and   V v are the liquid volume in the evaporation zone and the gas volume in the evaporation zone, respectively, m3.
The following is the energy conservation equation:
Q q b + D l H l D v H v = d d τ   V l ρ l H l + V v ρ v H v P V q b + M t m C p T
where, Q q b is the total heat transfer in the furnace to the evaporation zone, kJ/s. D l and D v are flow rates of water and steam, kg/s, respectively. H l and H v are the enthalpy of water and steam, kJ/kg, respectively. V q b is the total volume of evaporation zone, m3. P is drum pressure, MPa.   M t m is effective metal mass, kg. C p is the metal specific heat, kJ/(kg K), the value is 0.45. T is the temperature of evaporation zone, K.
There are also the following volume relationships:
V q b = V l + V v

2.2.3. Calculation of Thermodynamic Properties of Water and Steam

The solution of the model also requires the calculation of the thermodynamic properties of water and steam. Modelica provides a set of standard working fluid library (Modelica. Media. Water) with a high calculation accuracy and fast calculation speed. Based on the IF97 formula (The IAPWS Industry Formulation 1997 for the thermodynamic properties of water and steam), the library provides a function library for solving the thermodynamic properties of water and steam [39,40]. The method of least squares fitting and other methods to solve the physical parameters may exceed the fitting range and lead to larger errors in the solution process. It is more efficient and accurate to call the IF97 formula in the standard library.

2.3. Simulation Model

The 130 t/h BCFB boiler (manufactured by Jinan Boiler Group Co., Ltd.No.8 Huanggang Road, Tianqiao District, Jinan City, Shandong Province, China) in a power plant was modeled. The combustion system is composed of a combustion chamber, a cyclone separator, and a U-shaped feed-back device. The structure and model structure of the circulating fluidized bed boiler are shown in Figure 1.
The calorific value of the combustion system is the coupling point with the steam-water system. The steam-water system matching with the 30 MW high-temperature and high-pressure extraction condensing turbine generator is composed of an economizer, evaporation zone, and a superheater. The boiler structure and parameters are introduced in reference [41]. In this paper, the composite biomass fuel was used as a raw material, and the steady-state output of the model was compared with the actual measured value, as shown in Table 2.
From Table 2, the relative error between the model output values and the actual measured values were within 7%. The relative errors of the economizer outlet temperature, drum pressure, superheater export temperature, outlet pressure of the superheater and main steam flow were within 0.4%. This means that the model established in this paper has a high reliability. The reason for the relatively large errors in the combustion-side parameters, such as bed temperature and oxygen content, is that the chemical reactions in the furnace are complex. In order to ensure the real-time nature of the model, a reasonable simplification of the model is made, and a control system will be added for error compensation in subsequent studies. Moreover, the reaction in the steam-water system is relatively simple, and the IF97 formula also makes the calculation more accurate.

3. Results and Discussion

The following five kinds of fuels were selected for the test. There were 40% bark + 30% sawdust + 20% split wood + 5% wheat straw + 5% corn straw (#1), pure broken wood (pine) (#2), pure cotton stalk (#3), pure corn stalk (#4), undried composite biomass (#5). Proximate and elemental analysis results of the five biomass fuels are shown in Table 3.
It can be seen from Table 3 that the nitrogen and chlorine contents in the cotton stalk fuel are the highest. Corn straw contains the highest sulfur potassium and ash content. The difference in the proximate analysis between fuel (#1) and fuel (#5) is mainly due to the change of water. The effect of moisture will be reported in Section 3.2.3.

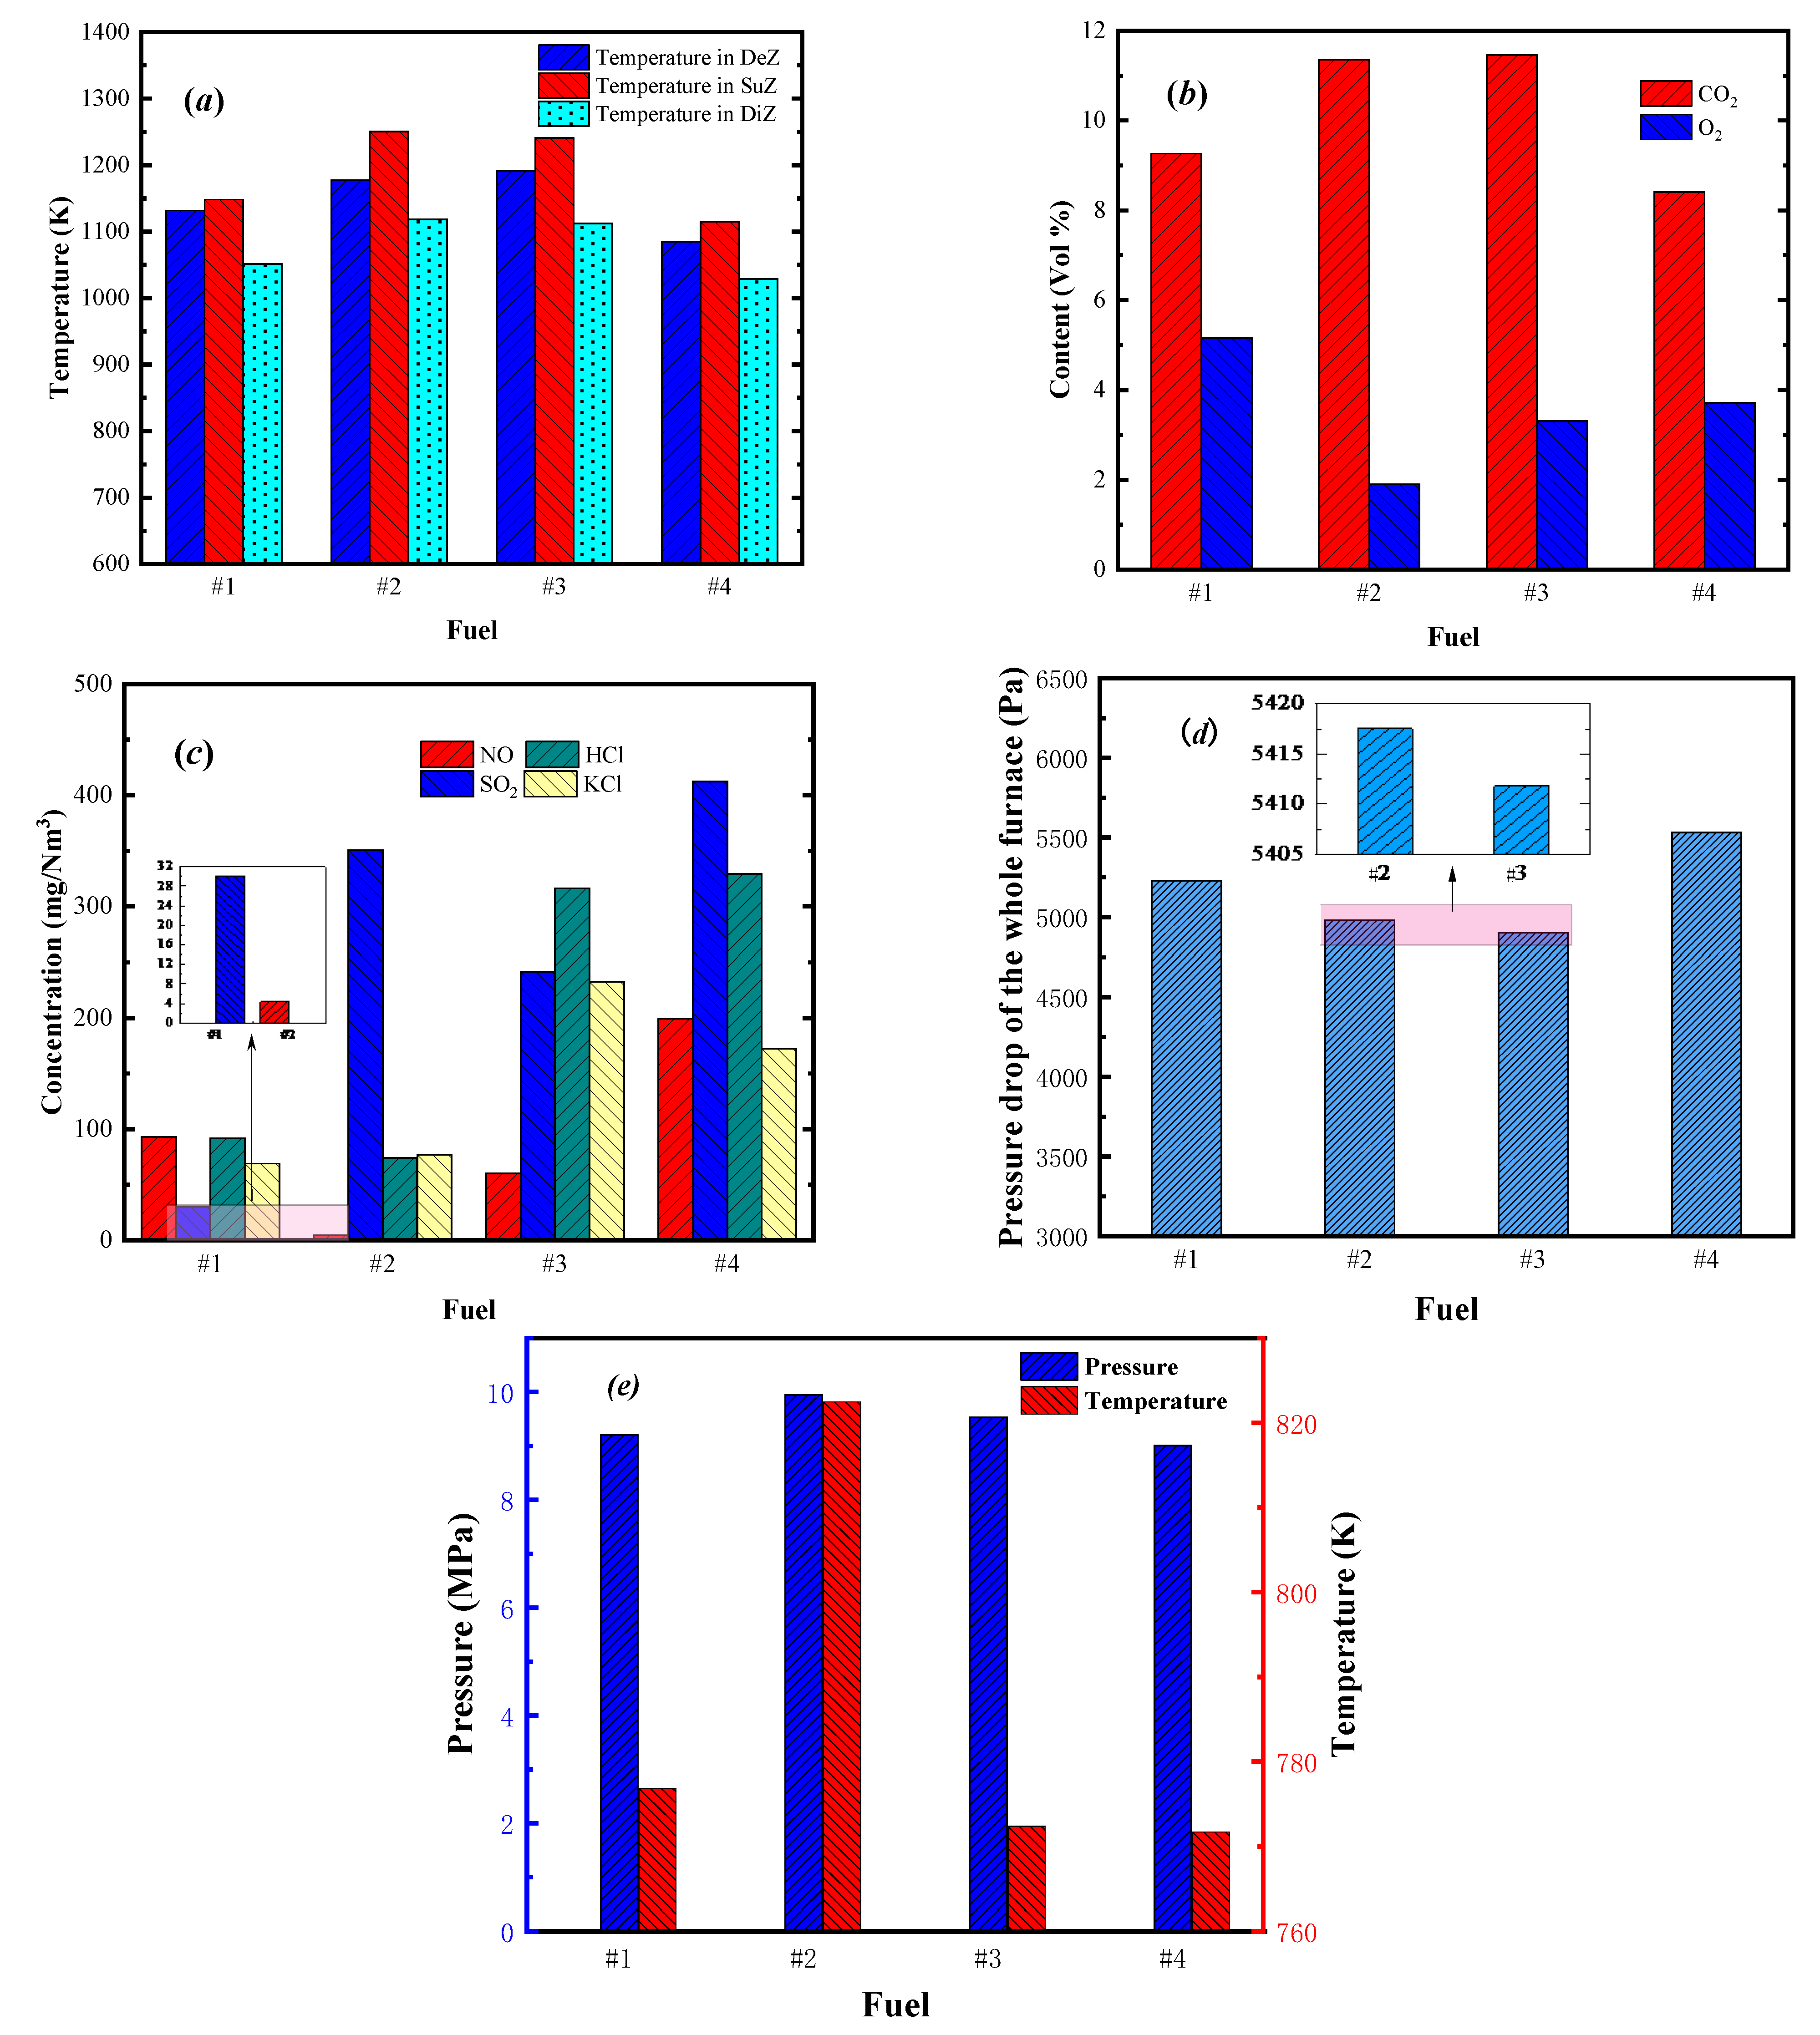
3.1. Steady-State Test

After the system is stable, the furnace temperature distribution is shown in Figure 2a. It can be seen that the temperature corresponding to the combustion of the biomass fuel pine was generally higher than that of other fuels, and the temperature difference in the suspension zone was more obvious. The reason may be that the combustion of fuel is mainly concentrated in the suspension zone. Figure 2b shows the output results of CO2 and O2 volume fraction in the flue gas when the four fuels are burned separately. Combined with Figure 2a, it can be seen that the CO2 and O2 volume fractions are closely related to the furnace chamber temperature. The (#2) fuel is burned with a high chamber temperature, high CO2 concentration in the flue gas, and a low oxygen content. It can be seen from Figure 2c that the concentrations of NO, HCl, and SO2 in the flue gas generated by the combustion of pure corn stalk (#4) were the highest. There were 199.47 mg/Nm3, 329.30 mg/Nm3 and 412.42 mg/Nm3, respectively. The concentration of KCl in the flue gas generated by the combustion of the cotton stalk (#3) was the highest, up to 232.56 mg/Nm3. The SO2 generated by the pine (#2) combustion was as high as 350.56 mg/Nm3. Combined with Table 3, the SO2 in the flue gas generated by burning the fuel with more sulfur elements was high, and the transformation of the NO from the cotton stalk to corn stalk has the opposite change. This is because the generation of NO is not only related to the nitrogen content of fuel, but also related to temperature, fuel combustion state, and combustion atmosphere in the furnace. When burning pure corn stalk (#4), the pressure dropped corresponding to the whole furnace pressure drop was the largest, which was 5966 Pa (Figure 2d). Figure 2e shows the comparison of the main steam pressure and the main steam temperature for the four fuels. The main steam pressure and the main steam temperature were corresponding to the furnace temperature. When the pine (#2) was used as fuel, the main steam pressure and temperature were higher than those of the other three fuels. The change of fuel has a more obvious effect on the main steam temperature.

3.2. Dynamic Test

The BCFB boiler combustion system, which is a complex system with significant nonlinearity, has a strong parameter coupling and a large combustion response hysteresis [42,43]. There are many factors that affect the BCFB boiler, such as primary air, secondary air, feed rate, slag discharge, and circulating ratio. The changes of these operating parameters have complex and staggered effects on the BCFB. It is difficult to obtain the coupling relationship between the above factors and the bed temperature, bed pressure, main steam pressure, temperature, and pollutant concentration in the flue gas through simple experiments. Therefore, it is necessary to carry out the dynamic characteristics experiment based on a numerical model.

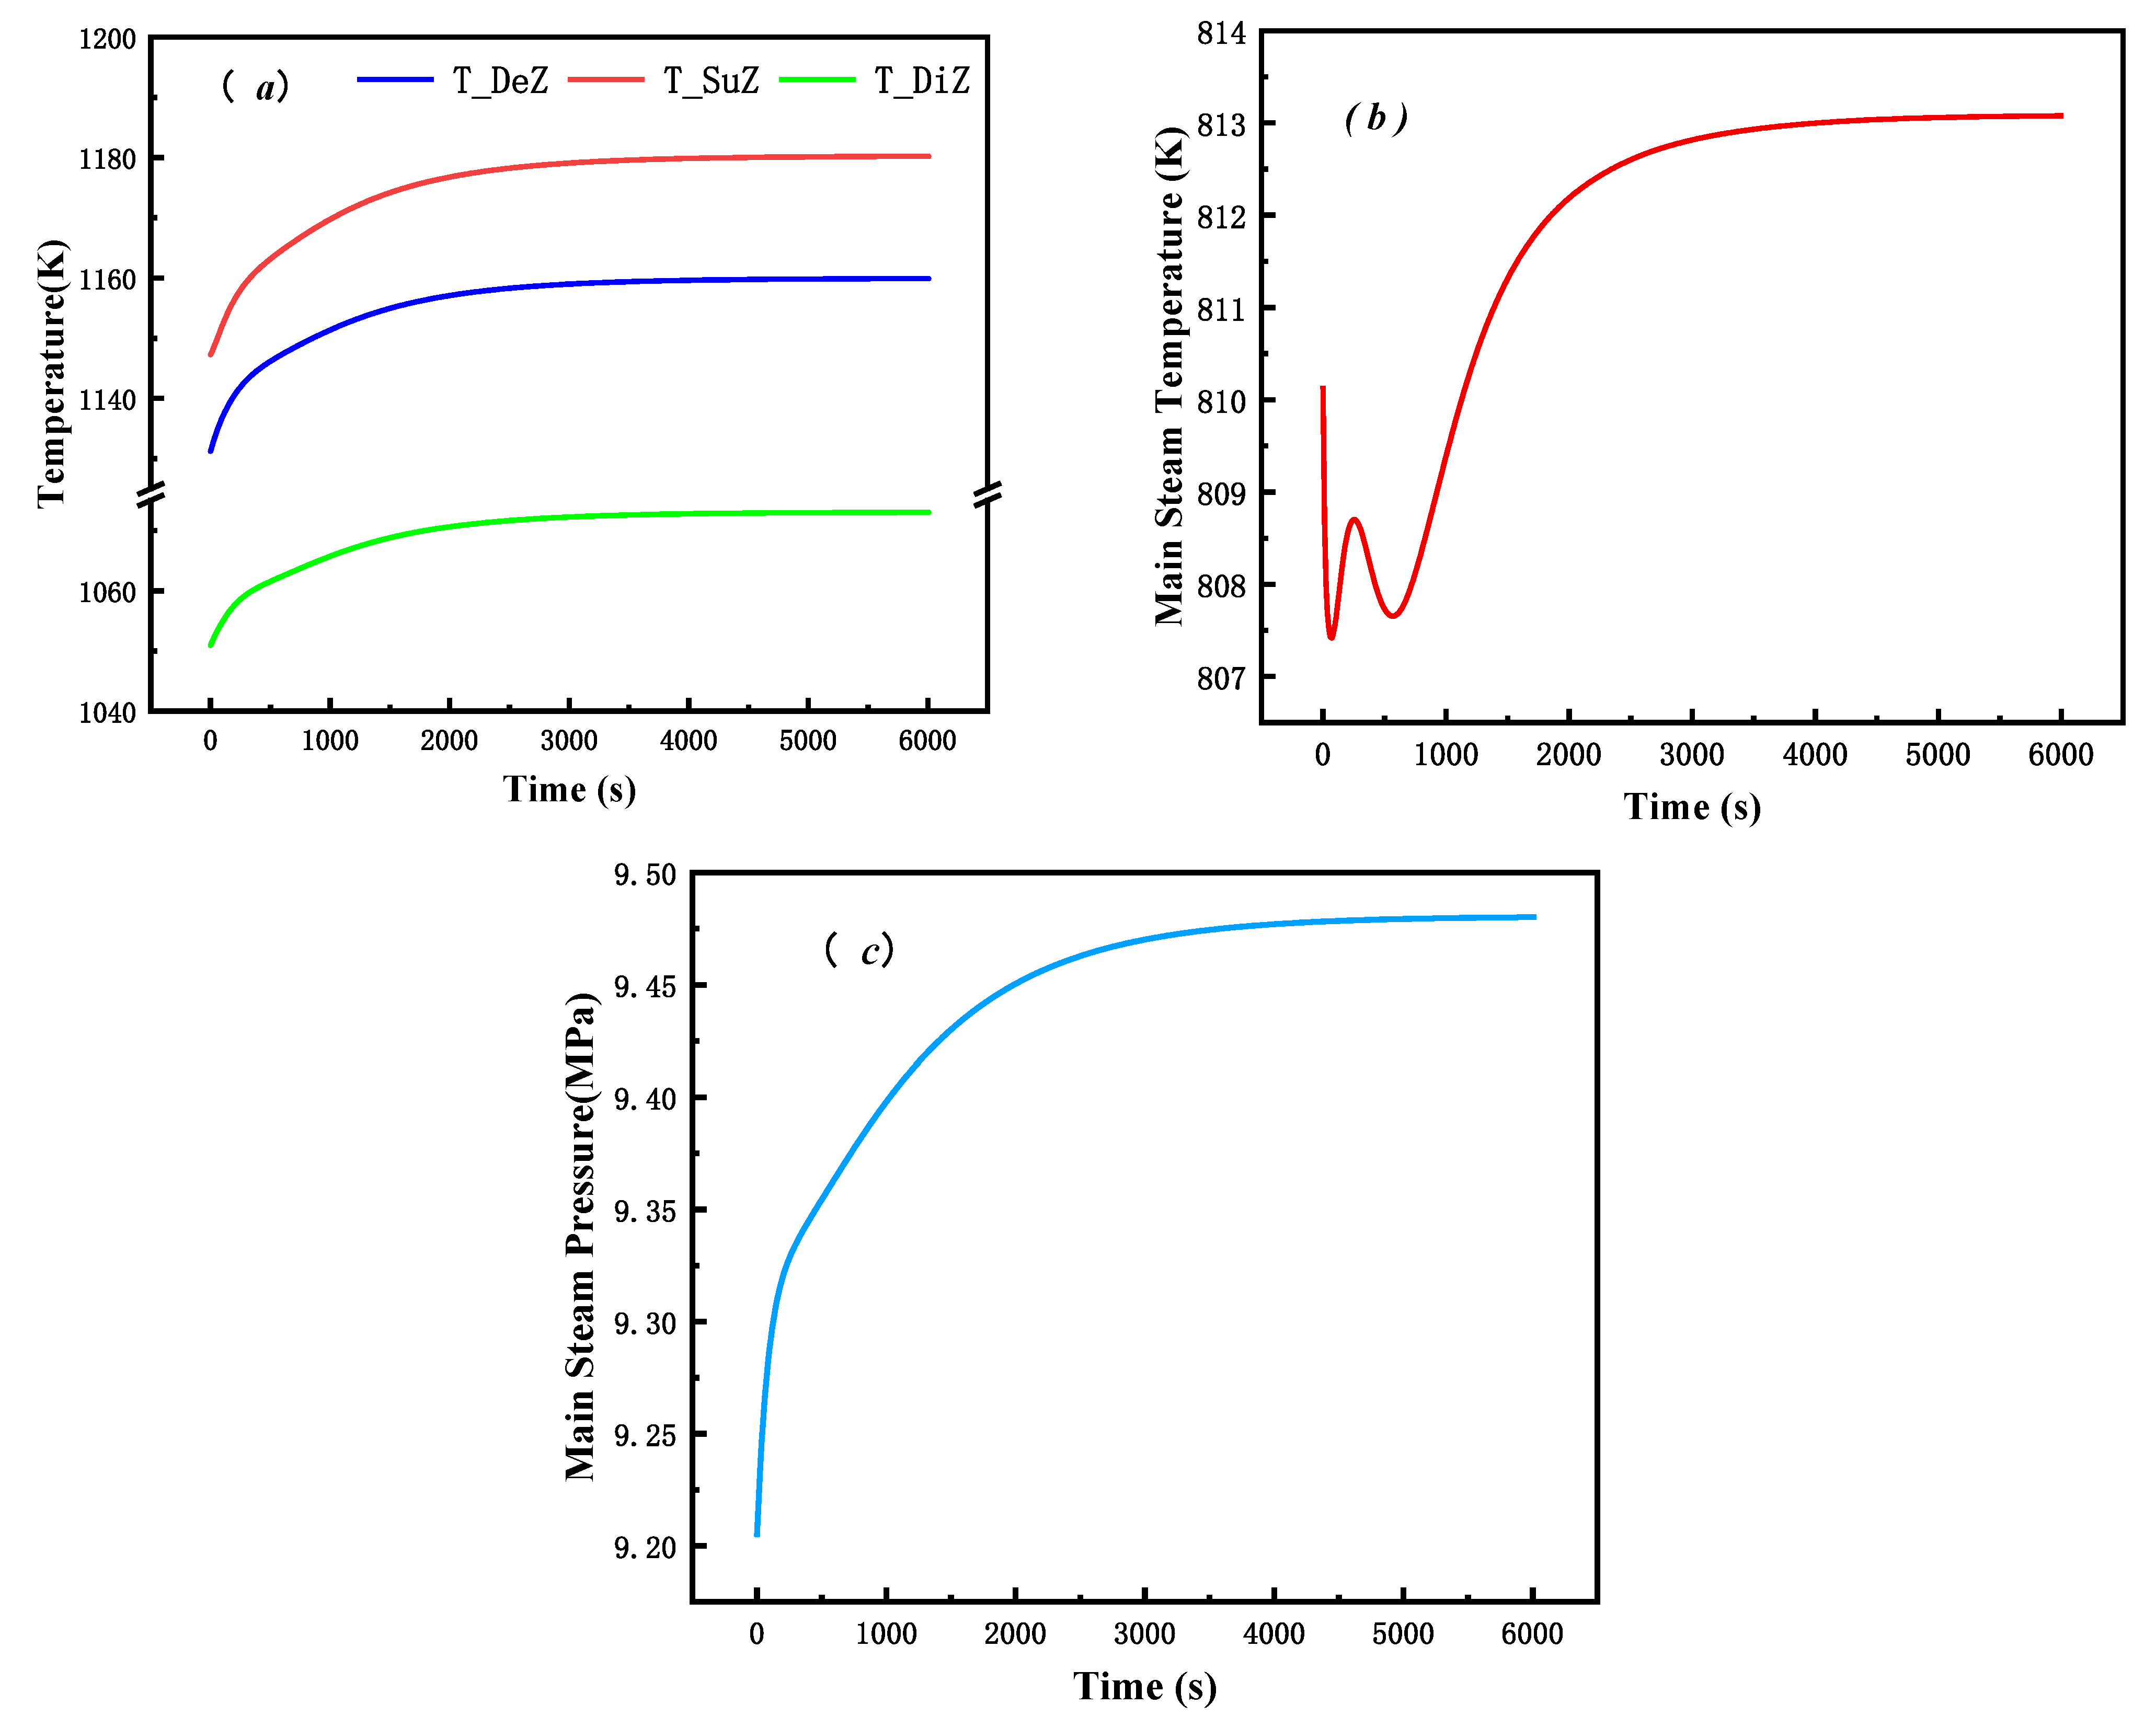
3.2.1. Verification of Dynamic Characteristics

Figure 3 shows the dynamic output of the model after reaching a steady state for the experiment using fuel (#1), where the increase in fuel volume is 5% and the increase in both primary and secondary air is 2.5%.
As shown in Figure 3a, the furnace temperature increased with the increase of the fuel quantity step. In Figure 3b,c, with the increase of the furnace temperature, the flue gas temperature and metal wall temperature were also increased. Therefore, the main steam pressure and the main steam temperature would increase. When the valve opening was a constant, the evaporation in the evaporation zone would also increase with the increase of temperature. Therefore, the flow rate entering the superheater increased instantaneously. The outlet temperature of the superheater would decrease instantaneously, and then the temperature gradually increased. The output results were basically consistent with the previous research results [44].

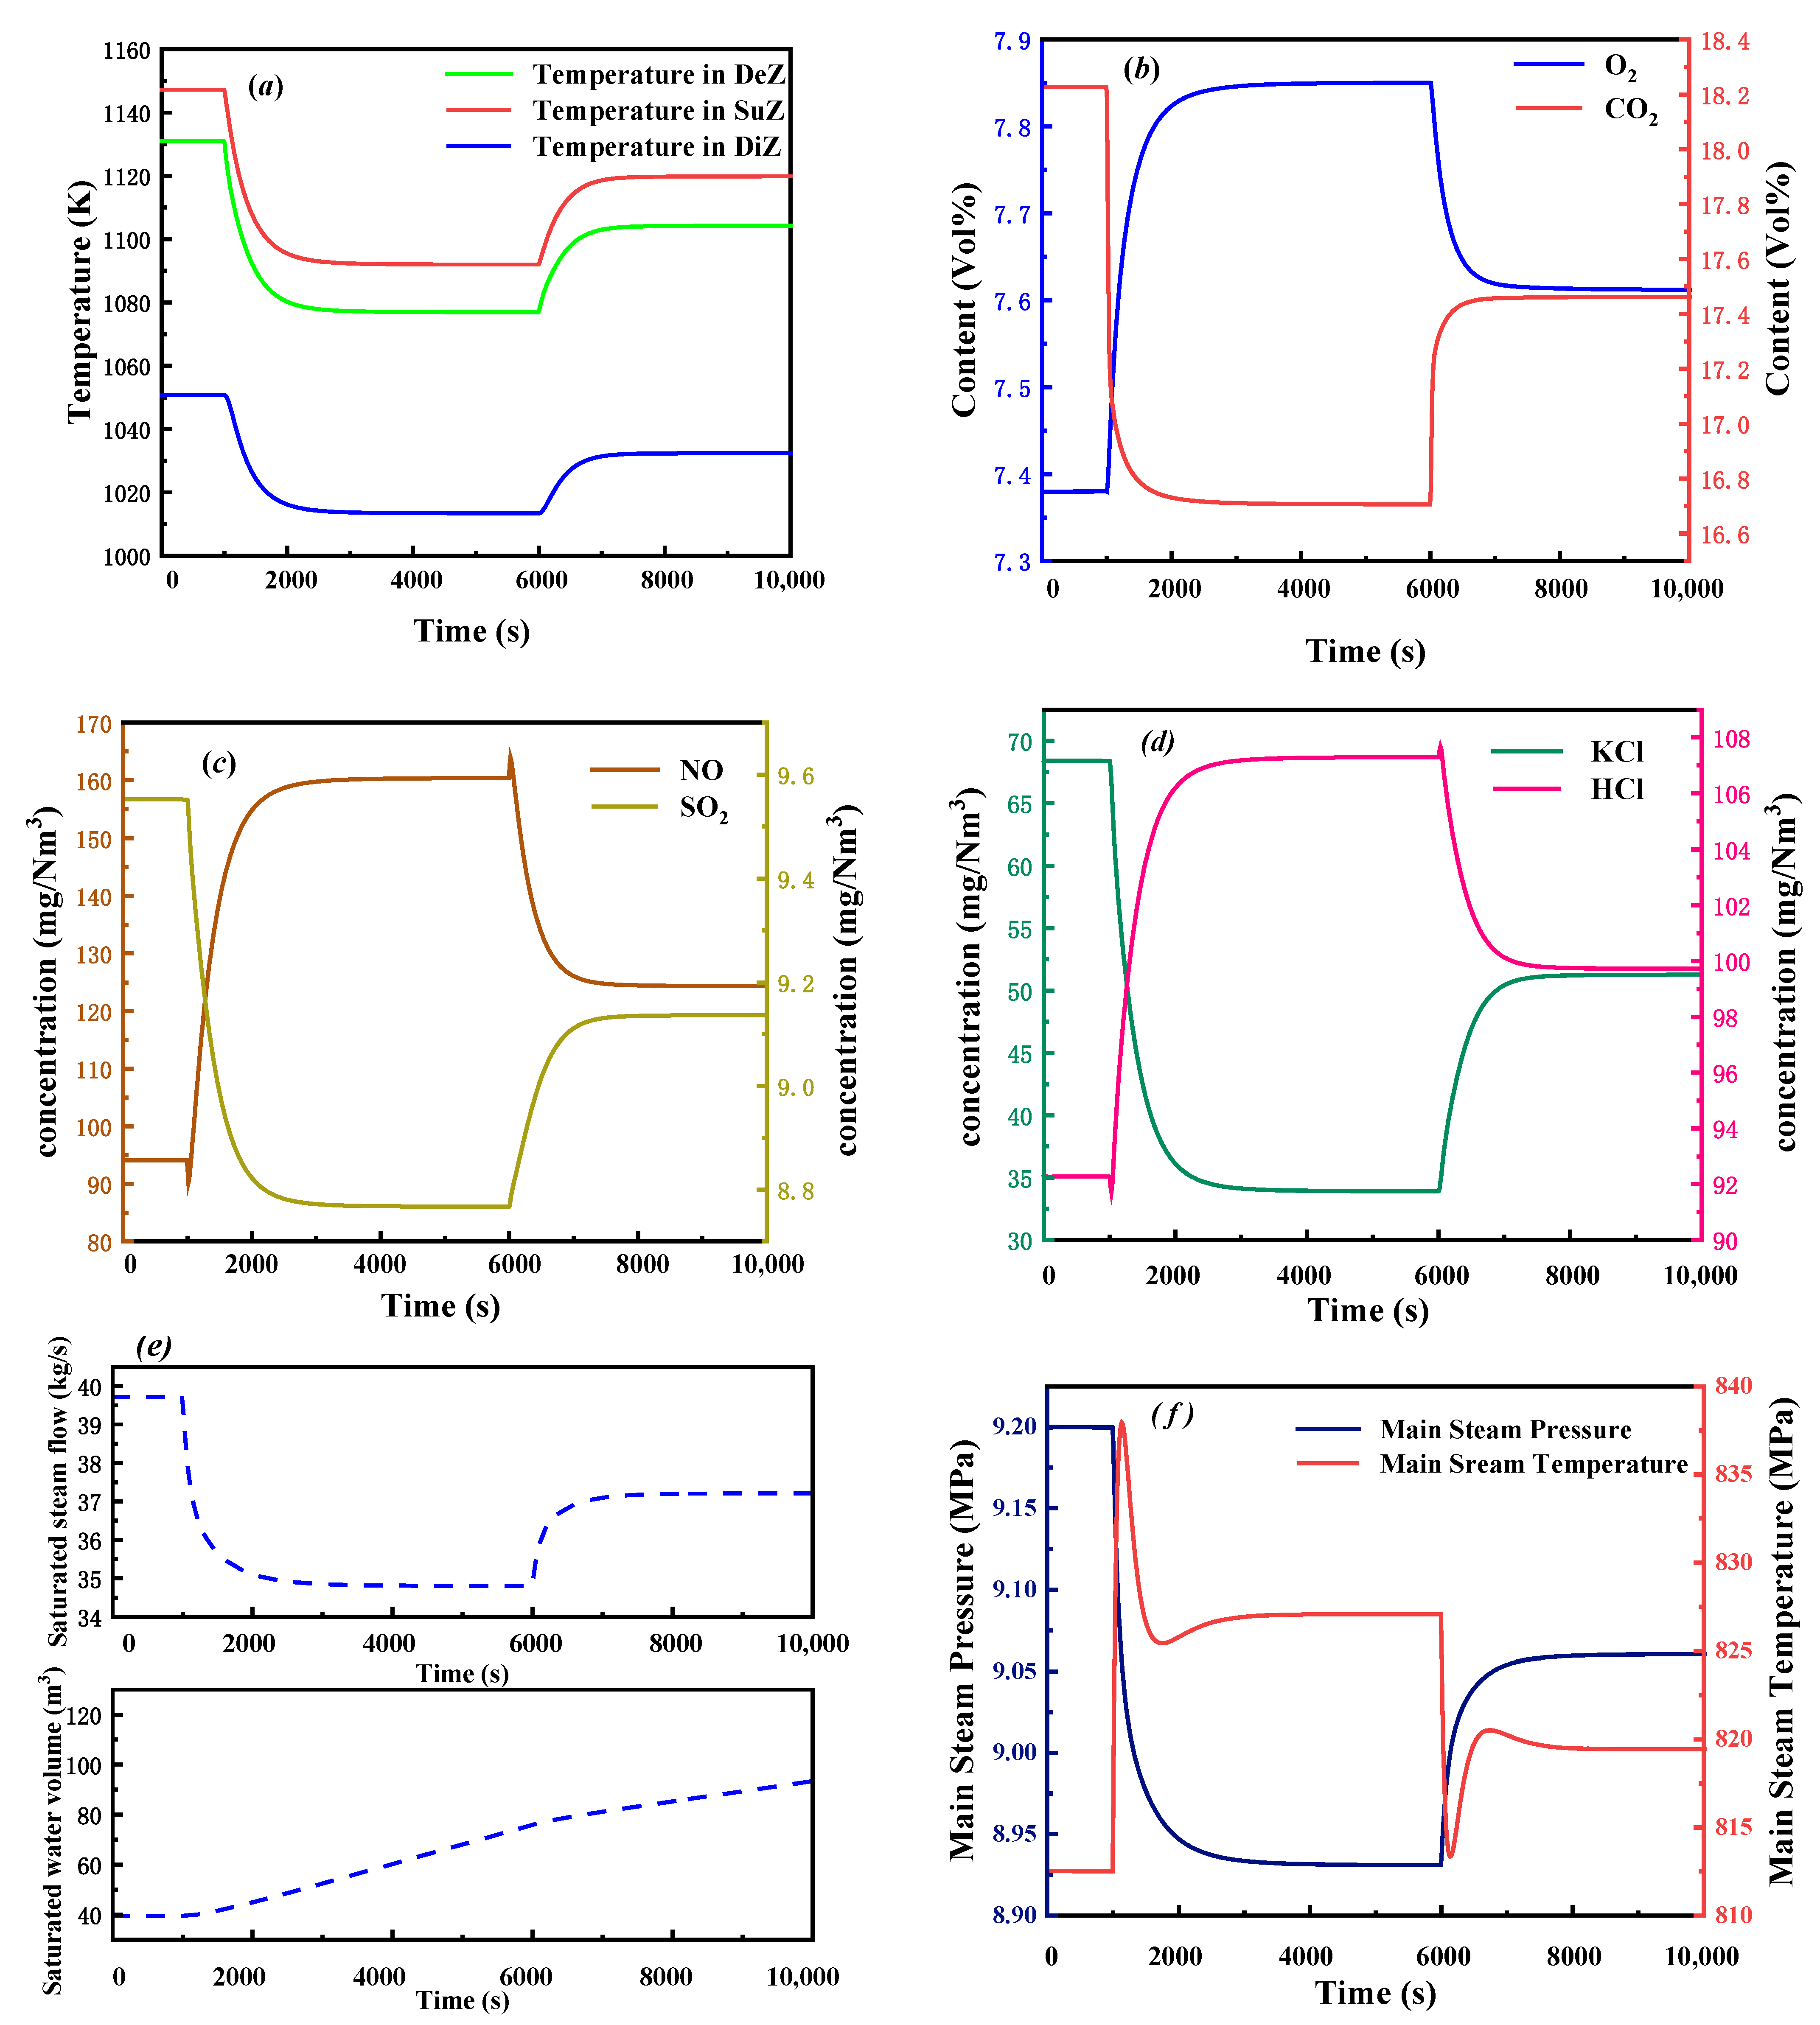
3.2.2. Dynamic Response of Fuel Variety Change

In order to explore the dynamic response of the boiler when the fuel type changes, it is assumed that the composite biomass fuel (#1) was used in the initial operation stage. After the system stabilizes for 1000 s, pure broken wood (pine) fuel (#2) was used due to the change of the biomass raw material source. Pure cotton rod fuel (#3) was used as the BCFB fuel after 6000 s, and pure corn stalk fuel (#4) was used after 11,000 s. The results are shown in Figure 4.
Figure 4a shows that the composite biomass (#1) was used in the initial operation stage, and pure broken wood (pine) (#2) was used after 1000 s, the furnace temperature decreased first and then increased due to the change of the biomass raw material source. After 6000 s, the whole temperature first increased and then decreased. After 11,000 s, the whole furnace temperature slowly decreased. Combined with Table 3, it is inferred that this phenomenon is related to the calorific value and moisture content of the fuel. When replacing biomass fuels, power plants should choose fuels with a similar calorific value and moisture content to avoid excessive fluctuations in operating conditions.
It can be seen from Figure 4b–d that the change of fuel type has a complex impact on the composition of the flue gas. The change trend of the CO2 concentration in the flue gas was consistent with that of the furnace temperature. The change of the oxygen content in the flue gas was opposite to the change trend of the CO2 concentration, except in the instantaneous positions. Figure 4c shows that there is a certain correlation between the variation of the NO concentration and oxygen content in the flue gas, indicating that the generation of NO is closely related to oxygen. When pure pine fuel (#2) was used as the fuel, the NO concentration in the flue gas decreased rapidly first, then slightly increased, and then slowly decreased to equilibrium. The SO2 concentration increased rapidly and then slowly decreased. When the fuel changes from pure broken pine (#2) to pure cotton stalk (#3), the NO concentration in the flue gas increased rapidly first, then decreased slowly and then increased slowly to reach equilibrium. The SO2 concentration decreased rapidly and then decreased slowly to reach equilibrium. When pure corn stalk fuel (#4) was used to replace pure cotton stalk fuel (#3), the NO concentration in the flue gas decreased rapidly first and then increased slowly to reach equilibrium, and the SO2 concentration increased rapidly and then increased slowly to reach equilibrium. It can be seen from Figure 4d that the variation trend of the HCl concentration in the flue gas is opposite to that of the KCl concentration, and the variation trend of the KCl concentration is generally consistent with that of the furnace temperature. In addition to the influence of the fuel element content, the combustion temperature of the furnace also has a great influence on the KCl concentration.
Figure 4e shows that the saturated steam flow rate changes with the furnace temperature. With the increase of the furnace temperature, the heat absorption in the evaporation zone increased, and the evaporation capacity increased. Under the condition of a constant main steam valve and water supply, the water volume in the drum decreased. When the pure corn stalk (#4) was replaced, the furnace temperature began to decrease. The evaporation capacity decreased, and the saturated water volume began to rise. The change of the furnace temperature has a great influence on the drum water level, so the real-time monitoring and control of the water level is of great significance for the safe operation of the boiler.
The changes of the main steam pressure and temperature were consistent with the changes of the furnace temperature (Figure 4f). In the dynamic process, the maximum main steam pressure was 10.42 MPa, and the maximum main steam temperature was 862 K. With the increase of temperature, the outlet flow of the evaporation zone would increase. The fluctuation of the main steam temperature is the result of the combined effect of the flue gas temperature and superheater inlet flow.

3.2.3. Dynamic Response of Fuel Moisture Content Change

In order to explore the dynamic response of the boiler when the moisture content changes, the composite biomass fuel (#1) and the undried composite biomass fuel (#5) were used to carry out the experiment. It is assumed that the fuel (#1) was used in the initial stage, the fuel (#5) was replaced after 1000 s, and the fuel (#1) and fuel (#5) 1:1 mixed combustion was used after 5000 s (denoted as #6). The results are shown in Figure 5.
It can be seen from Figure 5a that after the conversion from fuel (#1) to undried composite biomass (#5), the furnace temperature began to decrease. This effect on the temperature of the dense phase region was the most obvious, and the temperature decreased by 50 K. The effect on the temperature of the dilute phase region was small, and the temperature decreased by 33 K. After 6000 s, the mixed fuel (#6) was used instead, and the furnace temperature began to rise. The change of the fuel moisture content has a significant impact on the furnace temperature.
When the fuel moisture content increases, due to the decrease of the furnace temperature, the combustion becomes mild, the concentration of CO2 decreased, and the concentration of O2 increased (Figure 5b). With the decrease of the furnace temperature, the concentrations of the KCl and SO2 decreased significantly, and the concentrations of the HCl and NO increased significantly (Figure 5c,d). The concentration of the pollution gas is closely related to the furnace temperature. The change of the fuel moisture content affects the emission of pollution gas by affecting the furnace temperature.
It can be seen from Figure 5e that with the decrease of the furnace temperature, the heat absorption in the evaporation zone decreased, and the evaporation decreased. Under the condition of a constant water supply and valve opening, the saturated water volume in the drum increased, and the water level raised. When the fuel (#6) was used as a combustion fuel after 6000 s, the furnace temperature raised and the saturated steam flow increased, but it was still less than the flow of fuel (#1). The volume growth of the saturated water in the drum slowed down.
As shown in Figure 5f, the main steam pressure varies with temperature, while the response of the main steam temperature is somewhat complex. When the fuel (#1) suddenly changed into the fuel (#5), the saturated steam flow into the superheater suddenly decreased and the main steam temperature increased. But then the heat absorption of the superheater decreased and the main steam temperature decreased. When the fuel was replaced (#6), the saturated steam flow at the inlet of the superheater increased and the main steam temperature decreased. Then with the increase of the heat absorption of the superheater, the main steam temperature increased and finally stabilized. Due to the saturated steam flow being less than the initial value, the final main steam temperature was higher than the temperature of fuel (#1), and the change of the fuel moisture content had an obvious influence on the steam-water system.

4. Conclusions

Based on Modelica language, a 130 t/h biomass circulating fluidized bed model was established on an MWorks platform. The relative error between the model output values with the actual measured values was within 7%. The effect on the boiler when there is a sudden change in fuel type and moisture content was studied. The concentration of SO2 in the flue gas generated by pine combustion is the highest, up to 520.49 mg/Nm3, and the concentration of NO in the flue gas generated by pure cotton rod combustion is the highest, up to 254.34 mg/Nm3. The change trend of CO2 in the flue gas is consistent with that of the temperature, while the change trend of the oxygen content in the flue gas is opposite to that of CO2 in the flue gas. The change of NO in the flue gas is consistent with the change trend of oxygen content in the flue gas, indicating that the generation of NO is closely related to oxygen and furnace temperature. The main steam pressure is consistent with the main steam temperature and the furnace temperature, and the main steam temperature is greatly affected by the flow change. The change of fuel types and fuel moisture content have a great influence on the operation of the biomass circulating fluidized bed. The variation of the fuel moisture content has the greatest effect on the furnace chamber temperature in the dense phase zone.

Author Contributions

Research methodology, J.H. and S.L.; writing—original draft preparation, J.H. and Y.L.; writing—review and editing, D.Y. and R.K.; visualization, J.H., S.L. and Y.L. All authors have read and agreed to the published version of the manuscript.

Funding

This research was funded by National Natural Science Foundation of China (No. 51606113), Shandong Provincial Natural Science Foundation, China (No. ZR2020ME184), SDUT & Zhoucun City Integration Development Project (No. 2020ZCXCZH09).

Institutional Review Board Statement

Not applicable.

Informed Consent Statement

Not applicable.

Data Availability Statement

Not applicable.

Acknowledgments

Authors’ gratitude is extended to the prospective editor and reviewers that have spared time to guide toward a successful publication.

Conflicts of Interest

The authors declare no conflict of interest.

References

  1. Zhao, X.G.; Feng, T.T.; Ma, Y.; Yan, Y.S.; Pan, X.F. Analysis on investment strategies in China: The case of biomass direct combustion power generation sector. Renew. Sust. Energy Rev. 2015, 42, 760–772. [Google Scholar]
  2. Saidur, R.; Atabani, A.; Demirbaş, A.; Hossain, M.S. A review on biomass as a fuel for boilers. Renew. Sust. Energy Rev. 2011, 15, 2262–2289. [Google Scholar] [CrossRef]
  3. Nunes, L.; Loureiro, L.; Sá, L.; Silva, H. Evaluation of the potential for energy recovery from olive oil industry waste: Thermochemical conversion technologies as fuel improvement methods. Fuel 2020, 279, 118536. [Google Scholar] [CrossRef]
  4. Guo, F.; Zhong, Z. Co-combustion of anthracite coal and wood pellets: Thermodynamic snalysis, combustion efficiency, pollutant emissions and ash slagging. Environ. Pollut. 2018, 239, 21–29. [Google Scholar] [CrossRef] [PubMed]
  5. Peng, W.; Liu, Z.; Motahari-Nezhad, M.; Banisaeed, M.; Shahraki, S.; Beheshti, M. A detailed study of oxy-fuel combustion of biomass in a circulating fluidized bed (CFB) combustor: Evaluation of catalytic performance of metal nanoparticles (Al, Ni) for combustion efficiency improvement. Energy 2016, 109, 1139–1147. [Google Scholar] [CrossRef]
  6. Doherty, W.; Reynolds, A.; Kennedy, D. The effect of air preheating in a biomass CFB gasifier using ASPEN Plus simulation. Biomass Bioenerg. 2009, 33, 1158–1167. [Google Scholar] [CrossRef] [Green Version]
  7. Guan, Y.; Tai, L.; Cheng, Z.; Chen, G.; Yan, B.; Hou, L. Biomass molded fuel in China: Current status, policies and suggestions. Sci. Total Environ. 2020, 724, 138345. [Google Scholar] [CrossRef] [PubMed]
  8. Wu, X.; Shen, J.; Li, Y.; Wang, M.; Lawal, A. Flexible operation of post-combustion solvent-based carbon capture for coalfired power plants using multi-model predictive control: A simulation study. Fuel 2018, 220, 931–941. [Google Scholar] [CrossRef] [Green Version]
  9. Wang, Z.; Wang, Z.; Xu, G.; Ren, J.; Li, J. Sustainability assessment of straw direct combustion power generation in China: From the environmental and economic perspectives of straw substitute to coal. J. Clean. Prod. 2020, 273, 122890. [Google Scholar] [CrossRef]
  10. Li, D.; Wu, D.S.; Xu, F.G.; Lai, J.H.; Shao, L. Literature overview of Chinese research in the field of better coal utilization-ScienceDirect. J. Clean. Prod. 2018, 185, 959–980. [Google Scholar] [CrossRef]
  11. Tang, Y.; Wang, Z.; Liu, Q.; Jianzhong, L.I.; Jun, H.E.; Neng, H.E.; Liao, Z. Design of Biomass-fired Circulating Fluidized Bed Boiler. Gas Heat 2014, 34, 6–8. [Google Scholar]
  12. Krzywanski, J.; Rajczyk, R.; Bednarek, M.; Wesolowska, M.; Nowak, W. Gas emissions from a large scale circulating fluidized bed boilers burning lignite and biomass. Fuel Process. Technol. 2013, 116, 27–34. [Google Scholar] [CrossRef]
  13. Nevalainen, H.; Jegoroff, M.; Saastamoinen, J.; Tourunen, A.; Jänttib, T.; Kettunen, A.; Johnsson, F.; Niklasson, F. Firing of coal and biomass and their mixtures in 50 kW and 12 MW circulating fluidized beds–phenomenon study and comparison of scales. Fuel 2007, 86, 2043–2051. [Google Scholar] [CrossRef]
  14. Gungor, A. Simulation of co-firing coal and biomass in circulating fluidized beds. Energy Convers. Manag. 2013, 65, 574–579. [Google Scholar] [CrossRef]
  15. Gungor, A. Two-dimensional biomass combustion modeling of CFB. Fuel 2008, 87, 1453–1468. [Google Scholar] [CrossRef]
  16. Sodja, A.; Škrjanc, I.; Zupančič, B. Cyber-physical modelling in Modelica with model-reduction techniques. J. Syst. Softw. 2020, 163, 110517. [Google Scholar] [CrossRef]
  17. Darton, R.C.; Lanauze, R.D.; Davidson, J.F.; Harrson, D. Bubble-growth due to coalescence in fluidized-beds. Trans. Inst. Chem. Eng. 1977, 55, 274–280. [Google Scholar]
  18. Wen, C.Y.; Yu, Y.H. A generalized method for predicting the minimum fluidization velocity. Aiche. J. 1966, 12, 610–612. [Google Scholar] [CrossRef]
  19. Kunii, D.; Levenspiel, O. Entrainment of solids from fluidized beds I. Hold-up of solids in the freeboard II. Operation of fast fluidized beds. Powder Technol. 1990, 61, 193–206. [Google Scholar] [CrossRef]
  20. Xie, J.; Zhong, W.; Shao, Y.; Liu, Q.; Liu, L.; Liu, G. Simulation of Combustion of Municipal Solid Waste and Coal in an Industrial-Scale Circulating Fluidized Bed Boiler. Energy Fuels 2017, 31, 14248–14261. [Google Scholar] [CrossRef]
  21. Zhong, W.; Xie, J.; Shao, Y.; Liu, X.; Jin, B. Three-dimensional modeling of olive cake combustion in CFB. Appl. Therm. Eng. 2015, 88, 322–333. [Google Scholar] [CrossRef]
  22. Hong, X.; Bai, J.; Wu, Y.; Wang, J.; Zhang, G. Dynamic simulation of a large scale 260 t/h CFB boiler based on SIMUCAD platform. In Proceedings of the 2009 ISECS International Colloquium on Computing, Communication, Control, and Management, Sanya, China, 8–9 August 2009; pp. 246–249. [Google Scholar]
  23. Svoboda, K.; Hartman, M.; Pohořelý, M.; Trnka, O. Modelling of effects of operating conditions and coal reactivity on temperature of burning particles in fluidized bed combustion. Acta Geodyn. Geomater. 2004, 1, 261–274. [Google Scholar]
  24. Thomson, T.M.; Khalid, H.; Lozano, J.J.; Sancho, E.; Delfosse, L. Modelling of gaseous pollutants emissions in circulating fluidized bed combustion of municipal refuse. Fuel 1998, 77, 1399–1410. [Google Scholar]
  25. Krzywanski, J.; Czakiert, T.; Blaszczuk, A.; Rajczyk, R.; Muskala, W.; Nowak, W. A generalized model of SO2 emissions from large- and small-scale CFB boilers by artificial neural network approach Part 2. SO2 emissions from large- and pilot-scale CFB boilers in O2/N2, O2/CO2 and O2/RFG combustion atmospheres. Fuel Process Technol. 2015, 139, 73–85. [Google Scholar] [CrossRef]
  26. Cao, W.; Martí-Rosselló, T.; Li, J.; Lue, L. Prediction of potassium compounds released from biomass during combustion. Appl. Energy 2019, 250, 1696–1705. [Google Scholar] [CrossRef]
  27. Wang, X.; Hu, Z.; Adeosun, A.; Liu, B.; Ruan, R.; Li, S.; Tan, H. Particulate matter emission and K/S/Cl transformation during biomass combustion in an entrained flow reactor. J. Energy Ins. 2018, 91, 835–844. [Google Scholar] [CrossRef]
  28. Johansen, J.M.; Jakobsen, J.G.; Frandsen, F.J.; Glarborg, P. Release of K, Cl, and S during Pyrolysis and Combustion of High-Chlorine Biomass. Energy Fuel 2011, 25, 4961–4971. [Google Scholar] [CrossRef] [Green Version]
  29. Wang, Q.; Chen, J.; Han, K.; Wang, J.; Lu, C. Influence of BaCO3 on chlorine fixation, combustion characteristics and KCl conversion during biomass combustion. Fuel 2017, 208, 82–90. [Google Scholar] [CrossRef]
  30. Anca-Couce, A.; Sommersacher, P.; Hochenauer, C.; Scharler, R. Multi-stage model for the release of potassium in single particle biomass combustion. Fuel 2020, 280, 118569. [Google Scholar] [CrossRef]
  31. Lith, S.; Alonso-Ramirez, V.; Jensen, P.A.; Frandsen, F.J.; Glarborg, P. Release to the Gas Phase of Inorganic Elements during Wood Combustion. Part 1: Development and Evaluation of Quantification Methods. Energy Fuel 2006, 20, 964–978. [Google Scholar] [CrossRef]
  32. Lith, S.; Alonso-Ramirez, V.; Jensen, P.A.; Frandsen, F.J.; Glarborg, P. Release to the Gas Phase of Inorganic Elements during Wood Combustion. Part 2: Influence of Fuel Composition. Energy Fuel 2008, 22, 1598–1609. [Google Scholar] [CrossRef]
  33. Knudsen, J.N.; Jensen, P.A.; Dam-Johansen, K. Transformation and Release to the Gas Phase of Cl, K, and S during Combustion of Annual Biomass. Energy Fuel 2004, 18, 1385–1399. [Google Scholar] [CrossRef]
  34. Martin, H. Heat transfer between gas fluidized beds of solid particles and the surfaces of immersed heat exchanger elements, Part II. Chem. Eng. Process. 1984, 18, 157–169. [Google Scholar] [CrossRef]
  35. Badruddin, I.A.; Ahmed, N.; Al-Rashed, A.A.A.; Kanesan, J.; Kamangar, S.; Khaleed, H. Analysis of Heat and Mass Transfer in a Vertical Annular Porous Cylinder Using FEM. Transp. Porous Med. 2012, 91, 697–715. [Google Scholar] [CrossRef]
  36. Basu, P. Heat transfer in high temperature fast fluidized beds. Chem. Eng. Sci. 1990, 45, 3123–3136. [Google Scholar] [CrossRef]
  37. Ordys, A.W.; Pike, A.W.; Johnson, M.A.; Katebi, R.M.; Grimble, M.J. Modelling and Simulation of Power Generation Plants; Springer Science & Business Media: Berlin/Heidelberg, Germany, 1994. [Google Scholar]
  38. Strm, K.J.; Bell, R.D. Drum-boiler dynamics. Automatica 2000, 36, 363–378. [Google Scholar]
  39. Aleksandrov, A.A.; Petrova, T.I.; Ochkov, V.F.; Smetanin, D.S. Annual scientific session of the International Association on the Properties of Water and Steam (IAPWS). Therm. Eng. 2008, 55, 621–622. [Google Scholar] [CrossRef]
  40. Eborn, J. On Model Libraries for Thermo-Hydraulic Applications. Ph.D. Thesis, Lund University, Lund, Sweden, 2001. [Google Scholar]
  41. Liu, Y.; Pan, L.; Liu, S.; Wu, X.; Wang, S. Modeling and Dynamic Characteristics of the Dense Phase Region of a Biomass-fired Circulating Fluidized Bed Combustion System Using Modelica. BioResources 2020, 15, 7443–7457. [Google Scholar] [CrossRef]
  42. Xiong, Z.; Lin, Y.; Li, X.; Yang, J. Modelling of 330 MW Circulating Fluidized Bed Boiler System Based on Deep Belief Network. J. Physics. Conf. Ser. 2020, 1486, 022035. [Google Scholar] [CrossRef] [Green Version]
  43. Zhang, Y.; He, H.; Zhu, H.; Su, Z.; Hao, Y. Multivariable Control Strategy for Combustion System of Circulating Fluidized Bed Boiler. In Proceedings of the 2012 Asia-Pacific Power and Energy Engineering Conference, Shanghai, China, 27–29 March 2012. [Google Scholar]
  44. Chen, Y.; Gou, X. Dynamic modeling and simulation of a 410 t/h Pyroflow CFB boiler. Comput. Chem. Eng. 2007, 31, 21–31. [Google Scholar] [CrossRef]
Figure 1. Structure of 130 t/h circulating fluidized bed boiler with model structure schematic. ① Biomass fuel ② Secondary air ③ Limestone ④ Boiler chamber ⑤ Separator ⑥ U-shaped return valve ⑦Primary air. ⑧ Steam package ⑨ Superheater ⑩ Coal saver.
Energies 14 05962 g001
Figure 2. (a) furnace temperature distribution (b) O2, CO2 volume fraction (c) pollution gas mass concentration (d) overall furnace pressure drop (air distributor to furnace outlet) (e) main steam pressure and temperature.
Energies 14 05962 g002
Figure 3. (a) furnace temperature (b) main steam temperature (c) main steam pressure.
Energies 14 05962 g003
Figure 4. (a) furnace temperature response (b) O2, CO2 response (c) NO, SO2 response (d) KCl, HCl response (e) saturated steam flow and saturated water volume response (f) main steam pressure and main steam temperature response.
Energies 14 05962 g004
Figure 5. (a) Furnace temperature response (b) O2, CO2 response (c) NO, SO2 response (d) KCl, HCl response (e) Saturated steam flow and saturated water volume response (f) Main steam pressure and temperature response.
Energies 14 05962 g005
Table 1. Combustion reaction and kinetics equation.
Chemical ReactionReaction RateReaction Rate Constant
CO + 1 2 O 2 CO 2 r CO = k CO C CO C O 2 0.5 k CO = 1.0 × 10 15 exp 133027 R T
2 H 2 + O 2 2 H 2 O r H 2 = k H 2 C H 2 1.5 C O 2 k H 2 = 5.159 × 10 15 exp 28517 R T T 1.5
CH 4 + 2 O 2 CO 2 + 2 H 2 O r CH 4 = k CH 4 C CH 4 C O 2 k CH 4 = 3.552 × 10 14 exp 130530 R T T 1
C 2 H 6 + 5 2 O 2 2 CO + 3 H 2 O r C 2 H 6 = k C 2 H 6 C C 2 H 6 C O 2 k C 2 H 6 = 2.67 × 10 8 T 0.5 exp 20131 T
CO 2 + C 2 CO r CO 2 = N C π d c 2 k CO 2 C CO 2 k C O 2 = 4.1 × 10 6 exp 79787 T
Φ C + O 2 2 Φ 1 CO + 2 Φ CO 2 r c = 12 π d c 2 K c C O 2 K c = 1 1 K d + 1 K s
Table 2. Model reliability validation.
ParametersModel Output ValuesMeasured ValueRelative Error
Bed temperature of dense phase zone1132 K1058 K6.99%
Oxygen content of flue gas at furnace outlet5.19 %5.00%3.80%
NO concentration of flue gas at furnace outlet93.08 mg/Nm396.00 mg/Nm33.04%
SO2 concentration of flue gas at furnace outlet30.1 mg/Nm332.00 mg/Nm35.94%
Outlet temperature of
economizer
558.2 K560 K0.32%
Drum pressure10.49 MPa10.50 MPa0.10%
Outlet temperature of drum587.5 K588 K0.09%
Superheater export
temperature
812.5 K813 K0.06%
Outlet pressure of
superheater
9.19 MPa9.20 MPa0.11%
Main steam flow39.71 kg/s39.72 kg/s0.03%
Table 3. Proximate and Elemental Analysis Results of Five Biomass Fuels.
Biomass FuelElemental Compositions (ar, %)Q (MJ/kg)Proximate Analysis (ar, %)
CHONSKClMFCVA
#131.323.4523.720.170.010.1040.08010.9640.0113.4845.191.32
#245.076.7530.050.060.120.1600.07312.4537.1420.1341.461.27
#342.194.4034.60.520.080.2530.27312.2130.8818.0347.193.90
#444.015.9336.140.290.140.4680.27011.3240.0112.7642.744.49
#531.323.4523.720.170.010.1040.08010.2345.0212.6541.051.27
ar: as received basis.
Publisher’s Note: MDPI stays neutral with regard to jurisdictional claims in published maps and institutional affiliations.

