Article

Experimental Analysis of the R744/R404A Cascade Refrigeration System with Internal Heat Exchanger. Part 1: Coefficient of Performance Characteristics

Department of Refrigeration and Air-Conditioning Engineering, College of Engineering, Chonnam National University, 50, Daehak-ro, Yeosu 59626, Korea
Energies 2021, 14(18), 6003; https://doi.org/10.3390/en14186003
Submission received: 9 August 2021 / Revised: 16 September 2021 / Accepted: 17 September 2021 / Published: 21 September 2021

Abstract

:
This study evaluates the performance of an R744/R404A cascade refrigeration system (CRS) with internal heat exchangers (IHE) in supermarkets. R744 is used as the refrigerant in a low-temperature cycle, and R404A is used as the refrigerant in a high-temperature cycle. In previous studies, there are many studies including theoretical performance analysis of the CRS. However, experimental studies on the CRS are lacking, and experimental research on the R744/R404A system with an IHE is scarce. Therefore, this study provides basic data for optimal refrigeration system design by experimentally evaluating the results of modifying various parameters. The operating parameters considered in this study include subcooling and superheating, condensing and evaporating temperature, cascade evaporation temperature, and IHE efficiency in the R744 low- and R404A high-temperature cycle. The main results are summarized as follows: (1) By applying the results of this study, energy efficiency is achieved by optimizing the overall coefficient of performance (COP) of the CRS, and the refrigerant charge of the R404A cycle is minimized and economic efficiency is also obtained, enabling operation and maintenance as an environment-friendly system. (2) When designing the CRS, finding the cascade evaporation temperature that has the optimum and maximum COP according to the refrigerant combination should be considered with the highest priority.

1. Introduction

In the field of supermarket refrigeration technology, the hydrofluorocarbon (HFC) refrigerant R404A has been widely adopted as an alternative to R22 refrigerant [1]. Furthermore, the R744/R404A CRS has a 25% higher coefficient of performance (COP) than single-stage compression refrigerators using only R404A [2]. Thus, R744 (CO2) refrigerants are predominantly applied to the low-temperature side of the CRS, with R290 (propane), R717 (ammonia), and R404A refrigerants predominantly applied to the high-temperature side [3]. Previous studies have highlighted the risk of refrigerant leakage from supermarket refrigerators; for example, annual refrigerant leakage of approximately 14% (not including stand-alone equipment) was reported from 220 supermarkets in Norway [4]. Therefore, despite its high global warming potential (GWP), R404A is considered a safe high-temperature refrigerant for supermarket CRSs [5] because R404A is classified into the A1 group by the ASHRAE 34 safety group [6]. In addition, it can still be used in countries such as developing countries despite its high GWP. However, developed countries recommend using R448A and R449A as replacement refrigerants for R404A because they are not available in the near future or present.
Many previous studies have evaluated CRSs based on R744 and R717 refrigerants. For example, Nicola et al. analyzed the performance of a CRS in which R717 was applied to a high-temperature cycle and a mixed R744 and HFC refrigerant system was applied to the low-temperature cycle [7]. Moreover, Dopazo et al. performed simulations to understand the performance characteristics of CRSs applying R717 and R744 to the high-and low-temperature cycles, respectively and proposed a prediction equation based on regression analysis [8]. They also compared various compression efficiency equations to understand the effect of the compressor adiabatic efficiency of the high- and low-temperature cycles on the COP of this CRS. Furthermore, Lee et al. performed thermodynamic modeling of the R744/R717 CRS using several assumptions and equilibrium equations, analyzing the effect of condensation temperature, evaporation temperature, and the cascade temperature difference [9]. Then, the optimal R744 condensation temperature was determined according to the maximum COP and minimum system exergy destruction rate. Bingming et al. experimentally analyzed the factors affecting the performance of a R717/R744 CRS; specifically, the evaporation and condensation temperatures of the low-temperature cycle, the temperature difference of the cascade heat exchanger, and the degree of superheating [10]. The COP was also compared with that of a two-stage R717 compression refrigeration system and a single-stage system with and without an economizer. Getu and Bansal further examined the effects of the subcooling and superheating degree, evaporation temperature, condensation temperature, and cascade temperature difference on the performance of a R717/R744 CRS, and they proposed an equation to predict the optimum cascade evaporation temperature, mass flow rate of refrigerant, and maximum COP [11]. Yun and Cho [12] simulated the R744/R717 CRS and a two-stage compression refrigeration system with IHE. Abubakar and Fitri performed a thermodynamic analysis of CRS using R744/R717 refrigerant for fish cold storage application [13]. Bresolin simulated the R134a/R744 CRS thermal analysis for evaluation of the intermediate heat exchanger parameters [14]. Kumar and Ranga studied performance analysis of the R717 and R744 mixture CRS [15]. Victorin et al. conducted the parametric study of R717/R744 CRS for hot climates [16]. Furthermore, Islam and Singh performed analysis of thermodynamic performance of the R22/R404A and R744/R404A CRSs [17]. Kumar and Randa studied the comparison of thermodynamics analysis of CRS for refrigerant pairs R23/R404A and R41/R404A [18]. Shakya et al. analyzed the performance of R404A/R134a CRS [19]. Winkler et al. conducted simulations and experiments on a CRS that applied R404A and R744 to the high-temperature and low-temperature cycles, respectively [20].
In previous studies, there are many studies including theoretical performance analysis of the CRS. However, experimental studies on the CRS are lacking, and experimental research on the R744/R404A system with an IHE is scarce. In addition, although a prediction equation for obtaining the maximum COP of the R744/R717 CRS has been proposed using squares regression analysis, it is limited by a lack of detail and is not for R744/R404A CRS; for example, the same subcooling and superheating is applied to the low-temperature and high-temperature cycles [8,9,10,11]. Therefore, this study provides basic data for optimal CRS design by experimentally evaluating the subcooling and superheating, condensation and evaporation temperature, cascade evaporation temperature, and IHE efficiency according to the COP characteristics of the R744/R404A CRS. I also propose a prediction equation for obtaining the maximum COP under various input conditions on the high- and low-temperature cycle.

2. Experimental Apparatus and Data Reduction

2.1. Experimental Apparatus

A schematic diagram of the experimental apparatus was designed to identify the characteristics of the R744/R404A CRS (Figure 1). Measurement locations for determining the refrigerant temperature, pressure, mass flow rate, and power consumption of the compressor at each point in the system are shown in Figure 1. The CRS consists of two single-stage compression refrigeration cycles connected by a cascade heat exchanger. R744 was used as the refrigerant in the low-temperature cycle, and R404A was used as the refrigerant in the high-temperature cycle. The system is largely composed of R404A and R744 circulation loops, which is a forced circulation loop circulated by a compressor, and a heat source water circulation loop, which is a forced circulation loop circulated by a pump. The circulation loop of the R404A cycle includes a semi-hermetic compressor, oil separator, condenser, internal heat exchanger, receiver, mass flow meter, expansion valve, cascade heat exchanger, and accumulator; the circulation loop of the R744 cycle includes an evaporator in place of the condenser. The loop circulating the heat source water comprises a water flow meter, constant-temperature bath, and pump.
As shown in Figure 1, the high-temperature and high-pressure R404A refrigerant vapor from the compressor enters the condenser, where it exchanges heat with the cooling water, cools, and flows into the receiver as a liquid. The refrigerant liquid leaving the receiver passes through the mass flow meter and expansion valve. Therefore, the properties of the R404A refrigerant are determined by measuring the flow rate and density with a mass flow meter. The refrigerant liquid passing through the expansion valve flows into the cascade heat exchanger (which plays the role of the evaporator), where it exchanges heat with the R744 refrigerant, cools, and flows into the receiver as a liquid; then. it enters the compressor for recirculation. The power consumption of the compressor is measured with a power meter. The refrigerant liquid exiting the receiver passes through the mass flow meter and flows into the evaporator, where it is heated by the heat source water to steam. Then, it becomes high-temperature and high-pressure steam in the R744 compressor, which enters the cascade heat exchanger (which plays the role of the condenser) and circulates. To calculate the capacity of the heat exchanger (evaporator, condenser, cascade heat exchanger), the temperature and pressure were measured at each inlet and outlet, and the power consumption of the high-temperature and low-temperature side compressors was measured using a power meter. The heat source water flowing into the condenser and evaporator passes through a water flow meter and is maintained at a constant temperature in a constant-temperature bath. The main components and detailed characteristics of the experiments are listed in Table 1, and the details of the measuring equipment are listed in Table 2.

2.2. Experimental Procedure

To ensure airtight tests using the experimental device, nitrogen was injected up to the allowable pressure of the compressor, and a leak test was performed after one day. Subsequently, a small amount of refrigerant was injected, and a purging process was performed three times to remove impurities such as residual air while creating a vacuum with a vacuum pump. Before operating the system, two constant-temperature baths were used to adjust the inlet temperature of the heat source water of the R744 evaporator and R404A condenser; then, they were used to fill the refrigerant in the liquid phase in each cycle. The experiment was conducted as follows:
  • Adjust the temperature of the heat source water by a constant-temperature bath to the set temperature and operate the heat source water.
  • Turn on the power of the R404A compressor and adjust the required R404A evaporation temperature and mass flow rate by adjusting the high-temperature expansion valve and inverter frequency for the R404A compressor.
  • After operating the R404A refrigeration cycle, when the R744 condensation pressure drops to a certain pressure, the R744 compressor is turned on, and the low-temperature expansion valve and inverter frequency are adjusted for the R744 compressor to control the evaporation temperature and mass flow rate of the CRS.
  • The flow rate of the heat source water and R744 mass flow are adjusted to control the subcooling and superheating of the high- and low-temperature cycles, respectively.
  • When the system reaches a steady state (temperature variation within ±0.5 °C, pressure variation within ±5 kPa, and mass flow rate within ±0.05 kg/min over a 15-min measurement period), the measurement equipment is operated, and the temperature, pressure, and mass flow data are sent to the computer using GPIB communication. The temperature of the refrigerant, pressure mass flow rate, and power consumption of the compressor are measured three times at 5-min intervals. The operating conditions are shown in Table 3.

2.3. Data Reduction

The thermal properties of R744 and R404A used in this study were calculated using REFPROP (version 8.01), which is a refrigerant property program developed by the National Institute of Standards and Technology (NIST). According to these thermal properties, the performance characteristics of the R744/R404A CRS were identified. The calculation formulas in Table 4 were used to analyze the experimental data. The COP (COPR404A) of the R404A refrigeration cycle, the COP (COPR744) of the R744 refrigeration cycle, and the total COP(COPSYS) of the system were calculated using Equations (1)–(3), respectively [21,22,23]:
COP R 404 A = Q E , CAS W COM , R 404 A
COP R 744 = Q E W COM , R 744
COP SYS = Q E W COM , R 404 A + W COM , R 744
The mass flow ratio ( m ˙ RATIO ) of the CRS was calculated using Equation (4):
m ˙ RATIO = m ˙ R 404 A m ˙ R 744 .

2.4. Uncertainties

The experimental results are not accurate for engineering analysis and design. Therefore, this study predicted the uncertainties in the experimental results using the equations proposed by Kline and McClintock [24] and Moffat [25] (Table 5).

3. Results and Discussion

In this study, the performance characteristics of a CRS using R744 as the low-temperature refrigerant and R404A as the high-temperature refrigerant were analyzed, and basic design data were provided. Specifically, the COP was analyzed according to the change in subcooling and superheating, condensation temperature, IHE efficiency of the R404A cycle, superheating, IHE efficiency, evaporation temperature of the R744 cycle, and the cascade evaporation temperature.

3.1. Effect of the Degree of Subcooling and Superheating

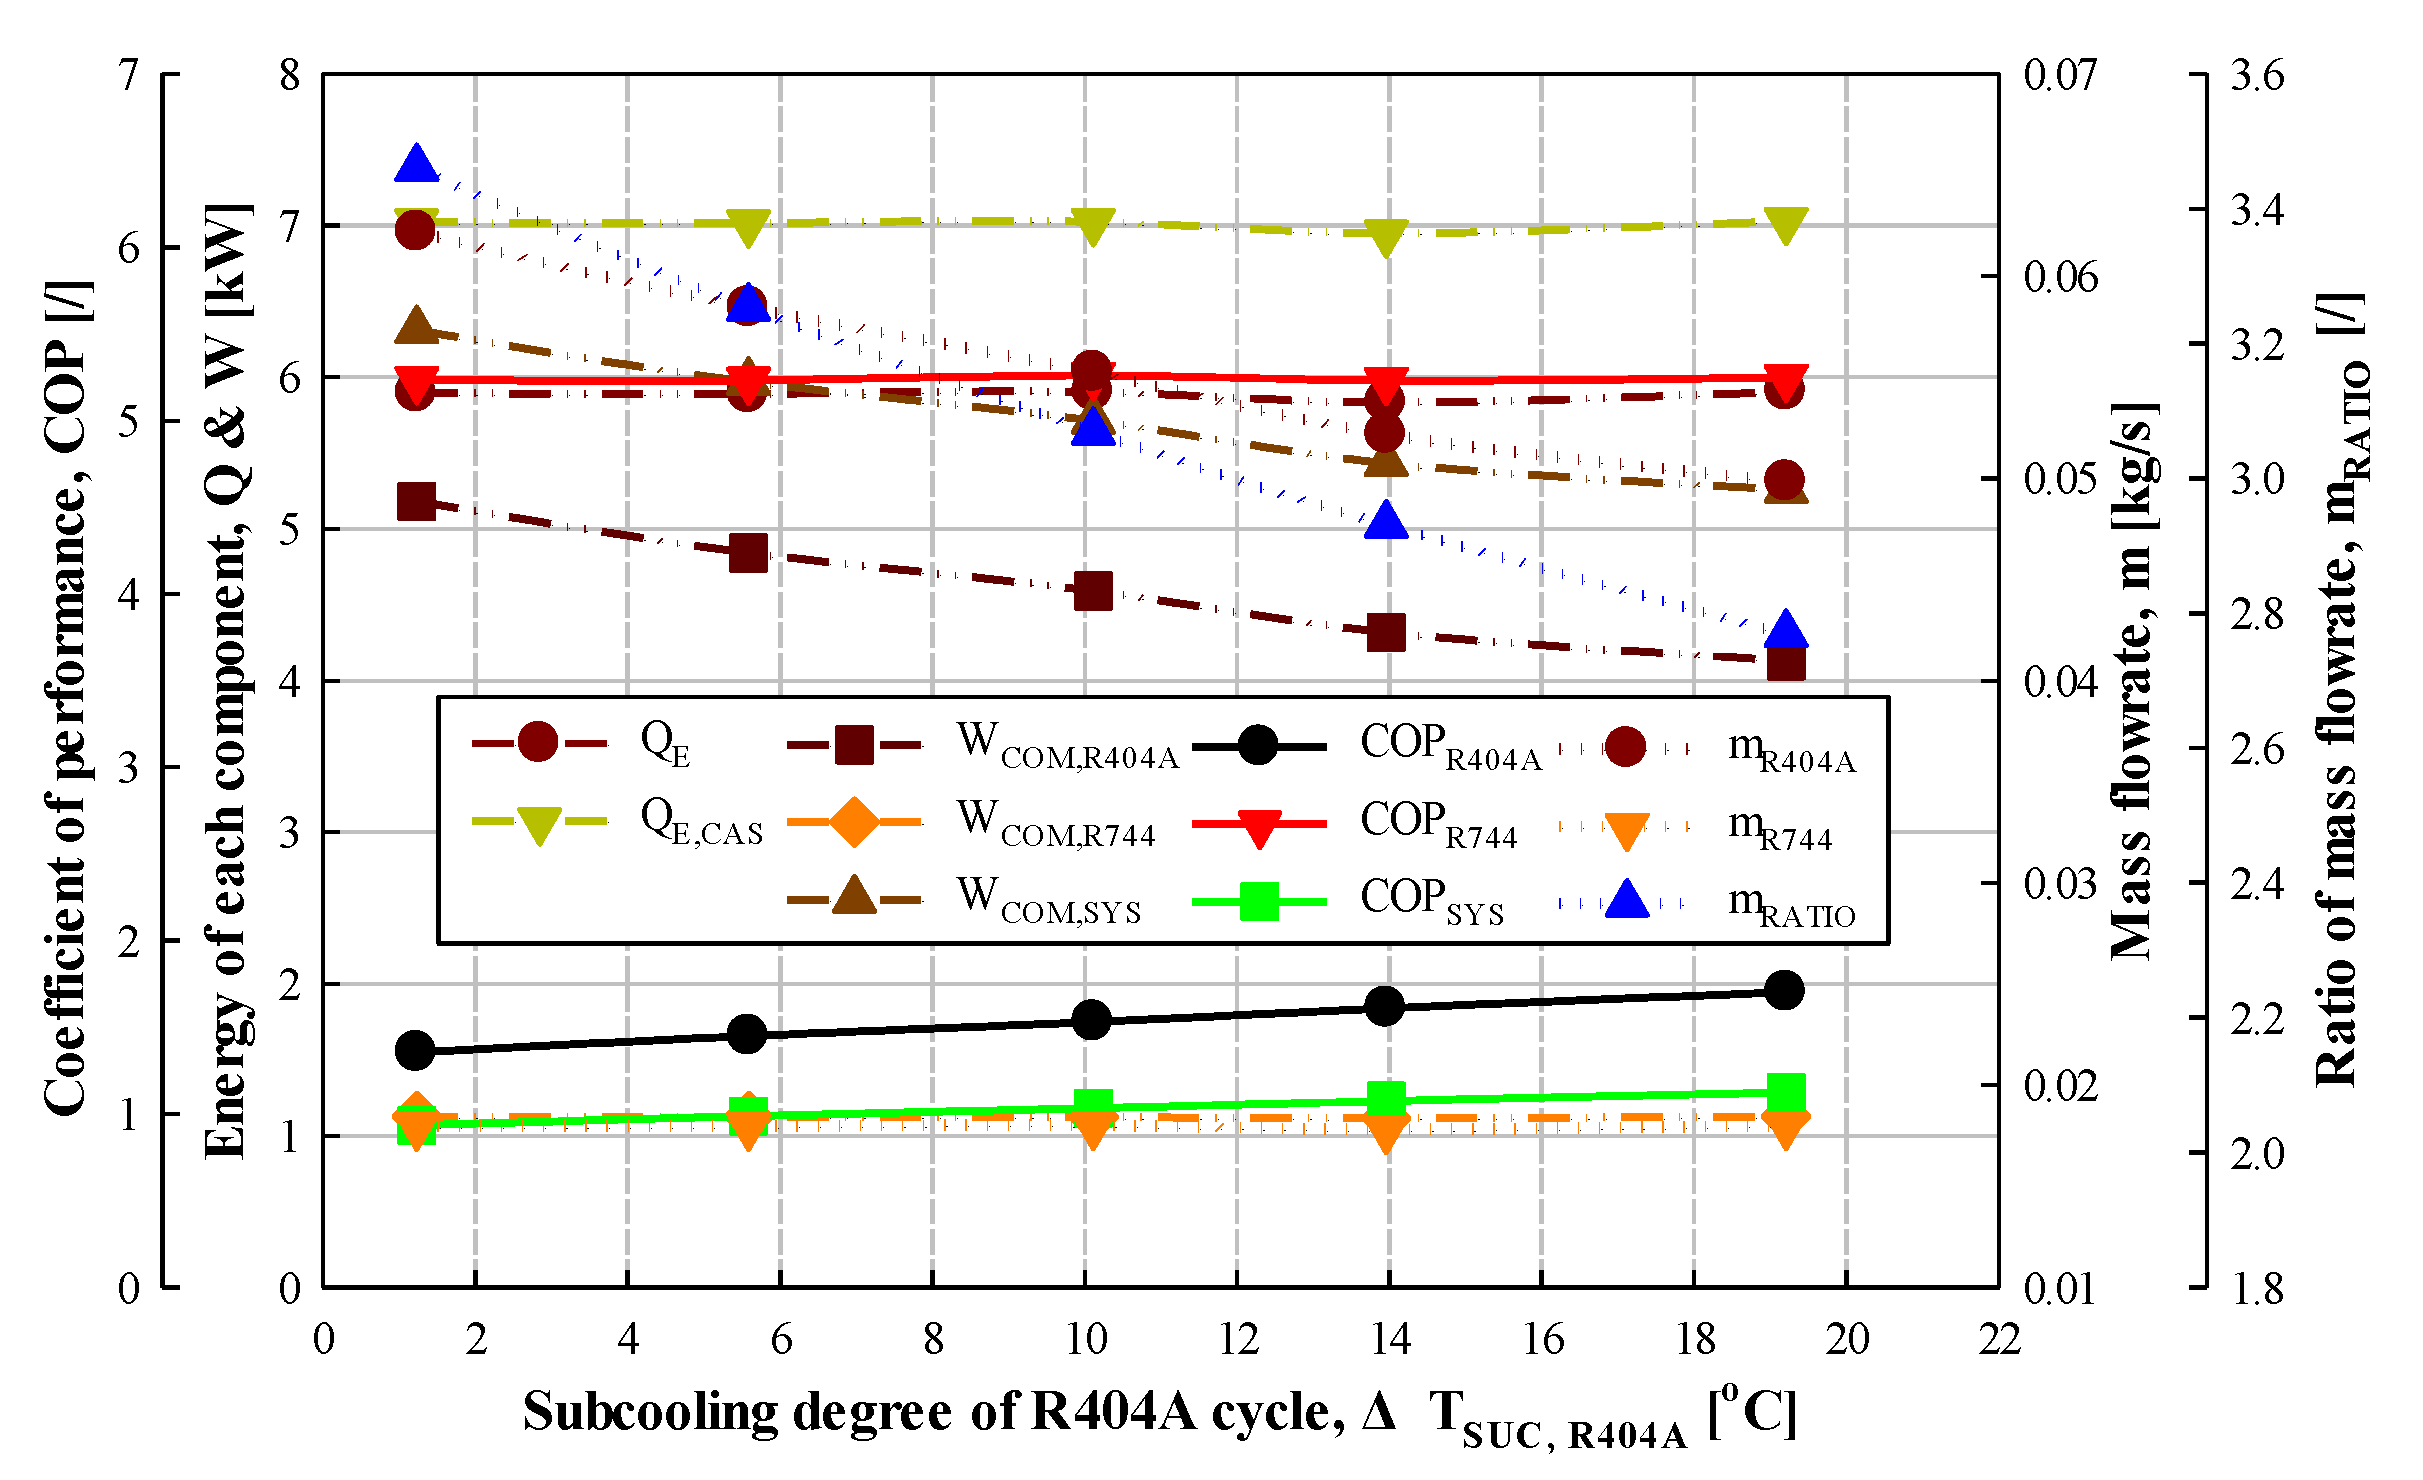
3.1.1. Effect of the Degree of Subcooling

An experiment was conducted to investigate the effect of increasing the subcooling by approximately 5 °C intervals from 1.2 to 19.2 °C (under constant conditions; QE = 5.83–5.91 kW, TE = −40.0 to −39.8 °C, TE,CAS = −24.1 to −23.9 °C, TC = 39.4–39.7 °C, ΔTSUH,R404A = 20.2–20.5 °C, ΔTSUH,R744 = 40.3–40.8 °C, ΔTSUC,R744 = 2.3–2.5 °C, ΔTCAS = 2.5–2.9 °C, ηIHX,R404A = ηIHX,R744 = 0) on the COP and mass flow rate of R404A and R744 cycles and the COP and mass flow ratio of the entire CRS. As shown in Figure 2, there was minimal change in the COP and mass flow rate of the R744 cycle, whereas the COP of the R404A cycle increased by 5.2–6.9%, increasing the COP of the CRS by 3.9–5.6%.
In detail, the mass flow rate of the R404A cycle decreased by 4.5–6.0%, whereas that of the R744 cycle was almost unchanged. Therefore, the mass flow ratio of the entire CRS decreased by 4.5–6.0%. Furthermore, the total power consumption of the compressor of the CRS decreased by 3.2–5.4%; the power consumption of the compressor in the R744 cycle was almost unchanged, but that of the R404A cycle decreased by 4.3–6.6%. The evaporation capacity was approximately constant at 5.83–5.91 kW. Thus, as the subcooling in the R404A cycle increased, the subcooling and superheating in the R744 cycle, as well as the evaporation and condensation temperatures, remained almost constant, leading to no change in COP. Moreover, there was minimal change in the enthalpy values of the R404A compressor inlet and outlet; therefore, the evaporator enthalpy difference (i8–i6) of the cascade heat exchanger increased by 6.1–7.9 kJ/kg. In conclusion, the constant cascade evaporation capacity and increased enthalpy difference between the inlet and outlet of the evaporator led to a decrease in the R404A mass flow rate. In turn, this decreased the power consumption of the compressor and increased the COP of the R404A cycle and entire CRS.
The reason for the decrease in R404A mass flow rate is that the cascade evaporation capacity is constant, whereas the enthalpy difference between the inlet and outlet of the evaporator increases and the mass flow rate decreases. These results are consistent with the studies by Kumar et al. [26] and Son and Moon [27].

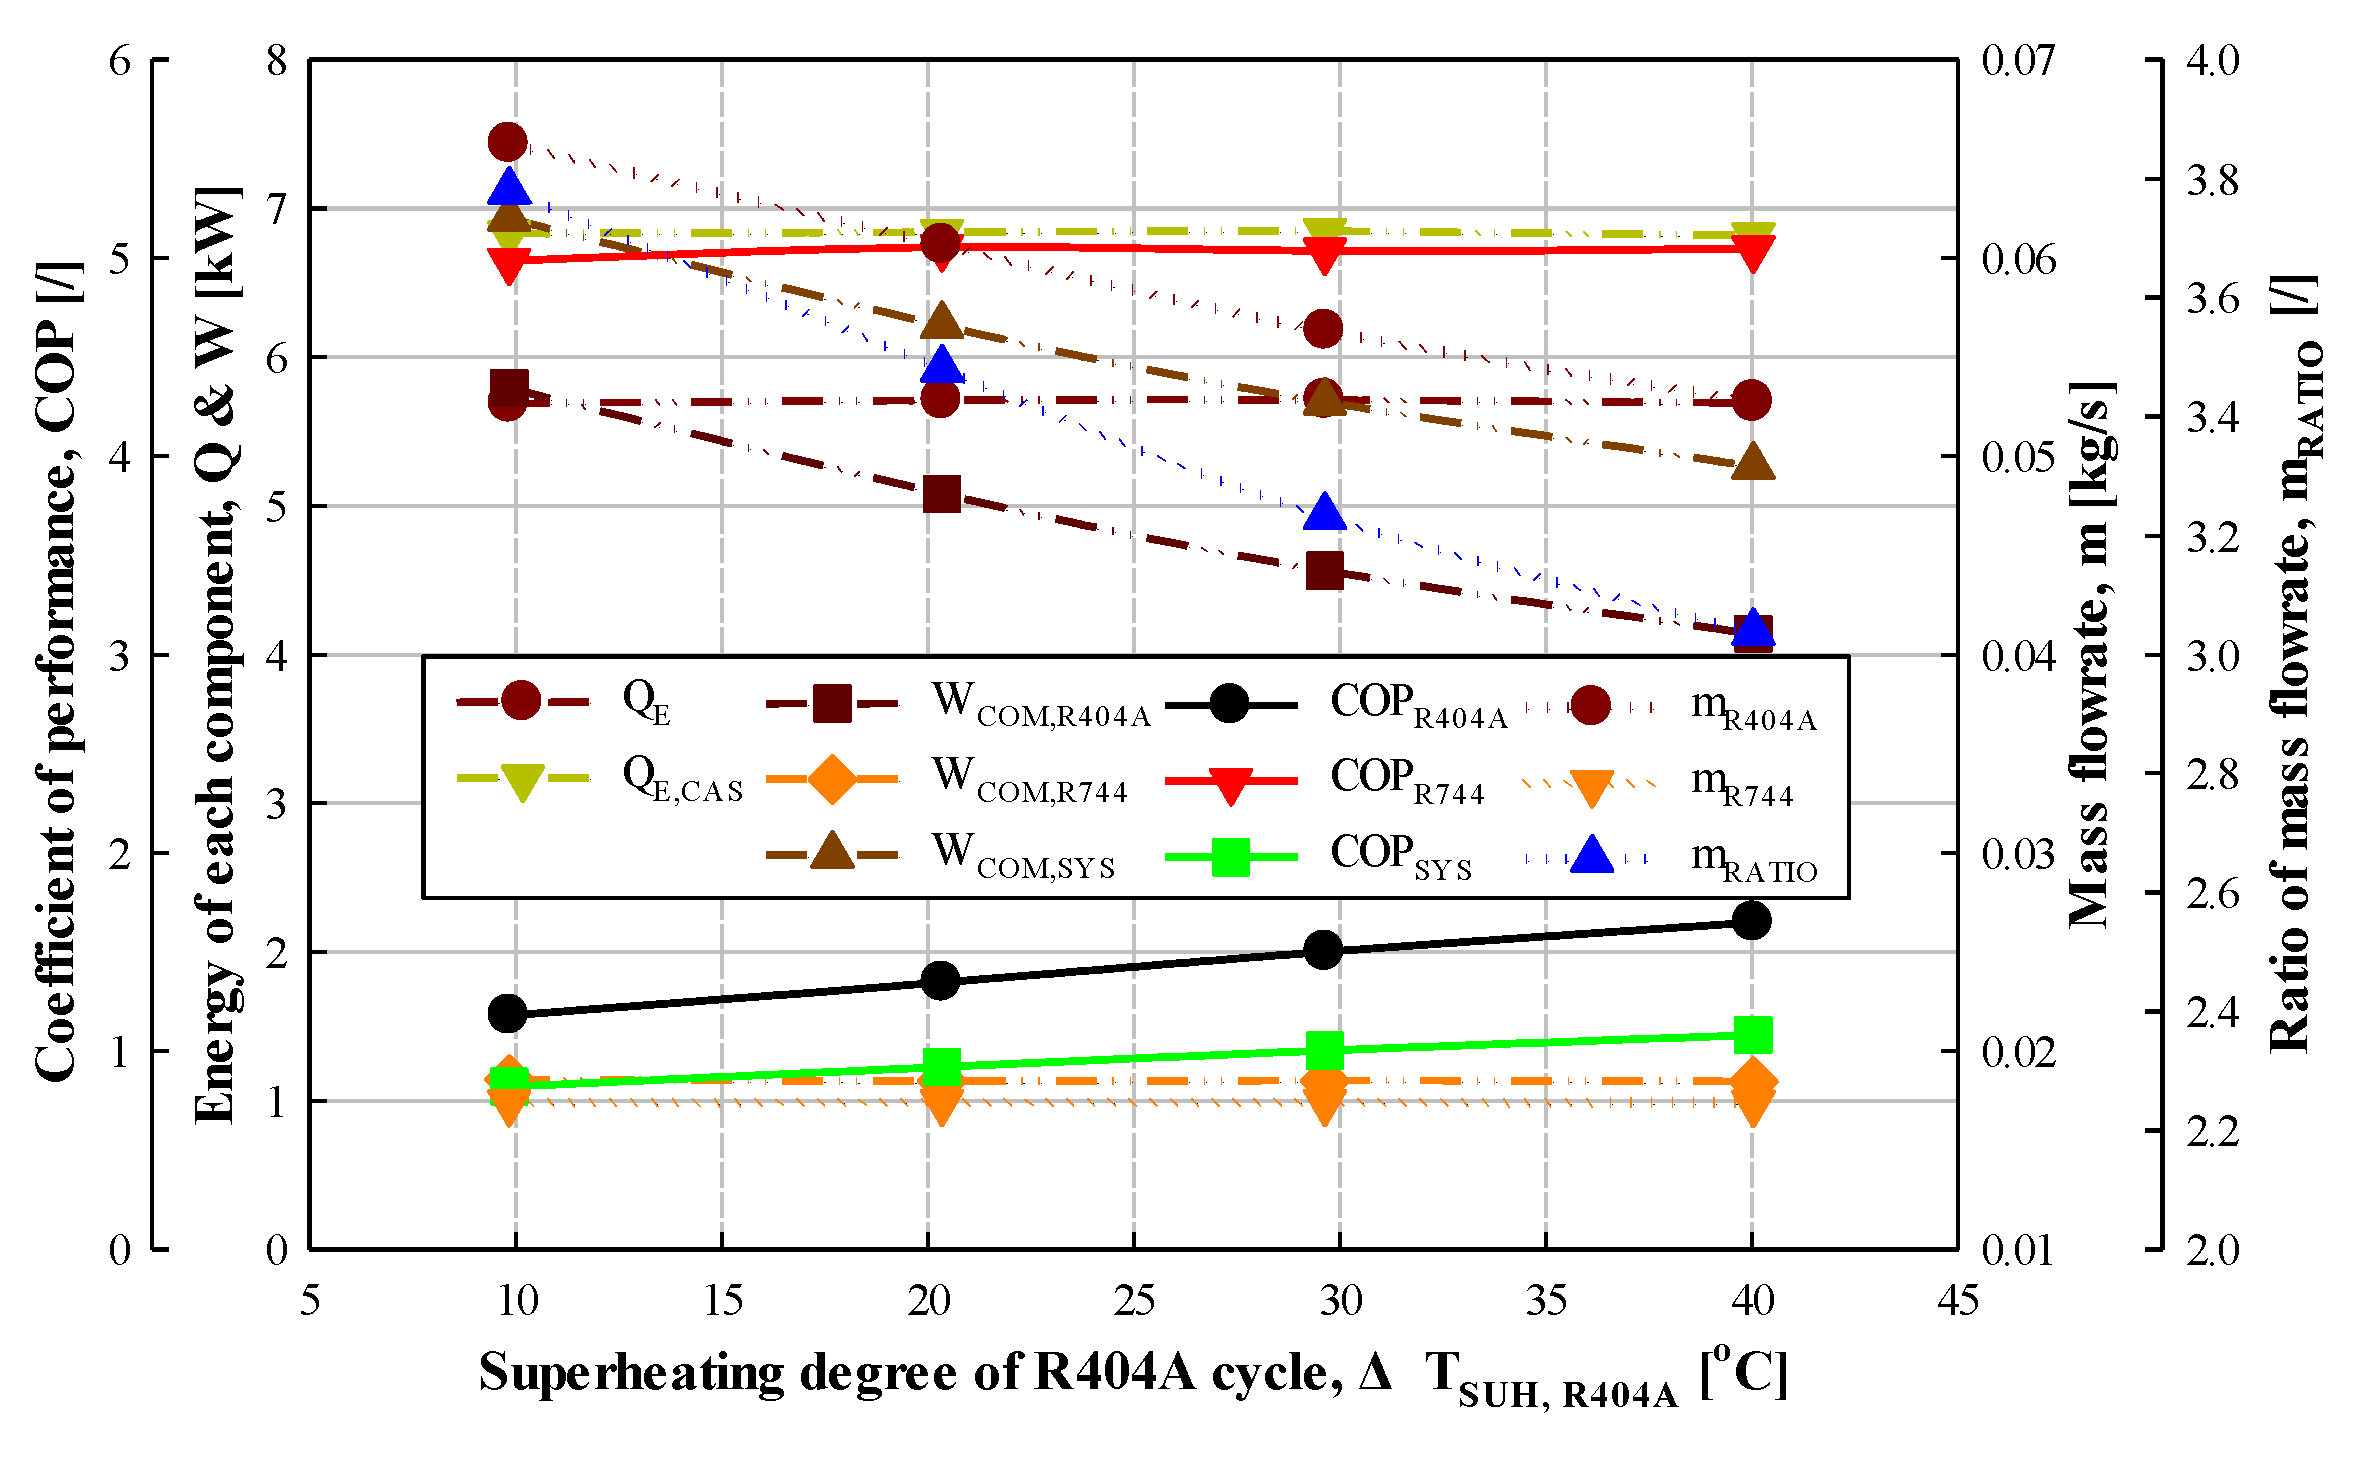
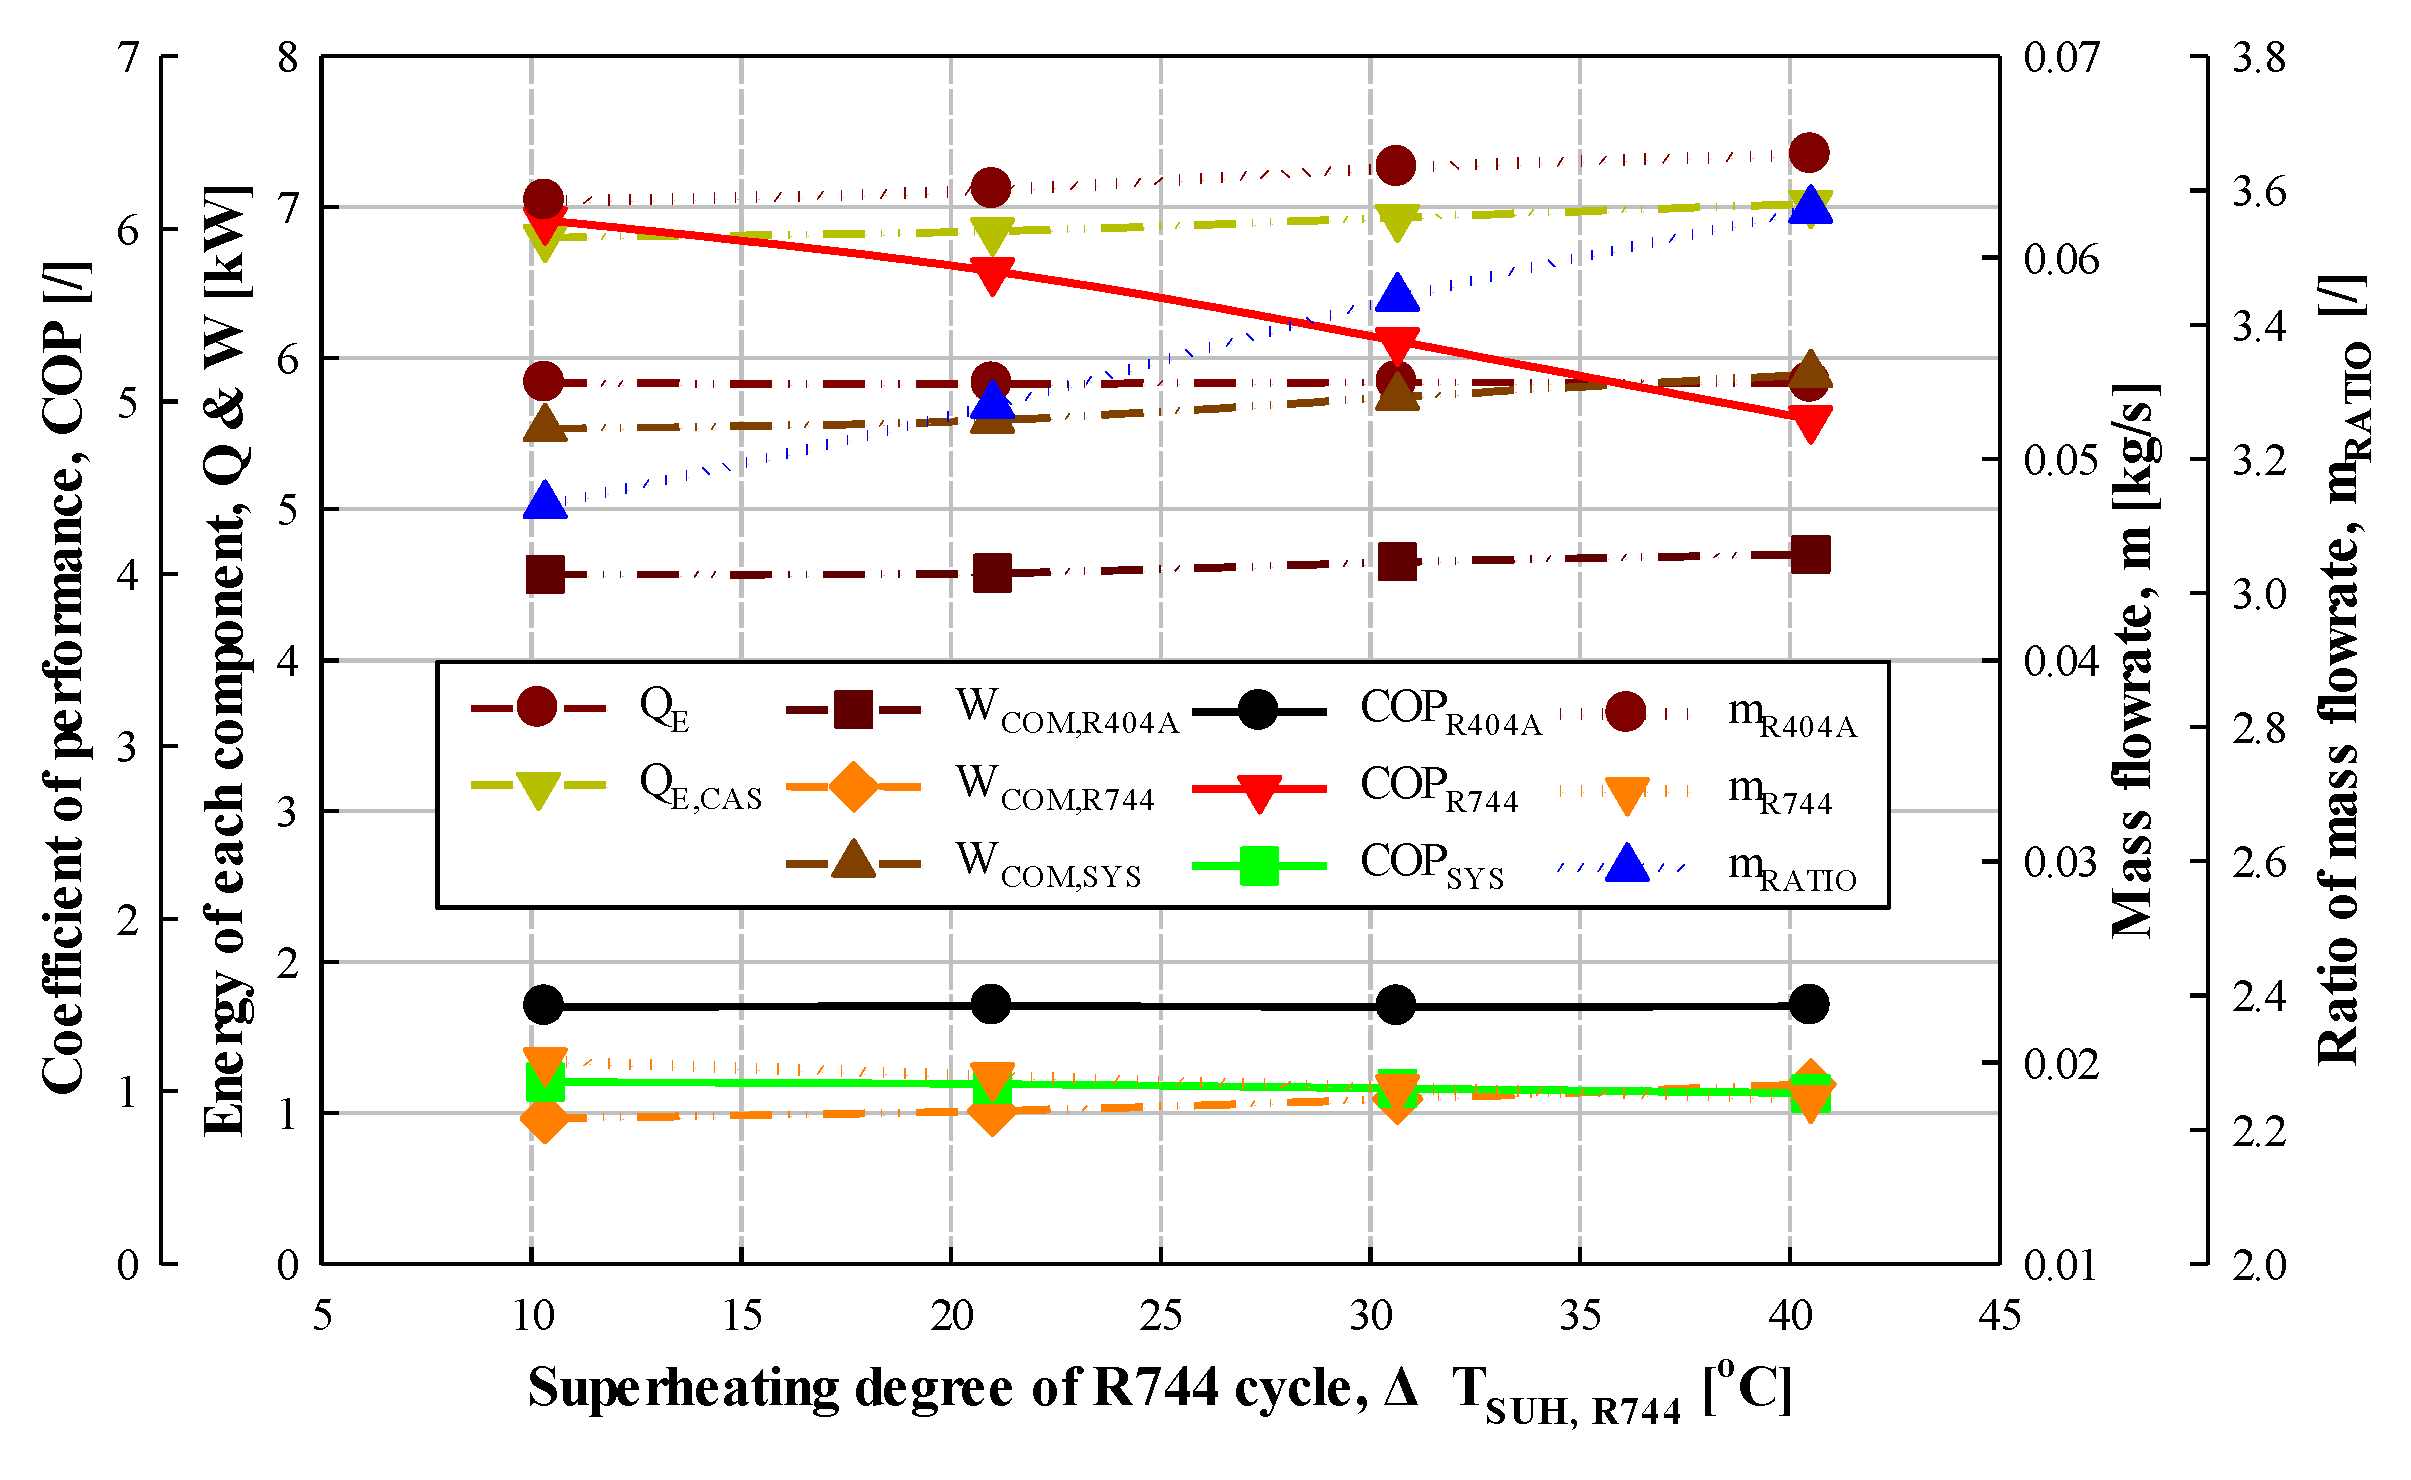
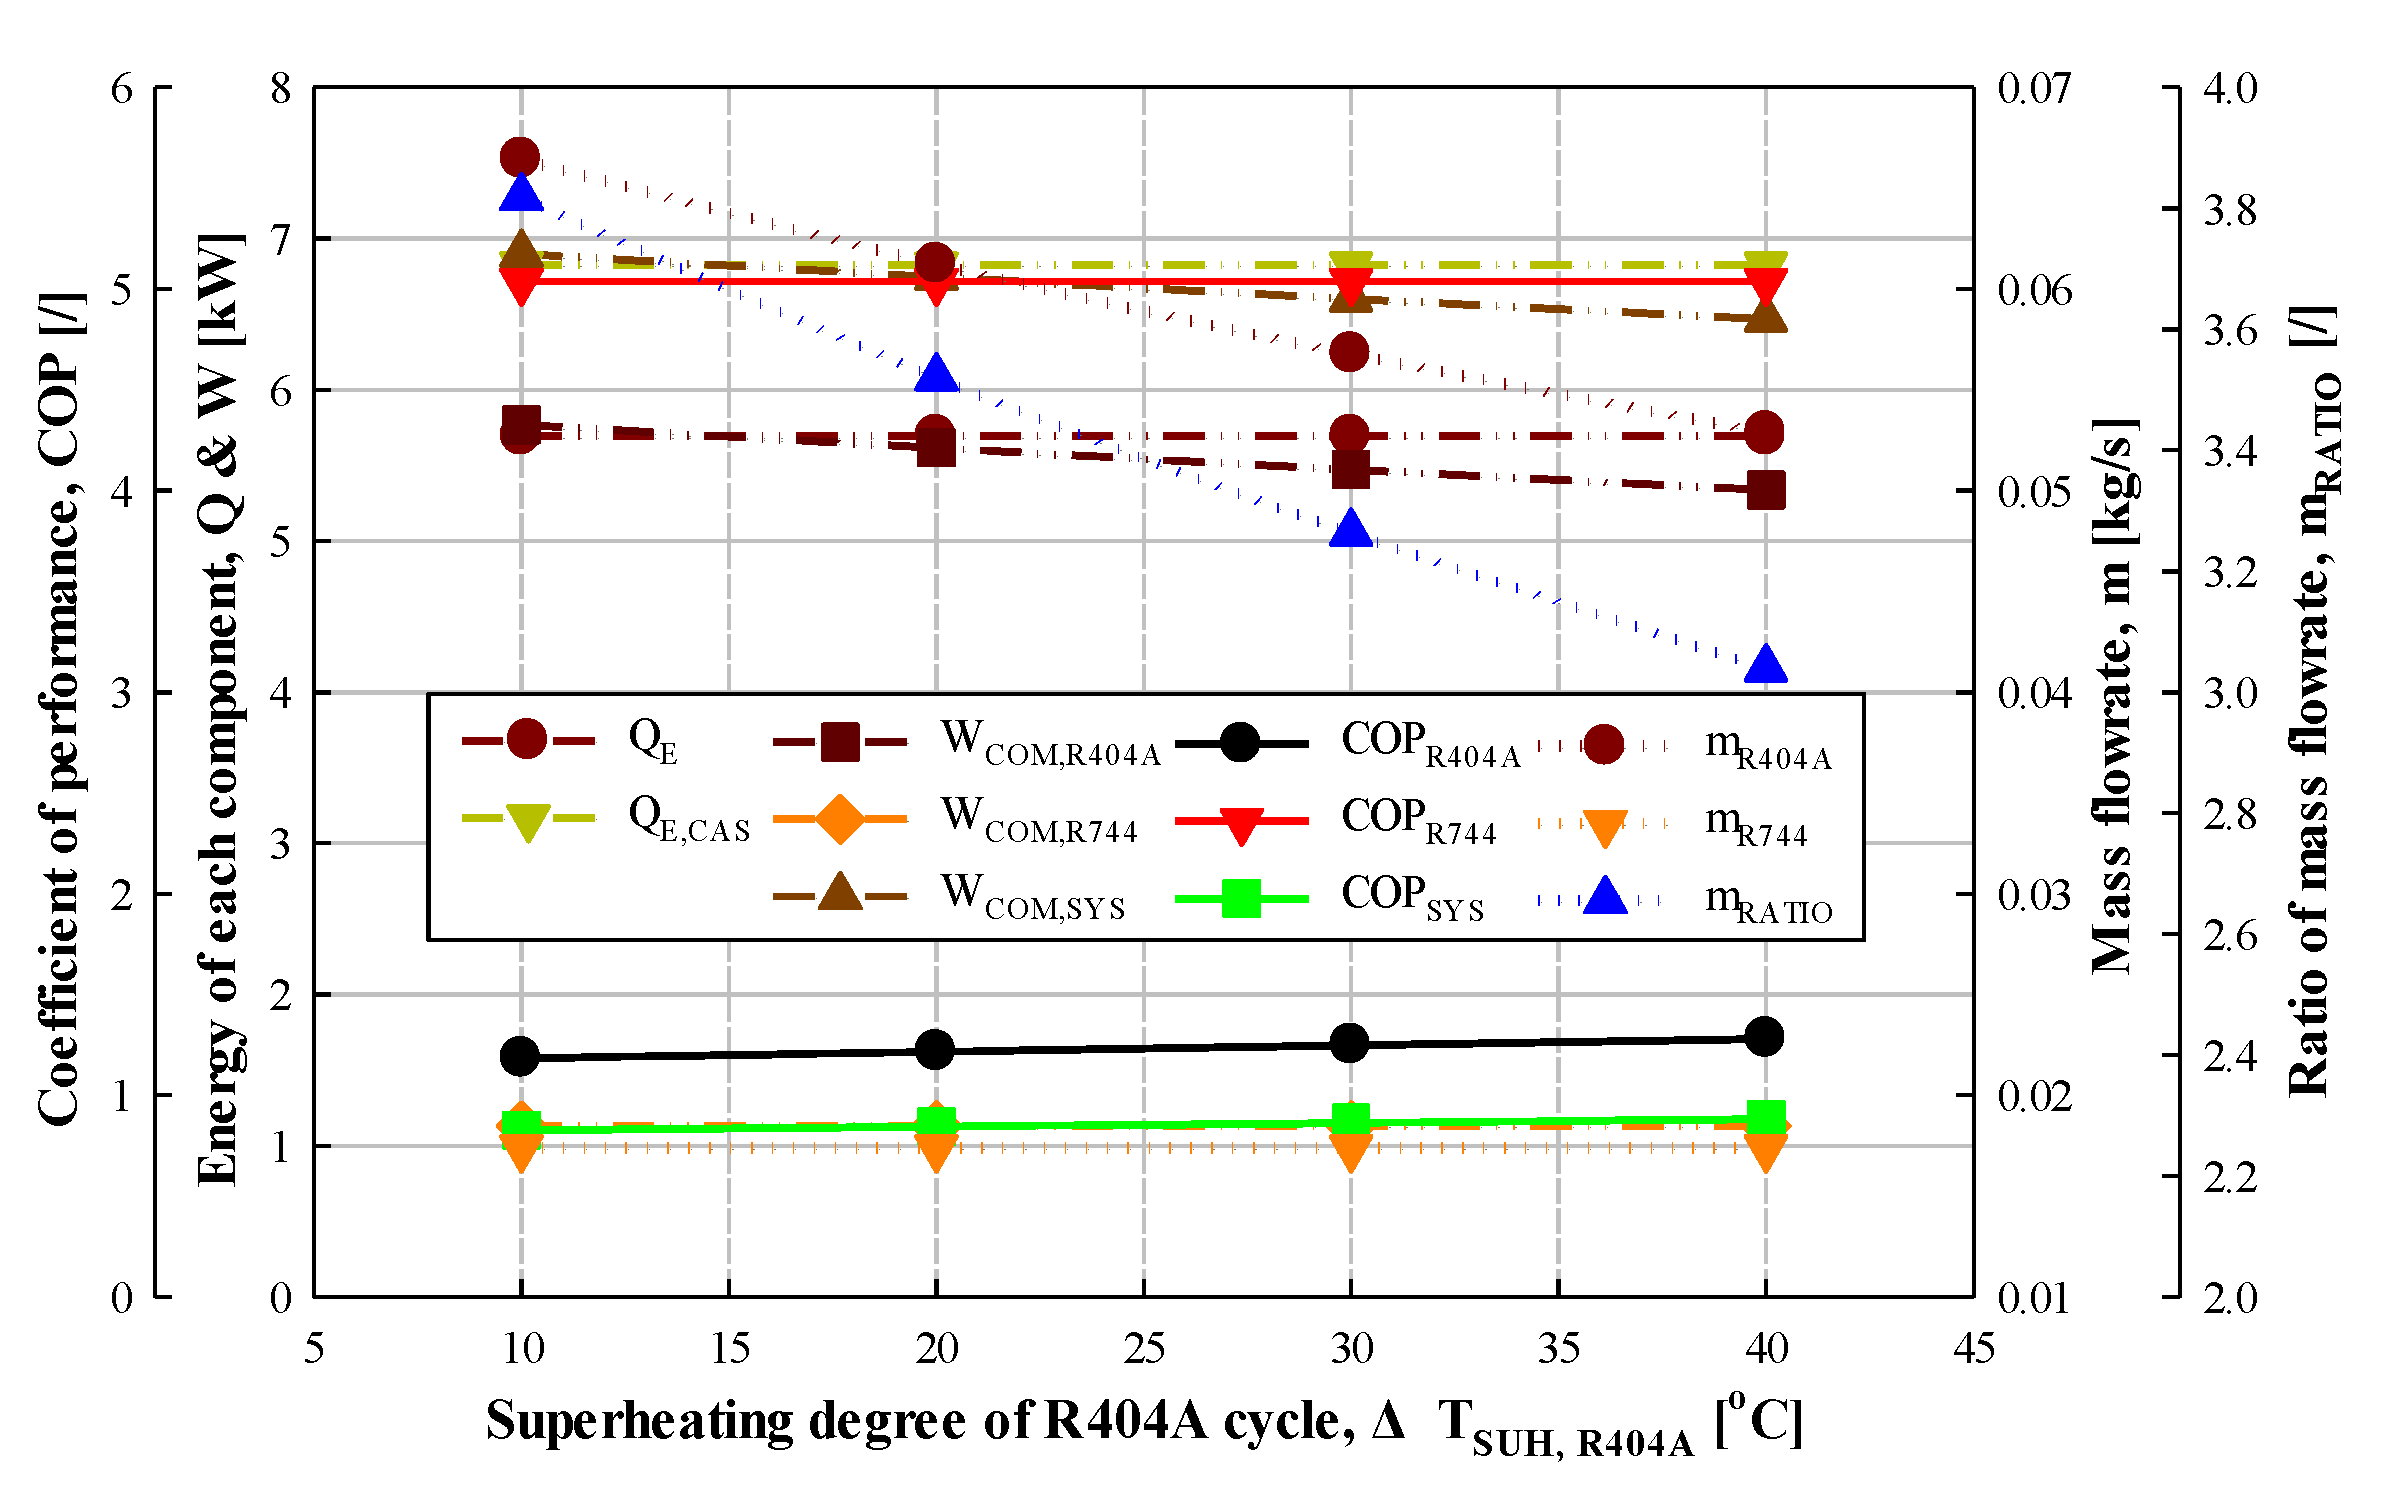
3.1.2. Effect of Degree of Superheating

The ranges of superheating and supercooling degrees applied in this study were excessively applied, not under general conditions. Nevertheless, some people did extensive research in anticipation of the need for an unusually wide range of data. For example, in an R404A cycle, the higher the superheat, the better the COP and the lower the mass flow. Therefore, if you increase the superheat excessively and use a low-capacity compressor, you can save money and increase your COP when purchasing a compressor, giving you more options.
An experiment was conducted to investigate the effect of increasing the superheating of the R404A cycle by approximately 10 °C intervals from 9.8 °to 40.0 °C (under constant conditions: QE = 5.69–5.71kW, TE = −40.0 to −39.8 °C, TE,CAS = −24.6 to −24.3 °C, TC = 39.8–40.0 °C, ΔTSUC,R404A = 0.6–1.3 °C, ΔTSUH,R744 = 40.0–40.6 °C, ΔTSUC,R744 = 2.1–2.3 °C, ΔTCAS = 2.9–3.3 °C, ηIHX,R404A = ηIHX,R744 = 0) on the COP and mass flow rate of the R404A and R744 cycles and the COP and mass flow ratio of the entire CRS. As shown in Figure 3, the COP of the R744 cycle did not change, whereas the COP of the R404A cycle increased by 9.9–14.2% and that of the entire CRS accordingly increased by 7.8–12.0%.
In detail, the total power consumption of the compressor of the CRS decreased by 7.6–10.4% (the power consumption of the compressor of the R744 cycle was almost unchanged, and the power consumption of the compressor of the R404A cycle decreased by 9.3–12.3%), whereas the evaporation capacity remained almost constant at 5.69–5.71 kW. Therefore, the reduced power consumption of the compressor of the R404A cycle led to an increase in the COP of the R404A cycle and the entire CRS. According to the equations in Table 3, although an increase in the superheating did not affect the evaporation capacity and power consumption of the compressor of the R744 cycle, the enthalpy value of both the compressor inlet and outlet of the R404A cycle increased, with the inlet enthalpy (i1) increasing by 8.0–9.2 kJ/kg but the outlet enthalpy (i2) increasing by only 4.9–6.6 kJ/kg. Therefore, the enthalpy difference between the compressor inlet and outlet (i2–i1) decreased by 2.6–4.3 kJ/kg. This is likely because of the physical properties of R404A and the decrease in the mass flow rate of the R404A cycle by 6.3–7.7% (according to Equation (4)), which reduced the power consumption of the compressor of the R404A cycle. These results are consistent with the results of previous research [26,27,28].
In addition, the decrease in the mass flow rate of the R404A cycle led to a reduction in the mass flow ratio of the entire CRS of 6.0–7.9%. The reason for the decrease in the mass flow rate of the R404A cycle was the approximately constant mass flow rate of the R744 cycle and inlet enthalpy (i6) of the cascade evaporator, whereas the outlet enthalpy (i8) of the cascade evaporator increased. Therefore, it is determined that the enthalpy difference (i8-i6) between the inlet and outlet of the cascade evaporator increased, and the mass flow rate of the R404A cycle decreased because of the energy balance in the cascade heat exchanger. These results are consistent with the results of studies by Kumar et al. [26] and Son and Moon [27].
A second experiment was conducted to investigate the effect of increasing the superheating of the R744 cycle by approximately 10 °C intervals from 10.3 to 40.5 °C (under constant conditions: QE = 5.83–5.84 kW, TE = −40.1 to −39.8 °C, TE,CAS = −21.0 to −20.6 °C, TC = 42.0–42.4 °C, ΔTSUH,R404A = 15.4–15.7 °C, ΔTSUC,R404A = 1.4–1.7 °C, ΔTSUC,R744 = 1.8–2.4 °C, ΔTCAS = 2.8–3.0 °C, ηIHX,R404A = ηIHX,R744 = 0) on the COP and mass flow rate of R404A and R744 cycles and the COP and mass flow ratio of the entire CRS. As shown in Figure 4, the COP of the R404A cycle hardly changed, whereas the COP of the R744 cycle decreased by 4.9–8.5%. Accordingly, the COP of the entire CRS decreased by 1.1–2.7%. This is consistent with the results of Kumar et al. [26].
In detail, the total power consumption of the compressor of the CRS increased by 1.0–2.7% (the power consumption values of the compressor of R404A and R744 cycles increased by 0.2–1.6% and 5.0–9.1%, respectively), whereas the evaporation capacity remained almost constant at 5.83–5.84 kW. The reason for the lack of change in the COP of the R404A cycle is that the subcooling and superheating, as well as the evaporation and condensation temperature, were almost constant in the R404A cycle. The increase in the power consumption of the compressor of the R744 cycle with increased superheating of the R744 cycle is explained by the equations in Table 4 and the physical properties of R744. That is, the inlet and outlet enthalpy value (i11, i12) of the R744 compressor increased by 9.1–10.4 kJ/kg and 14.7–16.3 kJ/kg, respectively, leading to an increase in the enthalpy difference (i12–i11) between the compressor inlet and outlet by 4.3–7.1 kJ/kg. This increased the power consumption of the compressor of the R744 cycle, despite the slight reduction in R744 mass flow rate by 2.7–3.7%. This result agrees with those of previous research [11,29]. Conversely, the mass flow rate of the R404A cycle increased by 0.9–1.7%; thus, the mass flow ratio of the entire CRS increased by 3.8–4.9%. In conclusion, as the degree of superheating of the R744 cycle increased, the cascade condensation capacity increased due to the increased power consumption of the compressor of the R744 cycle, yet the evaporation temperature and superheating degree of the cascade evaporator in the cascade heat exchanger remained constant; therefore, the mass flow rate of the R404A cycle increased to maintain energy balance. This is consistent with the results of Kumar et al. [26].

3.2. Effect of Condensation and Evaporation Temperature

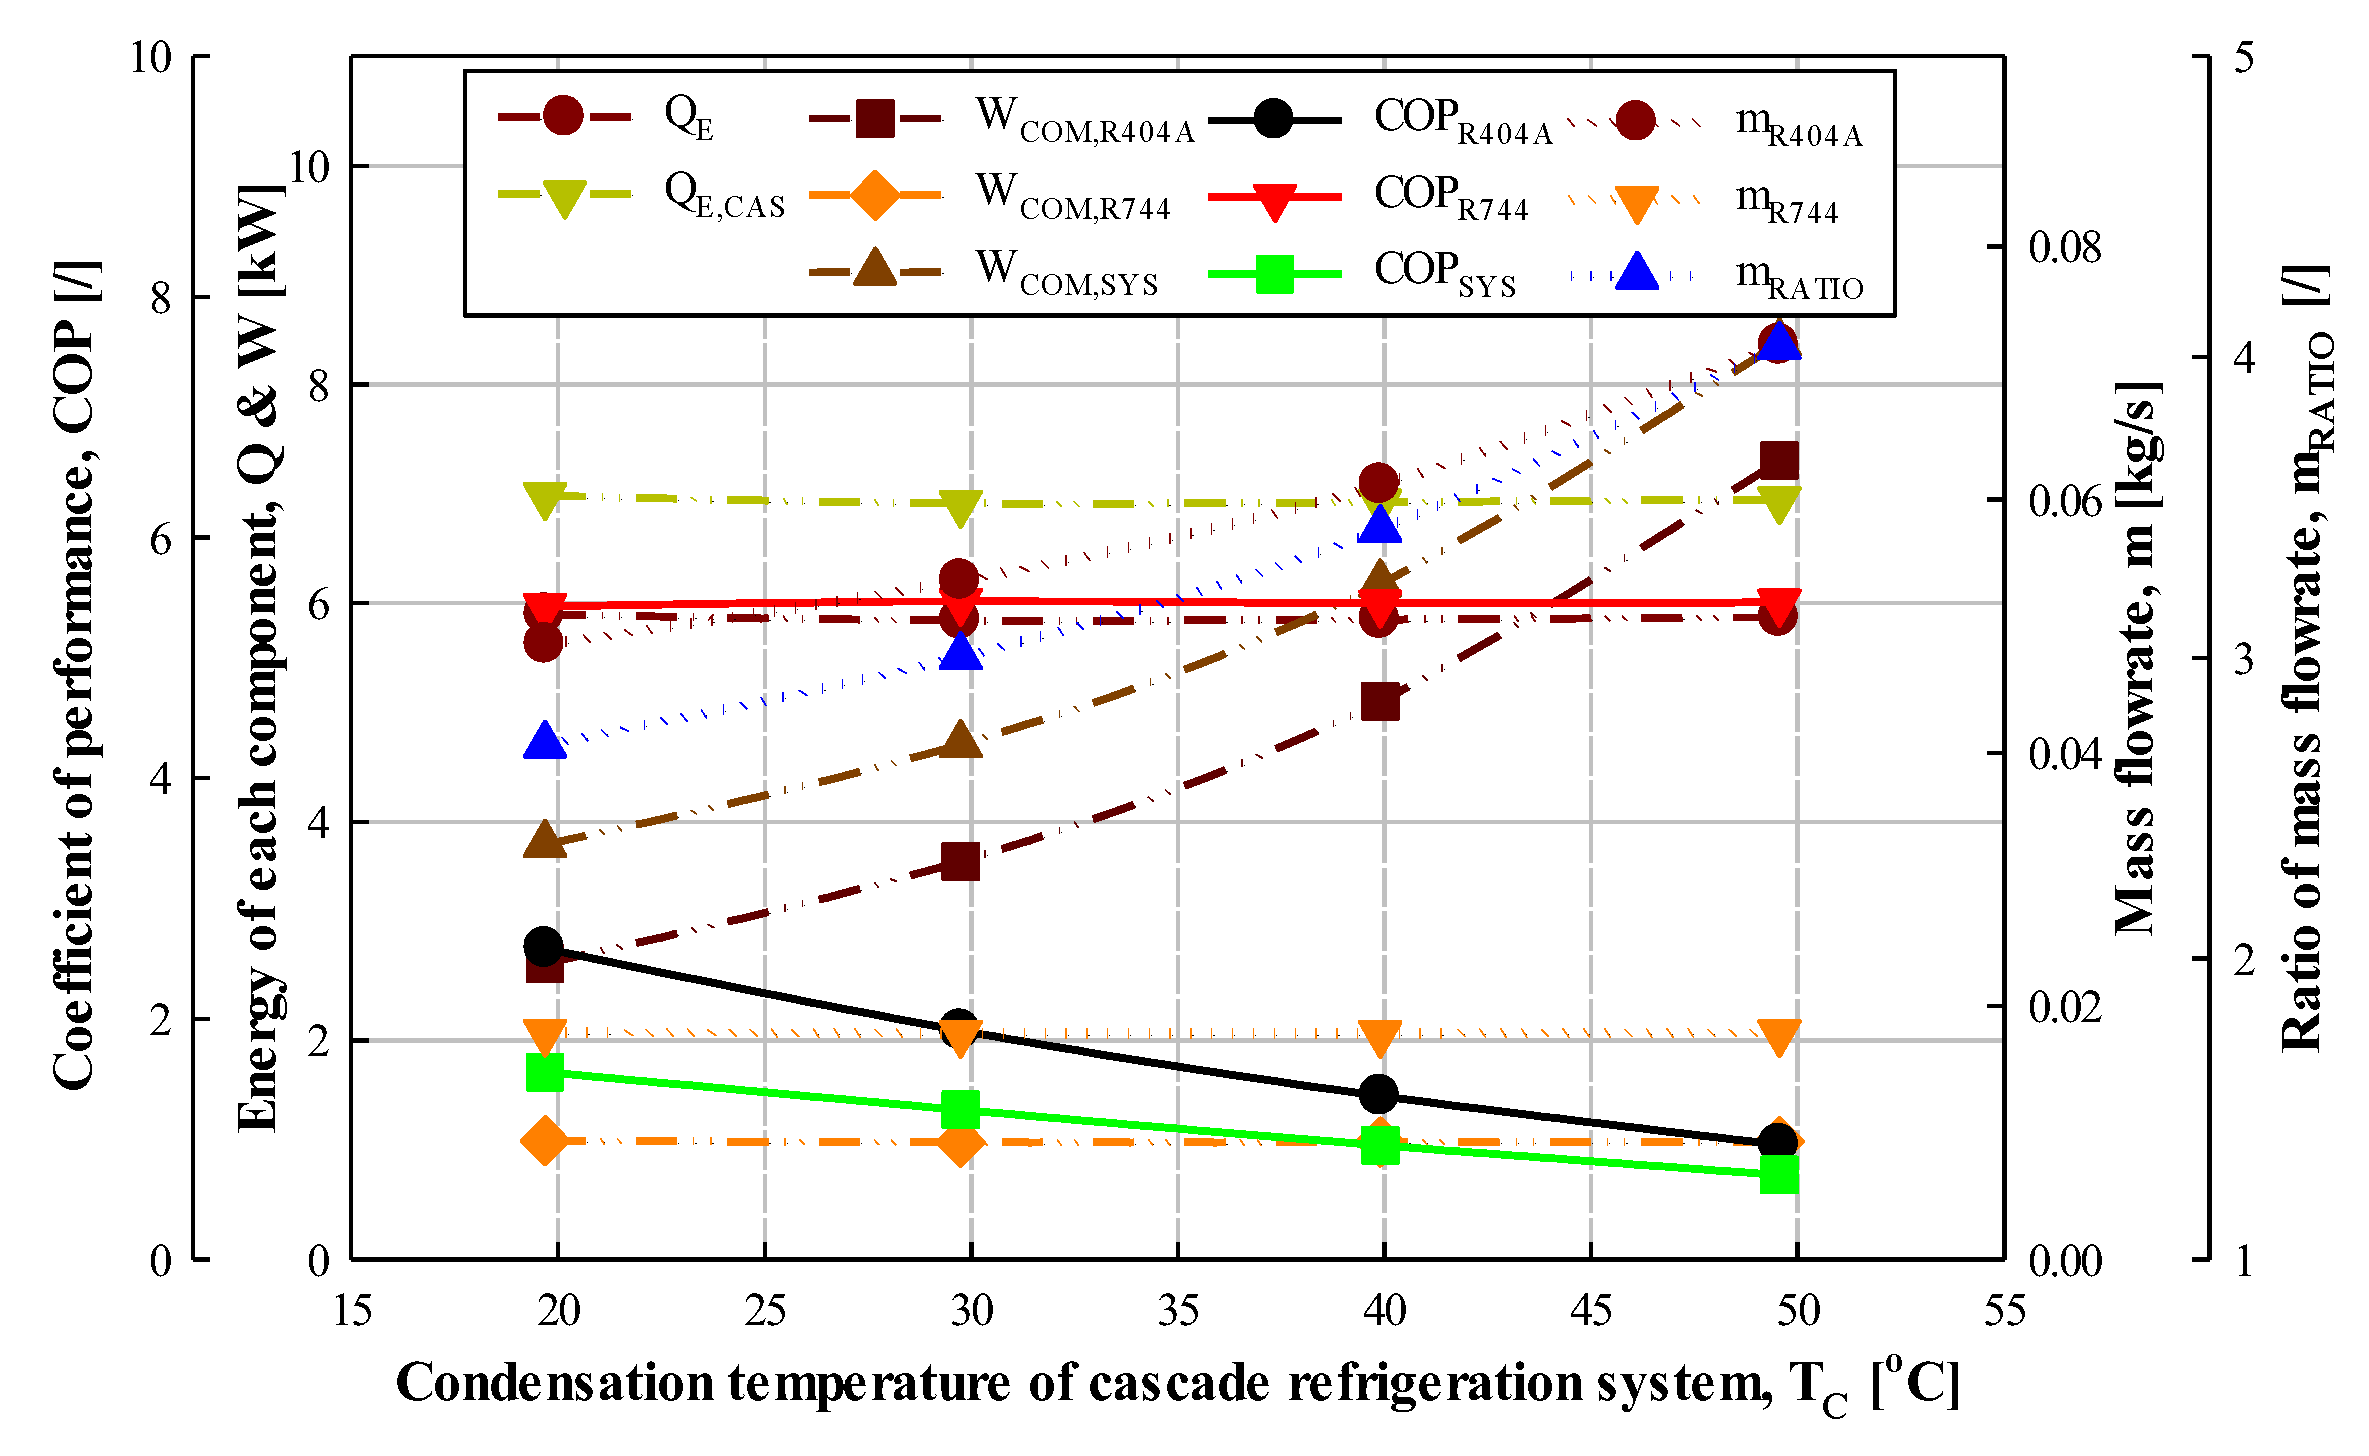
3.2.1. Effect of Condensation Temperature

An experiment was conducted to investigate the effect of increasing the condensation temperature of the cascade refrigeration system by approximately 10 °C intervals from 19.7 to 49.6 °C (under constant conditions: QE = 5.84–5.9kW, TE = −40.1 to −39.7°C, TE,CAS = −25 to −24.4 °C, ΔTSUH,R404A =20.5–21.4 °C, ΔTSUC,R404A = 1.0–1.6 °C, ΔTSUH,R744 = 40.2–40.7 °C, ΔTSUC,R744 = 1.9–2.5 °C, ΔTCAS = 2.9–3.2 °C, ηIHX,R404A = ηIHX,R744 = 0) on the COP and mass flow rate of R404A and R744 cycles and the COP and mass flow ratio of the entire CRS. As shown in Figure 5, there was little change in the COP and mass flow rate of the R744 cycle, whereas the COP of the R404A cycle decreased by 26.4–30.0%. Accordingly, the COP of the entire CRS decreased by 20.1–26.0%.
The reason for this result is that the power consumption of the compressor of the R404A cycle increased as the condensation temperature increased, which decreased the COP of the R404A cycle. Conversely, the COP of the R744 cycle did not change because the enthalpy values of the inlet and outlet of the evaporator and condenser were almost constant. In addition, as the condensation temperature increased in the CRS, the mass flow rate of the R404A cycle increased by 10.4–18.0%, whereas that of the R744 cycle was almost unchanged. Therefore, the mass flow ratio of the entire CRS increased by 10.9–17.7%. Additionally, the total power consumption of the compressor of the CRS increased by 24.1–35.7% (that of the R4744 cycle was almost unchanged, but that of the R404A cycle increased by 34.4–43.1%) and the evaporation capacity was almost constant at 5.84–5.90 kW. Thus, the increased power consumption of the compressor of the R404A cycle reduced the COP of the R404A cycle and the overall CRS. This is consistent with previous results [28,30,31,32,33,34]. As for the mass flow rate, the increased condensation temperature did not change the mass flow rate of the R744 cycle nor the enthalpy values of the evaporator and condenser inlet and outlet. However, although the inlet enthalpy (i1) of the R404A cycle compressor did not change, the outlet enthalpy (i2) increased by 11.7–17.5 kJ/kg. Thus, the cascade evaporation capacity (evaporation capacity of the R404A cycle) and the enthalpy (i8) of the evaporator (evaporator of the R404A cycle) outlet were almost constant, but the enthalpy (i4, i6) of the condenser outlet and the evaporator inlet increased, which reduced the enthalpy difference (i2–i4) between the inlet and outlet of the cascade evaporator, increasing the mass flow rate of the R404A cycle and the mass flow ratio of the CRS. This is confirmed to be consistent with the results of the studies by Getu and Bansal [11] and Son and Moon [27].

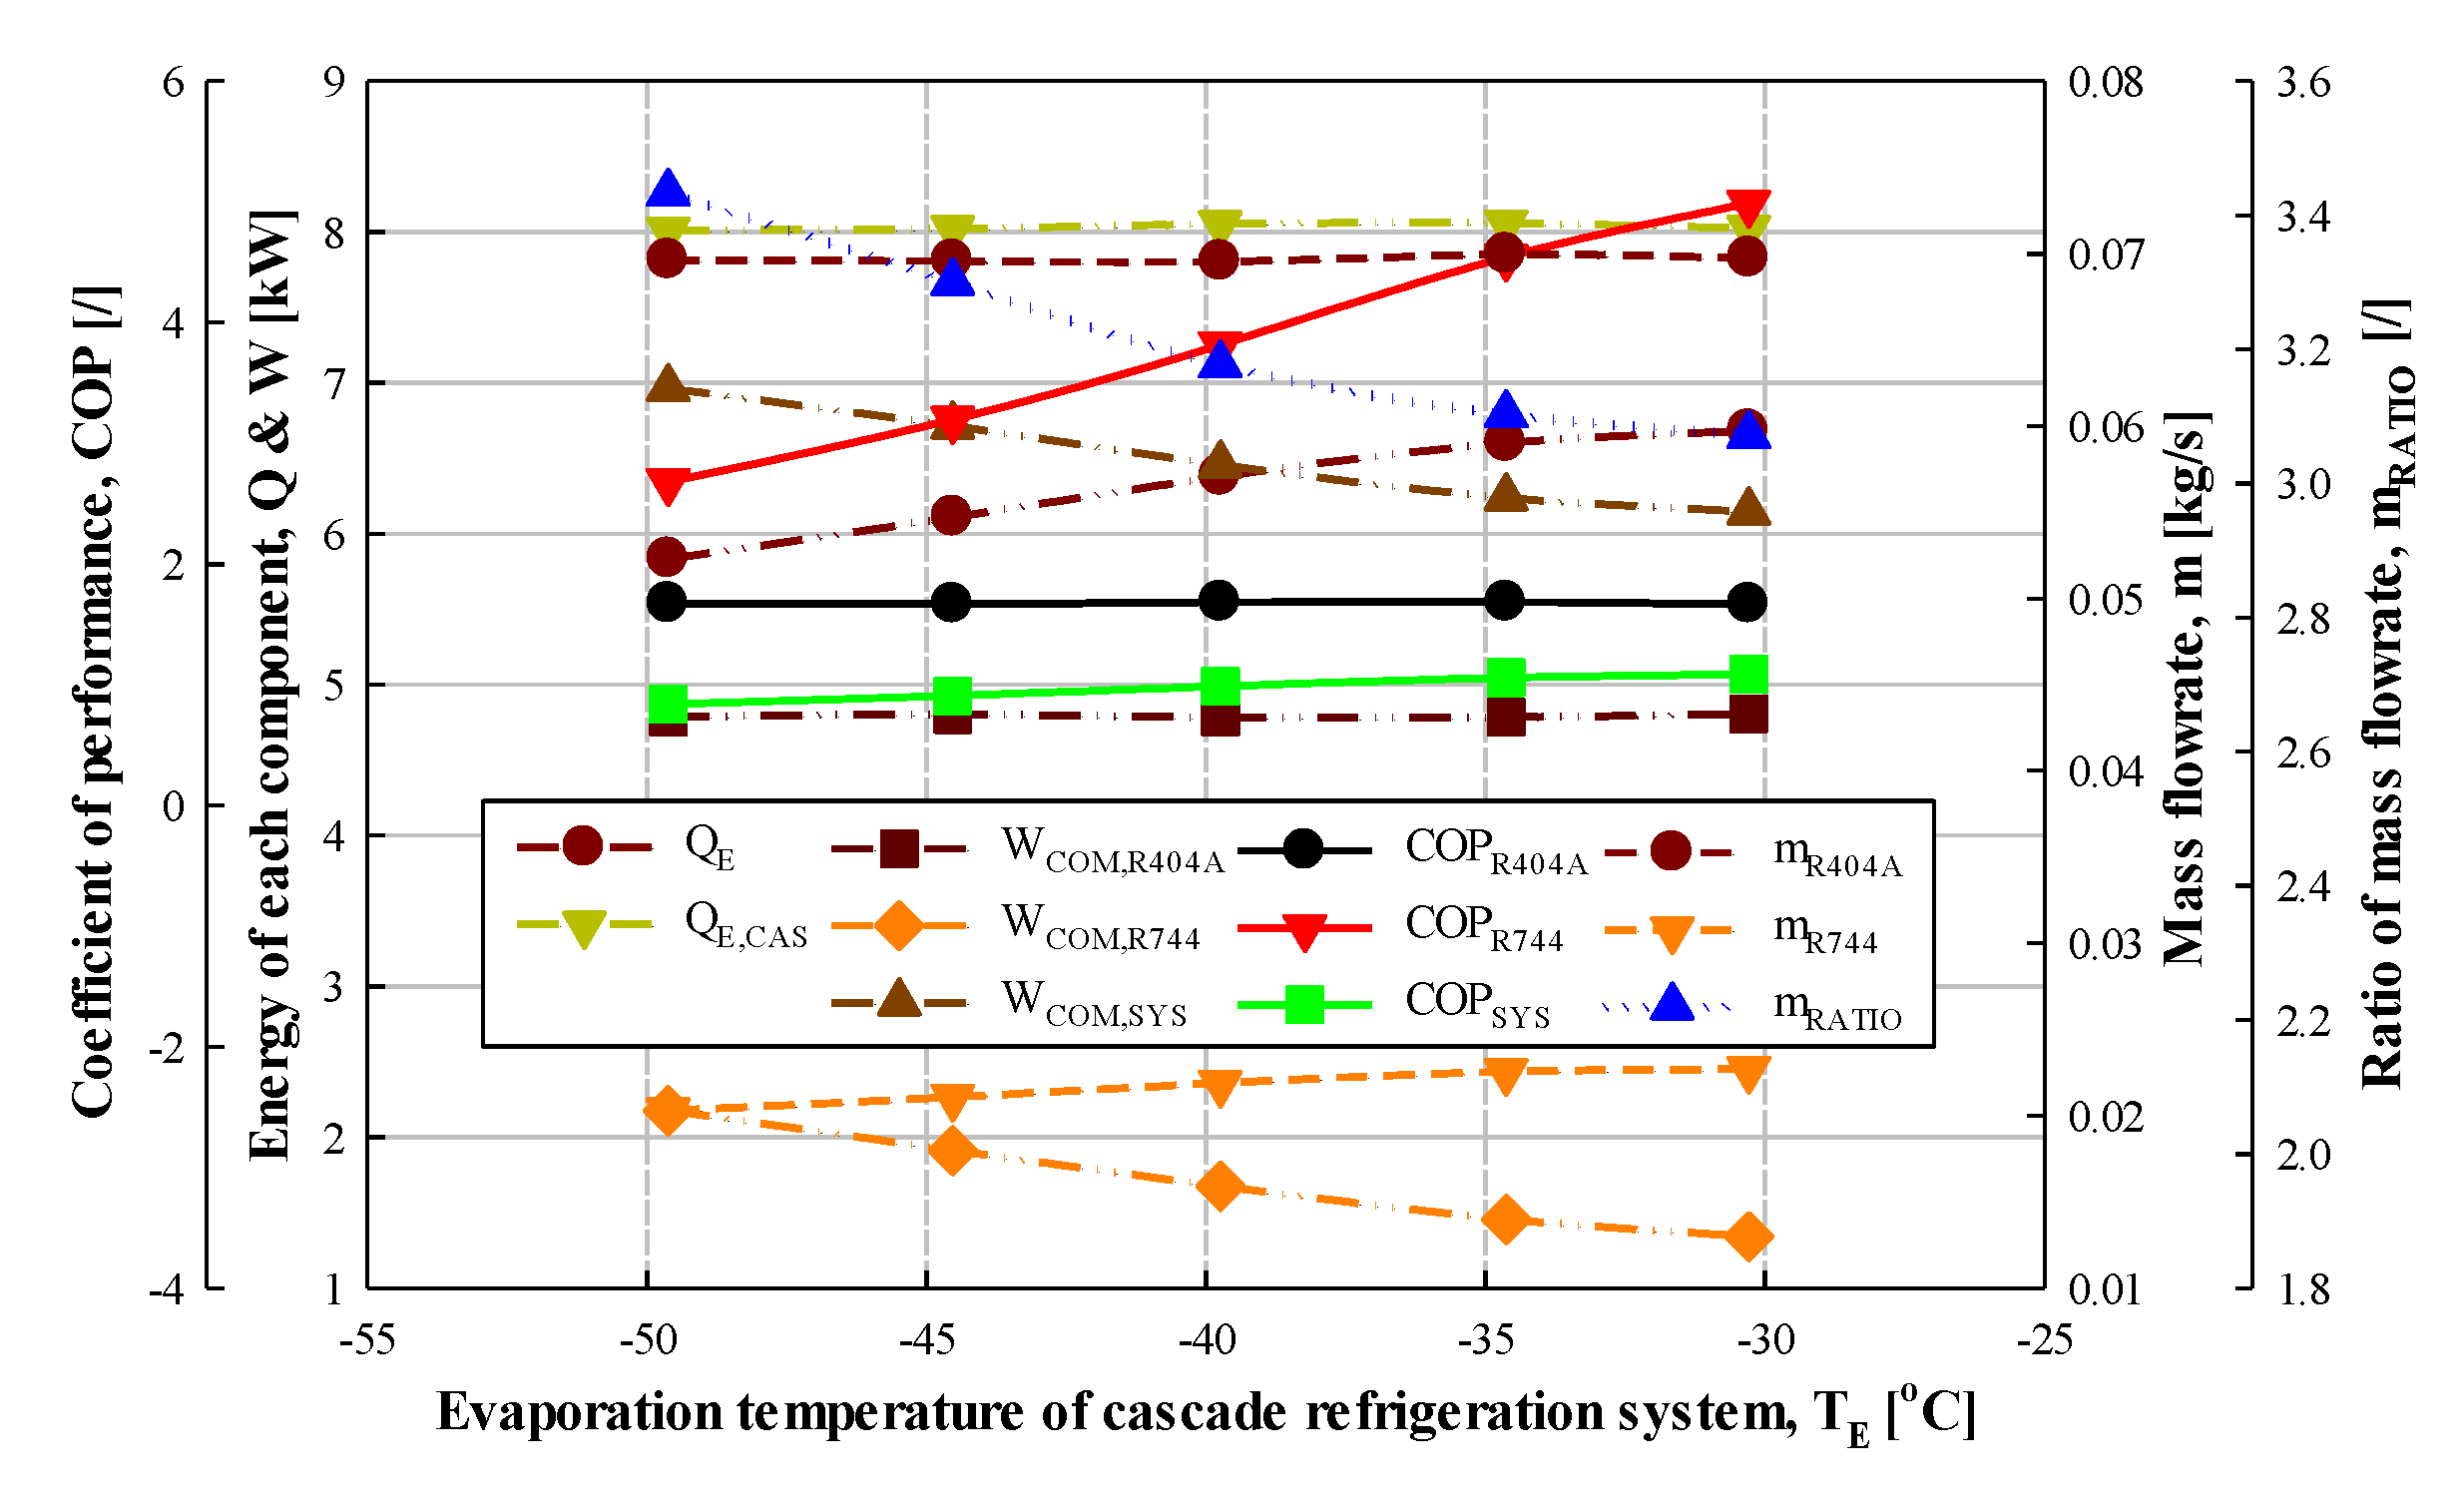
3.2.2. Effect of Evaporation Temperature

The same analysis as in Section 3.2.1 was performed by increasing the evaporation temperature of the CRS by approximately 5 °C intervals from −49.6 °C to −30.3 °C (under constant conditions: QE = 5.84–6.69kW, TE,CAS = −20.8 to −20.1 °C, TC = 39.7–40.6 °C, ΔTSUH,R404A = 20.0–20.7 °C, ΔTSUC,R404A = 0.8–1.6 °C, ΔTSUH,R744 = 9.9–11 °C, ΔTSUC,R744 = 2.9–3.7 °C, ΔTCAS = 3.3 –4.3 °C, ηIHX,R404A = ηIHX,R744 = 0). As shown in Figure 6, the COP of the R744 cycle increased by 9.8–19.3%, whereas that of the R404A cycle hardly changed. Accordingly, the COP of the CRS increased by 2.7–8.6%. This is consistent with the results of Getu and Bansal [11].
This was because the increased evaporation temperature reduced the power consumption of the compressor of the R744 cycle. In addition, the mass flow rate of the R404A cycle hardly changed, whereas that of the R744 cycle increased by 0.7–3.9%. Therefore, the mass flow ratio of the CRS decreased by 1–3.9%. The total power consumption of the compressor of the CRS decreased by 1.5–3.8% (that of the R744 cycle decreased by 7.8–13.1%, whereas that of the R404A cycle was approximately constant), and the evaporation capacity increased by 1.2–4.7%. The reason for these results is that as the evaporation temperature increases, the mass flow rate of the R404A cycle and the inlet and outlet enthalpy values of the compressor, condenser, expansion valve, and evaporator remained almost the same, leading to minimal change in the COP. Moreover, the enthalpy values (i14, i16) of the R744 condenser outlet and evaporator inlet exhibited minimal change; however, the enthalpy values (i11 or i18) of the evaporator outlet and R744 compressor inlet increased by 1.2–2.6 kJ/kg, the enthalpy value (i12) of the R744 compressor outlet decreased by 4.3–14.0 kJ/kg, and the enthalpy difference (i12–i11) at the compressor inlet/outlet decreased by 5.5–16.6 kJ/kg; thus, the enthalpy difference (i18–i16) of the evaporator inlet and outlet increased by 1.4–2.2 kJ/kg. Accordingly, the COP of the R744 cycle and entire CRS increased. This is consistent with previous results [8,11,29,30,35,36]. In addition, as the evaporation temperature (evaporating temperature of the R744 cycle) increased, the mass flow rate of the R404A cycle remained constant, but the mass flow rate of the R744 cycle increased. Thus, the expansion valve of the R744 cycle was opened to match the evaporation temperature, and the mass flow rate increased. This is confirmed to be consistent with the results of the studies by Getu and Bansal [11].

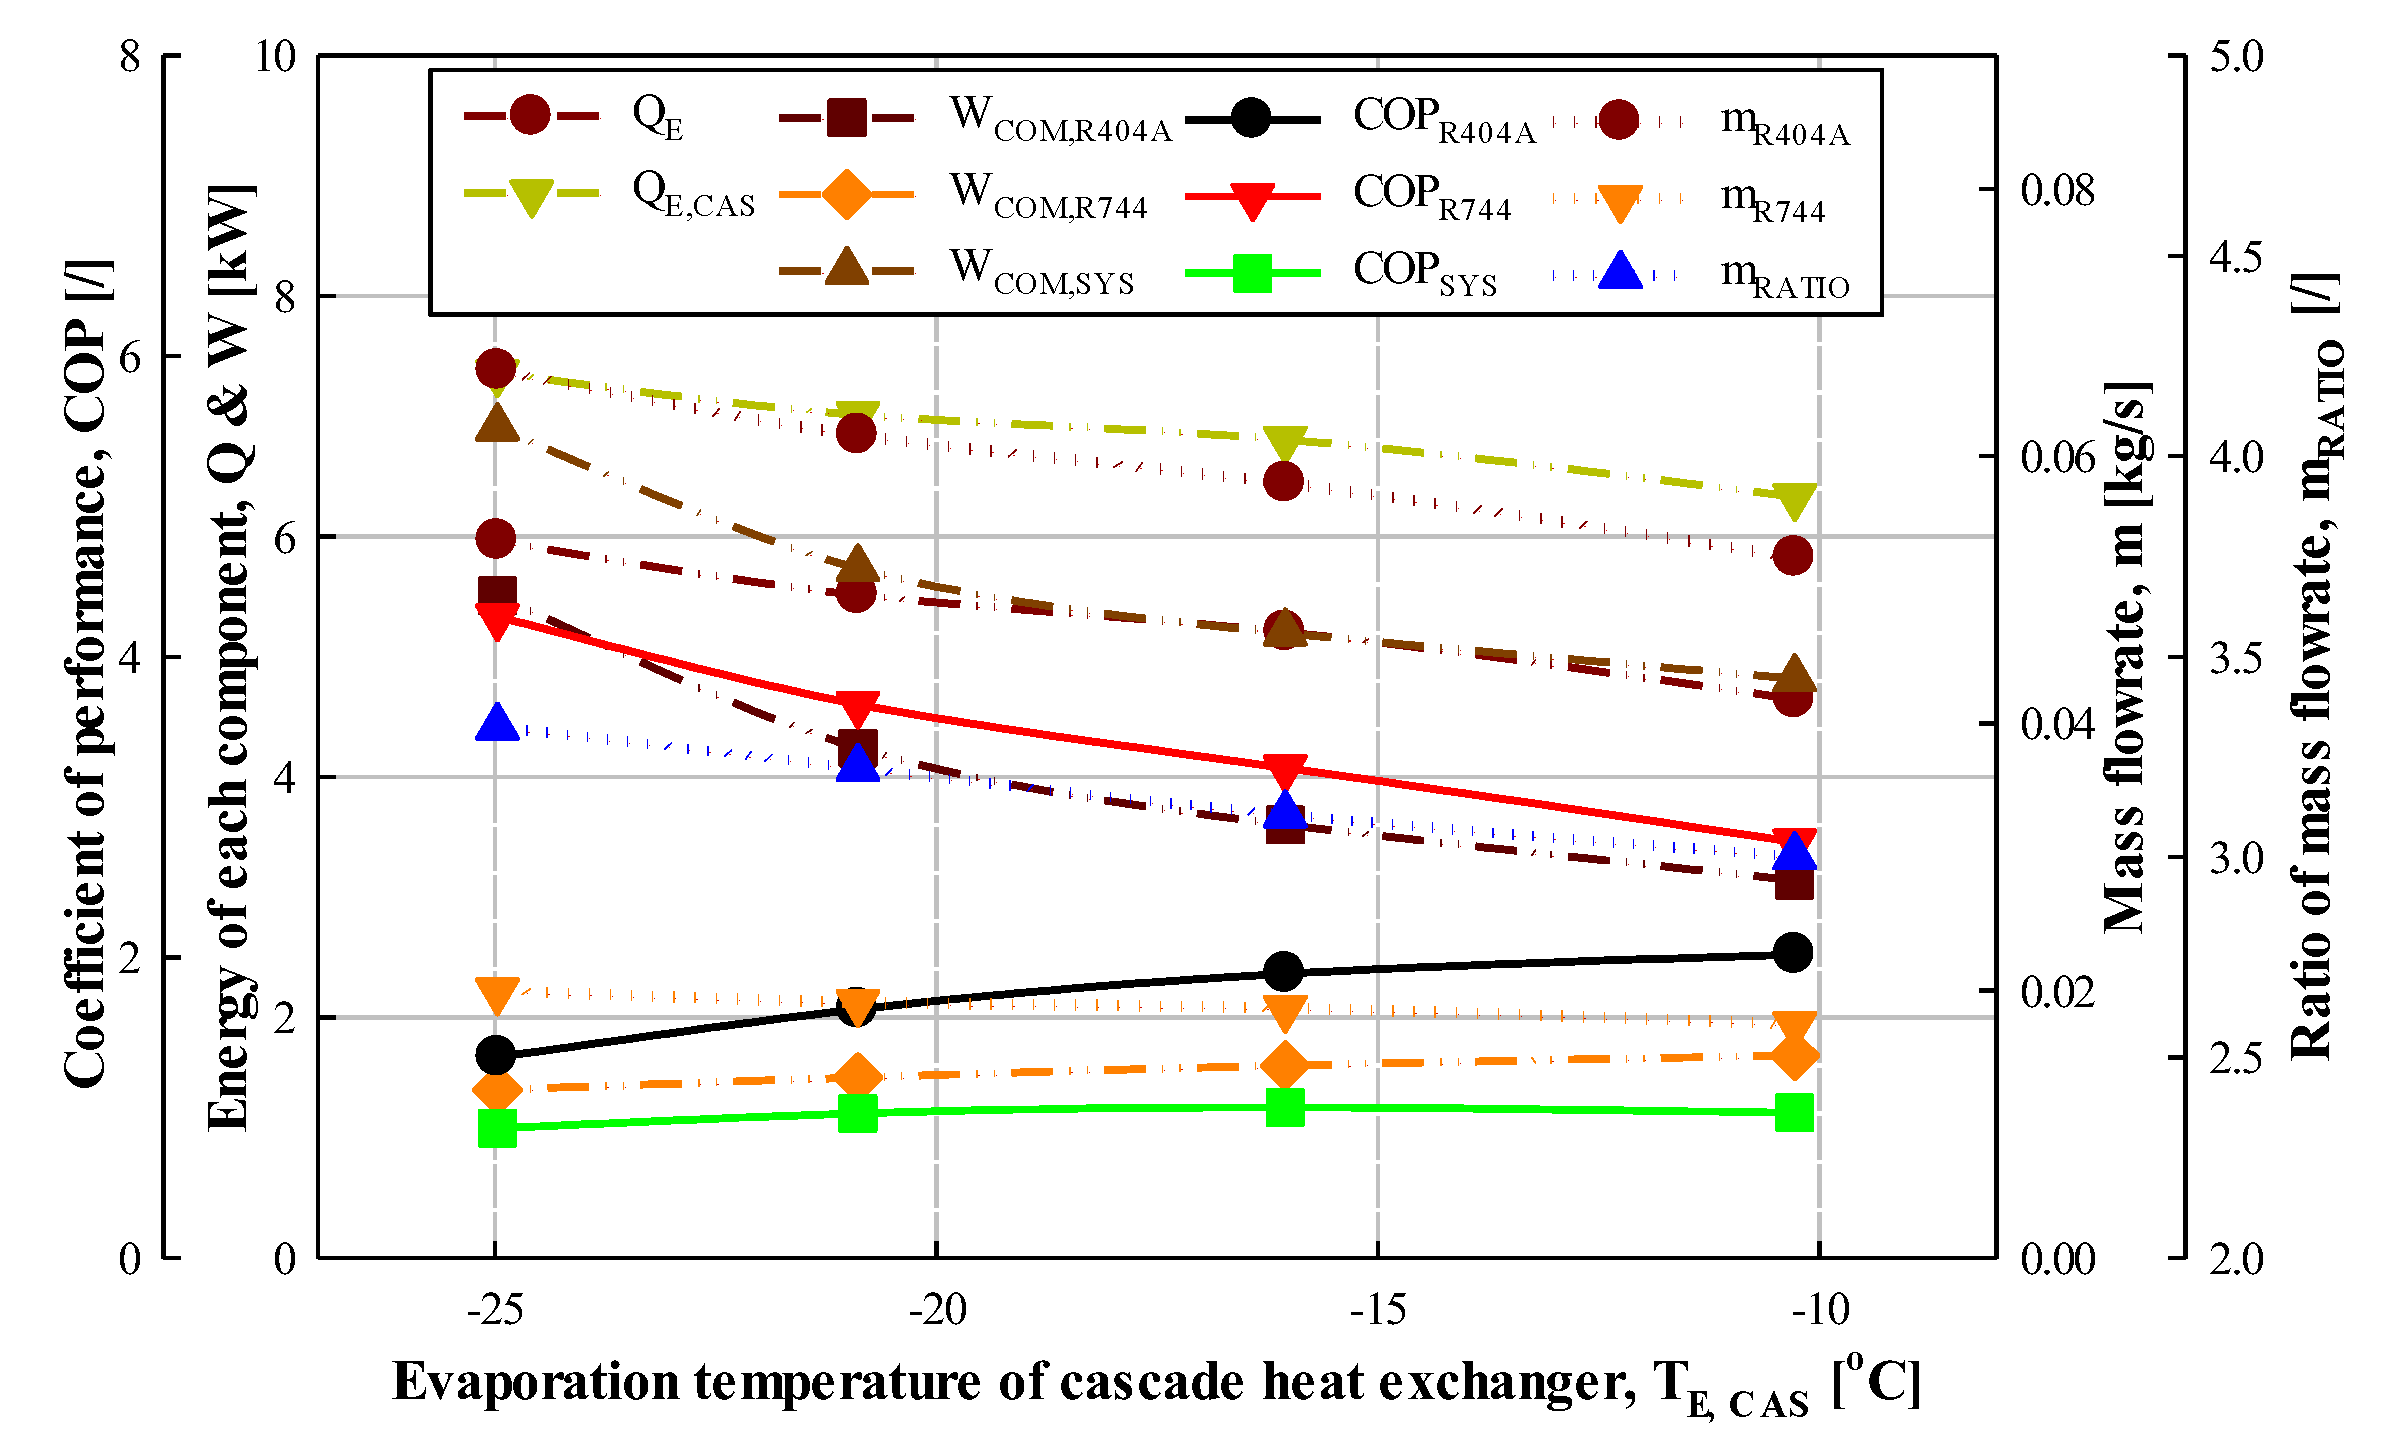
3.3. Effect of Evaporation Temperature of Cascade Heat Exchanger

An experiment was conducted to investigate the effect of increasing the evaporation temperature of the cascade heat exchanger by approximately 5 °C intervals from −25.0 °C to −10.3 °C (under constant conditions: QE = 4.65–5.96kW, TE = −40.1 to −39.7 °C, TC = 41–41.6 °C, ΔTSUH,R404A = 20.2–20.8 °C, ΔTSUC,R404A = 1.4–1.9 °C, ΔTSUH,R744 = 10.4–10.8 °C, ΔTSUC,R744 = 1–1.5 °C, ΔTCAS = 2.9–3.4 °C, ηIHX,R404A = ηIHX,R744 = 0) on the COP and mass flow rate of R404A and R744 cycles and the COP and mass flow ratio of the entire CRS. As shown in Figure 7, the COP of the R744 cycle decreased by 13.0–17.8%, whereas the COP of R404A increased by 6.3–19.3%. Accordingly, the COP of the entire CRS increased and then decreased by 3.8–10.2%.
In detail, as the evaporation temperature of the cascade heat exchanger increased, the condensation temperature of the R744 cycle increased, the enthalpy difference (i18–i16) between the evaporator inlet and outlet in the R744 cycle decreased, and the enthalpy difference (i12–i11) between the R744 compressor inlet and outlet increased, which reduced the COP of the R744 cycle. Conversely, in the R404A cycle, the enthalpy difference (i8–i6) of the evaporator inlet and outlet in the R404A cycle increased, whereas that (i2–i1) of the R404A compressor inlet and outlet decreased, which increased the COP of the R404A cycle. Thus, the COP of the entire CRS increased and then decreased in the form of a parabola, indicating an optimum evaporation temperature of the cascade heat exchanger (about −16 °C) that depends on the characteristics of the high- and low-temperature side refrigerants. The same results were obtained in previous studies [7,8,11,12,21,23,25,26,29]. Specifically, Nicola et al. stated that “the optimum COP of a CRS is greatly affected by the optimum intermediate temperature for each refrigerant” [7], and Yun and Cho reported that “the condensation temperature of the cascade condenser is set very low or very high, and it is judged that the maximum COP is formed at the equilibrium point. This is because the load on the compressor increases” [12].
Furthermore, as the cascade evaporation temperature increased, the mass flow rate of both the R404A cycle and R744 cycle decreased by 6.2–10.6% and 2.4–6.9%, respectively. The mass flow ratio of the CRS decreased by 3.2–3.7%, which was larger than the mass flow rate reduction of the R744 cycle. The same results were obtained by Getu and Bansal [11], Son and Moon [27], and Parekh and Tailor [33]. Additionally, the total power consumption of the compressor of the CRS decreased by 5.2–11.0% and then increased by 3.8% at a temperature of approximately −16 °C (the power consumption of the compressor of the R404A cycle was significantly reduced by 2.3–19.9%, whereas that of the R744 cycle increased by 10.6–15.2%), and the evaporation capacity was almost unchanged at 5.83–5.89 kW. In detail, from a cascade evaporation temperature of approximately −16 °C, the power consumption of the compressor of the R744 cycle ceased decreasing and began to increase linearly. Thus, the total power consumption of the compressor of the CRS, which is the sum of the two cycle compressors, decreased only until a cascade evaporation temperature of approximately −16 °C (optimum evaporation temperature).

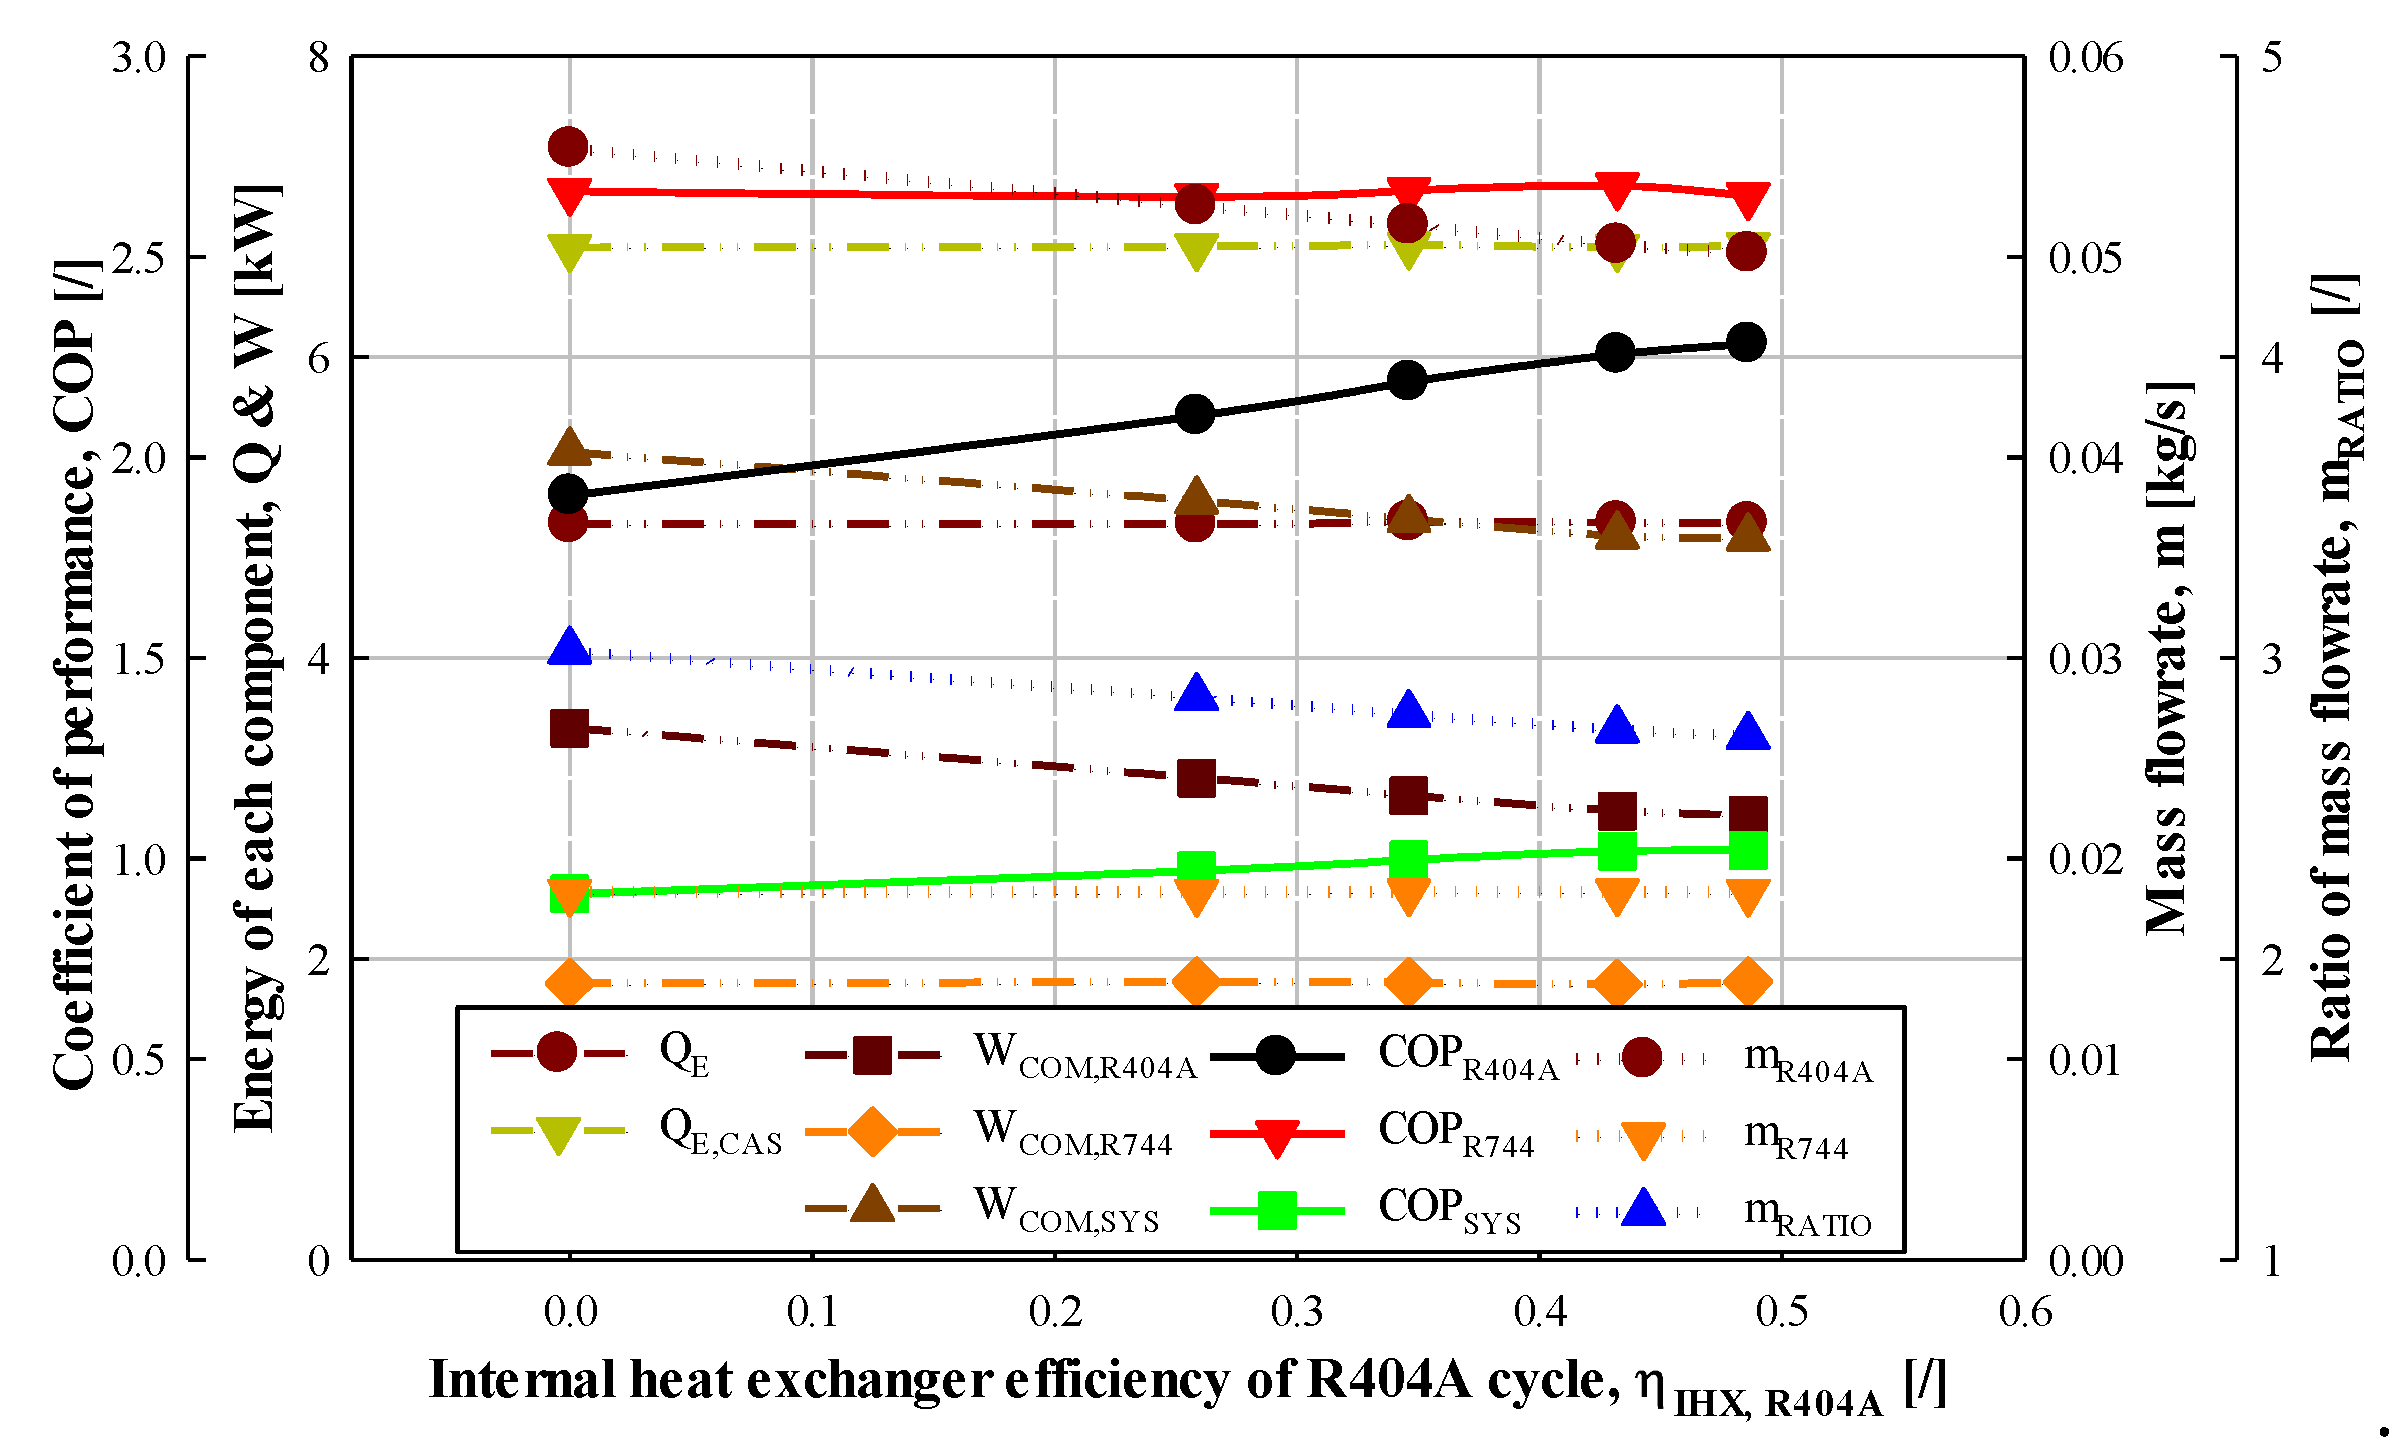
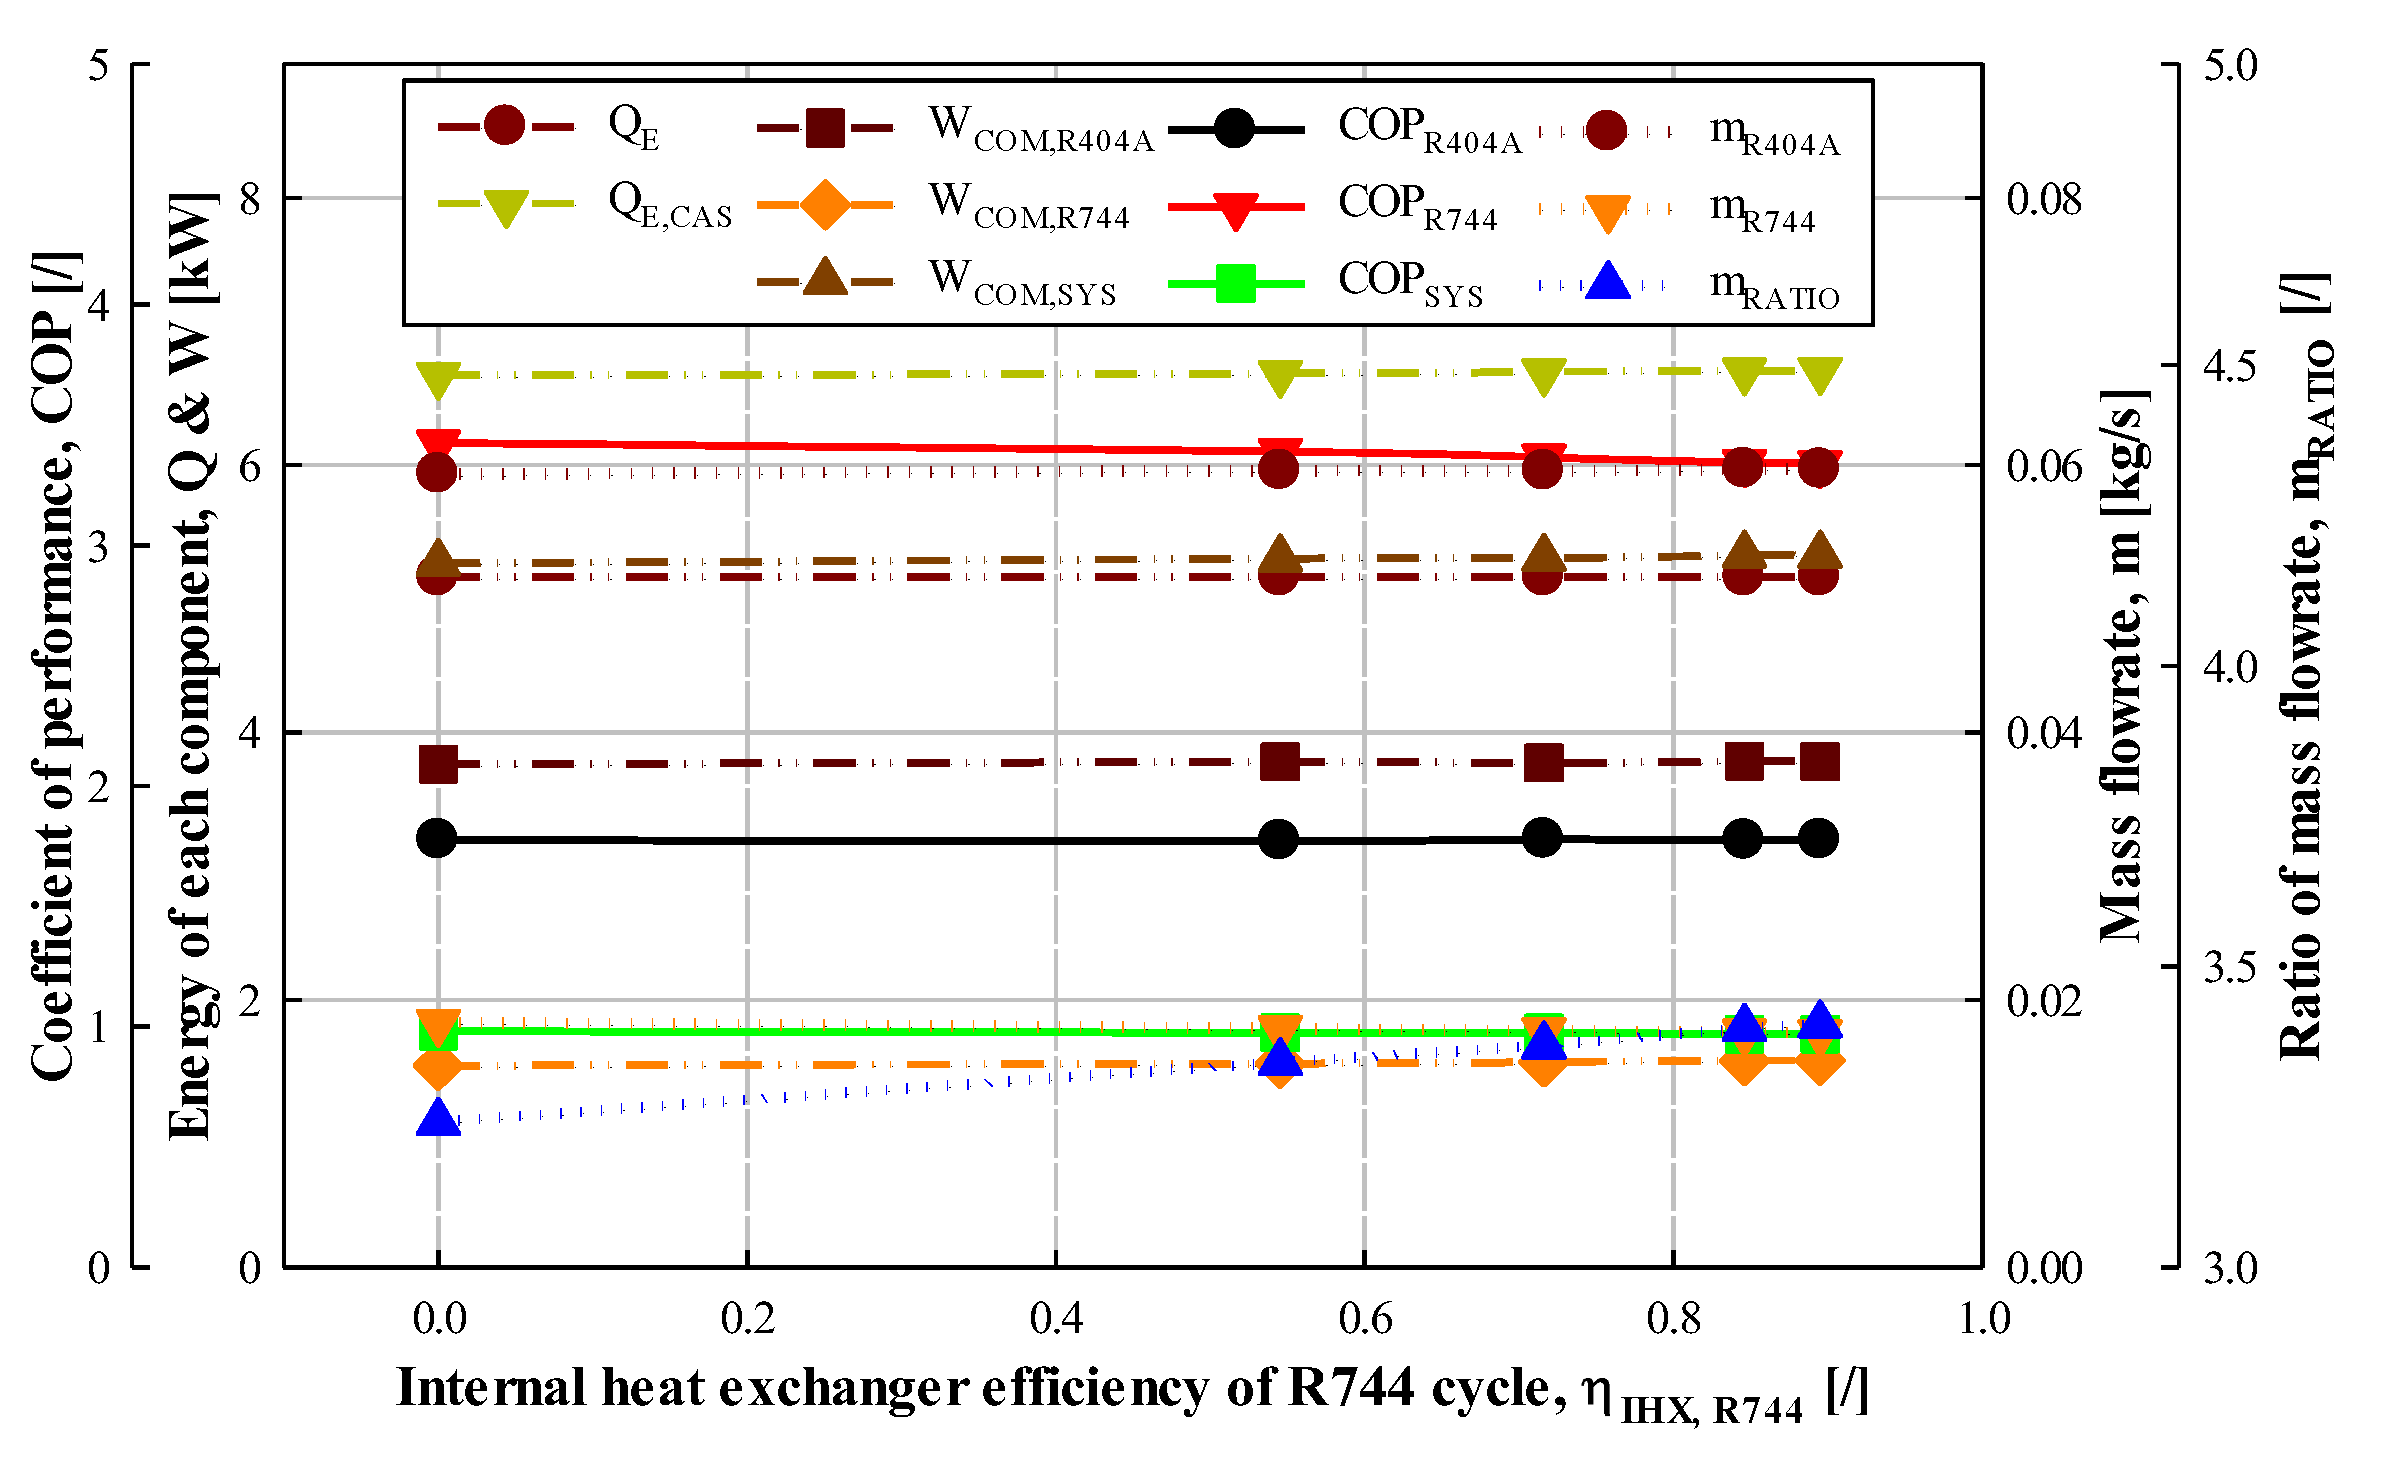
3.4. Effect of Internal Heat Exchanger Efficiency

3.4.1. Effect of Internal Heat Exchanger Efficiency at R404A Cycle

An experiment was conducted to investigate the effect of increasing the number of stages (i.e., increasing the efficiency) of the R404A cycle internal heat exchanger (IHE) from 0 to 4 (under constant conditions: QE = 4.89–4.91kW, TE = −40 to −39.8 °C, TE,CAS = −10.8 to −10.2 °C, TC = 39.6–40 °C, ΔTSUH,R404A = 20.2–20.8 °C, ΔTSUC,R404A = 0.8–1.1 °C, ΔTSUH,R744 = 10–10.5 °C, ΔTSUC,R744 = 1.1–1.4 °C, ΔTCAS = 2.4–2.9°C, ηIHX,R744 = 0) on the COP and mass flow rate of R404A and R744 cycles and the COP and mass flow ratio of the entire CRS. As shown in Figure 8, the IHE efficiency was 0%, 25.9%, 34.6%, 43.2%, and 48.6% at stage 0, 1, 2, 3, and 4, respectively. As the number of stages was gradually increased, the COP and mass flow rate of the R744 cycle exhibited minimal changes, whereas the COP of the R404A cycle increased by 1.2–10.4% and the COP of the entire CRS accordingly increased by 0.2–6.4%.
In detail, the mass flow rate of the R404A cycle decreased by 0.8–5.2%, the mass flow rate of the R744 cycle was almost unchanged, and the mass flow ratio of the CRS decreased by 0.8–5.1%. Furthermore, the total compressor power consumption of the CRS decreased by 0.3–6.1% (the power consumption of the R744 compressor was approximately unchanged, whereas the power consumption of the R404A compressor decreased by 1.0–9.4%), and the evaporation capacity was almost constant at 4.89–4.91 kW. Therefore, the evaporation temperature, superheating, subcooling, condensation temperature, and enthalpy (i8) of the evaporator outlet remained constant in the R404A cycle, whereas the enthalpy (i6) of the evaporator inlet in the R404A cycle decreased. Therefore, the enthalpy difference (i8–i6) between the evaporator inlet and outlet increased. The enthalpy (i1, i2) at both the compressor inlet and outlet in the R404A cycle increased, but the increase in enthalpy at the compressor inlet is greater than at the outlet, so the enthalpy difference (i2–i1) of the compressor inlet and outlet decreased. This was due to the physical properties of the R404A refrigerant. Thus, the increase in COP with an increasing number of IHE stages of the R404A cycle occurred because of the effect of the superheating and subcooling in the R404A cycle. That is, when the superheating or subcooling increased, the COP of the R404A cycle also increased. Therefore, using an IHE with high efficiency in the R404A cycle is advantageous in terms of the COP. This is confirmed to be consistent with the results of Son and Moon [27], Oruğç and Devecioğlu [37], and Jin et al. [38].

3.4.2. Effect of Internal Heat Exchanger Efficiency at R744 Cycle

The same experiment as that in Section 3.4.1 was performed for the R744 IHE. As shown in Figure 9, the IHE efficiencies were 0%, 54.6%, 71.6%, 84.6%, and 89.5% at stage 0, 1, 2, 3, and 4, respectively. As the number of stages was gradually increased, the COP and mass flow rate of the R404A cycle exhibited minimal changes, whereas the COP of the R744 cycle decreased by 0.1–1.1% and the COP of the CRS accordingly decreased by 0.01–0.7%. This is consistent with the results of Llopis et al. [39].
In detail, the mass flow rate of the R744 cycle decreased by 0.2–2.5%, the mass flow rate of the R404A cycle was almost unchanged, and the mass flow ratio of the CRS increased by 0.2–3.1%. Furthermore, the total compressor power consumption of the CRS increased by 0.1–0.7% (the power consumption of the R404A compressor was almost unchanged, but that of the R744 compressor increased by 0.1–1.1%), and the evaporation capacity was almost constant at 5.1–5.2 kW. Thus, in the R744 cycle, the evaporation temperature, subcooling and superheating, condensation temperature, and enthalpy (i18) at the evaporator outlet was constant, whereas the enthalpy (i16) at the evaporator inlet decreased as the number of IHE stages increased. This increased the enthalpy difference (i18–i16) between the inlet and outlet of the evaporator, with both enthalpies (i11, i12) at the inlet and outlet of the compressor also increasing. The different properties of the R404A and R744 refrigerant led to different COP values for these cycles. In the IHE, the subcooling and superheating occur at the same time, but the effect of the superheating is greater than the subcooling; therefore, according to the results discussed in Section 3.1.2, the COP of the R744 cycle was reduced.
Therefore, not applying the IHE in the R744 cycle is advantageous in terms of the COP and economy because the COP decreases when a high-efficiency IHE is used in the R744 cycle. Similarly, Zhang et al. stated that it is better not to apply the IHE in the subcritical R744 refrigeration cycle [40]. This is because the increase in the power consumption of the compressor is larger than the increase in evaporation capacity.

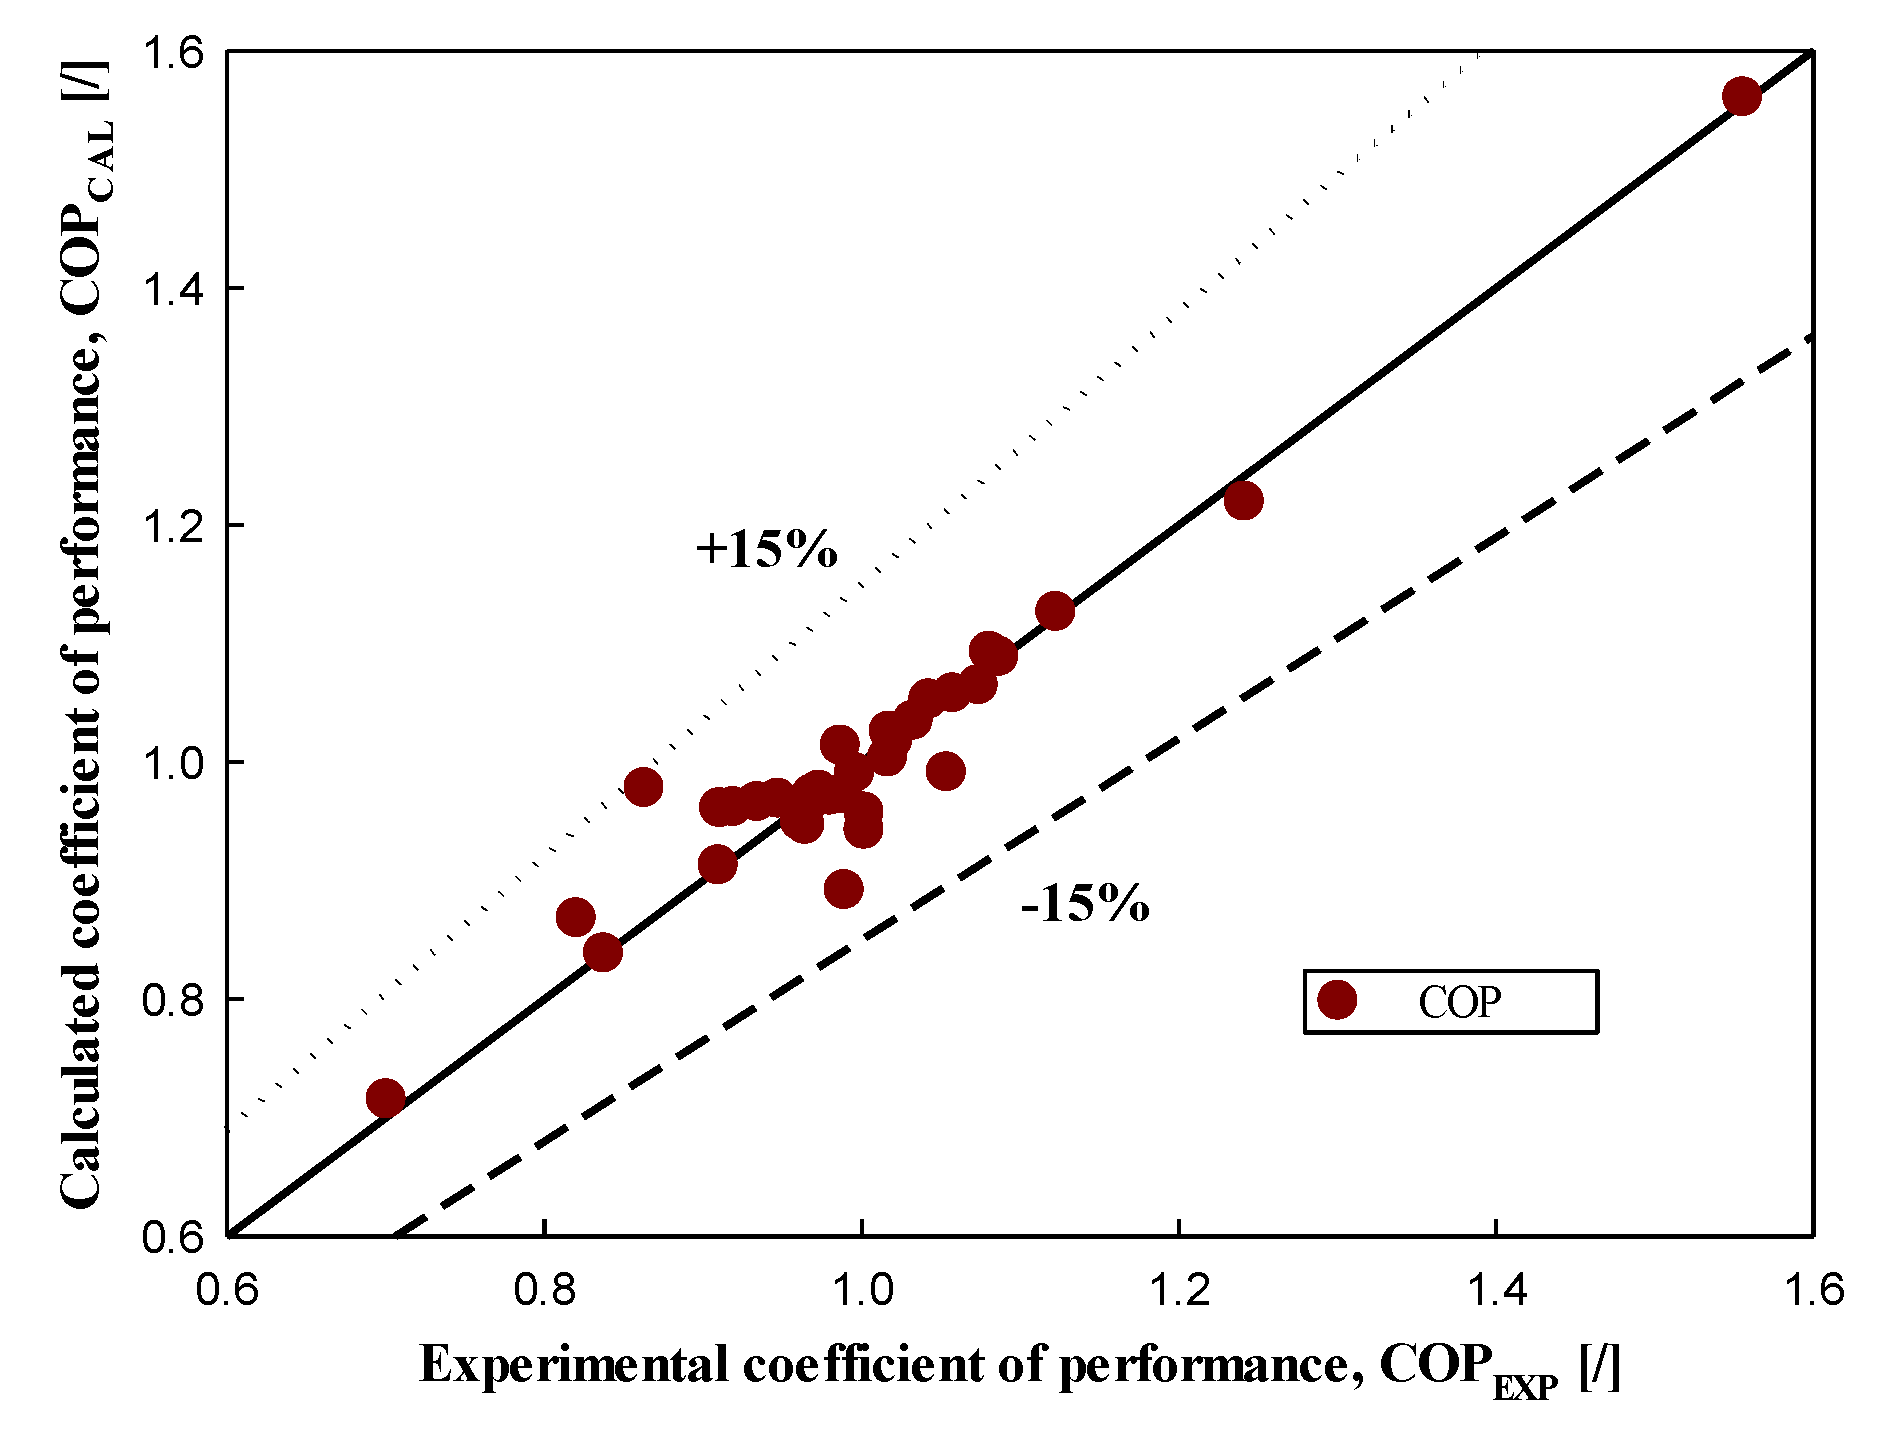
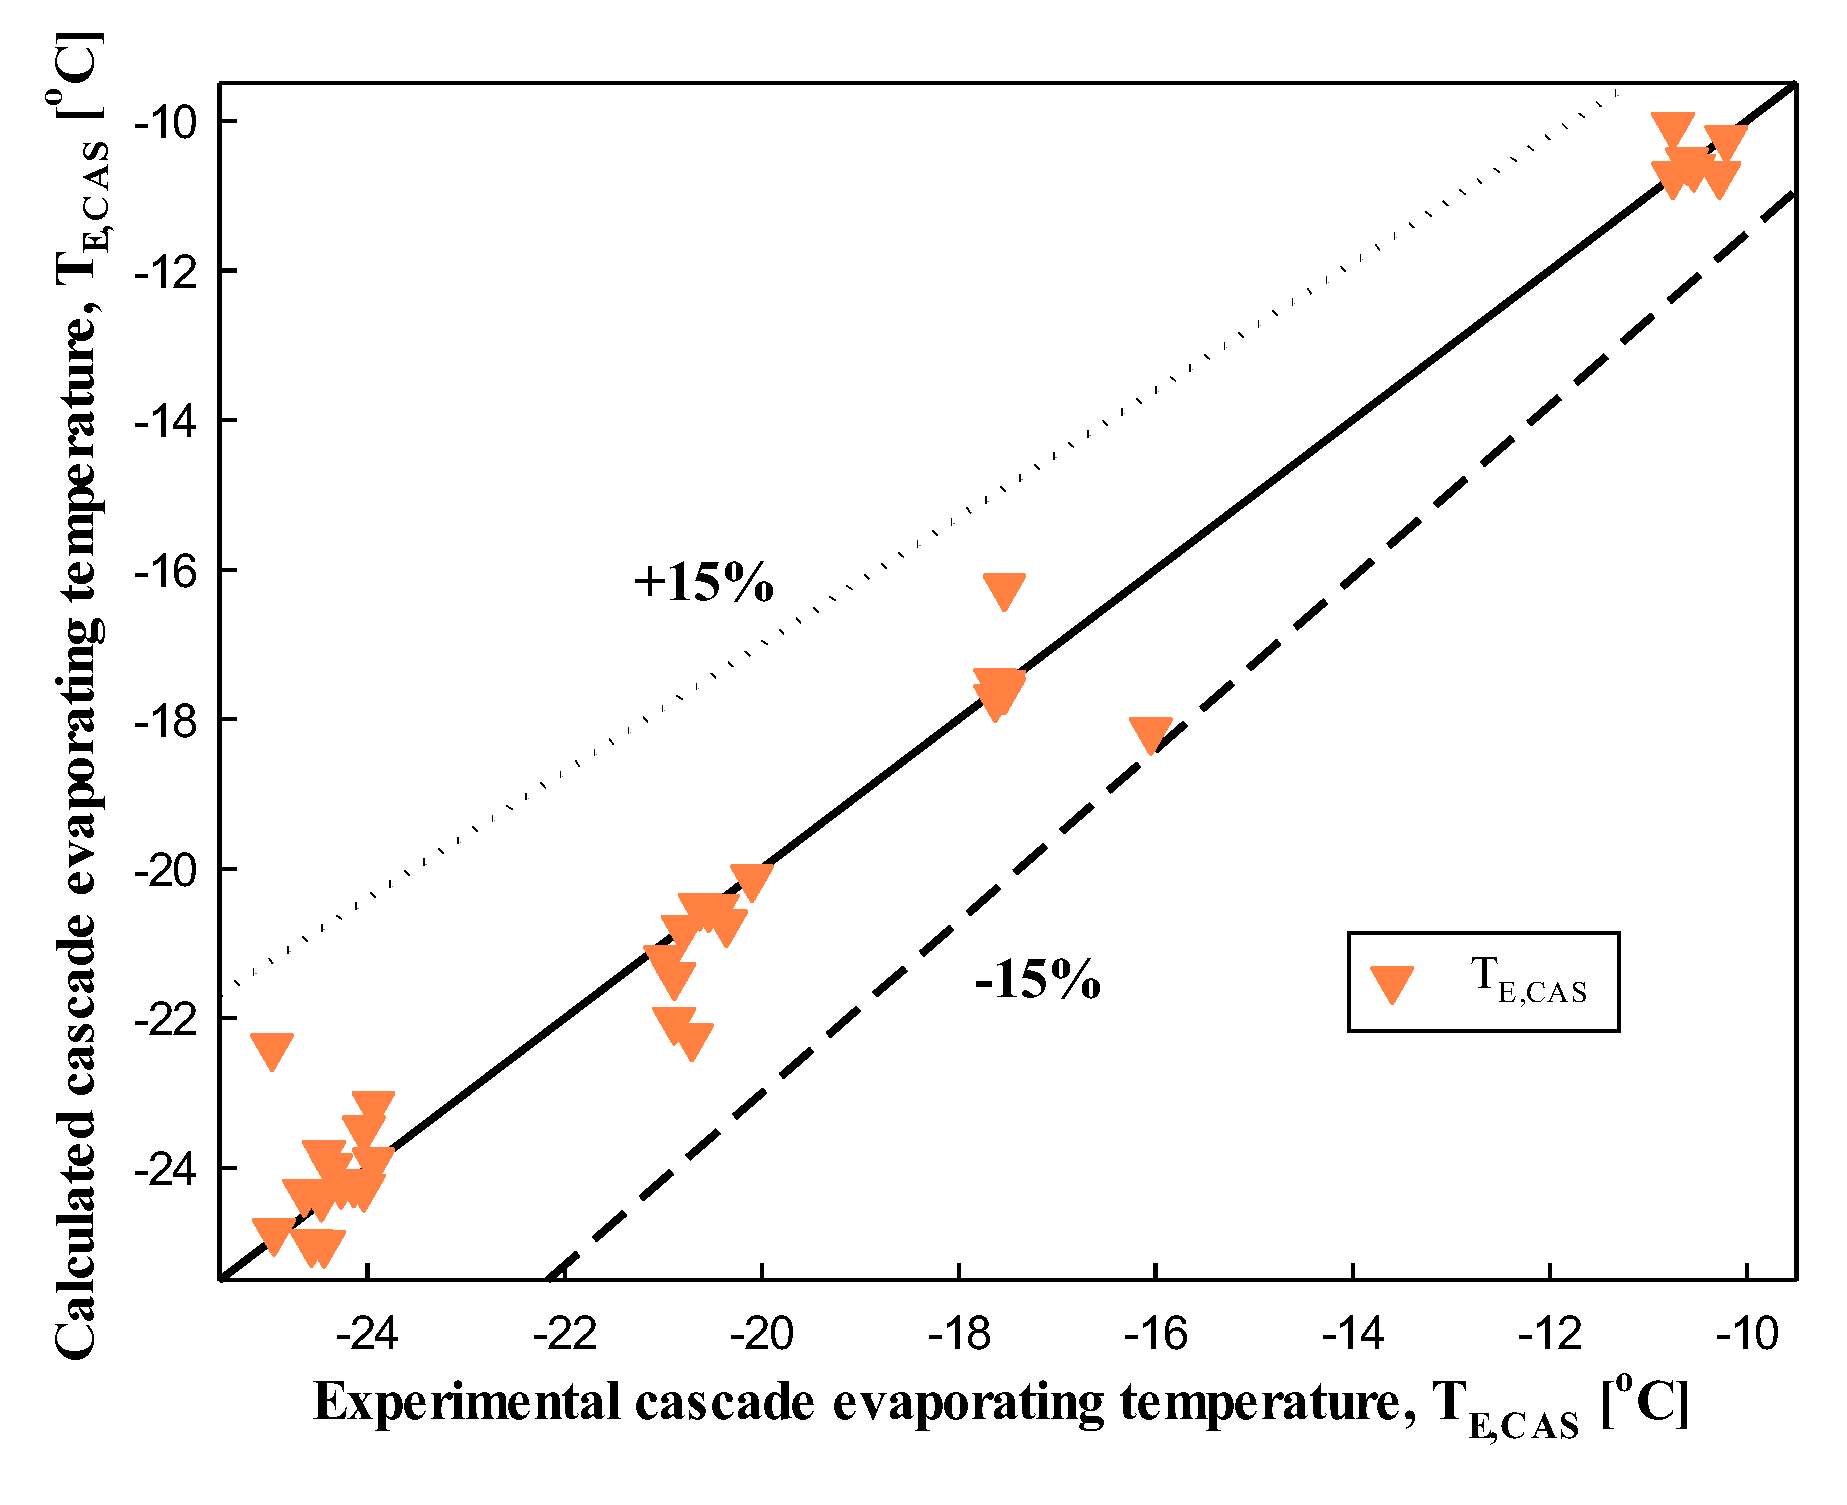
3.5. Comparison of Experimental and Performance Analysis Data

Figure 3 shows the experimental results of the COP, mass flow rate, and energy according to the superheating of the R404A cycle, obtained under certain conditions (QE = 5.69–5.71kW, TE = −40.0 to −39.8 °C, TE,CAS = −24.6 to−24.3 °C, TC = 39.8–40.0 °C, ΔTSUC,R404A = 0.6–1.3 °C, ΔTSUH,R744 = 40.0–40.6°C, ΔTSUC,R744 = 2.1–2.3 °C, ΔTCAS = 2.9–3.3°C, ηIHX,R404A = ηIHX,R744 = 0). Conversely, Figure 10 shows the results obtained through performance analysis; the analysis conditions (QE = 5.69kW, TE = −40°C, TE,CAS = −24.5°C, TC = 40.0 °C, ΔTSUC,R404A = 1 °C, ΔTSUH,R744 = 10 °C, ΔTSUC,R744 = 2.2 °C, ΔTCAS = 3.1 °C, ηIHX,R404A = ηIHX,R744 = 0, ηCOM,R744 = 0.499, ηCOM,R404A = 0.485) in Figure 10 were adjusted to match the experimental data conditions as closely as possible. The power consumption of R404A and R744 compressors under similar conditions exhibited a smaller decrease in the performance analysis than in the experimental data; however, the overall trend was the same. In addition, the COP and mass flow rate results according to the subcooling of the R404A cycle, the superheating of the R744 cycle, the evaporation temperature, the condensation temperature, the cascade evaporation temperature, and the IHE efficiency all showed the same results. Hence, the reason for the difference between the experimental data and performance analysis results was the difference in the power consumption of the compressor, that is, the compression efficiency. Therefore, further studies on the compression efficiency are required. By correcting and supplementing this, even if there is no detailed knowledge of refrigeration, I propose a formula that can easily calculate the COP in the CRS, the optimum cascade evaporation temperature according to each condition, and the mass flow ratio related to the refrigerant charging amount in the following content.

3.6. Multilinear Regression Analysis

This study analyzed the effect of six factors (superheating (∆TSUH,R744, ∆TSUH,R404A), subcooling (∆TSUC,R744, ∆TSUC,R404A), IHE efficiency (ηIHX,R744, ηIHX,R404A), evaporation temperature (TE), condensation temperature (TC), and cascade evaporation temperature (∆TCAS)) on the performance of the R744/R404A CRS. The results revealed the existence of a maximum COP (COPMAX) of the CRS, an optimum cascade evaporation temperature ((TE,CAS)OPT), and an optimum mass flow ratio ( m R 404 A m R 744 OPT ). Although previous studies [8,9,11] have performed multiple regression analysis for CRSs, none of them included an IHE or performed a detailed analysis. Therefore, mathematical equations for the maximum COP and optimum cascade evaporating temperature and mass flow ratio of the R744/R404A CRS with an IHE were developed through a detailed multiple regression analysis as a function of the six factors influencing system performance, and the results are summarized as follows.
COP MAX = f ( T E , Δ T SUH , R 744 , Δ T SUC , R 744 ,   η IHX , R 744 ,   Δ T CAS ,   Δ T SUH , R 404 A ,   Δ T SUC , R 404 A ,   η IHX , R 404 A ,   T C
T E , CAS OPT = f T E ,   Δ T SUH , R 744 , Δ T SUC , R 744 ,   η IHX , R 744 ,   Δ T CAS ,   Δ T SUH , R 404 A ,   Δ T SUC , R 404 A ,   η IHX , R 404 A ,   T C
m R 404 A m R 744 OPT = f T E ,   Δ T SUH , R 744 , Δ T SUC , R 744 ,   η IHX , R 744 ,   Δ T CAS ,   Δ T SUH , R 404 A ,   Δ T SUC , R 404 A ,   η IHX , R 404 A ,   T C
The equation for the results of multiple regression analysis of maximum COP and optimal cascade evaporating temperature and mass flow ratio are as follows.
COP MAX = a 0 + a 1 T E + a 2 T E 2 + a 3 T E 3 + a 4 Δ T SUH , R 744 + a 5 Δ T SUH , R 744 2 + a 6 Δ T SUH , R 744 3 + a 7 Δ T SUC , R 744 + a 8 Δ T SUC , R 744 2 + a 9 Δ T SUC , R 744 3 + a 10 η IHX , R 744 , + a 11 η IHX , R 744 2 + a 12 η IHX , R 744 3 + a 13 Δ T CAS + a 14 Δ T CAS 2 + a 15 Δ T CAS 3 + a 16 Δ T SUH , R 404 A + a 17 Δ T SUH , R 404 A 2 + a 18 Δ T SUH , R 404 A 3 + a 19 Δ T SUC , R 404 A + a 20 Δ T SUC , R 404 A 2 + a 21 Δ T SUC , R 404 A 3 + a 22 η IHX , R 404 A , + a 23 η IHX , R 404 A 2 + a 24 η IHX , R 404 A 3 + a 25 T C + a 26 T C 2 + a 27 T C 3
T E , CAS OPT = a 0 + a 1 T E + a 2 T E 2 + a 3 T E 3 + a 4 Δ T SUH , R 744 + a 5 Δ T SUH , R 744 2 + a 6 Δ T SUH , R 744 3 + a 7 Δ T SUC , R 744 + a 8 Δ T SUC , R 744 2 + a 9 Δ T SUC , R 744 3 + a 10 η IHX , R 744 , + a 11 η IHX , R 744 2 + a 12 η IHX , R 744 3 + a 13 Δ T CAS + a 14 Δ T CAS 2 + a 15 Δ T CAS 3 + a 16 Δ T SUH , R 404 A + a 17 Δ T SUH , R 404 A 2 + a 18 Δ T SUH , R 404 A 3 + a 19 Δ T SUC , R 404 A + a 20 Δ T SUC , R 404 A 2 + a 21 Δ T SUC , R 404 A 3 + a 22 η IHX , R 404 A , + a 23 η IHX , R 404 A 2 + a 24 η IHX , R 404 A 3 + a 25 T C + a 26 T C 2 + a 27 T C 3
m R 404 A m R 744 OPT = a 0 + a 1 T E + a 2 T E 2 + a 3 T E 3 + a 4 Δ T SUH , R 744 + a 5 Δ T SUH , R 744 2 + a 6 Δ T SUH , R 744 3 + a 7 Δ T SUC , R 744 + a 8 Δ T SUC , R 744 2 + a 9 Δ T SUC , R 744 3 + a 10 η IHX , R 744 , + a 11 η IHX , R 744 2 + a 12 η IHX , R 744 3 + a 13 Δ T CAS + a 14 Δ T CAS 2 + a 15 Δ T CAS 3 + a 16 Δ T SUH , R 404 A + a 17 Δ T SUH , R 404 A 2 + a 18 Δ T SUH , R 404 A 3 + a 19 Δ T SUC , R 404 A + a 20 Δ T SUC , R 404 A 2 + a 21 Δ T SUC , R 404 A 3 + a 22 η IHX , R 404 A , + a 23 η IHX , R 404 A 2 + a 24 η IHX , R 404 A 3 + a 25 T C + a 26 T C 2 + a 27 T C 3
Approximately 1560 data were analyzed based on the analysis, and the regression analysis coefficients (a0~a27) in Equations (8)–(10), statistical indicators (standard error, standard deviation of error term (rms), and coefficient of determination (R2)) are summarized in Table 6. The standard deviation and coefficient of determination were calculated using the following equation [11]:
rms = 1 n i = 1 n y i y i ^ 2
R 2 = i = 1 i = n y i ^ y ¯ 2 i = 1 i = n y i y ¯ 2 100 %   .
In Figure 11, Figure 12 and Figure 13, three values (maximum COP, optimal cascade evaporation temperature, and optimal mass flow ratio) obtained according to the parameter conditions in the experiment and Equations (8)–(10) proposed through the revised performance analysis were substituted with the same variables as the experimental conditions, and the calculated values were mutually exclusive. By comparison, it was confirmed how much the error was.
Therefore, it can be concluded that the prediction of three values is possible by using the proposed equations without conducting an experiment by confirming that the error is within ± 15%.

4. Conclusions

In this study, R404A and R744 refrigerants were applied to the high-temperature and low-temperature cycles of a CRS with an IHE, respectively, and the factors affecting the COP of the system were theoretically identified and analyzed. This study aimed to provide basic data for the optimal design of R744/R404A CRS. Therefore, I investigated the various factors necessary for designing a CRS that can operate at low temperatures of −50 to −30 °C, which is appropriate for supermarkets. According to the various conditions of the R744/R404A CRS, I proposed formulas that can be used to easily calculate the COP of the system, the optimal cascade evaporation temperature to achieve the maximum COP, and the optimal amount of refrigerant to be charged in each cycle of the system. The results of this study can be used to optimize the overall COP of the CRS, thereby achieving energy and economic efficiency by minimizing the refrigerant charge of the R404A cycle, enabling environmentally friendly operation and maintenance. In the future, it will be necessary to replace R404A refrigerant with another refrigerant. According to the results of this study, we recommend R448A and R449A refrigerants, which can replace R404A in a 1:1 ratio.

Funding

This research received no external funding.

Institutional Review Board Statement

Not applicable.

Informed Consent Statement

Not applicable.

Conflicts of Interest

The authors declare no conflict of interest.

Nomenclature

SYMBOLSSUBSCRIPTS
COPCoefficients of performance-CCondensation, Condenser
Ex ˙ Exergy ratekWcalCalculated
iEnthalpykJ/kgCASCascade heat exchanger
m ˙ Mass flow ratekg/sCOMCompression
PPressurekPaDDestruction
QHeat capacitykWEEvaporation, Evaporator
sEntropykJ/(kg·K) Ex Exergy
TTemperature°CexpExperimental
WPower consumptionkWFFuel
IHXInternal heat exchanger
GREEK SYMBOLS kkth component
Δ Difference PProduct
ηEfficiency RatioRatio
R404AR404A refrigeration cycle
SUPERSCRIPTS R744R744 refrigeration cycle
MMechanical SUCSubcooling
TThermal SUHSuperheating
SYSCascade refrigeration system

References

  1. Bitzer Refrigerant Report. Available online: https://www.bitzer-refrigerantreport.com/refrigerants/substitutes-for-r22-in-refrigeration-systems/ (accessed on 19 September 2021).
  2. Da Silva, A.; Filho, E.P.B.; Antunes, A.H.P. Comparison of a R744 cascade refrigeration system with R404A and R22 conventional systems for supermarkets. Appl. Therm. Eng. 2012, 41, 30–35. [Google Scholar] [CrossRef]
  3. Sawalha, S. Using CO2 in supermarket refrigeration. ASHRAE 2005, 47, 26–30. [Google Scholar]
  4. Nekså, P. CO2 as Refrigerant for Systems in Transcritical Operation Principles and Technology. Available online: http://www.ammonia21.com/files/pdf_310.pdf (accessed on 19 September 2021).
  5. Queiroz, M.V.A.; Panato, V.H.; Antunes, A.H.P.; Parise, J.A.R.; Filho, E.P.B. Experimental comparison of a cascade refrigeration system operating with R744/R134a and R744/R404A. In Proceedings of the International Refrigeration and Air-Conditioning Conference, West Lafayette, IN, USA, 11–13 July 2016; Paper 1785. pp. 1–10. Available online: http://docs.lib.purdue.edu/iracc/1785 (accessed on 19 September 2020).
  6. Wikipedia. Available online: https://en.wikipedia.org/wiki/List_of_refrigerants#cite_note-ASHRAE2007-34m-v-10 (accessed on 25 July 2021).
  7. Di Nicola, G.; Giuliani, G.; Polonara, F.; Stryjek, R. Blends of carbon dioxide and HFCs as working fluids for the low-temperature circuit in cascade refrigerating systems. Int. J. Refrig. 2005, 28, 130–140. [Google Scholar] [CrossRef]
  8. Dopazo, J.A.; Fernández-Seara, J.; Sieres, J.; Uhía, F.J. Theoretical analysis of a CO2–NH3 cascade refrigeration system for cooling applications at low temperatures. Appl. Therm. Eng. 2009, 29, 1577–1583. [Google Scholar] [CrossRef] [Green Version]
  9. Lee, T.-S.; Liu, C.-H.; Chen, T.-W. Thermodynamic analysis of optimal condensing temperature of cascade-condenser in CO2/NH3 cascade refrigeration systems. Int. J. Refrig. 2006, 29, 1100–1108. [Google Scholar] [CrossRef]
  10. Bingming, W.; Huagen, W.; Jianfeng, L.; Ziwen, X. Experimental investigation on the performance of NH3/CO2 cascade refrigeration system with twin-screw compressor. Int. J. Refrig. 2009, 32, 1358–1365. [Google Scholar] [CrossRef]
  11. Getu, H.; Bansal, P. Thermodynamic analysis of an R744–R717 cascade refrigeration system. Int. J. Refrig. 2008, 31, 45–54. [Google Scholar] [CrossRef]
  12. Yun, R.; Cho, Y. Evaluation of the performance for the CO2-NH3 cascade system and the two stage CO2 systems. In Proceedings of the 2010 SAREK Summer Annual Conference, Pyeongchang-gun, Korea, 23–25 June 2010; pp. 824–829. [Google Scholar]
  13. Abubakar, N.; Fitri, S.P. Thermodynamic analysis of cascade refrigeration system using CO2-NH3 refrigerant for fish cold storage application. In Proceedings of the 3rd International Conference on Marine Technology (SENTA 2018), Surabaya, Indonesia, 5–6 December 2020; pp. 170–175. [Google Scholar]
  14. Bresolin, C.S. A cascade R134a/R744 refrigeration cycle thermal analysis: Evaluation of the intermediate heat-exchanger parameters. In Proceedings of the 24th ABCM International Congress of Mechanical Engineering, Curitiba, Brazil, 3–8 December 2017; pp. 1–6. [Google Scholar]
  15. Kumar, S.; Ranga, V. Work study on low temperature (cascade) refrigeration system. Int. Res. J. Eng. Tech. 2018, 5, 2300–2305. [Google Scholar]
  16. Victorin, C.K.; Louis, A.O.; Alain, A.; Clotilde, G.T. Parametric study of NH3/CO2 cascade refrigeration cycles for hot climates. Int. J. Res. Rev. 2020, 7, 219–229. [Google Scholar]
  17. Islam, M.U.; Singh, S.K. Analysis of thermodynamic performance of a cascade refrigeration system for refrigerant couples of R22/R404a, and R744/R404a. Int. J. Sci. Res. Eng. Trends 2019, 5, 1530–1537. [Google Scholar]
  18. Kumar, R.; Randa, R. Comparison of thermodynamics analysis of CRS for refrigerant pairs R23/R404A and R41/R404A. Int. J. Innov. Res. Tech. 2020, 7, 324–328. [Google Scholar]
  19. Shakya, A.; Faisal, N.; Chauhan, T. Performance analysis of vapour compression cascade refrigeration system using refrigerants R404A and R134a. Int. J. Sci. Dev. Res. 2019, 4, 319–325. [Google Scholar]
  20. Winkler, J.M.; Aute, V.; Radermacher, R.; Shapiro, D. Simulation and validation of a R404A/CO2 cascade refrigeration system. In Proceedings of the International Refrigeration and Air-Conditioning Conference, Purdue, IN, USA, 14–17 July 2008. [Google Scholar]
  21. Bai, T.; Yu, J.; Yan, G. Advanced exergy analysis on a modified auto-cascade freezer cycle with an ejector. Energy 2016, 113, 385–398. [Google Scholar] [CrossRef]
  22. Sun, Z.; Liang, Y.; Liu, S.; Ji, W.; Zang, R.; Liang, R.; Guo, Z. Comparative analysis of thermodynamic performance of a cascade refrigeration system for refrigerant couples R41/R404A and R23/R404A. Appl. Energy 2016, 184, 19–25. [Google Scholar] [CrossRef]
  23. Morosuk, T.; Tsatsaronis, G. Advanced exergetic evaluation of refrigeration machines using different working fluids. Energy 2009, 34, 2248–2258. [Google Scholar] [CrossRef]
  24. Kline, S.J.; McClintock, F.A. Describing Uncertainties in Single Sample Experiments. Mech. Eng. 1953, 75, 3–8. [Google Scholar]
  25. Moffat, R.J. Describing the uncertainties in experimental results. Exp. Therm. Fluid Sci. 1988, 1, 3–17. [Google Scholar] [CrossRef] [Green Version]
  26. Kumar, S.S.; Sivaram, A.R.; Rajavel, R. Thermodynamic Analysis of a Cascade Refrigeration System with R744/R290 Mixtures. Indian J. Sci. Technol. 2015, 8, 1–9. [Google Scholar] [CrossRef]
  27. Son, C.-H.; Moon, C.-G. Performance Analysis of the Cascade Refrigeration System using R744 with the low temperature cycle. J. Korean Soc. Power Syst. Eng. 2019, 23, 5–11. [Google Scholar] [CrossRef]
  28. Yılmaz, D.; Sınar, Ü.; Özyurt, A.; Yılmaz, B.; Mancuhan, E. Ultra Düşük Sıcaklıklarda Çalışan İki Kademeli Bir Soğutma Sisteminde Aşırı Soğutma ve Isıtmanın Performansa Etkilerinin Sayısal İncelenmesi. Afyon Kocatepe Univ. J. Sci. Eng. 2017, 17, 1172–1180. [Google Scholar] [CrossRef]
  29. Mosaffa, A.; Farshi, L.G.; Ferreira, C.I.; Rosen, M. Exergoeconomic and environmental analyses of CO2/NH3 cascade refrigeration systems equipped with different types of flash tank intercoolers. Energy Convers. Manag. 2016, 117, 442–453. [Google Scholar] [CrossRef] [Green Version]
  30. Parmar, G.G.; Kapadia, R.G. Thermodynamic Analysis of Cascade Refrigeration System using a Natural Refrigerants for Supermarket Application. Int. J. Innov. Res. Sci. Eng. Technol. 2015, 4, 1839–1846. [Google Scholar]
  31. Hendri; Nurhasanah, R.; Prayudi; Suhengki. Energy and Exergy Analysis of Cascade Refrigeration System Using MC22 and MC134 on HTC, R404A and R502 on LTC. J. Adv. Res. Fluid Mech. Therm. Sci. 2021, 80, 73–83. [Google Scholar] [CrossRef]
  32. Messineo, A.; Panno, D. Performance evaluation of cascade refrigeration systems using different refrigerants. Int. J. Air-Conditioning Refrig. 2012, 20, 1–8. [Google Scholar] [CrossRef]
  33. Parekh, A.D.; Tailor, P.R. Thermodynamic analysis of cascade refrigeration, system using R12-R13, 290-R23 and R404A-R23, World Academy of Science, Engineering and Technology. Int. J. Mech. Mechatron. Eng. 2014, 8, 1351–1356. [Google Scholar]
  34. Kilicarslan, A.; Hosoz, M. Energy and irreversibility analysis of a cascade refrigeration system for various refrigerant couples. Energy Convers. Manag. 2010, 51, 2947–2954. [Google Scholar] [CrossRef]
  35. Yilmaz, F.; Selbaş, R. Comparative thermodynamic performance analysis of a cascade system for cooling and heating applications. Int. J. Green Energy 2019, 16, 674–686. [Google Scholar] [CrossRef]
  36. Dokandari, D.A.; Hagh, A.S.; Mahmoudi, S.M.S. Thermodynamic investigation and optimization of novel ejector-expansion CO2/NH3 cascade refrigeration cycles (novel CO2/NH3 cycle). Int. J. Refrig. 2014, 46, 26–36. [Google Scholar] [CrossRef]
  37. Oruç, V.; Devecioğlu, A.G. Experimental assessment of the retrofit of an internal heat exchanger in refrigeration systems: The effect on energy performance and system operation. Appl. Therm. Eng. 2020, 180, 115843. [Google Scholar] [CrossRef]
  38. Jin, L.; Cao, F.; Yang, D.; Wang, X. Performance investigations of an R404A air-source heat pump with an internal heat exchanger for residential heating in northern China. Int. J. Refrig. 2016, 67, 239–248. [Google Scholar] [CrossRef]
  39. Llopis, R.; Sanz-Kock, C.; Cabello, R.; Sánchez, D.; Nebot-Andrés, L.; Catalán-Gil, J. Effects caused by the internal heat exchanger at the low temperature cycle in a cascade refrigeration plant. Appl. Therm. Eng. 2016, 103, 1077–1086. [Google Scholar] [CrossRef] [Green Version]
  40. Zhang, F.; Jiang, P.; Lin, Y.; Zhang, Y. Efficiencies of subcritical and transcritical CO2 inverse cycles with and without an internal heat exchanger. Appl. Therm. Eng. 2011, 31, 432–438. [Google Scholar] [CrossRef]
Figure 1. Schematic diagram of experimental apparatus for the CRS using R744.
Energies 14 06003 g001
Figure 2. COP, ratio of mass flow rate, and energy of each component at the CRS with respect to the subcooling degree of the R404A cycle.
Energies 14 06003 g002
Figure 3. COP, ratio of mass flow rate and energy of each component at the CRS with respect to superheating degree of the R404A cycle.
Energies 14 06003 g003
Figure 4. COP, ratio of mass flow rate and energy of each component at the CRS with respect to superheating degree of the R744 cycle.
Energies 14 06003 g004
Figure 5. COP, ratio of mass flow rate and energy of each component at the CRS with respect to the condensation temperature of the CRS.
Energies 14 06003 g005
Figure 6. COP, ratio of mass flow rate and energy of each component at the CRS with respect to evaporation temperature of the CRS.
Energies 14 06003 g006
Figure 7. COP, ratio of mass flow rate and energy of each component at the CRS with respect to the evaporation temperature of the cascade heat exchanger.
Energies 14 06003 g007
Figure 8. COP, ratio of mass flow rate and energy of each component at the CRS with respect to IHE efficiency of the R404A cycle.
Energies 14 06003 g008
Figure 9. COP, ratio of mass flow rate and energy of each component at the CRS with respect to IHE efficiency of the R744 cycle.
Energies 14 06003 g009
Figure 10. Performance analysis results with respect to superheating degree in R404A cycle of the cascade refrigeration system.
Energies 14 06003 g010
Figure 11. Comparison of experimental data with the calculated maximum coefficient of performance using the proposed equation.
Energies 14 06003 g011
Figure 12. Comparison of experimental data with the calculated optimum cascade evaporating temperature using the proposed equation.
Energies 14 06003 g012
Figure 13. Comparison of experimental data with the calculated optimum mass flow rate ratio using the proposed equation.
Energies 14 06003 g013
Table 1. Main components of the experimental apparatus for the CRS.
ComponentCharacteristics
R744 compressorBock, model: HGX12P/40-4. Displacement with 1450 min−1: 4.4 m3h−1, No. of cylinders: 2, weight: 53 kg, max. power consumption: 2.1 kW
EvaporatorHand-made, type: Horizontal double tube, material: copper tube, Internal diameter of inner tube: 11.46 mm, Internal diameter of outer tube: 33.27 mm, length of the evaporator: 8000 mm
Cascade heat exchangerAlfa Laval, model: ACH-70X-50H-F, Heat exchanged: 10.86 kW, Heat transfer area: 2.45 m2
R404A compressorBock, model: HGX34P/380-4S. Displacement with 1450 min−1:33.1 m3h−1, No. of cylinders: 4, weight: 96 kg, max. power consumption: 11.1 kW
CondenserAlfa Laval, model: ACH-70X-50H-F, Heat exchanged: 38.44 kW, Heat transfer area: 2.45 m2
Table 2. Details of measuring equipment.
Measuring EquipmentDetail
Mass flow rate of R404A cycleOval Ultra mass MKII Flow meter, model: CT9401-CN10, Range: 0–24 kg min−1
Mass flow rate of R744 cycleOval Ultra mass MKII Flow meter, model: CT9401-CN06, Range: 0–12 kg min−1
Power meterYOKOGAWA Digital power meter, model: WT230, Range: 15–600 V, 0.5–20 A, 0.5–100 kHz
Pressure transmitterWIKA, model: S-10, Range: 0–160 bar abs, 0–5 V
TemperatureONDI, model: TT-TE(T-type), Range: -270–400 °C
Water flow rateCorea Flow, model: TBN-II-AD(Turbine flowmeter), Range: 0.6~6 m3hr
Table 3. Experimental conditions of the CRS.
CycleComponentRangeUnit
High-temperature refrigeration cycle
(R404A)
Condensation temperature20, 30, 40 *, 50°C
Internal heat exchanger efficiency0 *, 1, 2, 3, 4stage
Subcooling degree0 *, 5, 10, 15, 20°C
Superheating degree10, 20 *, 30, 40°C
Cascade evaporation temperature−30, −25 *, −20, −15, −10°C
Temperature difference of cascade heat exchanger5°C
Low-temperature refrigeration cycle
(R744)
Cascade condensation temperature−25, −20 *, −15, −10, −5°C
Evaporation temperature−50, −45, −40 *, −35, −30°C
Internal heat exchanger efficiency0 *, 1, 2, 3, 4stage
Subcooling degree2*°C
Superheating degree10, 20, 30, 40*°C
* : Standard conditions.
Table 4. Balance equation for each component of the CRS using R744 and R404A.
CycleComponentEnergyMass
High-temperature
refrigeration cycle
(R404A)
Compressor (1→2) W COM ,   R 404 A = m ˙ R 404 A i 2 i 1 m ˙ R 404 A = m ˙ 1 = m ˙ 2   = m ˙ 3 = m ˙ 4
= m ˙ 5 = m ˙ 6
= m ˙ 7 = m ˙ 8
Condenser (2→4) Q C = m ˙ R 404 A i 2 i 4
Subcooling degree (3→4) Δ T SUC , R 404 A
Internal heat exchanger (4→5 and 8→1) Q IHX , R 404 A = m ˙ R 404 A i 4 i 5 = m ˙ R 404 A i 1 i 8
Expansion valve (5→6) i 5 = i 6
Evaporator (6→8) Q E , CAS = m ˙ R 404 A i 8 i 6
Superheating degree (7→8) Δ T SUH , R 404 A
Low-temperature refrigeration cycle(R744)Compressor(11→12) W COM ,   R 744 = m ˙ R 744 i 12 i 11 m ˙ R 744 = m ˙ 11 = m ˙ 12
= m ˙ 13 = m ˙ 14
= m ˙ 15 = m ˙ 16
= m ˙ 17 = m ˙ 18
Condenser (12→14) Q C , CAS = m ˙ R 744 i 12 i 14
Subcooling degree (13→14) Δ T SUC , R 744
Internal heat exchanger (14→15 and 18→11) Q IHX , R 744 = m ˙ R 744 i 14 i 15 = m ˙ R 744 i 11 i 18
Expansion valve (15→16) i 15 = i 16
Evaporator (16→18) Q E = m ˙ R 744 i 18 i 16
Superheating degree (17→18) Δ T SUH , R 744
Table 5. Parameters and estimated uncertainties.
ParametersUnitUncertainty
Mass flow rate [kg/min] ± 0.0100
Power consumption of compressor [kW] ± 0.0350
COP of R404A refrigeration system[/] ± 0.0128
COP of R744 refrigeration system[/] ± 0.0128
COP of CRS[/] ± 0.0135
Temperature[°C] ± 0.2000
Δ T CAS [°C] ± 0.4000
Pressure [kPa] ± 5.2700
Δ P (Pressure drop) [kPa] ± 0.0100
Mass flow rate of coolant [kg/h] ± 7.5300
Table 6. Statistical information for Equations (8)–(10).
Linear Regression Coefficients for COPMAXLinear Regression Coefficients for (TE,CAS)OPTLinear Regression Coefficients for (mR404A/mR744)OPT
ValueStandard ErrorValueStandard ErrorValueStandard Error
a01.869 × 10 18.501 −2.587 × 10 33.967 × 10 2−1.571.91 × 10
a11.7061.558 −2.356 × 10 23.340 × 10 −9.93 × 10 −11.61
a24.227 × 10 −20.039 −6.1818.430 × 10 −1−1.98 × 10 −24.06 × 10 −2
a33.484 × 10 −40.000 −5.334 × 10 −27.037 × 10 −3−1.26 × 10 −43.39 × 10 −4
a43.111 × 10 −20.049 −1.9231.0474.66 × 10 −25.04 × 10 −2
a5−1.103 × 10 −30.002 1.150 × 10 −14.512 × 10 −2−1.90 × 10 −32.17 × 10 −3
a69.719 × 10 −60.000 −1.785 × 10 −35.881 × 10 −43.06 × 10 −52.83 × 10 −5
a7−1.0151.211 1.343 × 10 22.597 × 10 5.00 × 10 −11.25
a86.801 × 10 −10.694 −8.824 × 10 1.488 × 10 −3.37 × 10 −17.17 × 10 −1
a9−1.328 × 10 −10.123 1.689 × 10 2.6376.88 × 10 −21.27 × 10 −1
a101.229 × 10 −11.060 −1.071 × 10 2.272 × 10 2.38 × 10 −11.09
a11−2.695 × 10 −12.945 1.244 × 10 6.315 × 10 1.10 × 10 −13.04
a121.447 × 10 −12.007 1.3514.304 × 10 −2.29 × 10 −12.07
a136.3474.952 −3.674 × 10 21.062 × 10 2−1.29 × 10 5.12
a14−2.1281.615 1.416 × 10 23.464 × 10 4.001.67
a152.376 × 10 −10.178 −1.827 × 10 3.811−3.98 × 10 −11.84 × 10 −1
a168.977 × 10 −20.039 −4.7038.455 × 10 −11.93 × 10 −24.07 × 10 −2
a17−3.977 × 10 −30.002 2.211 × 10 −13.844 × 10 −2−2.14 × 10 −31.85 × 10 −3
a185.570 × 10 −50.000 −3.012 × 10 −35.217 × 10 −42.93 × 10 −52.51 × 10 −5
a191.803 × 10 −20.026 1.980 × 10 −15.519 × 10 −1−5.40 × 10 −22.66 × 10 −2
a20−1.563 × 10 −30.003 −2.023 × 10 −26.779 × 10 −21.93 × 10 −33.27 × 10 −3
a215.853 × 10 −50.000 5.123 × 10 −42.222 × 10 −3−5.62 × 10 −51.07 × 10 −4
a22−7.559 × 10 −21.502 1.722 × 10 3.220 × 10 −1.191.55
a235.192 × 10 −18.106 −1.256 × 10 21.738 × 10 24.898.38
a243.280 × 10 −210.898 1.853 × 10 22.337 × 10 2−7.741.13 × 10
a25−6.086 × 10 −20.093 −6.7471.9855.13 × 10 −29.57 × 10 −2
a268.071 × 10 −40.003 1.862 × 10 −15.831 × 10 −2−7.17 × 10 −42.81 × 10 −3
a27−6.180 × 10 −60.000 −1.608 × 10 −35.436 × 10 −41.12 × 10 −52.62 × 10 −5
Number of points (n) = 1560
rms = 0.03462
R2 = 97.4%
Number of points (n) = 1560
rms = 0.74232
R2 = 97.69%
Number of points (n) = 1560
rms = 0.03577
R2 = 98.47%
Publisher’s Note: MDPI stays neutral with regard to jurisdictional claims in published maps and institutional affiliations.

