Article

An Optimized Framework for Energy Management of Multi-Microgrid Systems

by
Komal Naz
1,
Fasiha Zainab
1,
Khawaja Khalid Mehmood
2,
Syed Basit Ali Bukhari
2,
Hassan Abdullah Khalid
1 and
Chul-Hwan Kim
3,*
1
U.S.-Pakistan Center for Advanced Studies in Energy (USPCAS-E), Department of Electrical Engineering (Power), National University of Sciences and Technology (NUST), Islamabad 44000, Pakistan
2
Department of Electrical Engineering, The University of Azad Jammu & Kashmir, Muzaffarabad 13100, Pakistan
3
College of Electrical and Computer Engineering, Sungkyunkwan University, Suwon 440-746, Korea
*
Author to whom correspondence should be addressed.
Energies 2021, 14(19), 6012; https://doi.org/10.3390/en14196012
Submission received: 20 July 2021 / Revised: 2 September 2021 / Accepted: 17 September 2021 / Published: 22 September 2021

Abstract

:
Regarding different challenges, such as integration of green energy and autonomy of microgrid (MG) in the multi-microgrid (MMG) system, this paper presents an optimized and coordinated strategy for energy management of MMG systems that consider multiple scenarios of MGs. The proposed strategy operates at two optimization levels: local and global. At an MG level, each energy management system satisfies its local demand by utilizing all available resources via local optimization, and only sends surplus/deficit energy data signals to MMG level, which enhances customer privacy. Thereafter, at an MMG level, a central energy management system performs global optimization and selects optimized options from the available resources, which include charging/discharging energy to/from the community battery energy storage system, selling/buying power to/from other MGs, and trading with the grid. Two types of loads are considered in this model: sensitive and non-sensitive. The algorithm tries to make the system reliable by avoiding utmost load curtailment and prefers to shed non-sensitive loads over sensitive loads in the case of load shedding. To verify the robustness of the proposed scheme, several test cases are generated by Monte Carlo Simulations and simulated on the IEEE 33-bus distribution system. The results show the effectiveness of the proposed model.

1. Introduction

Over the past decade, energy demand has considerably increased because of energy-dependent lifestyle of humans, industries, and electric vehicles (EVs) [1]. Conventional power systems are traditionally designed and operate on key reliability principles of security and adequacy [2]; they cannot meet these enormous rising demands adequately. The up-gradation of power systems to smart grids has been considered to address the energy shortage problem, improve reliability, and facilitate the integration of renewable energy sources (RESs). One of the significant ideas in smart grid is microgrids (MGs). An MG is comprised of a segment of distribution framework, including distributed energy resources (DERs), and diverse end clients. An MG can operate in two modes: grid-tied and islanded modes. The MG generally works in grid-tied mode. In grid-tied mode, there is bidirectional flow of energy and information between an MG and different MGs or the power grid, i.e., an MG can absorb or supply power. In stand-alone mode, it only acts as a source, i.e., only supplies power to the connected load. DERs include distributed generator (DG) and distributed storage (DS) units with various limits. The DG can be controllable DG (CDG) or renewable DG (RDG): PVs and WTs. Integration of RESs (PVs and WTs) participates in cost minimization and reduction in load shedding. In an MG, energy is generated near the point of demand which reduces transmission and distribution losses, as well as grid expansion deferral. The whole operation of the MG is supervised by the MG energy management system (EMS) which incorporates power generation, energy storage, and load management programs. A fast energy management strategy is required for sound functioning of the MG with various DERs especially in autonomous mode [3,4,5]. The EMS performs optimal scheduling of all available energy resources and energy storage systems (ESSs) to meet load demands [6]. The optimal operation of smart grid is a great challenge due to uncertainties in the DGs’ generation, load requirement, real-time prices, and penetration of EVs. The MMGs system, the combination of different MGs, can deal with these uncertainties, to a large extent. The main objectives of considering MMGs are cost optimization and the reliability of the system.
Significant research has been conducted to put forward different algorithms and optimization models for MMG-EMS. However, these studies have some limitations in comparison to the vast literature available on the energy management of a single MG. A multi-step hierarchical optimization algorithm based on a multi-agent system considering adjustable power and demand response (DR) was proposed in Reference [6]. In Reference [7], authors proposed energy management of islanded DC MG with dual active bridge converter-based power management units and control interface. The optimized and coordinated strategies for energy management in MMGs were proposed, and a 69-bus system was used for case study in Reference [8]. According to References [9,10], the MGs could transfer energy and coordinate with each other to make the entire system reliable and stable. In Reference [11], the impact of DR, which was synchronous with the MMG-based operation of active distribution networks, was investigated, and the optimization problem was solved with non-dominated genetic algorithm-II (NSGA-II) and tested on an IEEE 69-bus distribution system. A multi-period optimal dispatch model was suggested for a distribution network with clustered MGs in Reference [12]; a modified hierarchical genetic algorithm was used to solve bi-level optimization problem and tested on IEEE 14-bus distribution system. A hierarchical decentralized system of systems has been studied for coordinating multiple autonomous microgrid systems with grid connection in Reference [13]. In Reference [14], a hierarchical multi-agent EMS was proposed to increase the utilization of RES based on the DR programs (DRP) and BESSs within the MG. Interconnected MMGs (IMMGs) have numerous benefits over the single MGs. First, IMMGs have good economic characteristics both in grid-tied [15,16] and in islanded modes [1,17] because energy sharing fulfills load demands of the MGs with their own cheap RESs, thus reducing the cost of generation based on fossil fuels and the power losses occurred in distant transference by trading energy among the MGs which are close to each other. Second, the IMMGs are more reliable than the single MG in reducing stress on the main grid.
In all of the aforementioned papers, the main focus of the research was to maximize the utilization of the cheapest controllable DG (CDG) by considering its generation price. Few papers considered the price of RESs to ensure maximum utilization of renewable sources. Most of the papers have sufficiently discussed the DRP or demand-side management (DSM) schemes to meet load demands. Moreover, some researchers have considered islanded individual MG, islanded MMG system and grid-connected MMG system for their studies. However, they overlooked the different combinations of MGs. The MMG system is the most optimized network and can operate in two ways: either as a cooperative or as an autonomous system. In the cooperative MMG system, the benefits of overall system will be considered in that it is not necessary that each individual MG is getting profit, whereas, in the autonomous MMG, each MG will consider and prefer its own benefit in that it is not necessary that the overall system is in the most optimized form. Therefore, it is possible that an MG is getting more benefit individually than to be a part of the cooperative MMG system, and vice versa. Furthermore, the types of loads and the load shedding of sensitive load have not been considered so far in the literature.
In this paper, a hierarchical EMS for the optimal operation of MMGs is proposed; the MGs are in islanded or MMGs connected mode. A two-level optimization, local and global, has been formulated. In local optimization, each MG acts autonomously and maximizes the utilization of RESs to meet load demand. In global optimization, there is a cooperative operation between the MGs which optimizes the overall system. This optimization strategy maximizes the utilization of cheap renewable energy, minimizes total cost, and reduces the load shedding. The total loads have been divided into two sets: sensitive and non-sensitive loads. The penalty prices of these loads are considered much higher than all other prices to avoid load shedding, whereas the penalty prices of sensitive loads are considered higher than that of non-sensitive loads to provide uninterrupted supply to sensitive load during load shedding. The proposed model is tested on the IEEE 33-bus test system, and the presented optimization problem is solved by differential evolution (DE) algorithm. Moreover, we have studied the proposed methodology for selected cases in order to check the robustness of the proposed scheme. For this purpose, we have used Monte Carlo Simulations (MCS) to generate the random cases of all total possible cases and run the numerical simulation of the proposed algorithm. Some of the major contributions of this study are summarized as:
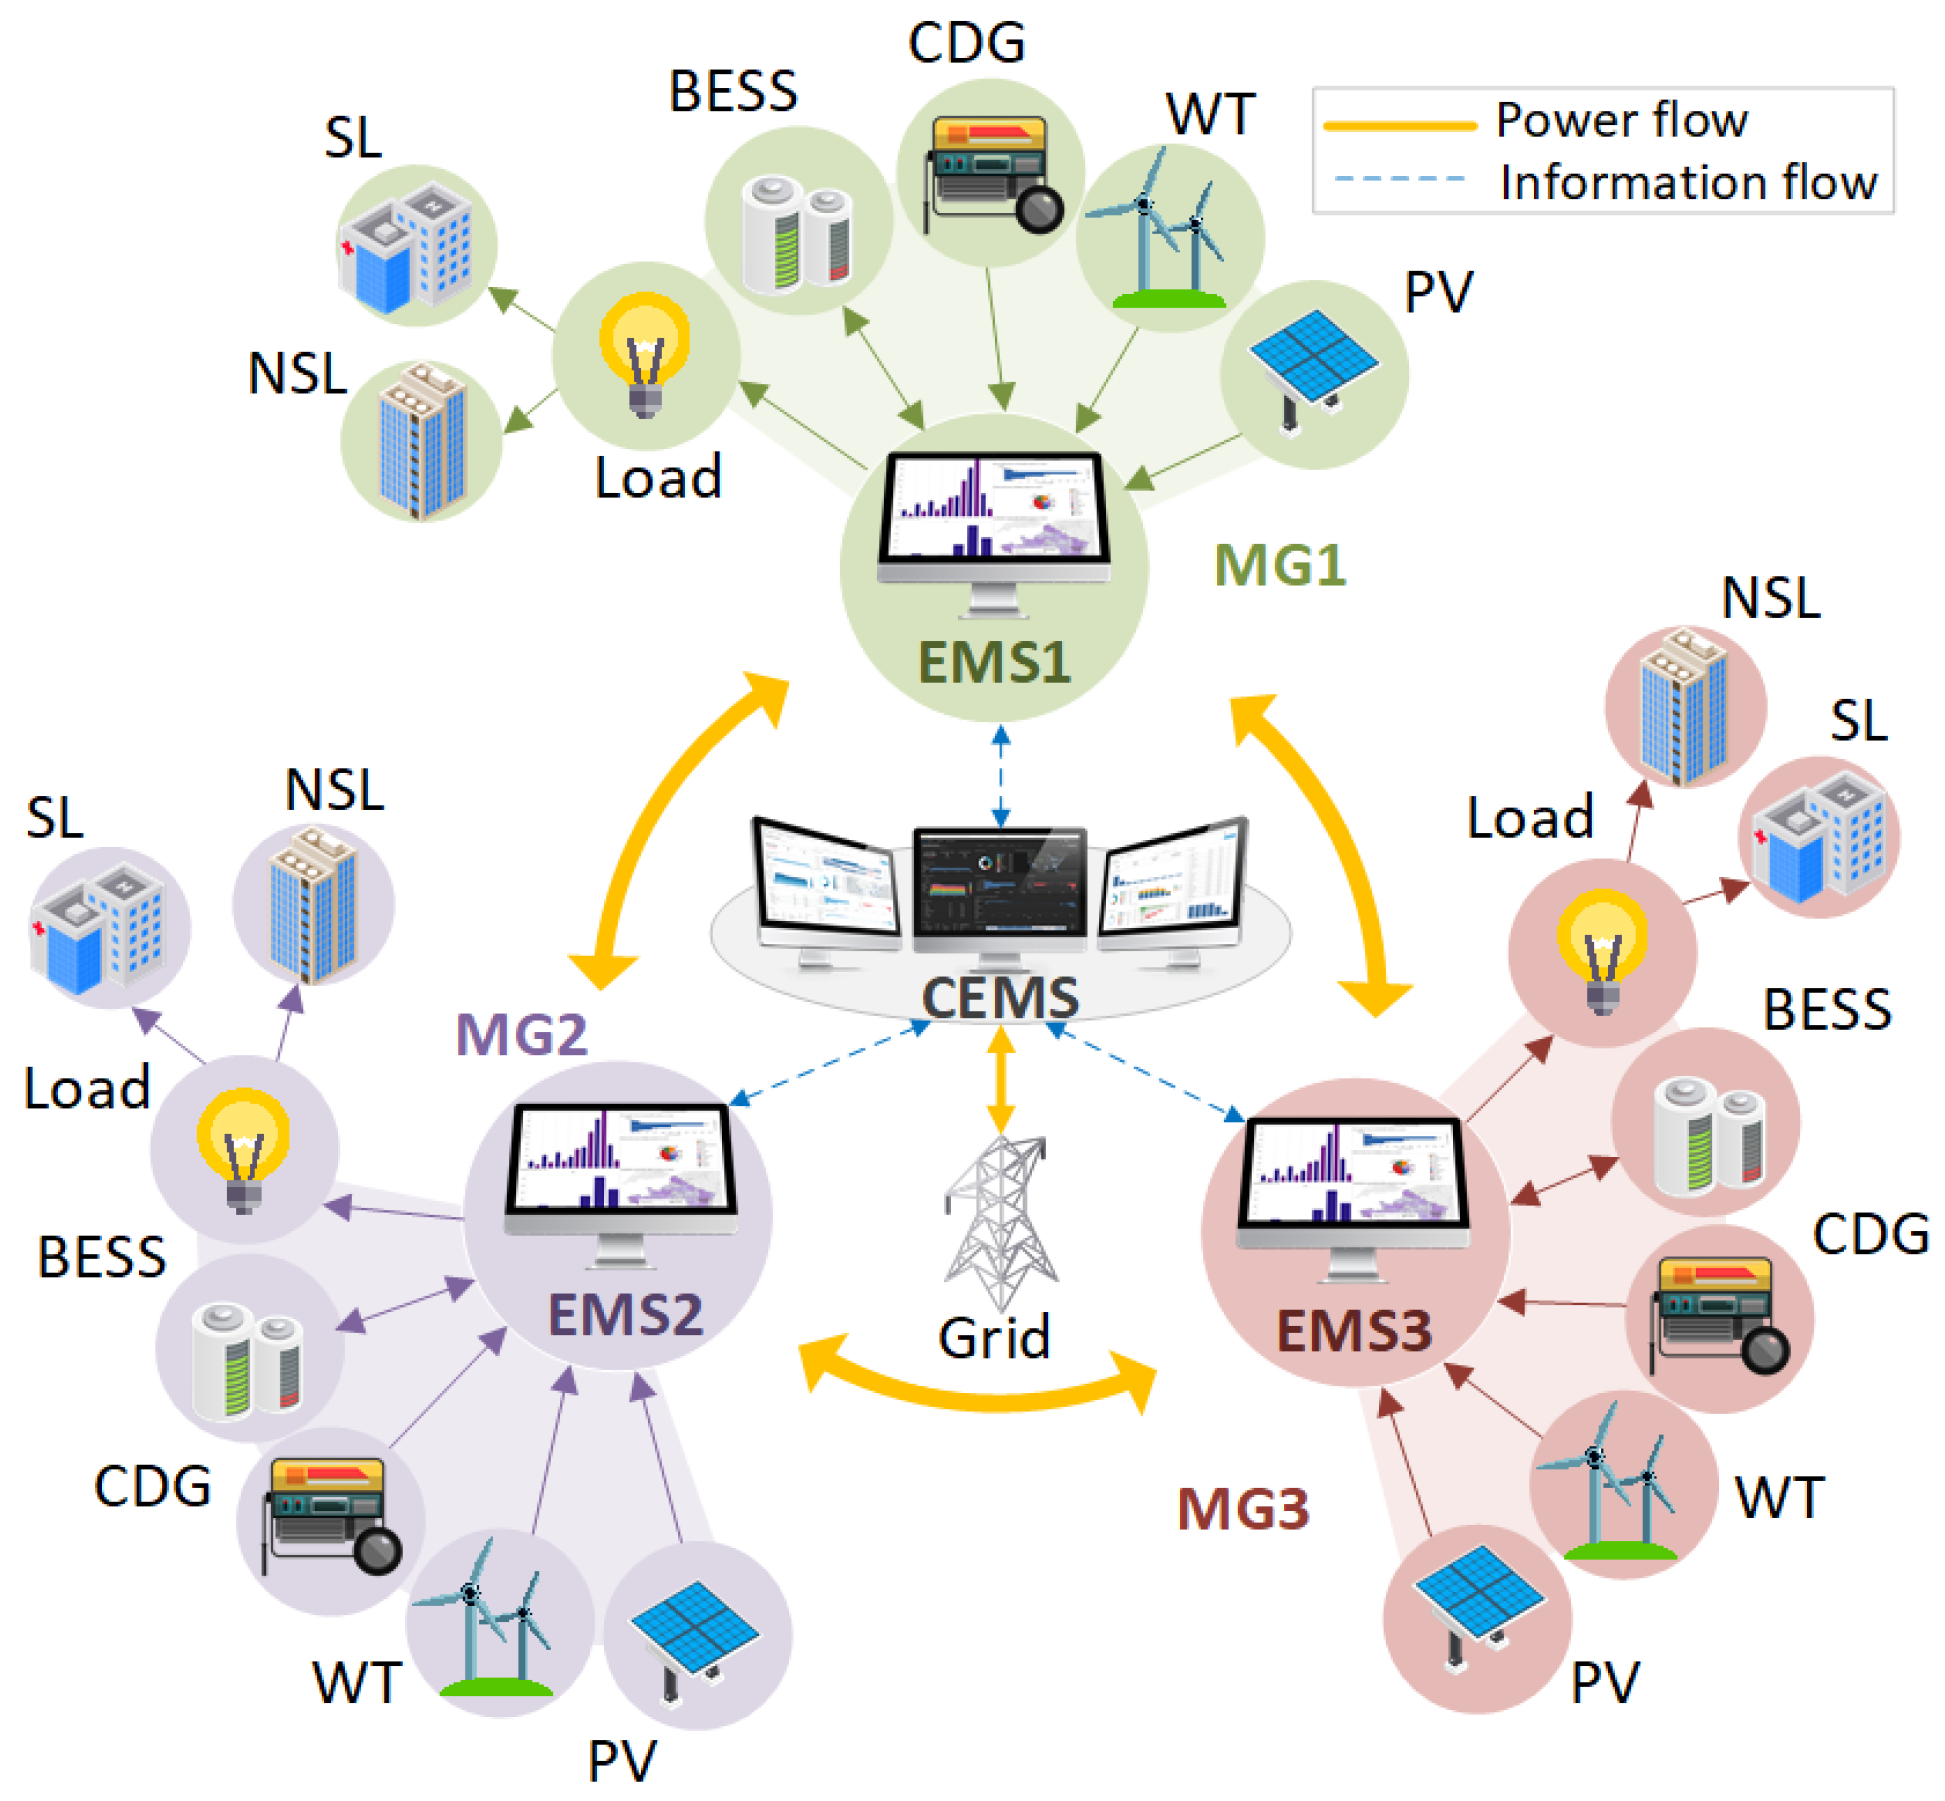
  • A new energy management model to formulate day-ahead energy management problem for optimal operations of MGs is proposed which allows autonomous operation mode; each MG incorporates DG units (CDG, PV, and WT), a battery ESS (BESS), and its own EMS.
  • A two-step optimization problem is proposed. In the first step, each MG-EMS considers maximum local consumption of renewable energy, whereas, in the second step, the central EMS (CEMS) monitors the power mismatch, achieves optimal energy trading among MGs, and reduces load shedding.
  • A hierarchical EMS is developed in which the algorithm makes price-based decisions and selects the optimized options from the available resources. A methodology for the assessment of the energy management strategy is illustrated, which enables marking and examining the characteristics of MMGs.
  • Different scenarios and cases have been generated by MCS and tested on modified IEEE 33-bus distribution system; the results represent the stability of proposed algorithm and advantages of energy management system.
The rest of the paper is organized as follows. Section 2 focuses on the proposed MMG model and mathematical modeling of wind turbine and photovoltaic DGs. Section 3 explains the optimization formulation of the strategy: local and global. Section 4 refers to the simulations and case study of the modified IEEE 33-bus distribution system. Section 5 discusses the results, including the proposed scenarios and the cases generated by MCS. The conclusion is summarized in Section 6.

2. System Model

2.1. Configuration of Proposed MMG System

Figure 1 shows the proposed hierarchical two-step energy management system model. Each MG includes CDG, PV, and WT units which have sufficient power generation to fulfill its MG demands, BESS to reserve surplus energy in off-peak hours and utilize it in on-peak hours to avoid load shedding, and an EMS to make all this management possible. The EMS at the MG level ensures optimized energy management by utilizing all energy and ancillary services. In this paper, two sets of loads are taken into consideration: sensitive loads (SLs) and non-sensitive loads (NSLs). If a customer, in the event of low power generations, requires to shed loads due to shortage of power, the NSL is curtailed, and the SL gets uninterrupted supply. The CEMS is connected to each MG-EMS, central BESS (CBESS), and to the grid to coordinate the overall system to make it reliable and minimize emergency load shedding, which lowers the chance of system-collapse. The CEMS at the MMG level ensures interconnection of different autonomous MGs. The EMS of every single MG is also connected to the EMS of every other neighboring MG via power lines for power flow when needed. The MMG system, presented in Figure 1, has the following benefits: (i) they share reserves in on-peak hours or in crucial condition (e.g., faults on generation side or sudden increase in the load demand); (ii) economic dispatch in the whole system, either islanded or grid-connected; and (iii) a CBESS can serve critical loads after utilizing all available options and increases the resilience of the system.
For the purpose of simulations, wind speed and solar irradiance are modeled by implementing the Weibull [18] and beta probability distributions, respectively. Each MG has the freedom to take part in the MMG system. Otherwise, it can operate as an autonomous single islanded entity.

2.2. Wind Turbine DGs

2.2.1. Wind Speed Modeling

Different probability distributions are used to model variations in the wind speed. Weibull probability distribution is often used [19] and is also used in this paper. The probability density function of this distribution is given in (1).
f ( s w | a , b ) = b a b s w b 1 e ( s w a ) b , for x > 0 0 , for x 0 ,
where a and b are the scale and shape parameters of the Weibull distribution, respectively. Maximum likelihood estimation (MLE) method is used to find these parameters.

2.2.2. Wind Power Model

The wind power DG-model used for obtaining electrical energy from the generated wind speed data is given in (2) [19].
P w = P r × s w s c i s r s c i , for s c i s w s r P r , for s r s w s c o 0 , otherwise .
where P w and P r are power generated from a WT and rated capacity of a WT, respectively; s w , s c i , s c o and s r are current, cut-in, cut-out and rated wind speeds, respectively.

2.3. Photovoltaic DGs

2.3.1. Solar Irradiance Modeling

The beta distribution is usually used for modeling of the variations in the solar irradiance [20]. For α , β > 0, the pdf of Beta distribution is given as (3).
f ( s i r d | α , β ) = γ ( α + β ) γ ( α ) γ ( β ) × s i r d ( α 1 ) × ( 1 s i r d ) ( β 1 ) , for 0 s i r d 1 0 , for s i r d < 0 ,
where γ is the gamma function; α and β are known as the shape parameters of the beta distribution. Both parameters are estimated by the MLE method.

2.3.2. Solar Power Model

The model of a PV panel given in (4)–(8) provides electric power obtained from the generated solar irradiance samples [20].
T c e l l = T a m b + s i r d × T n o t 20 0.8 ,
I = s i r d × ( I s c + K i × ( T c e l l 25 ) ) ,
V = V o c K v × T c e l l ,
F F = V m a x p × I m a x p V o c × I s c ,
P s = N t o t a l × F F × V × I .
where s i r d , F F , N t o t a l , P s , T c e l l , T a m b and T n o t are solar irradiance, fill factor, total number of PV modules, power generated from a PV panel, temperature of a cell, ambient temperature and nominal operating temperature of a cell, respectively; I s c , I m a x p , K i , V o c , V m a x p and K v are short circuit current, current at maximum power point, temperature coefficient for current, open circuit voltage, voltage at maximum power point and temperature coefficient for voltage, respectively.

3. Optimization Formulation

In this section, a day-ahead energy management problem for proposed MMGs model is formulated based on the DE algorithm. The objective function is to minimize the total operational cost of the MG network whether it is operating as a single islanded or grid-tied MG system; the MMGs islanded or grid-connected network makes the system reliable by giving uninterrupted supply of energy and minimizes curtailment of loads. The elements of bi-level optimization model are shown in Figure 2 including decision input variables, constraints, objective function and optimal output variables. A constraints-handling technique is used in the presented DE algorithm to get the best fitness value of the decision variables, and penalty factor technique is used to attain the most feasible and optimized value of objective function. The proposed model is figured for a twenty-four-hour scheduling horizon with a time period of ‘t’; ‘t’ can be any uniform interval of time. However, in the suggested model, ‘t’ has been considered to be one hour. As mentioned earlier, it is a two-step optimization strategy: local and global. Step-wise detailed mathematical models are developed in the following subsections.

3.1. Local Optimization

At local level, the EMS of each MG generates energy management strategy based on the proposed model, load/generation data, prices, and constraints. The objective function is given by (9) and includes CDG generation cost, RDG generation cost, prices of buying/selling power from/to the grid, and penalty prices of SL/NSL curtailments. The penalty price of curtailment of the SL is considered higher than that of the NSL. Therefore, in case of load shedding, only a part of NSL will be shed, and the SL will get continuous supply.
m i n i = 1 I t = 1 T ( C i , t C D G · P i , t C D G + C i , t R D G · P i , t R D G ) + t = 1 T ( P R t B u y · P t D e f + P R t S e l l · P t S u r ) + t = 1 T ( C t P e n S L · P t S h e d S L + C t P e n N S L · P t S h e d N S L ) ,
where P is respective power value being multiplied with corresponding cost/price (i.e., C = cost and P R = price) for time from t = 1 to t = T and for DGs (CDGs and RDGs) from i = 1 to i = I in an MG.
Subject to:
c i , t · P i C D G m i n P i , t C D G c i , t · P i C D G m a x i I , t T ,
P t P V + P t W T + i = 1 I P i , t C D G + P t D e f + P t B = P t L + P t S u r + P t B + t T ,
0 P t B + P B C a p · 1 S O C t 1 B η B t T ,
0 P t B P B C a p · S O C t 1 B · η B t T ,
S O C t B = S O C t 1 B 1 P B C a p · P t B η B P t B + · η B ,
0 S O C t B 1 t T .
In (10), the inequality constraint related to the generation of CDG unit ‘i’ is given, which shows that the output of a CDG is between its minimum and maximum generating capacities. The power generated by all DGs units, deficit power, and power from battery must be adjusted with demand, surplus power, and power to the battery at each interval and is represented by (11). During charging, the storage system is considered as a load, and it acts as a source during the discharging of power. The constraints of the BESS of an MG, which include the charging, discharging, and SOC, are given by (12)–(15). The SOC is updated in each interval.
In single grid-tied mode, the MG adjusts surplus/deficit power by trading with the main grid, whereas, in the case of single islanded mode, the surplus power is balanced by ramping down the dispatchable generating units. Likewise, a load curtailment mechanism is employed for balancing the deficient amount of power. If the MG network is islanded or grid-tied MMGs system, after finalizing local optimization by every single MG-EMS at the first step, every MG-EMS delivers the information to the CEMS agent about the surplus and deficient amount of powers calculated from the local optimization algorithm.

3.2. Global Optimization

After being informed by each MG-EMS about surplus/deficit powers and connection/disconnection of that MG with the grid in the MMGs network, the CEMS carries out the global optimization in this step. The objective function of the MMGs network is given by (16). It contains buying-selling energy prices of all the MGs and the grid. In this paper, the CBESS is considered in subservient mode in that it will act under the command of the CEMS, instead of acting in autonomous mode. Therefore, the costs of charging and discharging of CBESS are not added in the objective function.
m i n k = 1 K t = 1 T ( P R k , t R e c · P k , t R e c + P R k , t S e n d · P k , t S e n d ) + k = 1 K t = 1 T ( P R t B u y · P k , t B u y + P R t S e l l · P k , t S e l l ) ,
where P is respective power value being multiplied with corresponding price (i.e., P R = price) for time from t = 1 to t = T and for the MGs from k = 1 to k = K participating in the MMG system at that time.
Subject to:
k = 1 K P k , t R e c + k = 1 K P k , t B u y + k = 1 K P k , t S u r + P t C B = k = 1 K P k , t S e n d + k = 1 K P k , t S e l l + k = 1 K P k , t D e f + P t C B + t T ,
0 P t C B + P C B C a p · 1 S O C t 1 C B η C B t T ,
0 P t C B P C B C a p · S O C t 1 C B · η C B t T ,
S O C t C B = S O C t 1 C B 1 P C B C a p . P t C B η C B P t C B + · η C B ,
0 S O C t C B 1 t T .
The power bought from the neighboring MGs and the main grid, surplus power from each MG, and the CBESS discharging must be adjusted with the amount of sold power to the neighboring MG and the grid, deficit from each MG, and the CBESS charging demand as represented in (17). The limitations related to the CBESS charging, discharging, and the SOC are given by (18)–(21). In this cooperative model, selling/buying power to/from other MGs of the MMGs system is preferred. If further power is required, trading with the CBESS will be performed. If it is grid-tied MMGs system, the last option will be to trade with grid if required. Similarly, an MG with surplus energy after fulfilling its own demand and charging its BESS will sell power to other deficit MGs, charge the CBESS, and will sell power to the grid in the end. To make this strategy possible, the prices are introduced interval-wise, which will help the algorithm to make a quick, and optimized decision.
m i n i = 1 I t = 1 T ( C i , t C D G · P i , t C D G + C i , t R D G · P i , t R D G ) + t = 1 T ( P R t R e c · P t R e c + P R t S e n d · P t S e n d ) + t = 1 T ( P R t B u y · P t B u y + P R t S e l l · P t S e l l ) ,
subject to:
P t P V + P t W T + i = 1 I P i , t C D G + P t B u y + P t R e c + P t B + P t C B = P t L + P t S e l l + P t S e n d + P t B + + P t C B + t T .
In the proposed MMGs model, the CEMS notifies all MG-EMSs about their commitments and schedulings. Each MG-EMS reschedules its generation after global optimization via local optimization again (rescheduling). Now, the objective function of local optimization of an MG in MMGs network is (22). It includes the CDG generation cost, RDG generation cost, and prices of buying/selling power from/to other MGs and grid. The load balancing constraint is presented in (23). In addition to this constraint, objective function constraints (10)–(15) are also considered. The complete optimization procedure for the proposed MMGs network is illustrated in Figure 3.

4. Case Study

The proposed scheme has been verified on the IEEE 33-bus distribution system. The detailed specifications of the test system can be found in Reference [21]. We have modified the test system and constructed four autonomous MGs, as shown in Figure 4. For MCS, the wind speed and solar irradiance data of four seasonal data of six years (2007–2012) and seventeen years (1998–2014) have been taken [22,23].
Four different load curves, presented in Figure 5a, are used as daily load demands of MGs of the modified test system. The load curves of NYISO-CAPITAL zone, NYISO-N.Y.C. zone, ERCOT, and ISO-NE are used as demands of MG1, MG2, MG3, and MG4, respectively [24]. The parameters of a PV panel and a WT are same as considered in Reference [25]. Each MG has its own CDG, PV, WT, BESS, and EMS. Figure 5b shows the daily forecasted curves of output percentage of solar and wind DGs. The following three scenarios have been studied for the simulations. In Scenario 1, all four MGs are participating in the MMGs network; MG2 and MG3 are grid-tied. Only MG2 and MG3 can trade energy with the grid after sending or receiving power from other MGs. In Scenario 2, three MGs are participating in the MMGs grid-tied network, while the MG1 is in single islanded MG mode. In Scenario 3, three MGs are participating in MMGs grid-tied network, while MG3 is in single islanded MG mode.
It can be observed that there can be many possible combinations of the MGs. In the proposed model, an MG can be in State 1: islanded single MG entity; State 2: grid-tied single MG; State 3: islanded MMGs system or State 4: grid-tied MMGs system, as shown in Figure 6a. Depending on these four possible states of an MG, there are total 256 cases for our test system. In order to verify the robustness of the scheme, 10% of the total cases are generated by MCS, and their details are provided in the next section. To understand the connection of MGs in different states, Cases 07 and 11 from Table 1 are illustrated in Figure 6b,c, respectively. State 1 refers to a single islanded entity, i.e., it has to fully depend on its resources, and no external source is available as MG4 in Figure 6b. In State 2, the MG is a single autonomous entity but has the grid as an external resource, as is MG1, in Figure 6c. In State 3, the MG is connected to other MGs that are also taking part in the MMG system. Other MGs may be connected with the grid depending on their respective states, but this MG is not connected to the grid, as depicted MG2 in Figure 6c, which is connected with other MGs but has no connection with the grid. In State 4, the MG is also connected to the grid besides the connection with other MGs in the MMG system. The connections of other MGs with the grid depend on their respective states. For instance, MG3 in Figure 6b is in the MMG system with MG2, and both are also grid-connected, whereas MG3 in Figure 6c is in MMG system with MG2 and MG4; MG3 and MG4 are connected to the grid, but MG2 is not depending on their states.

5. Results Analysis

5.1. Proposed Scenarios

Figure 7, Figure 8 and Figure 9 show total generation, total demand, charged/discharged powers of the BESS, trading with grid and other MGs of the MMG system, and load curtailment of each MG. In the first scenario, as it can be seen in Figure 7a, MG1 has sold the surplus power from 5:00 a.m. to 7:00 a.m. to others deficit MGs. From 5:00 p.m. to 9:00 p.m., MG1 needed to discharge the BESS after utilizing the maximum capacity of its resources. In Figure 7b,c, MG2 and MG3 were selling their surplus energy to the grid from 12:00 a.m. to 4:00 p.m. and utilizing the stored-BESS-energy from 5:00 p.m. to 9:00 p.m. MG2 was charging the BESS from 10:00 p.m. to 11:00 p.m., but MG3 was still deficient in energy, and its BESS was completely discharged already, and no neighboring MG had energy to sell the power. Therefore, it was receiving the discharged power from the CBESS for these two hours. MG4 was considered with the demand more than the generation to study the behavior and impact of the proposed scheme for worst-case scenario of any practical MG. In Figure 7d, from 12:00 a.m. to 4:00 a.m., the demand was being fulfilled by the storage system, which was completely discharged at 5:00 a.m. Therefore, it had to buy the energy from other MGs from 5:00 a.m. to 7:00 a.m. Later, it started charging the storage system from 8:00 a.m. to 12:00 p.m.; at 12:00 p.m., it was completely charged. From 4:00 p.m. to 7:00 p.m., the local energy storage was completely utilized, and no other MG had extra energy to sell. As a result, from 7:00 p.m. to 11:00 p.m., MG4 was using the discharged energy of the CBESS, and there was no load shedding in the whole day. This is the benefit of the proposed MMG system.
In the Scenario 2, MG1 was the MG which had capacity to meet the demand by its own without buying any energy. This behavior can be seen in Figure 8a. Even though MG1 was in single MG islanded mode, there was no load shedding during the whole day, and it was in the most optimized form. The behavior of MG2 was same as in Scenario 1; the only difference was: it was selling the energy to MG4 as in Figure 8b. The behavior of MG3 was same in Figure 8c as in the previous scenario. In this scenario, MG4 was grid-connected, Therefore, its behavior was slightly different from Scenario 1, i.e., it was selling surplus energy to the grid from 12:00 p.m. to 3:00 p.m. in Figure 8d.
In Scenario 3, MG1 was grid-tied similar to MG2 and MG4, it was selling the surplus power to the grid in Figure 9a. Figure 9b,d show behaviors of MG2 and MG4, which were identical to Scenarios 1 and 2, respectively. MG3 was successfully meeting its demand from 12:00 a.m. to 9:00 p.m. by its own resources in Figure 9c, and there was a little amount of load curtailment from 10:00 p.m. to 11:00 p.m. of the NSL, which shows that the MG is reliable and providing uninterruptible energy to the SL.
Figure 10a compares these three scenarios for the sum of load shedding in four MGs hour-wise. In Scenarios 1 and 2, there was no load shedding, whereas, in Scenario 3, there was a small load curtailment from 10:00 p.m. to 11:00 p.m. Figure 10b compares all scenarios for the sum of total optimal cost of all MGs hour-wise. It can be seen that the costs in all scenarios were nearly the same because, in each scenario, the proposed algorithm took the decision considering minimum cost. Therefore, all three scenarios were having the most optimized costs at each hour.

5.2. Cases Generated by MCS

The 25 cases were generated by MCS, and their respective results per day for each MG are presented in Table 1.
MG1 and MG2 were modeled in such a way that, most of the time, both MGs had surplus energy and never depended on external resources, whereas MG3 and MG4 were modeled in such a way that they were frequently independent of external resources, but, for a few hours, they were deficient in energy. This type of modeling revealed the effectiveness of the proposed strategy and the stability of the presented system model. In Table 1, it can be seen that the MGs in State 4, the MMG grid-connected state, were the most optimized and reliable with the minimum total cost and maximum profit. After meeting their demands, the MGs were selling/buying energy to/from other MGs, charging or discharging the CBESS, and later selling/buying energy to/from the grid. As MG1 and MG2 were microgrids with surplus energy most of the time, they were earning maximum profit in this state by selling the energy to other deficit MGs, charging the CBESS, and selling the energy to the grid. Their buying energy and load shedding were zero for all cases. In State 4, MG3 and MG4 were buying the deficit energy from MG1 and MG2 for few hours if they were in the MMG system, discharging the CBESS, and buying from the grid. In State 4, MG3 and MG4 were selling power to the MGs, charging the CBESS, or selling energy to the grid for rest of the hours, thus also earning the profit, and there was again no load shedding in these two MGs for State 4. In State 3, all MGs could only sell/buy energy to/from other MGs and charge/discharge the CBESS, and there was no trading with the grid. Again, the MG with maximum sold energy earned maximum profit, which is ultimately making its total cost minimum. The MG with buying energy is also in profit because there is no curtailment of the load, which would increase total cost with its penalty price. Thus, it proved that the proposed MMGs scheme is beneficial for each MG, either it has more or less generation capacity than the total demand, making it reliable and curtailment-free MG. In State 2, the MGs were only connected to the grid. They could neither sell/buy energy to/from other MGs nor charge/discharge the CBESS. The MGs could sell power to the grid in surplus energy hours and buy in deficit energy hours. We can see in Table 1 that, for respective states, the total cost of the MGs was nearly equal to or slightly more than that in previous states. In State 1, the MGs had only to depend on their own resources, i.e., they were single islanded entities. MG1 and MG2 in this state were fulfilling their respective demands, whereas MG3 and MG4 needed energy for few hours. No option was available to buy the power, thus having to shed the load. Now, the algorithm preferred to shed the NSL and had provided continuous supply to the SL. In this state, the MGs had more total cost than that in all three previous states. They were still reliable because there was no curtailment in the SL which would maximize the total cost, and there would be no use of energy management scheme. It can be clearly observed from Table 1 that the participation of a large number of MGs in the MMG system will be profitable for each MG, and there will be minimum local and global total costs as in Case 1. If the lesser number of MGs will participate in the MMG system, the lesser the profit will be, and the local and global total cost will increase, as in Case 25.

6. Conclusions

This paper proposed a novel energy management strategy for the day-ahead scheduling of the MMG systems. Four MGs were considered and optimized locally and globally. Each MG was fully connected with all other MGs in the MMG system. The MG-EMS performed local optimization and, after satisfying its local demand, updated the CEMS about its surplus and deficient amount of energy, thus preserving its privacy from other MGs. Only the CEMS took decisions about the power exchange between the MGs or with the grid by considering the state of the MG, generation and trading prices. As it was a two-level management strategy, thus, it increased privacy and resilience of the network. Various test cases were generated by MCS for all possible connections of the MGs. The study was performed on the IEEE 33-bus distribution system, and it has been proven that the proposed strategy and the algorithm are able to satisfy the demands of all MGs optimally. The numerical outcomes confirmed that the proposed methodology is compatible and can be executed effectively for practical microgrid applications. In summary, the proposed method can be utilized to make the management of the MMGs easy for real-world power systems, which will eventually transform the conventional power systems.

Author Contributions

Conceptualization, software, methodology, literature analysis, modeling, simulations, and writing—original draft, K.N.; writing—editing and literature analysis, F.Z.; supervision, editing and resources, K.K.M.; review, S.B.A.B.; supervision and review, H.A.K.; funding acquisition and review, C.-H.K. All authors have read and agreed to the published version of the manuscript.

Funding

This research was financed by the National Research Foundation of Korea (NRF) grant funded by the Korean Government (MSIP), Grant No. 2021R1A2B5B03086257.

Institutional Review Board Statement

Not applicable.

Informed Consent Statement

Not applicable.

Data Availability Statement

Data sharing not applicable.

Conflicts of Interest

The authors declare no conflict of interest.

Nomenclature

TIndex of time intervals.
IIndex of distributed generators.
KIndex of microgrids.
C i , t C D G Production cost of a dispatchable unit ‘i’.
C i , t R D G Production cost of a renewable unit ‘i’.
C t P e n S L Penalty cost for shedding of a sensitive load (l) at time ‘t’.
C t P e n N S L Penalty cost for shedding of a non-sensitive load (l’) at time ‘t’.
P R k , t R e c Power buying price from an MG ‘k’ at time ‘t’.
P R k , t S e n d Power selling price to an MG ‘k’ at time ‘t’.
P C B C a p Capacity of a central battery energy storage system (CBESS).
P i , t C D G m i n Minimum generation limit of a dispatchable unit ‘i’ at time ‘t’.
P i , t C D G m a x Maximum generation limit of a dispatchable unit ‘i’ at time ‘t’.
P k , t L Load of an MG ‘k’ at time ‘t’.
P k , t B u y Power of an MG ‘k’ bought from the grid.
P k , t S e l l Power of an MG ‘k’ sold to the grid.
S O C t B State-of-charge (SOC) of a BESS at time ‘t’.
S O C t C B SOC of a CBESS at time ‘t’.
P P V / P W T Forecasted output of a photovoltaic (PV) panel/wind turbine (WT).
P R t B u y Power buying price from the grid at time ‘t’.
P R t S e l l Power selling price to the grid at time ‘t’.
P B C a p Capacity of a battery energy storage system (BESS).
η B / η C B Efficiency of a BESS/CBESS.
P i , t C D G Production amount of a dispatchable unit ‘i’.
P i , t R D G Production amount of a renewable unit ‘i’.
P k , t S u r Surplus amount of power in an MG ‘k’.
P k , t D e f Deficient amount of power in an MG ‘k’.
P k , t B + Power required to charge a BESS in an MG ‘k’.
P k , t B Power discharged from a BESS in an MG ‘k’.
P k , t S h e d S L Amount of sensitive loads shed from an MG ‘k’.
P k , t S h e d N S L Amount of non-sensitive loads shed from an MG ‘k’.
P k , t R e c Power of an MG ‘k’ bought from another MG.
P k , t S e n d Power of an MG ‘k’ sold to another MG.
c k , i , t Commitment status of a dispatchable unit ‘i’ of an MG ‘k’.

References

  1. Gregoratti, D.; Matamoros, J. Distributed energy trading: The multiple-microgrid case. IEEE Trans. Ind. Electron. 2014, 62, 2551–2559. [Google Scholar] [CrossRef] [Green Version]
  2. Panteli, M.; Mancarella, P. The grid: Stronger, bigger, smarter?: Presenting a conceptual framework of power system resilience. IEEE Power Energy Mag. 2015, 13, 58–66. [Google Scholar] [CrossRef]
  3. Hatziargyriou, N.; Asano, H.; Iravani, R.; Marnay, C. Microgrids. IEEE Power Energy Mag. 2007, 5, 78–94. [Google Scholar] [CrossRef]
  4. Katiraei, F.; Iravani, R.; Hatziargyriou, N.; Dimeas, A. Microgrids management. IEEE Power Energy Mag. 2008, 6, 54–65. [Google Scholar] [CrossRef]
  5. Kanchev, H.; Lu, D.; Colas, F.; Lazarov, V.; Francois, B. Energy management and operational planning of a microgrid with a PV-based active generator for smart grid applications. IEEE Trans. Ind. Electron. 2011, 58, 4583–4592. [Google Scholar] [CrossRef] [Green Version]
  6. Bui, V.H.; Hussain, A.; Kim, H.M. A multiagent-based hierarchical energy management strategy for multi-microgrids considering adjustable power and demand response. IEEE Trans. Smart Grid 2016, 9, 1323–1333. [Google Scholar] [CrossRef]
  7. Chowdhury, D.; Hasan, A.S.M.K.; Khan, M.Z.R. Islanded DC Microgrid Architecture with Dual Active Bridge Converter-Based Power Management Units and Time Slot-Based Control Interface. IEEJ Trans. Electr. Electron. Eng. 2020, 15, 863–871. [Google Scholar] [CrossRef]
  8. Arefifar, S.A.; Ordonez, M.; Mohamed, Y.A.R.I. Energy management in multi-microgrid systems—Development and assessment. IEEE Trans. Power Syst. 2016, 32, 910–922. [Google Scholar] [CrossRef]
  9. Hossain, M.J.; Mahmud, M.A.; Milano, F.; Bacha, S.; Hably, A. Design of robust distributed control for interconnected microgrids. IEEE Trans. Smart Grid 2015, 7, 2724–2735. [Google Scholar] [CrossRef]
  10. Che, L.; Zhang, X.; Shahidehpour, M.; Alabdulwahab, A.; Abusorrah, A. Optimal interconnection planning of community microgrids with renewable energy sources. IEEE Trans. Smart Grid 2015, 8, 1054–1063. [Google Scholar] [CrossRef]
  11. Haddadian, H.; Noroozian, R. Multi-Microgrid-Based Operation of Active Distribution Networks Considering Demand Response Programs. IEEE Trans. Sustain. Energy 2019, 10, 1804–1812. [Google Scholar] [CrossRef]
  12. Lu, T.; Wang, Z.; Ai, Q.; Lee, W. Interactive Model for Energy Management of Clustered Microgrids. IEEE Trans. Ind. Appl. 2017, 53, 1739–1750. [Google Scholar] [CrossRef]
  13. Zhao, B.; Wang, X.; Lin, D.; Calvin, M.M.; Morgan, J.C.; Qin, R.; Wang, C. Energy Management of Multiple Microgrids Based on a System of Systems Architecture. IEEE Trans. Power Syst. 2018, 33, 6410–6421. [Google Scholar] [CrossRef]
  14. Jiang, W.; Yang, K.; Yang, J.; Mao, R.; Xue, N.; Zhuo, Z. A Multiagent-Based Hierarchical Energy Management Strategy for Maximization of Renewable Energy Consumption in Interconnected Multi- Microgrids. IEEE Access 2019, 7, 169931–169945. [Google Scholar] [CrossRef]
  15. Liu, Y.; Li, Y.; Gooi, H.B.; Jian, Y.; Xin, H.; Jiang, X.; Pan, J. Distributed robust energy management of a multimicrogrid system in the real-time energy market. IEEE Trans. Sustain. Energy 2017, 10, 396–406. [Google Scholar] [CrossRef]
  16. Wang, S.; Gangammanavar, H.; Ekşioğlu, S.D.; Mason, S.J. Stochastic optimization for energy management in power systems with multiple microgrids. IEEE Trans. Smart Grid 2017, 10, 1068–1079. [Google Scholar] [CrossRef]
  17. Hussain, A.; Bui, V.H.; Kim, H.M. A resilient and privacy-preserving energy management strategy for networked microgrids. IEEE Trans. Smart Grid 2016, 9, 2127–2139. [Google Scholar] [CrossRef]
  18. Mehmood, K.K.; Kim, C.; Khan, S.U.; Haider, Z.M. Unified Planning of Wind Generators and Switched Capacitor Banks: A Multiagent Clustering-Based Distributed Approach. IEEE Trans. Power Syst. 2018, 33, 6978–6988. [Google Scholar] [CrossRef]
  19. Hetzer, J.; Yu, D.C.; Bhattarai, K. An Economic Dispatch Model Incorporating Wind Power. IEEE Trans. Energy Convers. 2008, 23, 603–611. [Google Scholar] [CrossRef]
  20. Atwa, Y.M.; El-Saadany, E.F.; Salama, M.M.A.; Seethapathy, R. Optimal Renewable Resources Mix for Distribution System Energy Loss Minimization. IEEE Trans. Power Syst. 2010, 25, 360–370. [Google Scholar] [CrossRef]
  21. Selvan, M.P.; Swarup, K.S. Distribution system load flow using object-oriented methodology. In Proceedings of the 2004 International Conference on Power System Technology (PowerCon 2004), Singapore, 21–24 November 2004; Volume 2, pp. 1168–1173. [Google Scholar]
  22. Draxl, C.; Clifton, A.; Hodge, B.M.; McCaa, J. The Wind Integration National Dataset (WIND) Toolkit. Appl. Energy 2015, 151, 355–366. [Google Scholar] [CrossRef] [Green Version]
  23. National Solar Radiation Data Base. Available online: http://rredc.nrel.gov/solar/olddata/nsrdb/ (accessed on 23 September 2019).
  24. LCG Consulting: Energy Online. Available online: http://http://www.energyonline.com/Data/GenericData.aspx?DataId=4 (accessed on 19 February 2020).
  25. Khawaja, K.; Khan, S.; Lee, S.J.; Haider, Z.; Rafique, M.; Kim, C.H. A real-time optimal coordination scheme for the voltage regulation of a distribution network including an OLTC, capacitor banks, and multiple distributed energy resources. Int. J. Electr. Power Energy Syst. 2018, 94, 1–14. [Google Scholar] [CrossRef]
Figure 1. Proposed energy management model.
Energies 14 06012 g001
Figure 2. Elements of the optimization model.
Energies 14 06012 g002
Figure 3. Flowchart of the proposed methodology.
Energies 14 06012 g003
Figure 4. Modified IEEE 33-bus distribution system with four MGs.
Energies 14 06012 g004
Figure 5. (a) Fixed load profile of the different MGs and (b) daily forecasted curve of output percentage of solar and wind DG.
Energies 14 06012 g005
Figure 6. (a) States of an MG, (b) States in case 07, and (c) States in case 11.
Energies 14 06012 g006
Figure 7. Scenario 1: (a) MG1, (b) MG2, (c) MG3, (d) MG4.
Energies 14 06012 g007
Figure 8. Scenario 2: (a) MG1, (b) MG2, (c) MG3, (d) MG4.
Energies 14 06012 g008
Figure 9. Scenario 3: (a) MG1, (b) MG2, (c) MG3, (d) MG4.
Energies 14 06012 g009
Figure 10. (a) Total Load shedding in all MGs and (b) total optimal cost of all MGs.
Energies 14 06012 g010
Table 1. Optimal cost and exchange powers of the MGs.
State of MicrogridsMG1MG2MG3MG4
CasesMG1MG2MG3>MG4PS(kW)PB(kW)LS(kW)C(Rs.)PS(kW)PB(kW)LS(kW)C(Rs.)PS(kW)PB(kW)LS(kW)C(Rs.)PS(kW)PB(kW)LS(kW)C(Rs.)
Case 0144447749.820046,1895743.810022,80439650011,874374.44408.59013,511
Case 02113400051,46900025,675340.230013,304374.44340.23013,375
Case 03113300051,46900025,675340.230013,3040340.23013,647
Case 0421327749.820047,59400025,67500014,352374.441533013,400
Case 0542147749.820046,1895743.810022,8040055.7314,562374.44408.59013,511
Case 0644427749.820047,5945743.810022,80439650011,874374.441533013,400
Case 0724417749.820047,5945743.810022,80439650011,87400153318,759
Case 0824147749.820047,5945743.810021,3960055.7314,562374.44408.59013,511
Case 0924437749.820047,5945743.810021,39639650011,8740408.59013,783
Case 10142400051,4695743.810021,396396555.73011,902374.44408.59013,511
Case 1123447749.820047,594408.590024,06439650011,874374.44408.59013,511
Case 1244147749.820046,1895743.810022,8040055.7314,562374.44408.59013,511
Case 1321427749.820047,59400025,67639650011,874374.441533013,400
Case 1444327749.820047,5945743.810022,80400014,352374.441533013,400
Case 1543227749.820047,59400025,676396555.73011,902374.441533013,400
Case 1642417749.820047,5945743.810022,80439650011,87400153318,759
Case 1743117749.820047,59400025,6760055.7314,56200153318,759
Case 18132200051,46900025,676396555.73011,902374.441533013,400
Case 193223408.590049,8595743.810022,804396555.73011,9020408.59013,783
Case 2043337749.820046,18900025,67600014,3520408.59013,783
Case 21133200051,46900025,67600014,352374.441533013,400
Case 2224117749.820047,5945743.810022,8040055.7314,56200153318,759
Case 2324447749.820047,5945743.810021,39639650011,874374.44408.59013,511
Case 2423327749.820047,59400025,67600014,352374.441533013,400
Case 25111100051,46900025,6760055.7314,35200153318,759
Note: PS = Power sold; PB = Power bought; LS = Load shed; C = Total optimal cost.
Publisher’s Note: MDPI stays neutral with regard to jurisdictional claims in published maps and institutional affiliations.

