Abstract
Proton exchange membrane fuel cells (PEMFCs) have been utilized as a promising power source for new energy vehicles. Their performances are greatly affected by the structural design of the flow field in the bipolar plate. In this paper, we present a novel three-dimensional (3D) bionic cathode flow field, inspired by the small intestinal villi. The structural design and working principle of the 3D bionic flow field units are first described. A 3D numerical model is developed to study the mass transfer and distribution of the reactants and products, as well as the polarization performances of the PEMFC with the 3D bionic cathode flow field. The simulation results indicate that the proposed 3D bionic flow field can significantly improve the reaction gas supply from the flow field to porous electrodes, and thus would be beneficial for the removal of liquid water in the cathode. The mass transfer of gas in the PEMFC can be enhanced due to the increasing contact areas between the gas diffusion layer (GDL) and the cathode flow field, and the distribution of currents in the membrane would be more uniform. The obtained results demonstrated the feasibility of using the 3D bionic flow field for the development of highly efficient PEMFCs with high power density.
1. Introduction
Proton exchange membrane fuel cells (PEMFCs) have been regarded as a considerable candidate for the next generation of green power source, due to the advantages of low pollution, low noise, and high energy conversion efficiency [1]. Although PEMFCs have made great progress, their performances still need to be improved. Optimized mass transfer and water management are urgently required for the development of highly efficient PEMFCs. Since the bipolar plate of the PEMFCs plays the essential role of air supply, water removal, and current conduction, optimizing the structural design of the flow field can improve the PEMFC’s performance and durability [2]. The flow field design also has a crucial influence on the mass transfer in the PEMFC, especially at high current conditions [3].
The traditional flow fields are based on two-dimensional (2D) graphic design and can be classified as lattice [4], parallel [5,6], serpentine [7,8], and interdigital [9,10] structures. The lattice structured bipolar plate has the lowest pressure drop, while the internal fluid velocity is low and the reaction gas has poor directivity, resulting in inconsistent gas distribution uniformity and easy flooding. The parallel structured bipolar plate can distribute the gas to cover the entire electrode surface, but the uneven allocation of the gas flow in each sub-channel can easily lead to shortcomings, such as insufficient local gas supply. The long and meandering channel of the serpentine has higher mass transfer performance than that of the parallel structured bipolar plate, but causes more power loss due to its larger pressure drop. The interdigital flow field forces the reactant into the membrane electrode assembly (MEA) and drives the discharge of liquid water in the voids of diffusion layer. However, this flow field greatly increases the pressure drop, and in severe cases, water flooding or local overheating may occur. In addition, several other composite flux fields have been reported [11,12,13]. For example, Honda Motor Co., Ltd. invented a wave-shaped channel to design the bipolar plates, which can improve the intensity of mass transfer. The bionic design has been applied to the PEMFC’s flow fields [14]. Jason et al. [15] proposed a novel flow field structure to design the bipolar plate, inspired by the lung lobes. The simulation results showed that the proposed bionic flow field has low pressure loss and the power density is about 30% higher than the traditional serpentine flow fields. Chen et al. [16] and Ruan et al. [17] carried out research on the leaf-shaped bionic flow channel, and the simulation results showed that the branch of the flow channel can cause changes in the velocity and gas distribution at the confluence, leading to more reactant gas participating in the electrochemical reaction to improve the performance of PEMFC. The above studies showed that these bionic flow field structures exhibit advantages in terms of pressure drop, power density, system robustness, etc. In this study, we propose a new type of bionic cathode flow field structure, inspired by the characteristics of small intestinal villi to fully disturb the fluid.
It is worth noting that above 2D planar flow fields are composed of multiple channels and ribs, in which the channels are the key component of the flow field while the ribs are usually harmful to the diffusion of reactants [18,19,20,21]. In order to enhance the mass transfer performance, 3D flow fields have been proposed. Kim et al. [22] studied the behavior of liquid water and the potential mechanism of mass transfer in the 3D flow field by using multi-phrase simulation. The results showed that adding the baffles to the channels can strengthen the uniformity of the gas distribution and removal of the produced water. Chen et al. [23] proposed a pin-shaped 3D flow field and studied the influence of gas velocity and contact angle on the drainage performance. The research showed that as the gas flow rate increased, the growth rate of droplets in the pin-shaped 3D flow field gradually decreases, and the associated drainage efficiency continues to improve. Moreover, when the contact angle gradually decreases, the volume of the droplets formed in the pin-shaped 3D flow field increases accordingly, which leads to the drainage efficiency gradually dropping. Furthermore, Chen et al. [24] proposed a wave-shaped 3D flow field, a novel flow field structure with special periodic geometry characteristics. The research showed that the wave-shaped 3D flow field had a higher drainage performance compared with the conventional flow field. Note that with the decrease in the minimum channel depth and wavelength, the drainage performance was significantly improved. Toyota Motor Co., Ltd. invented the well-known 3D fine mesh flow field which was utilized in Mirai [25]. Benefitting from the 3D fine mesh flow field, the limiting current density of the PEMFC stack increased up to 2.4 times when compared to that with traditional parallel. Then, Bao et al. [26] developed a 3D multiphase CFD model to study the PEMFC with 3D fine mesh flow field by incorporating the CL agglomerate model. Simulation results showed that the 3D fine mesh flow field can improve the supply of the reactant gas to the porous electrode and facilitate the removal of liquid water in the PEMFC cathode. The flow field with the 3D convex structure had generally low flow resistance and high efficiency. These advantages are particularly obvious when comparing with the traditional 2D flow field. Therefore, on the basis of proposing a 3D bionic structure, we developed a numerical model of the PEMFC with 3D bionic flow field, with the aim of analyzing the mass transfer and electrochemical performances.
Numerous studies have conducted bionic patterns and 3D structure designs of flow fields. They usually have the advantages of uniform mass transfer and efficient water removal. Thus, 3D bionic flow field design can imitate the stereoscopic functional structure in nature, and provide the reactant to the MEA and drain the product water evenly and continuously, especially in high current conditions. In this study, we propose a novel 3D bionic cathode flow field to mimic the small intestinal villi, which has the structure of micro-protrusion as well as characteristic of fully agitating the fluid. Firstly, the structural design and working principle of the 3D bionic flow field are presented. Then, a numerical model is established to study the benefits of using 3D bionic flow field to enhance the mass transfer and electrochemical performances of the PEMFC. Finally, the results and discussion are conducted.
2. Design of 3D Bionic Flow Field
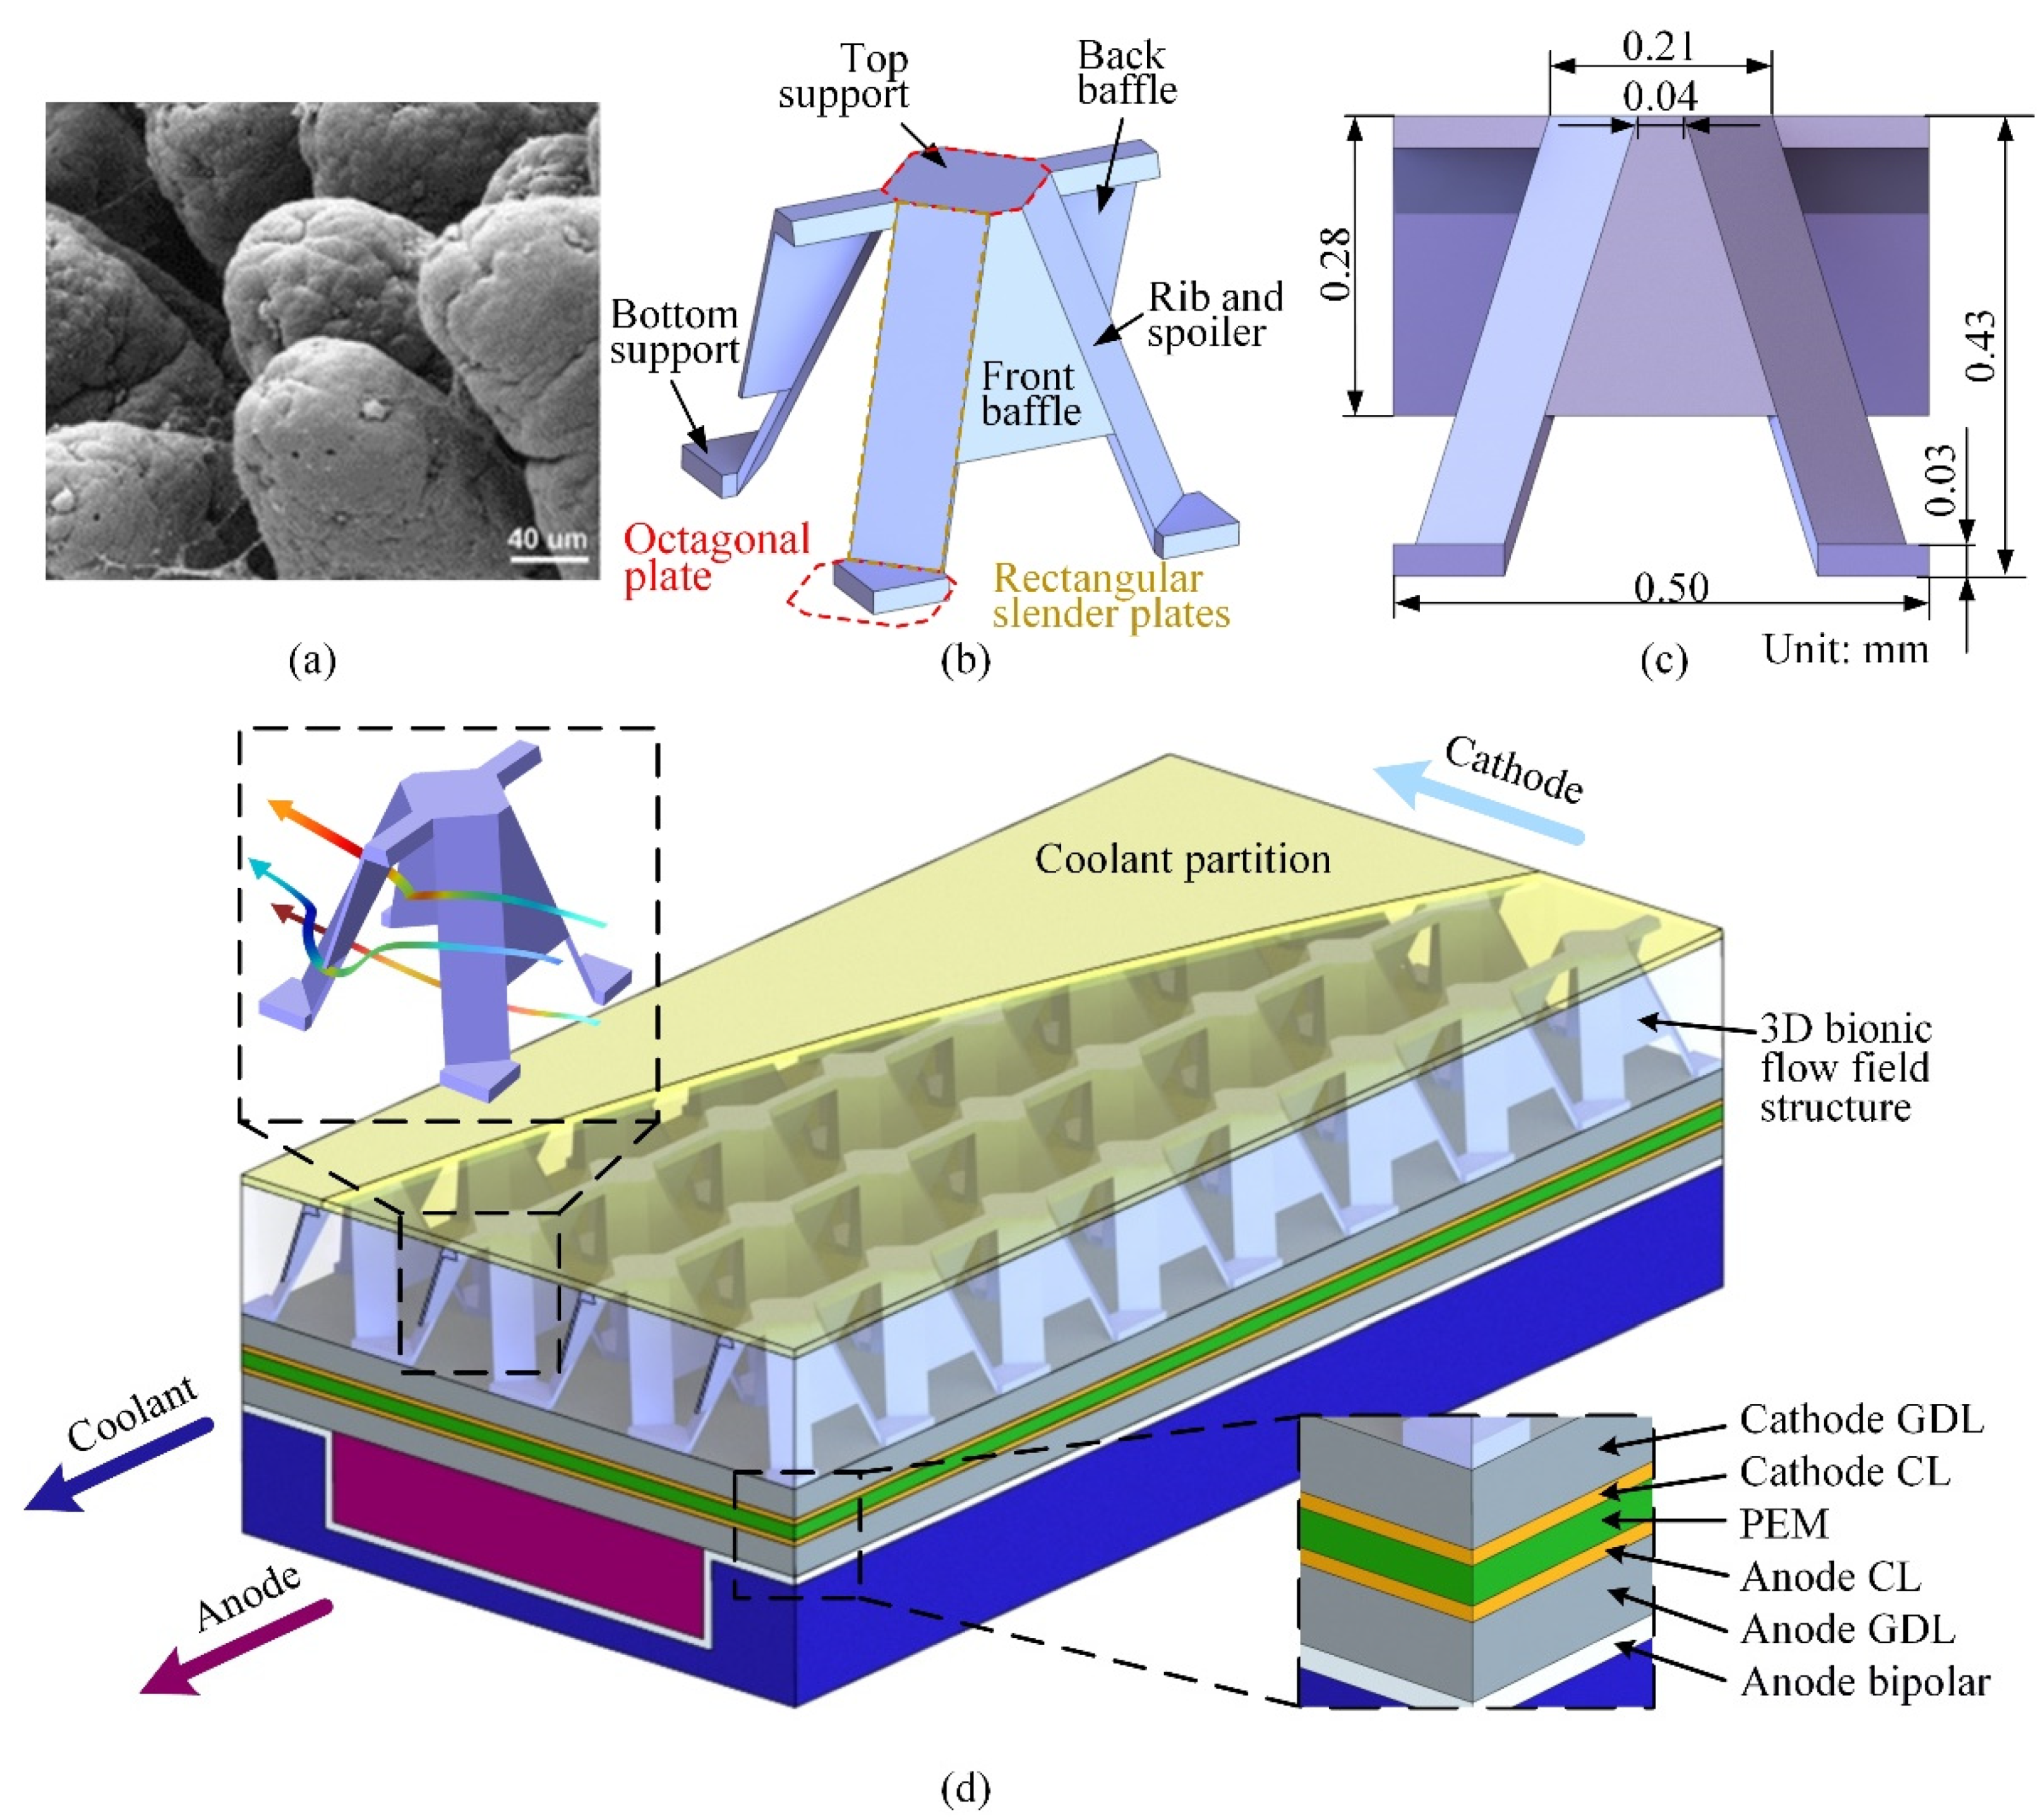
As shown in Figure 1a, the small intestine usually contains a large number of villi [27]. They can be regarded as a number of serried slender micro-protrusions arranged in different directions. These villi can be used to increase the turbulent effects of digested matter and thus improve the absorption rate of nutrients. The function of these villi happens to coincide with the requirement of PEMFC flow field for increasing turbulence and enhancing mass transfer. Therefore, we propose a structural design of a 3D bionic flow field to mimic the small intestine villi for the cathode of PEMFC with the aim of making the reactant distribution uniform and improving the discharge of the reaction product water.

Figure 1.
(a) SEM image of small intestine villi [27]. Reproduced with permission [27]. Copyright 2007, Elsevier. (b) The 3D bionic designed unit, (c) geometric parameters of the 3D bionic unit, (d) overall structure of the final designed 3D bionic flow field of the fuel cell.
The micro-protrusion structure of the small intestine villi was initially extracted to determine the structural parameters of the bionic unit. The top and bottom supports are set as octagonal plates; they contact the coolant partition and cathode gas diffusion layer (CGDL), respectively. The top and bottom supports are in a staggered arrangement with a certain distance between the adjacent long sides. The rectangular slender plates are utilized to connect the long sides forming the ribs as well as the spoilers. The front two ribs are used to disperse and raise the gas flow, and the back two can converge the flow and make it descend. In order to increase the turbulence of the reactant gas comprehensively and transmit the oxygen to the CGDL, the upper part of the rib is connected alternately to form the front and back baffles, as shown in Figure 1b. The front baffles are used to enhance the uniformity of the lateral distribution of oxygen, and the back baffles are mainly used to intensify the vertical convection. The majority of the reaction gas is collected close to the GDL with the effects of the ribs and baffles. The specific geometric dimensions are shown in Figure 1c. The 3D bionic unit has a length of 0.50 mm, width of 0.50 mm, and height of 0.43 mm. The height from the bottom edge to the top surface of the baffle is set as 0.28 mm. Finally, the 3D bionic flow units are regularly arranged in an array to form the 3D bionic flow field structure for the PEMFC.
The final constructed 3D bionic flow field fuel cell is illustrated as shown in Figure 1d. It is composed of a coolant partition, 3D bionic mesh, cathode gas diffusion layer (CGDL), cathode catalyst layer (CCL), proton exchange membrane (PEM), anode catalyst layer (ACL), anode gas diffusion layer (AGDL), and anode bipolar plate. The cavity between the anode bipolar plate and the AGDL is parallel, and the void between the coolant partition and the anode bipolar plate of the adjacent single electrode can be used as the coolant channel. The gas flow directions of the anode and cathode are mutually perpendicular, as indicated by the arrow lines of the insets shown in Figure 1d.
3. Numerical Modelling and Simulation
3.1. Numerical Modelling
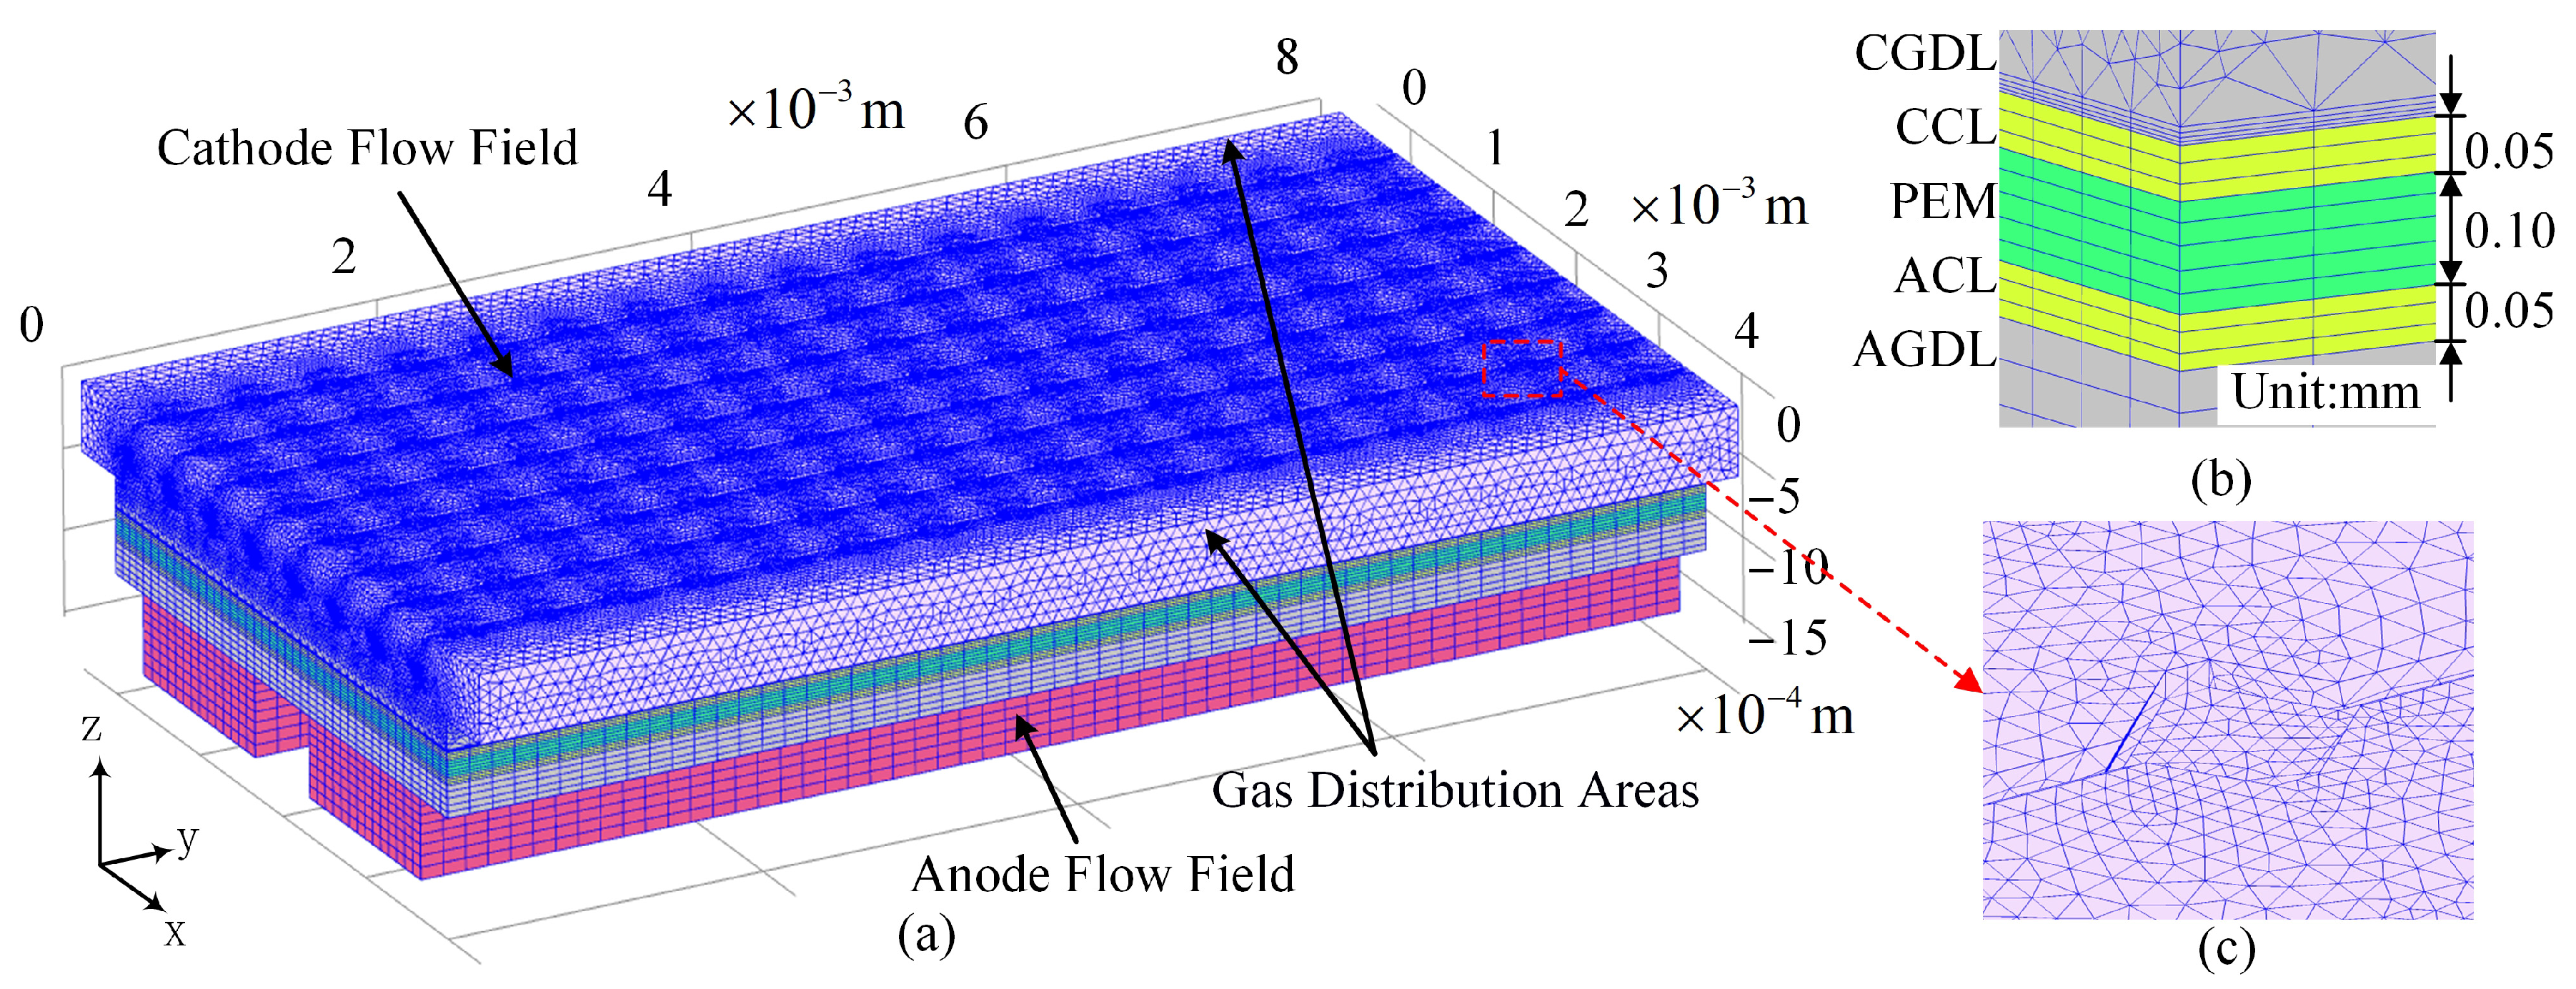
The multi-phase numerical model was developed by using the simulation software of COMSOL Multiphysics. Figure 2 shows the numerical model of the PEMFC with cathode 3D bionic flow field. It was constructed based on the geometries of a 3D bionic flow field structure design of a PEMFC cathode. As shown in Figure 2a, the overall dimensions are 8.00 mm × 4.00 mm × 1.18 mm. From top to bottom, the domains are cathode flow field, CGDL, CCL, PEM, ACL, AGDL, and anode parallel channels. The thicknesses of the PEM, CL, and GDL are set as 0.10, 0.05, and 0.20 mm, respectively, as can be seen in Figure 2b. The cross-section of the anode parallel is 1.30 mm long and 0.50 mm wide. The cathode flow field was obtained by reverse Boolean operations of the 3D bionic structure in the rectangular cavity. In order to reduce the influence of the inlet and outlet boundaries on the mass transfer simulation, 0.40 mm wide cuboid distribution areas are set at the inlet and outlet of the cathode.
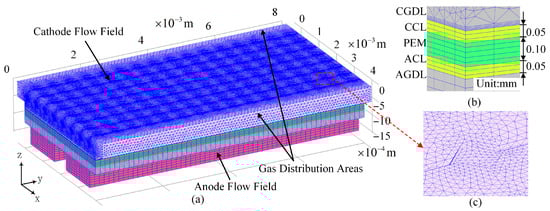
Figure 2.
Numerical modelling of 3D bionic flow field: (a) numerical computational domain of the PEMFC with cathode 3D bionic flow field, (b) schematic of the membrane electrode assembly (MEA), (c) partial 3D bionic flow field grid cells.
To simplify the numerical simulation, we maintain the following seven assumptions: (1) The fuel cell is operated at a stable state and the working temperature in the fuel cell is assumed to be steady at 343.00 K; (2) the mixed gas is incompressible; (3) the GDL and CL are homogeneous porous media and the PEM is impermeable to gas and only allows water molecules or protons to pass through; (4) the water generated on the cathode side exists in the misty state; (5) the fluid state in the flow field is laminar; (6) the influence of gravity are ignored; (7) the contact resistances between the diffusion layer, catalytic layer, and proton exchange membrane are neglected.
This model used two different grids to ensure the accuracy of the simulation. Given that the architecture of the 3D bionic flow field is highly complicated, a total of 6,340,069 tetrahedron grids are meshed in the cathode flow field and CGDL. Figure 2c shows a part of the result after meshing. In order to shorten the calculation time, 509,065 hexahedral grids were used in the anode parallel, AGDL, ACL, PEM, and CCL. In addition, the grids are tested for irrelevance, which demonstrates that the magnitudes of the grids have negligible influence on the simulation results.
3.2. Governing Equations
The mass transfer and electrochemical reactions can be solved by using the governing equations of continuity, momentum, composition, and charge transport. These governing equations are described in the following terms.
The continuity equation: solved in the flow fields, GDLs, and CLs. This equation indicates that the added mass in a cell is equal to the static mass of the fluid flowing into the cell at the same time, and can be expressed as:
where ν is the velocity vector of the fluid; ρ is the density of the fluid; and Sm is the mass source term, having different meanings in different computation domains. In ACL, Sm means the consumption of hydrogen; in CCL, Sm denotes the difference between the amount of water and consumption of oxygen; in other computation domains, Sm equals zero. Thus, they can be expressed as:
where F is the Faraday constant; , , and represent the molar masses of hydrogen, water, and oxygen, respectively; and ja and jc are the exchange current densities of the anode and cathode of the fuel cell, respectively.
The momentum equation: solved in flow fields, GDLs, and CLs. The equation indicates that the momentum change rate of each fluid micro-element is the same as the resultant force acting on the micro-element, and can be expressed as:
where ε and p are the porosities of the porous medium and fluid pressure, respectively; K is the result of the fluid viscosity divided by the porosity; and Sv is the momentum source term, which is related to the porosity and permeability in the porous media domain.
where μ is the hydrodynamic viscosity and κ−1 is the permeability of the porous medium. There is no additional momentum loss for the fluid in the flow field domain, where Sv is zero.
The composition equation: also solved in flow fields, GDLs, and CLs. This equation indicates that the increased mass of a kind of component in a cell is equal to the mass flowing into the cell at the same time.
where ωi shows the mass fraction of the gas; Ri is the component source term; and the subscript i can represent the component of oxygen, hydrogen, or water.
Since the electrochemical reaction only occurs in the catalytic layer, it is related to the number of electrons participating in the electrode reaction (n) and local exchange current density (iv), so it can be expressed as:
where vi is the stoichiometric coefficient of substance i in the reaction.
Note that the diffusion of gas is hindered by the solid part of the porous media. To account for the influence of these hindrances, the diffusion flux (Di,k) needs to be corrected. According to the Bruggeman effective diffusion coefficient model [28], the Di,k in the porous electrode should be corrected as ε1.5Di,k.
The charge conservation equation: it has two parts, electrons (solved in GDLs and CLs) and ions (solved in PEM and CLs), according to the difference of charge carriers in different areas of the battery. They can be expressed as:
where σe and σi represent the conductivity; ϕe and ϕi are the electric potential; Se and Si are the current source term; and the subscripts e and i represent the electron conductor or ion conductor, respectively. Note that the electrochemical reaction only occurs in the catalytic layer, so in the ACL: Se = −ja and Si = +ja, while in the CCL: Se = −jc and Si = +jc.
The relationship between the local current density and the concentration of reactants, temperature, and other factors can be described by the Buter–Volmer equation [29]:
where R is the gas constant (8.314 J/(mol·K)); T is thermodynamic temperature; j0 is the exchange current density, which depends on the catalyst performance and the concentration of local reactants and products; η is the overpotential of the catalytic layer, representing the voltage to overcome the loss of the activation energy barrier of the electrochemical reaction; and α is the transfer coefficient, and it depends on the activation symmetry.
In the anode, the electrode overpotential is:
At this time, ηa is much smaller than RT/F, so Fηa/RT ≈ 0. ja in the anode can be simplified as:
In the cathode, the electrode overpotential can be expressed as:
In this case, the Buter–Volmer equation can be simplified to a Tafel equation:
where j0,cref is the exchange current density at the reference oxygen concentration and Ac is the Tafel slope.
In order to determine the supply rate of reactants, according to the Faraday theorem, the consumption rate of hydrogen and oxygen and the rate of water production can be expressed as:
where and are the consumption rates of hydrogen and oxygen, respectively; is the generation rate of water; , , and are the molar masses of the corresponding substances; and Ia and Ic are the currents of the anode and the cathode.
3.3. Boundary Conditions
As for the boundary conditions, the inlet gas was pure hydrogen and oxygen for the anode and cathode, respectively. The flow rate can be adjusted according to the average current density, and the reactant supply is 1.5 times of the consumption. Both the anode and cathode reactant consumptions can be obtained from Equation (14). The outlet condition was set at a constant pressure of 2 atm. The internal temperature of the numerical domain is 343.00 K, and the ambient temperature is 293.15 K. As for the interface status, the velocity, reactant concentration, and current conduction in the fluid and porous media domain are continuous. Non-slip boundaries were adopted at the interface between the porous domain and the membrane phase region. As for the electron boundary condition, the potential at the surface between the AGDL and 3D bionic flow field structure was set to 0 V. Accordingly, the potential at the surface between the CGDL and cathode 3D bionic flow field was set to a variable output voltage.
4. Results and Discussions
4.1. Mass Transfer in the 3D Bionic Flow Field
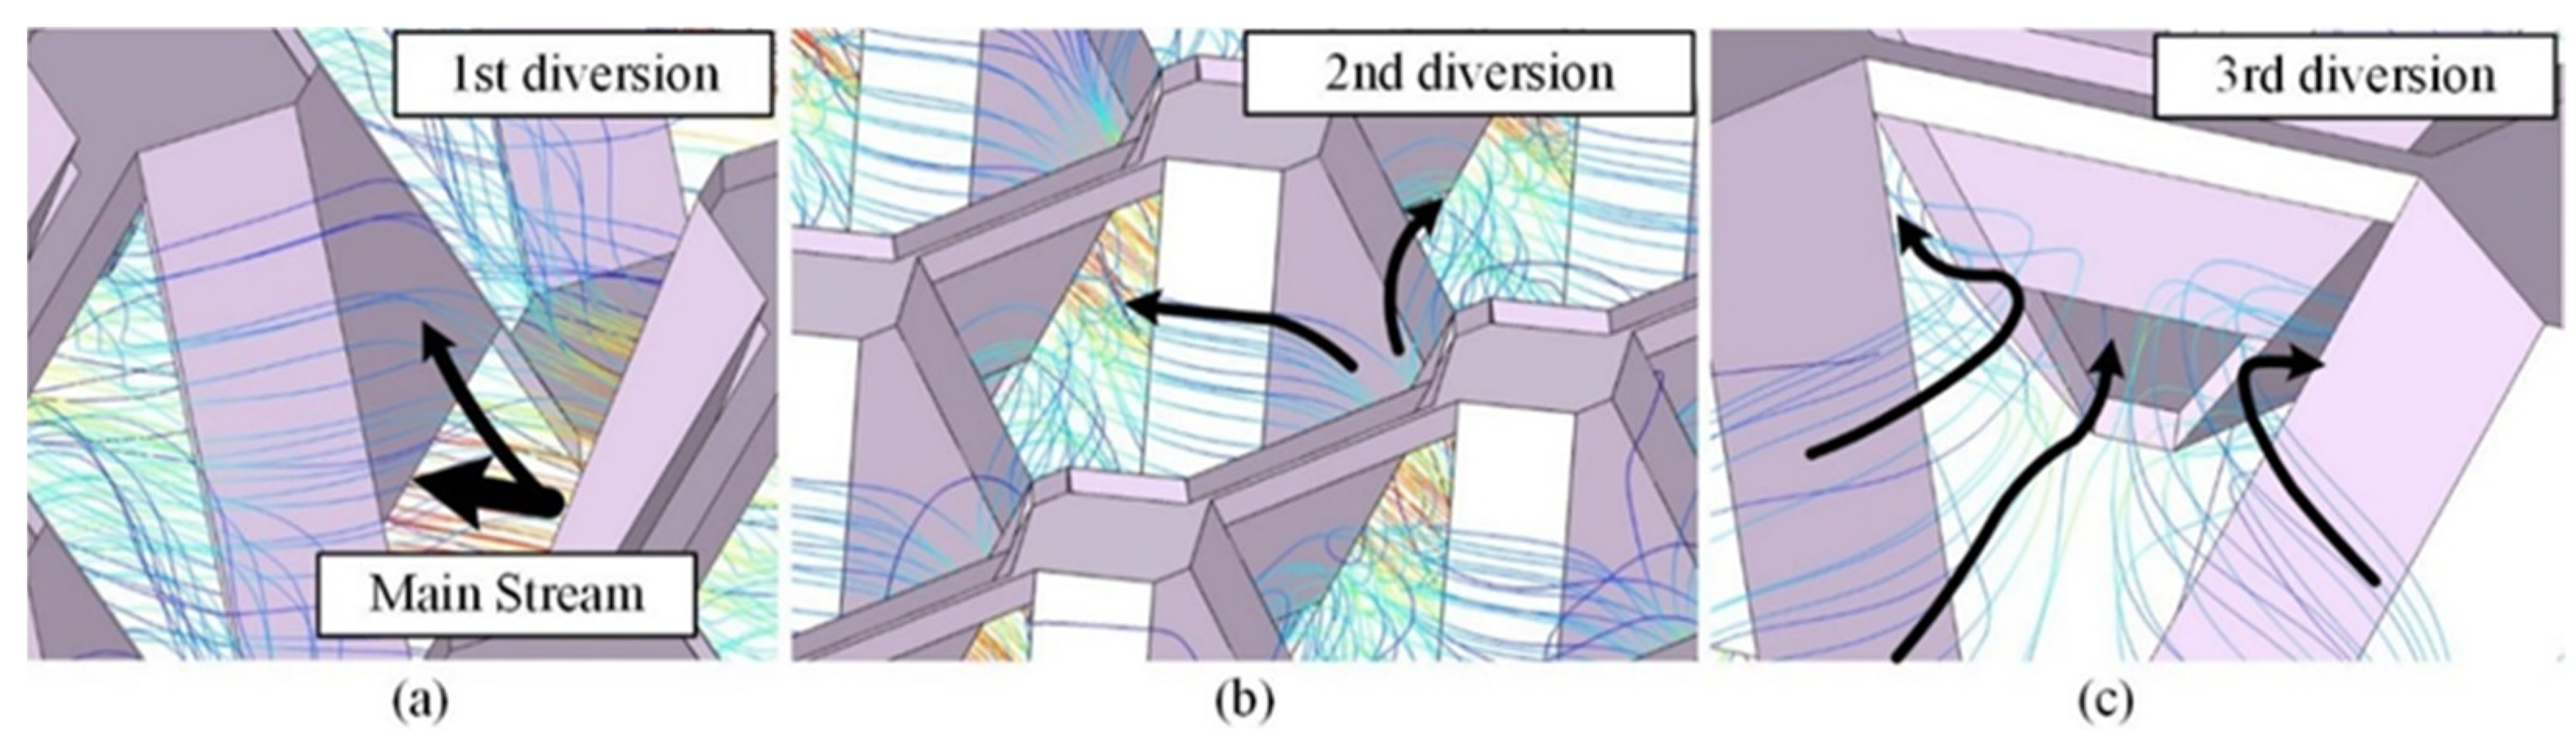
The central part of the flow field was selected to observe the gas velocity distribution. As shown in Figure 3a, when the reaction gas flows towards the 3D bionic unit, the majority of the gas passes through the trapezoidal hole formed by the 3D bionic unit and CGDL. It can be regarded as the main stream of the flow field. The rest are affected by the front baffle and generate upward sub-velocity, causing the first diversion of the reaction gas, as shown in Figure 3a. After that, the uplifted gas is divided into two streams, and flow upwards on both sides of the unit, which is the second diversion of the flow, as shown in Figure 3b. Then, tributaries of each unit are converged in the gaps between two adjacent units. Finally, the third diversion occurs, as shown in Figure 3c. The convergent gas flow from two sides is affected by the back baffles and divided into three parts. A small part is squeezed down then flows through the hole between two adjacent units, but most of the gas flows downwards to the left and right sides diagonally, then passes through the unit to enter the next cycle.
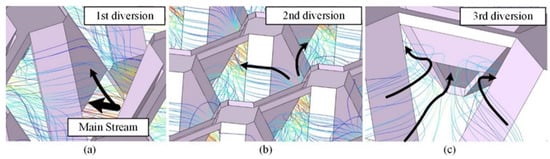
Figure 3.
Three main states of the cathode reactant gas in an entire process flowing through a 3D bionic unit: (a) the first diversion, (b) the second diversion, (c) the third diversion.
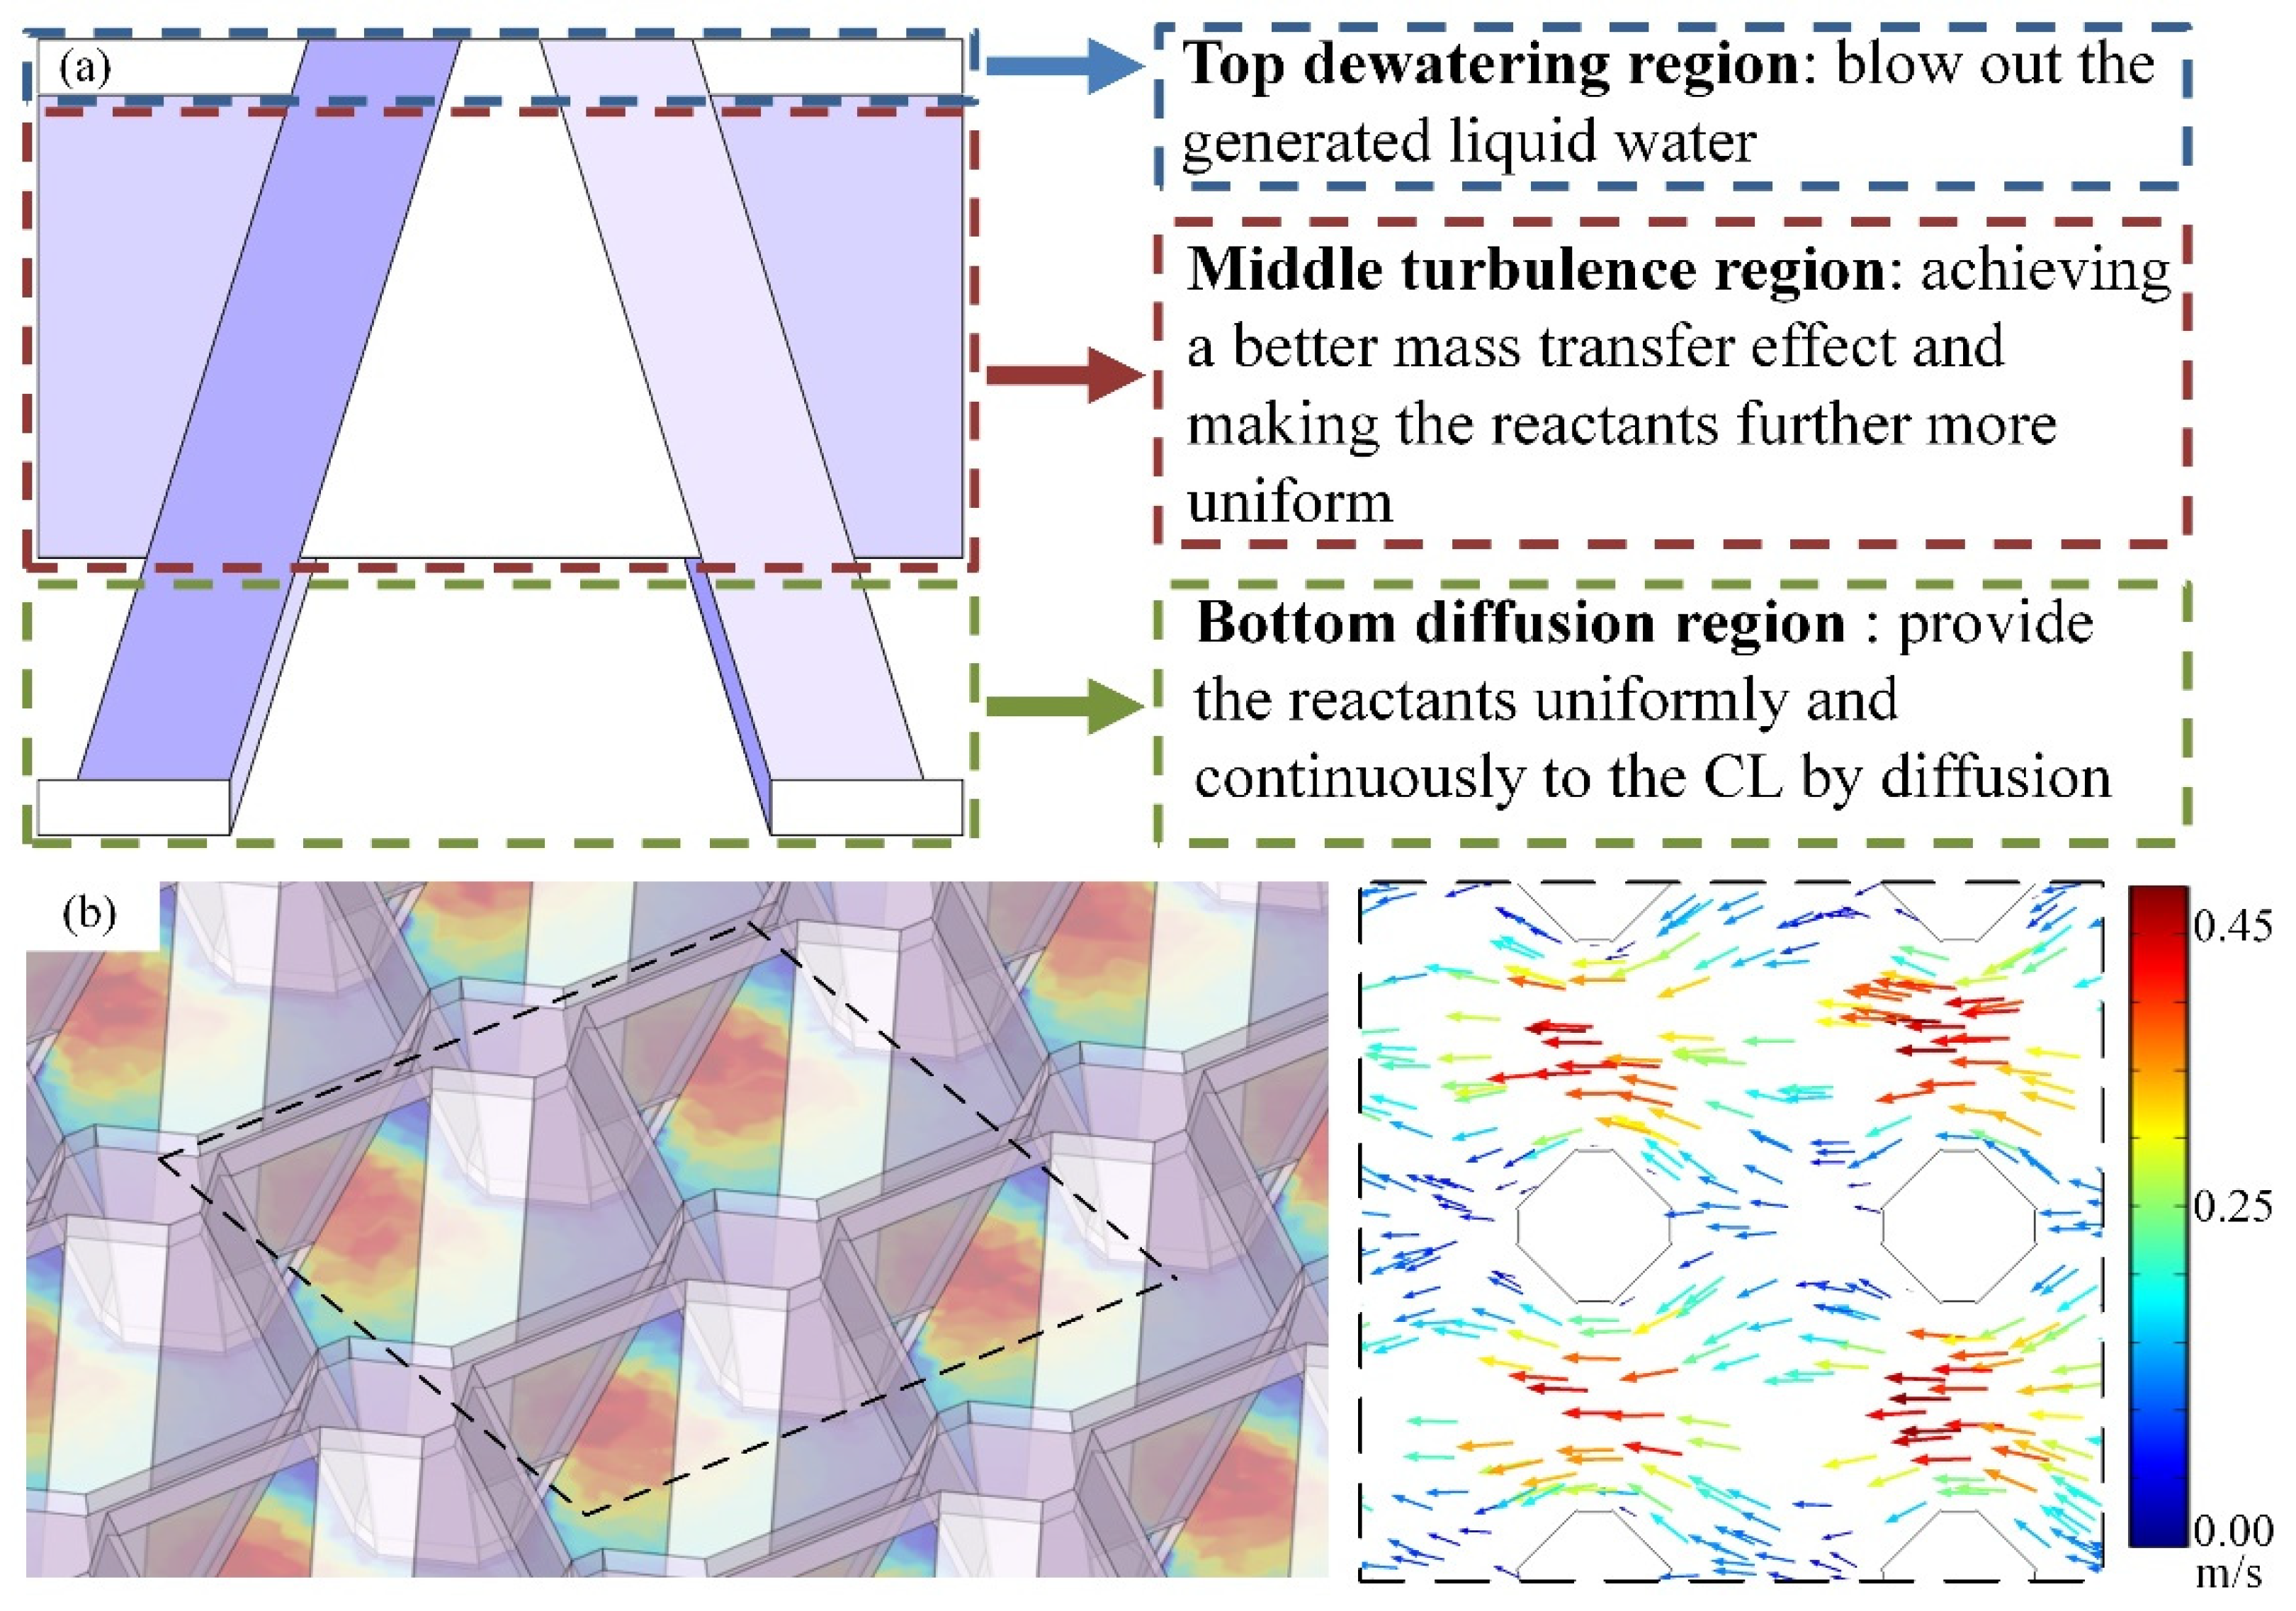
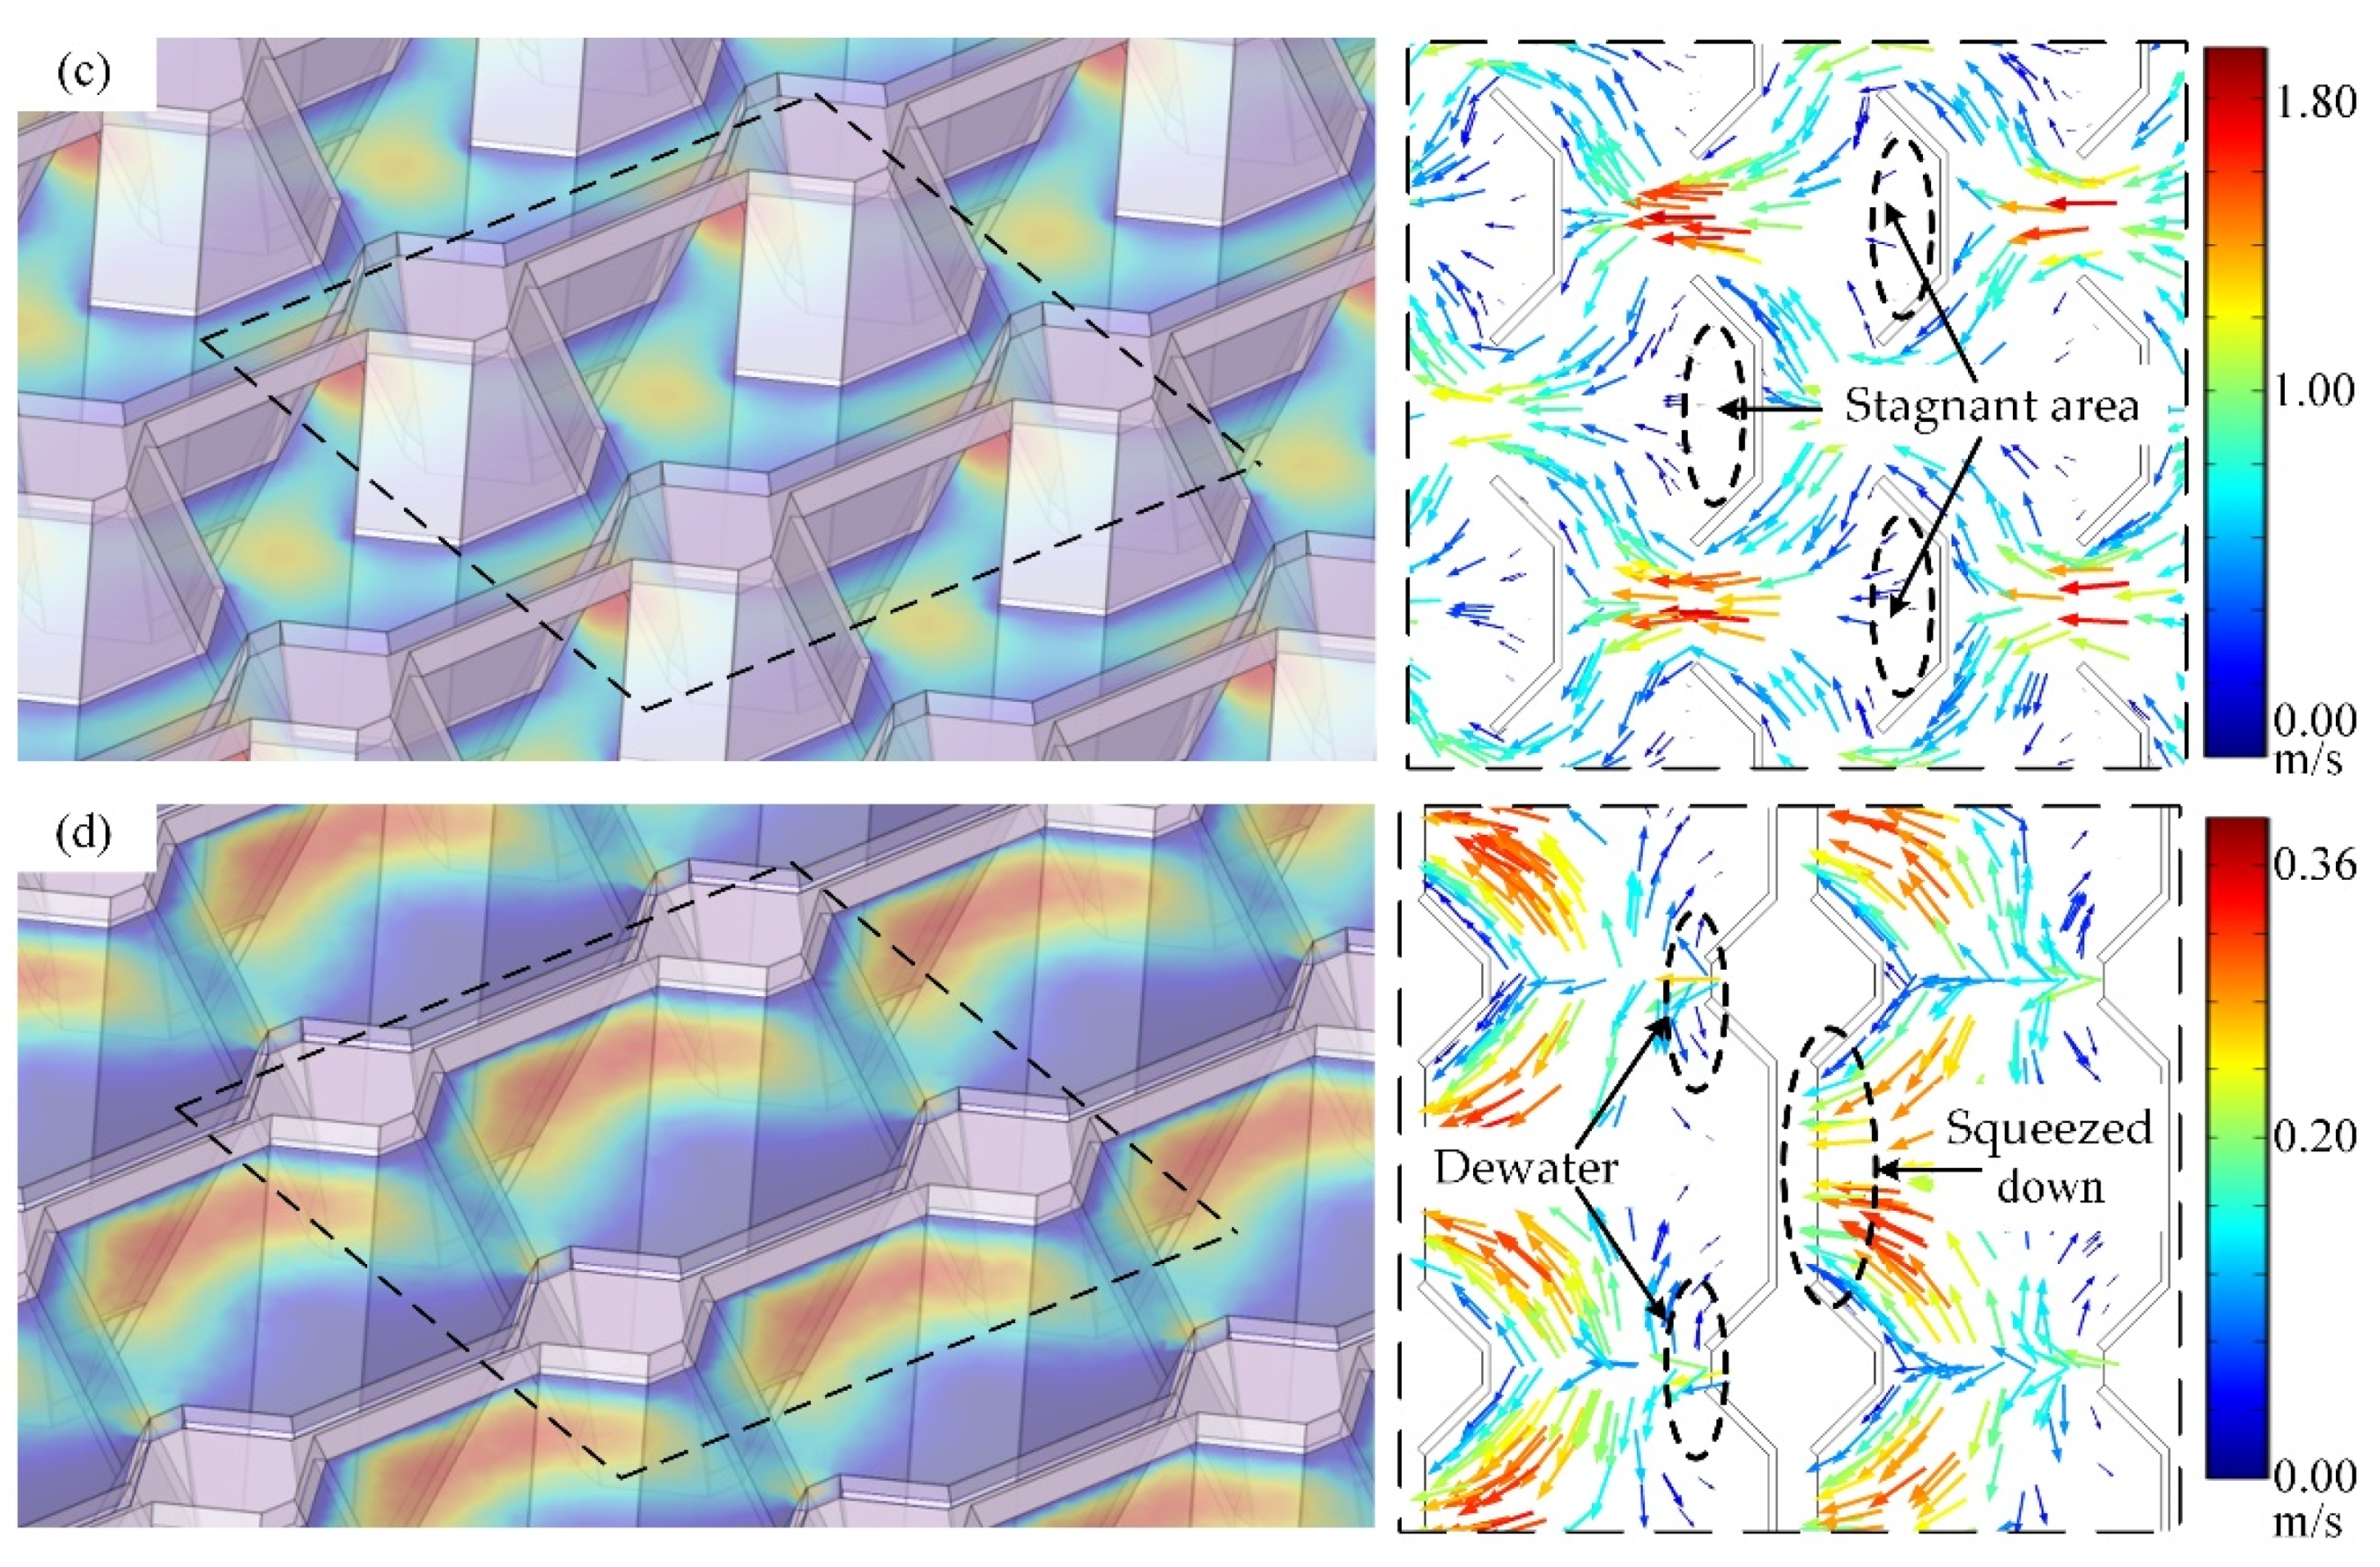
The reaction gas in the 3D bionic flow field can be divided into three layers according to their functions, as shown in Figure 4a. The first layer above the surface of the cathode GDL is the bottom diffusion region. Figure 4b shows that the gas mainly flows through the front trapezoidal holes of the unit. Due to the spoiler effect of the bottom supports and ribs, the gas is evenly distributed on the surface of the cathode GDL. Consequently, the primary function of this layer is to provide the reactants to the CL uniformly and continuously by diffusion. The second layer is the middle turbulence region, as shown in Figure 4c. The gas continues to be disturbed by the front and back baffles, thereby achieving a better mass transfer effect and distributing the reactants more uniformly in the flow field. While the reactants are converged and squeezed down by the front ribs, a higher velocity is observed in the intermediate gaps between the ribs. Meanwhile, the convergent gas is forced into the bottom diffusion layer by the guidance of downward back baffles. There is a tiny stagnant area behind the baffle, where the gas flows quite slowly. However, since this layer is not in contact with GDL and does not play a key role of drainage or mass transfer, these stagnant areas will not have a negative impact on mass transfer. As shown in Figure 4d, the main gas flow in the top layer is squeezed down by the back baffle, and the rest passes through the gap at the back of the unit, while blowing out the liquid water generated in the electrochemical reaction, so this layer can serve as the dewatering region.
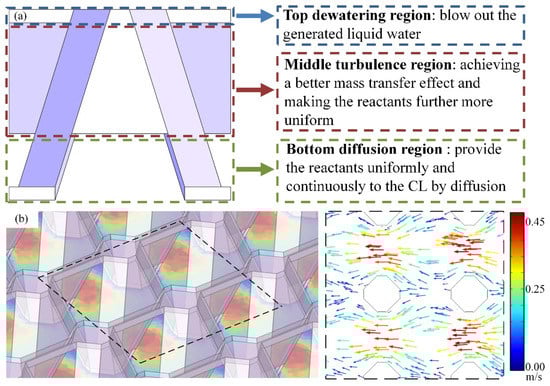

Figure 4.
Three layers of cathode 3D bionic flow field with gas velocity nephogram and streamlines: (a) overview of three regions, (b) bottom diffusion region, (c) middle turbulence region, and (d) top dewatering region.
4.2. Reactant and Product Distribution in Cathode
The reactant flows along the negative direction of the x-axis within the cathode flow field. Since oxygen is consumed by the electrochemistry reaction, the distribution of the oxygen concentration has a tendency to decline progressively with the flow. In addition, oxygen has a weak diffusion performance. Thus, the gas turbulence has a greater effect on the oxygen concentration distribution than the diffusion process. Hence, there is an obvious decline in the oxygen concentration distribution along the flow direction in the catalytic layer. The gas in each region, as mentioned above, is influenced by turbulence from the baffles and ribs. Meanwhile, the gas exchange between different regions exists, as well. Therefore, the reactants in the cathode flow field are homogeneously distributed. On the other hand, the back baffles can force the reactants to plunge into the CGDL, which have a similar function as the baffle plates added in the traditional parallel channel [20]. Thus, the oxygen has a higher concentration as well as a more uniform distribution in the porous electrode. Overall, the CGDL and CCL can acquire more sufficient and uniform reactants with 3D bionic flow field, as shown in Figure 5a, which is beneficial to increasing the power of the PEMFC.
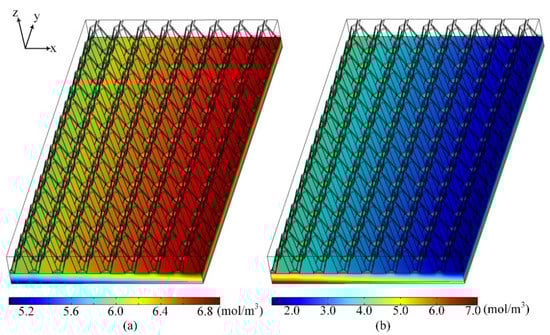
Figure 5.
Reactant and product distribution: (a) oxygen molar concentration in CGDL and CCL, (b) water saturation distribution in CGDL and CCL.
The water distribution in the reaction process is illustrated in Figure 5b. The water concentration gradually decreases from the CCL to the cathode flow field, indicating that the water is drained by the gas flow. Figure 4 demonstrate that when the gas flows through the 3D bionic unit, most of the gas are concentrated in the holes of the 3D bionic flow field, causing a higher gas flow velocity to reduce the pressure. Thus, the liquid water is drawn to the contact surface between the CGDL and flow field, then accumulates at the top dewatering region. The converged gas in the gap at the back of the unit can blow out the liquid water continually to prevent the gas flow path from being blocked.
Overall, the 3D bionic flow field can push the reaction gas to the porous electrode, and remove the produced liquid water from the CGDL to enhance the electrochemical reaction performances of the PEMFC.
4.3. Polarization Performance and Current Density
The average current density at different output voltages was used as the standard for evaluating the performance of the fuel cell, which is plotted to obtain the fuel cell polarization curve. Figure 6a shows the polarization and power density curves of the PEMFC with 3D bionic flow field at 343.00 K. A significant voltage drop can be found in the range of 0.95–0.8 V, when the fuel cell turns from an open circuit state to the low current density discharge state, which can be called the activation loss state. In this range, the voltage drop is mainly caused by the activation of the MEA. The activation polarization loss is mainly determined by the characteristics of the membrane and catalyst, and the influence from the flow field can be negligible. As the voltage continues to decrease, there is a linear relationship between voltage and current density in the range of 0.8–0.4 V. In this range, the fuel cell activation polarization loss tends to be stable and does not change with the current density. Comparatively, the ohmic polarization loss related to the fuel cell resistance has a major influence on the polarization of the fuel cell. Moreover, the good linear relationship of the voltage to current density also indicates that the concentration polarization loss in the CL is low, which demonstrates that there is no evident gas shortage of gas supply within the fuel cell.
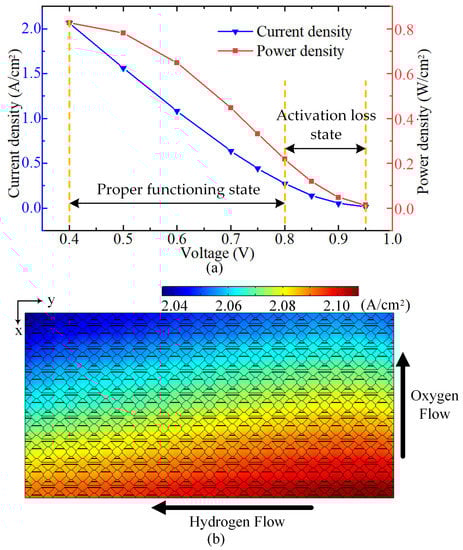
Figure 6.
(a) Polarization and power density curve of PEMFC with 3D bionic flow field, (b) electrochemical reaction current density.
Figure 6b depicts the PEM current density distribution of the fuel cell with 3D bionic flow field when the voltage is 0.4 V. The direction of cathode oxygen flows and anode hydrogen flows is indicated in the figure. It can be observed that the membrane current density decreases more apparently in the oxygen flow direction, so the current density is more related to the cathode gas reactant distribution concentration. The octagonal plates of 3D bionic units not only play the role of supporting, but also conduct current. Benefitting from the dense and uniform contact surface between the GDL and 3D bionic flow field structure, the membrane current density of the PEMFC can be maintained at a high level without causing heat accumulation. In short, the 3D bionic flow field can effectively improve the output performance, reduce the hot spots, and increase the service life of the PEM.
5. Conclusions
We developed a novel 3D bionic flow field inspired by mimicking the structures of small intestinal villi for PEMFCs. A numerical computation model was established to study the performance of the proposed 3D bionic flow field. The simulation results demonstrated that the 3D bionic flow field can effectively improve the gas distribution of the reactants due to its greatly increased vertical mass transfer. Meanwhile, it can effectively improve reactant gas supply to porous electrodes and facilitate water removal simultaneously. When the output voltage is 0.40 V and the average membrane current density is 2.06 A/cm2, the maximum difference of membrane current does not exceed 3.5%, and no hot spots are generated. According to the above-mentioned condition, the PEMFC with 3D bionic flow field can sustain strong electrochemical reactions with a high current density and uniform membrane current distribution.
The results obtained in this study provide an opportunity to develop a high-efficiency and durable PEMFC flow field structure. For future work, the 3D bionic flow field will be further optimized according to the problems encountered in the actual machining process. The PEMFC with 3D bionic flow field will be fabricated and used in actual experimental studies.
Author Contributions
Conceptualization, software validation, formal analysis, and original draft preparation were carried out by L.X.; methodology, supervision, and editing were carried out by Y.W., D.M. and J.L. All authors have read and agreed to the published version of the manuscript.
Funding
The project is supported by the National Natural Science Foundation of China (U1809220), Key Research and Development Program of Zhejiang Province (2020C04019).
Institutional Review Board Statement
Not applicable.
Informed Consent Statement
Not applicable.
Data Availability Statement
Not applicable.
Acknowledgments
The authors acknowledge the financial support from the National Natural Science Foundation of China (U1809220), Key Research and Development Program of Zhejiang Province (2020C04019).
Conflicts of Interest
The authors declare no conflict of interest.
References
- Zhang, G.B.; Jiao, K. Multi-phase models for water and thermal management of proton exchange membrane fuel cell: A review. J. Power Source 2018, 391, 120–133. [Google Scholar] [CrossRef]
- Manso, A.P.; Marzo, F.F.; Barranco, J.; Garikanoa, X.; Mujikaa, M.G. Influence of geometric parameters of the flow fields on the performance of a PEM fuel cell. A review. Int. J. Hydrog. Energy 2012, 37, 15256–15287. [Google Scholar] [CrossRef]
- Kotaka, T.; Tabuchi, Y.; Pasaogullari, U.; Wang, C.Y. Impact of interfacial water transport in PEMFCs on cell performance. Electrochim. Acta 2013, 146, 618–629. [Google Scholar] [CrossRef]
- Atyabi, S.A.; Afshari, E. Three-dimensional multiphase model of proton exchange membrane fuel cell with honeycomb flow field at the cathode side. J. Clean. Prod. 2019, 214, 738–748. [Google Scholar] [CrossRef]
- Kim, K.N.; Kim, B.M.; Jeon, D.H.; Nam, J.H. Numerical study of straight-parallel PEM fuel cells at automotive operation. Int. J. Hydrog. Energy 2012, 37, 9212–9227. [Google Scholar] [CrossRef]
- Yuan, L.; Jin, Z.; Yang, P.; Yang, Y.; Wang, D.; Chen, X. Numerical Analysis of the Influence of Different Flow Patterns on Power and Reactant Transmission in Tubular-Shaped PEMFC. Energies 2021, 14, 2127. [Google Scholar] [CrossRef]
- Liu, H.; Yang, W.; Tan, J.; An, Y.; Chen, L. Numerical analysis of parallel flow fields improved by micro-distributor in proton exchange membrane fuel cells. Energy Convers. Manag. 2018, 176, 99–109. [Google Scholar] [CrossRef]
- Moon, S.; Choi, K.; Kim, H. Numerical studies on the geometrical characterization of serpentine flow-field for efficient PEMFC. Int. J. Hydrog. Energy 2011, 36, 1613–1627. [Google Scholar]
- Guo, H.; Wang, M.; Liu, J.; Nie, Z.; Ye, F.; Ma, C. Temperature distribution on anodic surface of membrane electrode assembly in proton exchange membrane fuel cell with interdigitated flow bed. J. Power Source 2015, 273, 775–783. [Google Scholar] [CrossRef]
- Zhang, X.; Chen, S.; Xia, Z.; Zhang, X.; Liu, H. Performance enhancements of PEM fuel cells with narrower outlet channels in interdigitated flow field. Energy Procedia 2019, 158, 1412–1417. [Google Scholar] [CrossRef]
- Vazifeshenas, Y.; Sedighi, K.; Shakeri, M. Numerical investigation of a novel compound flow-field for PEMFC performance improvement. Int. J. Hydrog. Energy 2015, 40, 15032–15039. [Google Scholar] [CrossRef]
- Carsten, C.; Marc, S.; Florian, G. Numerical Investigation of PEMFC Short-Circuit Behaviour Using an Agglomerate Model Approach. Energies 2020, 13, 4108–4133. [Google Scholar]
- Tong, S.; Bachman, J.C.; Santamaria, A.; Park, J.W. Experimental investigation on a polymer electrolyte membrane fuel cell (PEMFC) parallel flow field design with external two-valve regulation on cathode channels. J. Power Source 2013, 242, 195–201. [Google Scholar] [CrossRef]
- Kuo, J.K. Evaluating the enhanced performance of a novel wave-like form gas flow channel in the PEMFC using the field synergy principle. J. Power Source 2006, 162, 1122–1129. [Google Scholar] [CrossRef]
- Jason, P.K.; Xia, W.; Joan, L. Investigation of bio-inspired flow channel designs for bipolar plates In Proton Exchange Membrane Fuel Cells. J. Power Source 2009, 188, 132–140. [Google Scholar]
- Chen, T.; Xiao, Y.; Chen, T. The impact on PEMFC of bionic flow field with a different branch. Energy Procedia 2012, 28, 134–139. [Google Scholar] [CrossRef] [Green Version]
- Ruan, H.; Chen, T. Fabrication of stainless steel PEMFC bipolar plate by soft punch stamping. In Proceedings of the International Conference on Material. Mechanical and Manufacturing Engineering 2015, Guangzhou, China, 27–28 June 2015; pp. 461–466. [Google Scholar]
- Konno, N.; Mizuno, S.; Nakaji, H.; Ishikawa, Y. Development of compact and high-performance fuel cell stack, SAE International. J. Altern. Powertrains 2015, 4, 123–129. [Google Scholar] [CrossRef]
- Peng, S.; Wu, H. A three-dimensional numerical investigation of trapezoid baffles effect on non-isothermal reactant transport and cell net power in a PEMFC. Appl. Energy 2015, 143, 81–95. [Google Scholar] [CrossRef]
- Park, J.E.; Lim, J.; Kim, S.; Choi, I.; Ahn, C.Y.; Hwang, W.; Lim, M.S.; Cho, Y.H.; Sung, Y.E. Enhancement of mass transport in fuel cells using three-dimensional graphene foam as flow field. Electrochim. Acta 2018, 265, 488–496. [Google Scholar] [CrossRef]
- Tseng, C.J.; Tsai, B.T.; Liu, Z.S.; Cheng, T.C.; Chang, W.C.; Lo, S.K. A PEM fuel cell with metal foam as flow distributor. Energy Convers. Manag. 2012, 62, 14–21. [Google Scholar] [CrossRef]
- Kim, J.; Luo, G.; Wang, C.Y. Modeling two-phase flow in three-dimensional complex flow-fields of proton exchange membrane fuel cells. J. Power Source 2017, 365, 419–429. [Google Scholar] [CrossRef]
- Chen, H.; Guo, H.; Ye, F.; Ma, C. Modification of the two-fluid model and experimental study of proton exchange membrane fuel cells with baffled flow channels. Energy Convers. Manag. 2019, 195, 972–988. [Google Scholar] [CrossRef]
- Chen, X.; Yu, Z.; Yang, C.; Jin, C.; Ding, Y.; Li, W.; Wan, Z. Performance investigation on a novel 3D wave flow channel design for PEMFC. Int. J. Hydrog. Energy 2021, 46, 11127–11139. [Google Scholar] [CrossRef]
- Nonobe, Y. Development of the fuel cell vehicle mirai. IEEJ Trans. Electr. Electron. Eng. 2017, 12, 5–9. [Google Scholar] [CrossRef] [Green Version]
- Bao, Z.; Niu, Z.; Jiao, K. Analysis of single- and two-phase flow characteristics of 3-D fine mesh flow field of proton exchange membrane fuel cells. J. Power Source 2019, 438, 226995–227005. [Google Scholar] [CrossRef]
- Skrzypek, T.; Piedra Valverde, J.L.; Skrzypek, H.; Kazimierczak, W.; Szymanczyk, S.; Pawlowska, M.; Zabielski, R. Intestinal villi structure during the development of pig and wild boar crossbreed neonates. Livest. Sci. 2007, 109, 38–41. [Google Scholar] [CrossRef]
- Mani, A.S.; Fortin, M. Finite element solution of compressible viscous flows using conservative variables. Comput. Methods Appl. Mech. Eng. 1994, 118, 319–350. [Google Scholar]
- Shen, J.; Zeng, L.P.; Liu, Z.C.; Liu, W. Performance investigation of PEMFC with rectangle blockages in Gas Channel based on field synergy principle. Heat Mass Transf. 2019, 55, 811–822. [Google Scholar] [CrossRef]


Publisher’s Note: MDPI stays neutral with regard to jurisdictional claims in published maps and institutional affiliations. |
© 2021 by the authors. Licensee MDPI, Basel, Switzerland. This article is an open access article distributed under the terms and conditions of the Creative Commons Attribution (CC BY) license (https://creativecommons.org/licenses/by/4.0/).