Review

Thermodynamics, Energy Dissipation, and Figures of Merit of Energy Storage Systems—A Critical Review

by
Efstathios E. Michaelides
Department of Engineering, Texas Christian University, Fort Worth, TX 76129, USA
Energies 2021, 14(19), 6121; https://doi.org/10.3390/en14196121
Submission received: 19 July 2021 / Revised: 17 September 2021 / Accepted: 22 September 2021 / Published: 26 September 2021
(This article belongs to the Section D: Energy Storage and Application)

Abstract

:
The path to the mitigation of global climate change and global carbon dioxide emissions avoidance leads to the large-scale substitution of fossil fuels for the generation of electricity with renewable energy sources. The transition to renewables necessitates the development of large-scale energy storage systems that will satisfy the hourly demand of the consumers. This paper offers an overview of the energy storage systems that are available to assist with the transition to renewable energy. The systems are classified as mechanical (PHS, CAES, flywheels, springs), electromagnetic (capacitors, electric and magnetic fields), electrochemical (batteries, including flow batteries), hydrogen and thermal energy storage systems. Emphasis is placed on the magnitude of energy storage each system is able to achieve, the thermodynamic characteristics, the particular applications the systems are suitable for, the pertinent figures of merit and the energy dissipation during the charging and discharging of the systems.

1. Introduction—The Need for Energy Storage

The rampant increase in carbon dioxide emissions in the atmosphere and the associated global climate change (GCC) have become the major environmental concerns of the 21st century [1]. It has become apparent to scientists that a drastic reduction in the global CO2 emissions as well as other greenhouse gases (GHGs) is necessary in order to avoid a global environmental catastrophe [2]. In the third decade of the 21st century, it appears that international conventions and agreements (in particular the Kigali Agreement of 2016) will achieve the curtailment of refrigerant fluids that significantly contribute to GCC [3,4]. On the contrary, the global CO2 emissions do not show any signs of reduction. Despite the pertinent (but non-binding) Paris Agreement of 2015, the global use of coal—the most potent source of global CO2 emissions—has increased by more than 2% annually in the non-OECD countries during the years 2017 and 2018 [5]. More alarmingly, despite the significant coal combustion curtailment and CO2 emission reductions in the countries of the Organization for Economic Cooperation and Development (OECD), the global CO2 emissions have been steadily increasing by a compound rate of 1.7% during the last two decades and it does not appear that this long-term rate will diminish, at least in the near future [6,7]. The future increase in CO2 emissions is corroborated by the fact that the most significant contributor to CO2 emissions, coal combustion for electricity generation, continues unabated in the non-OECD countries and will persist at least in the near future [8,9]. With such persistent trends in fossil fuel combustion, the global anthropogenic CO2 emissions in 2021 are expected to be approximately 35 billion tons and keep increasing, with the electricity generation industry being the largest emitter (approximately 43%), followed by the transportation sector and other industries.
Since the emissions from electric power plants account for the lion’s share of the global CO2 emissions, and since these emissions take place in stationary sources (all vehicles used in transportation are moving sources), it is reasonable for policy makers to first target the electricity power plants for any future regulations on the reduction in CO2 emissions. In order to limit the expected global temperature increase to a maximum of 2 °C by the end of the century, the Intergovernmental Panel on Climate Change (IPCC) recommends that the CO2 emissions from the electricity generation sector should be reduced by 90% or more from the 2010 levels between the years 2040 and 2070 [10]. The adoption of such lofty goals would completely transform the electricity generation industries by shifting the electricity generation from fossil fuels to renewable energy sources (RESs) and, perhaps, nuclear [11,12]. Solar and Aeolic (wind) energy are the most abundant RESs that will have to be tapped and significantly utilized in most countries, except the very few that have abundant and reliable hydroelectric and geothermal energy sources, such as Norway, Nepal, Iceland, Costa Rica and El Salvador [13]. Following the IPCC recommendations, in the future, wind turbines and photovoltaic (PV) cells are expected to generate most of the electric energy for an increasing global population, which is expected to reach 10 billion in 2040 [10].
Within the terrestrial environment (where the vast majority of energy processes take place), solar energy is periodically variable (the sun does not shine during the night on the Earth’s surface) and wind energy is intermittent (the velocity of the wind varies from zero on calm days to more than 50 m/s during severe storms). As a result, the wind and solar energy supply exhibits very large temporal and spatial fluctuations. On the other hand, the demand for electricity follows known seasonal and diurnal patterns that are independent of wind and solar energy supply. The conversion of the electricity generation sector to RESs will create supply-demand mismatches during several periods of time within the year. In some of these periods, the demand exceeds the supply and the difference must be provided either by fossil fuels (an undesirable consequence) or by other forms of energy that were stored in a previous time period. Similarly, on sunny and windy days when there is ample solar and Aeolic energy, the supply of energy would exceed the demand and the generated renewable energy should be stored, or otherwise will have to be dissipated/destroyed. Therefore, the utilization of energy storage (ES) becomes an essential element in a future where RESs supply a high fraction of the electric energy.
The supply-demand mismatch at the high penetration of solar-generated electricity is exemplified by the so-called duck curve, a term coined by scientists in the California Independent System Operator (CAISO) [14,15]. The duck curve results from a plot of the hourly electricity demand minus the renewable energy generation in a region where the PV-generated electricity is high.
Figure 1 illustrates the duck curve with reference to the hourly demand during a summer day in the city of San Antonio, Texas (data from [16]). The upper curve represents the hourly power demand in the region. The noteworthy increase in electricity demand during the afternoon hours signifies the contribution of air conditioning to the summer demand. The next three curves pertain to stipulated annual contributions of PV cells to the total electric energy during a year. For example, “20% from PV” implies that PV cells (installed either in buildings or in solar farms) supply 20% of the annually generated electric energy. As all of the energy from PV cells is generated during the day, the effect of this type of electricity generation appears only during the daylight hours, and especially during the morning hours when the solar irradiance is strong, but the air conditioning demand does not fully materialize. The last (horizontal) line shows the contribution of the nuclear power plants, approximately 1100 MW for this city. It is observed in Figure 1 that, as the market penetration of PVs increases and more electric energy is generated by PV cells, the electric power demand from the non-solar units significantly decreases. When the contribution of the solar units reaches and exceeds 20% of the annually generated electricity, the duck curve drops below the nuclear generation capacity. Given that the current group of nuclear reactors in the USA (and several other countries) generate power at a constant level and do not follow the electricity demand fluctuations, this implies that the excess energy during the morning hours (the area between the lower part of the duck curve and the nuclear capacity line) must be either dissipated in the electricity grid or otherwise stored.
A curve that is analogous, but not of the same shape as the duck curve, is created when the wind market penetration increases. Figure 2 shows the hourly power demand in ERCOT—the grid that supplies power to most of Texas—during a day in the spring, when the demand is not high and the wind in the region is strong, especially in the early hours of the morning and after dusk, (data from [17,18]). The nuclear generating capacity in the region is approximately 4950 MW and is represented by the horizontal blue line. It is observed that the non-wind power demand drops below the nuclear capacity and even below zero for most of the 24 h period, when the renewable wind units generate 50% of the total annual electric energy. These dips are due to a combination of the higher wind energy during the nighttime and the lower demand during the early morning hours. They signify high wind power generation that cannot be absorbed by the demand. The excess power (the dip below the nuclear supply level) must either be stored or otherwise dissipated in the grid and wasted. The shape of the curves in Figure 2 also points to the fact that the demand from the non-RES power plants may have several minima and maxima during a 24 h period. Given the high variability and uncertainty in the wind-generated electricity, any type of planning to meet the power demand of the consumers without sufficient storage will be highly probabilistic and laden with significant uncertainty.
The demand-supply mismatch, as illustrated in Figure 1 and Figure 2, will place considerable peaking and ramping regulation stress on electricity grids and conventional dispatchable generators. Several studies have been undertaken to explore its impact on the planning of the power systems in a future that includes significant power generation from RESs. A report by the National Renewable Energy Laboratory in the USA examined the accommodation of the potential overgeneration of power by PV units, the implied risk for the stability of electricity grids and the ways to “flatten or fatten” the duck curve [19]. Other general studies on the supply-demand mismatch focused on increasing the revenue potential of the industry using the excess power to produce hydrogen for fuel-cell vehicles [20]; on using the excess energy in electric boilers for heat, and pumped hydro systems (PHS) in parts of China [21]; on reducing the minimal load on conventional generators, load shifting and ES [22]; on supply energy management systems using utility-level storage that accommodates the excess power generation [23]; and on the probabilistic modeling of the supply-demand mismatch for a more flexible resource planning for the generation of electric power, including the retrofitting of coal power plants [24]. The latter study pointed out several shortcomings of the duck curve theory as it is used by some researchers, such as: (a) it only exhibits a single minimum and a single maximum; (b) studies on the duck curve are mostly deterministic, while the demand for electricity is highly probabilistic and is laden with high uncertainty; (c) the approach does not accurately account for the possible curtailment of renewable energy; and (d) the decision-making process based on a deterministic duck curve tends to highly favor and promote flexible energy sources.
The effects of the supply-demand mismatch may be mitigated using a combination of energy conservation methods, demand smoothing, and ES in all its forms including thermal storage [25,26]. Among the specific studies to promote and bring equilibrium to the electricity demand and supply are centrally controlled air conditioning and refrigeration loads after dusk, proposed in [27]; the use of tariffs and fluctuating electricity prices for consumers to store energy in batteries [28]; a combination of PV curtailment and battery usage that pertains to the electricity consumers in Switzerland [29]; the modification or retrofitting of coal power plants in China to follow the electricity demand in combination with demand modulation and battery storage capacity [30]; and the retrofitting of the fossil-fueled plants to enable them to reduce their output and somehow more closely follow the demand of the consumers [31]. The last approach will have higher impact and will be more attractive in countries with a high fraction of their electricity derived from coal such as China, India, Estonia and Australia. A careful examination of the investment and operational costs for all the demand-supply mitigation systems and processes makes it apparent that the final cost of electric energy to the consumers in a 90% renewable electricity market (as advocated by the IPCC [10]) would increase by a factor of two to three [32,33]. The significant cost of electricity to the consumers, because of the needed ES when an electricity grid transitions from fossil fuels to RESs, is recognized in all pertinent publications, including [34,35], with some publications advocating methods and systems that may lower this high cost [36,37].
Several review papers have been recently published on all aspects of ES. Among these, two general review articles concentrate on the technologies for grid electricity generation [38,39]; another general article focuses on the life-cycle costs and analyses of ES systems [40]. Other review articles focus on particular ES systems such as battery storage [41] and hydrogen storage [42,43], or on particular applications on the consumer side, such as communities and building clusters [44]. This review article aims at presenting the ES systems from a thermodynamic standpoint including their basic properties; figures of merit that pertain to thermodynamic properties and utilization; storage capacity; and energy dissipation associated with the storage-recovery (charging-discharging) energy conversions. Particular emphasis is placed on systems that are viable and able to significantly contribute to the transition of the electricity generation industry from fossil fuels to RESs. For reasons that are explained in the last section, this review will not deal with costs, pricing and other marketing and economics variables, which are currently laden with high uncertainty.

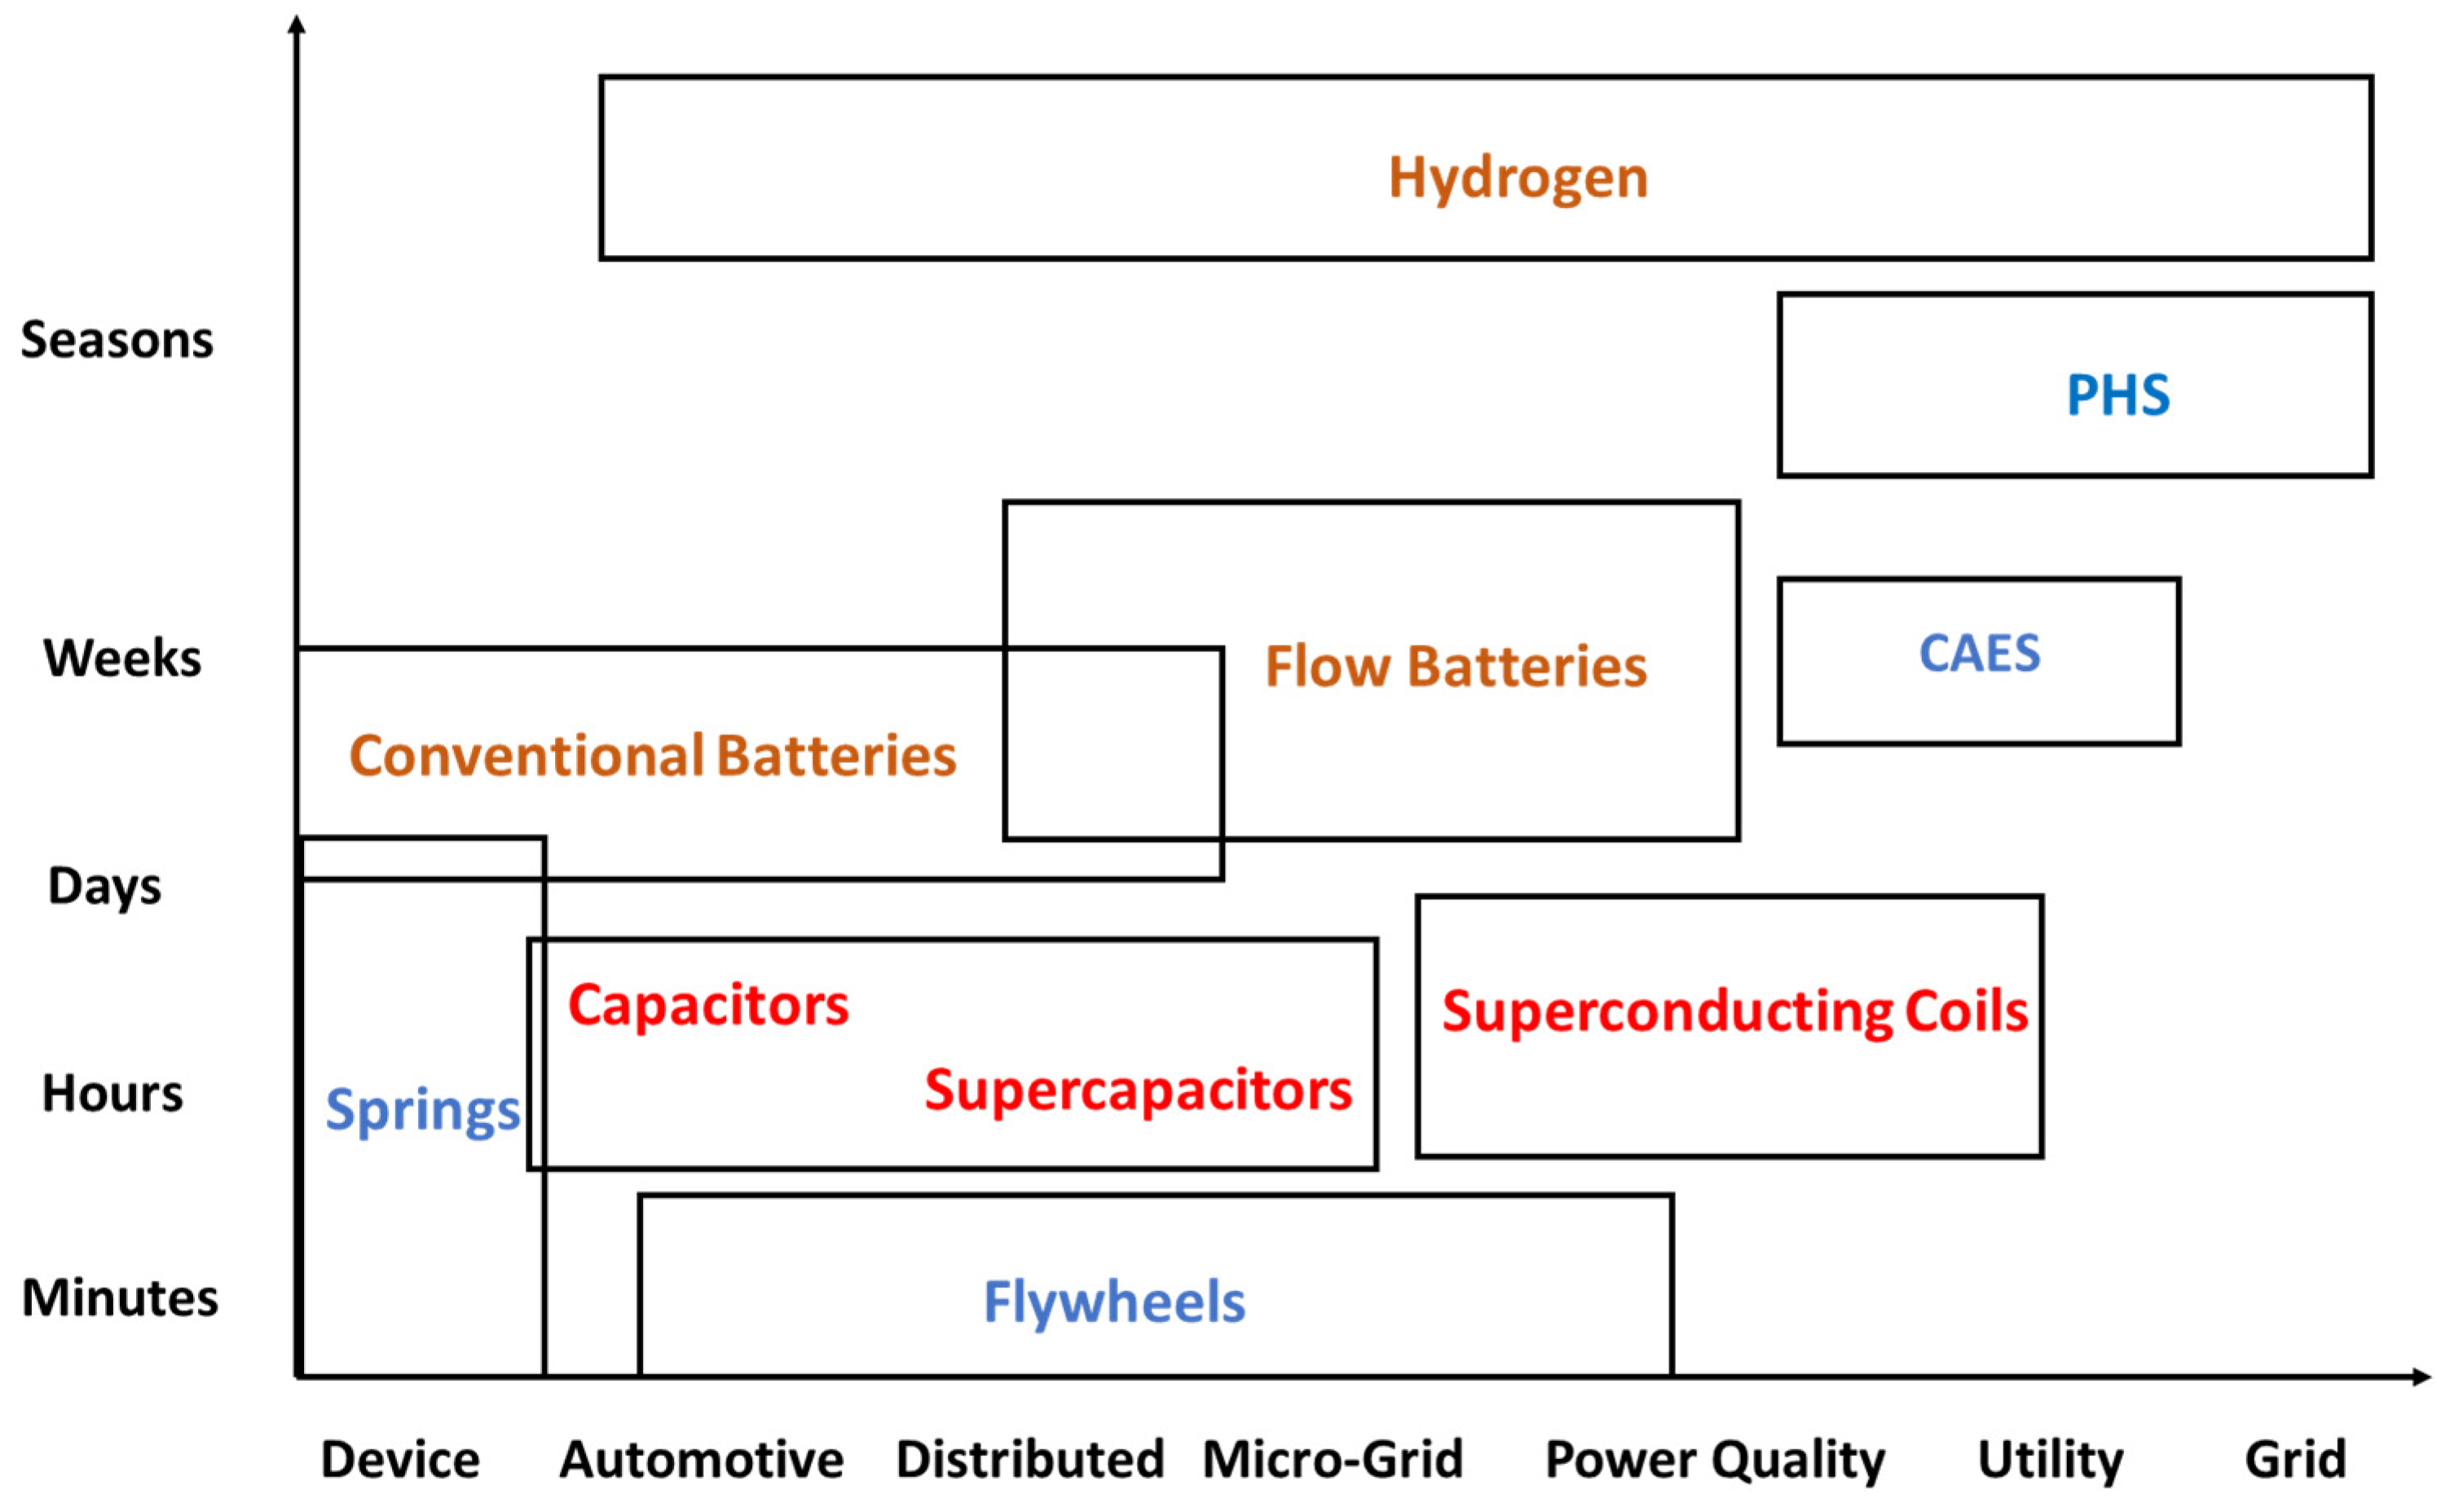
2. Classifications of Energy Storage Systems

From the beginning, it must be noted that work and the various forms of energy are not the same and that, in most cases, they are not even equivalent as the first law of thermodynamics dictates. Energy, in its various forms, may be stored in the mass of engineering systems to be used at will and ES materials have become the subject of immense technological interest. There are two ways for the classification of the ES systems [13,25].
1. 
Based on their final utilization, which is primarily determined by the quantity of energy stored and delivered. The following storage categories—from the highest to the lowest storage capacity—pertain to this classification.
  • Grid-level: Storage that may supply an entire grid or large parts of a grid. A grid normally needs very large storage capacity to be used when the RESs do not generate sufficient power.
  • Utility-level: Storage of an energy-generating corporation for sale at an optimum price, also of very large storage capacity. Due to the very high ES capacities, oftentimes, grid-level and utility-level systems are lumped as one category.
  • Power quality (electric load correction): This is also at the utility level but entails lower storage capacity and faster response times. The primary purpose of this type of storage is to ensure uninterrupted electricity supply, for example, when, due to temporary cloudiness, the power generation of PV drops for short time periods.
  • Microgrid: For the ES in a microgrid, which is composed of clusters of buildings or businesses, the storage is at the location of the consumers, who may optimize their storage systems and storage levels according to their energy demand. The microgrid systems have significantly lower capacity than utility-level storage systems.
  • Distributed storage: e.g., to supply energy to a single commercial or business establishment or a household. These systems are also of relatively lower capacity.
  • Automotive: This category includes the battery-operated vehicles, the fuel-cell vehicles and the hybrid vehicles. While the common automobile and marine batteries represent mature technologies, there is a great deal of research activity on the development of high-capacity and more efficient batteries for electric vehicles and hybrids.
  • Device or appliance storage: e.g., energy for the operation of a cell phone, a grandfather clock or a mechanical watch.
2
Based on the type of energy in the storage systems.
  • Mechanical: e.g., pumped hydro systems (PHSs), compressed air energy systems (CAESs), flywheels, springs, torsion bars, etc.
  • Chemical: Includes all types of batteries, hydrogen-based systems, biofuels and synthetic fuels.
  • Electrical/magnetic: e.g., capacitors, supercapacitors, superconducting coils, etc.
  • Thermal: includes molten salts, steam, chilled water (for air conditioning) and phase-change materials.
The operation and details of these systems appear in Section 4, Section 5, Section 6, Section 7 and Section 8.

3. Thermodynamic Properties and Figures of Merit

The figures of merit of the ES systems quantify their desirable attributes. Among these are: reliability; low energy losses during the storage-regeneration processes; low mass per unit energy stored; low volume per unit energy stored; longevity; low cost per unit energy stored or per unit power delivered, etc. The following are useful parameters for the various ES systems:
  • Efficiency or, more precisely, round-trip efficiency is the ratio of the energy output of the storage system to the energy input. The input and output energies must be of the same type of energy, e.g., electricity or thermal, and must be expressed in the same units. Oftentimes the round-trip efficiency is expressed as the product of the charging efficiency and the generating efficiency [13,45].
  • Specific energy is the energy stored per unit mass of the system. High specific energy is of importance in mobile systems (e.g., vehicles and aircraft) but insignificant for stationary systems, such as grid-level and utility-level systems (The specific energy (kJ/kg, or kWh/kg) appears in some publications as “energy density.” We follow here the international convention of thermodynamic properties and other quantities of interest, where per unit mass is defined as “specific” and per unit volume is defined as “density.”).
  • Energy density is the energy stored per unit volume of the system. It measures how large the size of the storage system is and is important in distributed storage and mobile applications.
  • Maximum depth of discharge is the fraction of energy stored that is practically usable. While most ES systems may discharge all of their energy, the manufacturers of batteries recommend that their equipment is not discharged below a certain state of charge, typically close to 20%. In such cases, the useful discharge capacity is 80% of the rated capacity of the system.
  • Self-discharge time is the time for a fully charged system to discharge to a defined depth of discharge, when it does not supply any useful energy. For example, the self-discharge time for flywheels to 20% of their depth of discharge is on the order of minutes; the self-discharge time of solid-state batteries is on the order of months; and the self-discharge time of PHS storage systems is almost infinite.
  • The cycle life is a number that indicates how many times the storage system may be charged and discharged, before its storage capacity and its round-trip efficiency deteriorate. At the end of the life cycle, the ES systems must be repaired, replaced or (in the case of batteries) regenerated.
The specific application for ES dictates which of these figures of merit (or group of several figures of merit) are pertinent, important and useful. For example, low specific energy is of importance to transportation applications, especially aerospace applications, but not so important in applications related to buildings. Energy density, round-trip efficiency and life cycle are more important in domestic applications. Vanishing self-discharge is of high importance in systems and applications for seasonal energy storage, such as storage of wind power during the winter to be used in the summer.

4. Mechanical Energy Storage Systems

4.1. Pumped Hydroelectric Systems (PHSs)

Figure 3 is a schematic diagram of a PHS. A base-load power plant (typically nuclear, in an era of decarbonization) provides the energy for the operation of the PHS. When the demand is low, the excess energy produced by the power plant is directed to a pumping station, with a motor-pump combined efficiency, denoted by ηP, that lifts and conveys water to a natural (if available at the desired elevation) or artificial lake at an elevation H [25,46]. The potential energy of the water is used for the generation of electric power when the demand exceeds the supply. During this operation, water is withdrawn from the lake and is conveyed in the same pipeline to a hydraulic turbine, with the turbine generator efficiency denoted by ηT, which produces the needed power [25]. For small-scale PHSs, it is possible to combine the pump and the hydraulic turbine in a single device—the pump-as-turbine system (PAT) that saves capital costs [47,48]. The types of turbines used for such systems are the Deriaz and Francis turbines. While this combination saves capital cost, it also results in decreased round-trip efficiencies.
The potential energy of the water in the artificial lake is:
E = m g H = V ρ g H
where V is the volume of the water in the lake, m is the mass of the water, ρ is the density of the water (approximately 1000 kg/m3) and H is the height difference. The electric power generated by the turbine is:
W ˙ = m ˙ η T g H
In principle, most hydroelectric power plants may also function as PHSs. A number of PHSs, exclusively used for ES, have been built around the globe with the largest one located in Bath County, Virginia, USA, a facility that has 3 GW generating capacity and is available for 10.3 h for a total storage capacity of approximately 31,000 MWh [49]. Some of the opportunities and barriers of the PHSs, including the use of PHSs for wastewater treatment, are discussed in [50].
Since the natural or artificial lake may be arbitrarily large and the volume of the stored water very high, the PHSs are able to generate very large amounts of electric power. For this reason, PHSs may be used for electricity demand management as well as frequency control/correction. A recent study points out that economically viable PHSs must be developed in locations where H is higher than 300 m [51], while the same study and another one point out the difficulties of finding such suitable locations for the placement of PHSs [51,52].
It is apparent in Equations (1) and (2) that the height difference, H, is a crucial parameter that determines the amount of stored energy and the generated power. Table 1 shows the specific energy and energy density of PHSs for three different heights. The last four lines of Table 1 include the effect of H on the mass flow rate of water required for the generation of 100 MW power, as well as the volume and mass of water withdrawn from the artificial lake during four hours of continuous operation. For the calculations of Table 1, the efficiency of the turbine generator system was assumed to be 82% and the losses of the water in the pipeline 5% of the transported energy.
It is apparent in Table 1 that the specific energy of the PHSs is very low regardless of the height difference (the specific energy of batteries is in the range 70–1500 kJ/kg, and that of octane is 44,300 kJ/kg), while the energy density of these systems is on the high side. A noteworthy observation is the very high amounts of volume and, especially, of mass required for the continuous generation of electric power. For reference, the water volume required for the generation of 100 MW for 4 h is equivalent to 229,000 Olympic-size swimming pools when H = 300 (an Olympic-size pool is rated at approximately 2500 m3 of water). This implies that the size of the natural or artificial lake must be extremely large for a PHS to generate grid- and utility-level amounts of power.
The energy dissipation in PHSs occurs in the following:
  • The pumping station due to the pump-motor efficiency.
  • The ascending trip as friction in the pipeline.
  • The descending trip as friction in the pipeline.
  • The turbine station due to the turbine generator efficiency.
  • Evaporation of water in the artificial lake.
Net water evaporation depends on the season, the prevailing weather during storage and any rainfall or atmospheric condensation that may replenish part of the lost water. The other parts that contribute to energy dissipation are quantifiable. For example, the pump-motor efficiency is the product of the efficiencies of the pump and the motor that runs it. Most medium and larger pumps have efficiencies in the range 75–92%. Large AC motors have efficiencies in the range 90–97% [53,54]. Thus, the efficiency of the pumping station, ηP, is in the range 67.5–90%. Similarly, the efficiency of large hydraulic turbines is in the range 93–95%, when the water flow rate is maintained at 80–95% of the design conditions but drops significantly when the flow rate is less than 80% of the design [55]. The efficiency of large electric generators is in the range 97–99% [56], and this implies that the combined efficiency of the turbo-generators, ηT, is in the high range 90–94%. It must be noted, however, that the turbine efficiency may drop significantly when the turbine operates in the off-design condition, as happens when the power of the generator is adjusted to meet the demand. The efficiency deterioration is due to boundary layer separation on the surface of the rotating blades, which creates highly complex flow patterns including recirculation [57].
The energy dissipation by friction in the ascending and descending path depends on the length, type and diameter of the pipeline. For long pipelines, the friction losses determine the pressure loss and the dissipated power [58]:
W ˙ f r = = π 8 D 2 ρ V a v 3 ( f L D + K m l )
where D is the pipe diameter, Vav is the average velocity on the pipeline, L is the length of the pipeline, f is the friction factor and Kml is the minor losses factor pertinent to pipeline fittings, such as elbows, valves, etc. Large diameter pipes (OD 42″ to 96″) made of concrete are typically used for transportation in PHSs. Since the friction losses are proportional to the cube of the average velocity, the latter is kept low, in the range 2–3 m/s. In this velocity range, and because of the relatively low viscosity of water, the flow is always in the turbulent regime.
Calculations are performed for pipelines that would transport the 23.8 m3/s of water required for the operation of the 100 MW unit with H = 500 m, as shown in Table 1. Four types of pipes (OD = 36″, OD = 48″, OD = 72″ and OD = 96″) were chosen and the average velocity was stipulated to be less than 5 m/s in order to avoid excess friction losses. Table 2 gives the dimensions, number of required pipelines (in parallel) velocity and frictional pressure losses per km of pipelines that would transport 23.8 m3/s of water, which in Table 1 are needed for the operation of a 100 MW unit. The last column in Table 2 is the cumulative efficiency of the water transport if the length of the pipeline is 5 km. The size and friction data were obtained from [59] and [60].
It becomes apparent from Table 2 that energy dissipation in the water-carrying pipelines is very high, especially when the pipe diameter is small, and the distance is relatively long. It is worth noting that friction losses occur twice, during the ascent and during the descent of the water. This accentuates the importance of the location of the PHS—a location where the power unit and the water reservoir (natural or artificial lake) may be constructed at short distances. The high energy dissipation during long-distance water transportation also precludes the (sometimes advocated in the popular press) notion that arbitrarily located PHSs may be used to assist in fossil fuel substitution with RESs in large cities, e.g., using a PHS that would service the cities of New York and Boston by storing energy in the highlands of Quebec, Canada.
Assuming that the uncontrolled evaporation/condensation process for the water in the lake does not have a significant effect, the round-trip efficiency of PHSs is defined as:
η r t = η P η t r 1 η t r 2 η T
Based on the efficiency ranges for the pumping and generation stations above and stipulating an efficiency of 95% for each leg of transportation, the round-trip efficiency of well-designed PHSs is in the range 55–75%. The roundtrip efficiency of PHSs will be significantly lower when the systems operate in non-optimum conditions, when a PAT system is used and when the water transportation distance is longer than 5 km. Therefore, one may conclude that the energy dissipation in PHSs is significant and will be between one-half and one-quarter of the energy spent for the storage process and that the energy dissipation will be substantially more if the system operates in off-design conditions.

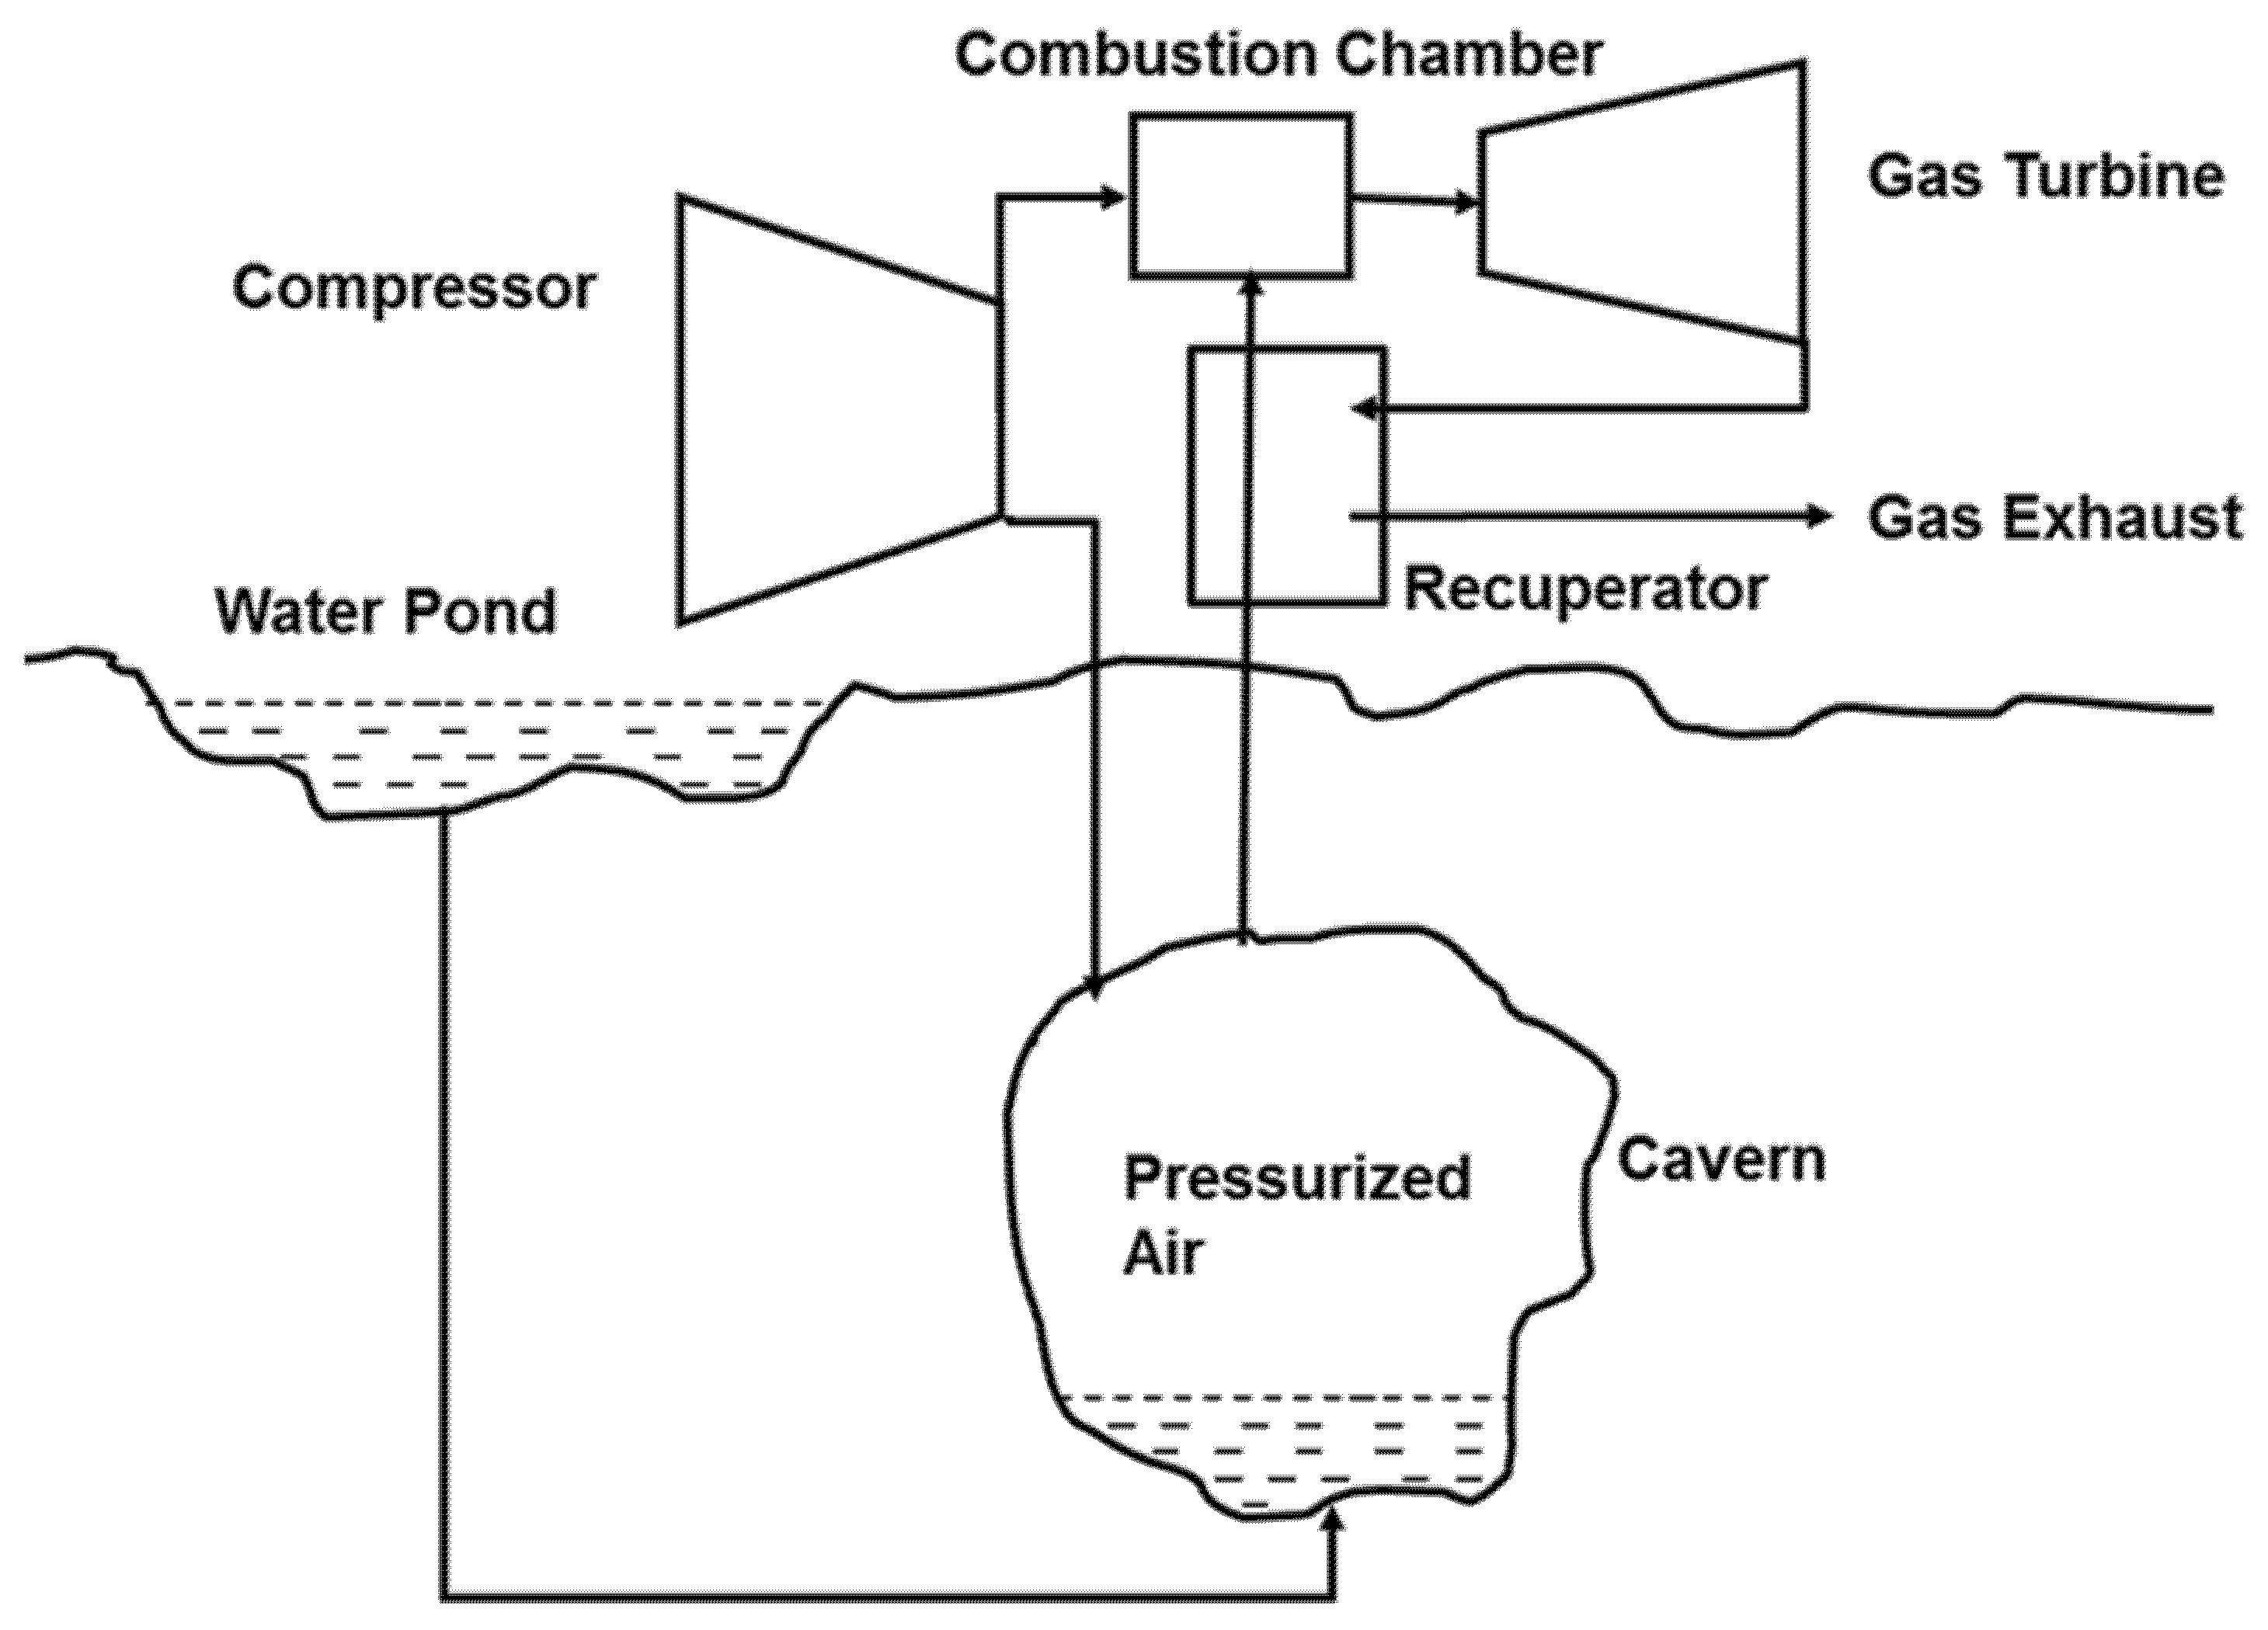
4.2. Compressed Air Energy Systems (CAESs)

Energy in CAESs is stored in compressed air and the entire system operates in conjunction with a Brayton cycle power plant, as depicted in the schematic diagram of Figure 4. The diagram includes an optional water pond that maintains constant pressure in the system as the air is added and withdrawn. Under normal operating conditions, the compressor of the Brayton cycle is driven by the turbine and compresses air to moderate pressures (10–40 bar). The air is directed to the combustion chamber, where its temperature is increased (typically to 1700–2200 K) by burning some type of fossil fuel. The high-temperature gas is directed to the gas turbine, which generates electric power. At normal operation, the gas turbine supplies a high fraction of the power it generates (35–45%) to the compressor, thus generating only 55–65% of its rated power as electric power.
The function of the CAES is to store compressed air, so that all the rated power of the turbine will be directed to the generator. When there is low power demand in the grid, the gas turbine supplies just enough power to drive the compressor. In this mode of operation, the function of the compressor is to pressurize and store the air in a large enclosure, typically an underground salt cavern. During high power-demand hours, the pressurized air passes through a heat recuperator; then, it is fed to the combustion chamber, where the natural burner increases the temperature of the pressurized air to temperatures up to 2200 K with a corresponding increase in the air enthalpy, Finally, the high-temperature high-pressure air enters the gas turbine to generate electric power. Since the cycle does not need power for the compression of air, all the generated power by the gas turbine is directed to the grid.
Several modifications/variations of this typical CAES have been proposed, including the following:
  • Adding the water column, as it is drawn in Figure 4, to maintain a constant pressure.
  • Feeding the compressed air directly to a high-pressure turbine without further heating in the combustion chamber.
  • Heat from the hot air at the end of the compression process is stored in another well-insulated medium to heat up the pressurized air before it is directed to the turbine. This is sometimes called an advanced adiabatic CAES (AA-CAES) [61]. Such systems have the advantage of being used in large (utility-scale) as well as smaller (microgrid-scale) versions with the heat stored as sensible or latent heat [62,63,64].
The generating capacity of a CAES is determined by the volume of the cavern where the air is stored, with large caverns being capable of storing very large quantities of energy. For this reason, CAES units with large caverns are considered utility-level storage facilities, similar to the PHS units. However, suitable large caverns are difficult to find and insulate in most parts of the globe. An extensive study in Denmark concluded that this country may not rely on CAESs for the higher penetration of RESs in electricity generation because the storage size required is technically unfeasible [65]; that any reasonably expected future electricity prices in the country will not justify investments in CAESs [66]; and that optimum-pricing strategies cannot be achieved with CAES operations, largely because the spot market prices are unknown [67]. However, a couple of other analytical studies for the USA market concluded that, when the reserve revenue becomes available, in addition to the energy arbitrage revenue, then it may be possible to support CAES investment in a few electricity markets [68,69].
The main reason for the uncertainty in the commercial success of CAES technology and its wider application is that currently (2021) there are only two large-scale CAES units in operation [49] and both of them were built with significant governmental incentives. The first one is in Huntorf, Germany. It was built in 1979, utilizes nuclear-generated electricity and has a 290 MW capacity (Because CAES systems utilize the energy in the fuel of the Brayton cycle, the end power of the gas turbine (in MW) is a better indicator for their generating capacity, rather than the storage capacity (in MWh) of the compressed air.). The second is in McIntosh, Alabama, and was built in 1991. This unit stores compressed air in a solution-mined salt cavern and is rated at 110 MW for about 26 h. Other pilot-size and experimental CAES facilities are in west Texas (2 MW), Seabrook, New Hampshire (1.5 MW), Toronto, Canada (1 MW and 0.66 MW), the University of Birmingham, England (0.35 MW operating with liquid air) and the Pollegio-Loderio (AA-CAES of 0.5 MW), which is located in an unused tunnel of 120 m in length under the Swiss Alps [49,70].
In the more efficient CAESs, the compressed air is heated to a high temperature in the combustion chamber of a Brayton cycle before it is fed to the gas turbine. Due to this, CAESs are not independent ES systems and the power generated depends, to a large extent, on the temperature attained at the end of the combustion process, which occurs with the consumption of the exergy of the fuel. Calculations were performed to determine the exergetic efficiency of the first process in this ES system, that of compressing air from the ambient conditions (300 K and 1 bar) to pressures of 60 and 80 bar. Air compression is achieved in a two-stage compressor system with an intercooler [71] and the properties of air were obtained from [72]. Each compressor has 82% overall isentropic efficiency and the air at the exit of the intercooler is at 305 K (5 K above the ambient). Table 3 shows the results of the computations.
It is observed in Table 3 that the energy density of CAESs is of the same order of magnitude to that of the PHSs, but the specific energy of CAESs is significantly higher (because air is a compressible substance). The exergetic efficiency of the compression and storage process is in the range 50–60%.
The combustion dependence of the generated power introduces another parameter in the calculations of the round trip of CAES, that of turbine inlet temperature. The round-trip efficiency of the CAES was calculated for the last case of storage in Table 3 (500 K and 80 bar), when the compressed air is fed to a natural gas combustor with 100% efficiency and the hotter combustion products drive a turbine generator system with 85% efficiency. The results are shown in Figure 5, where it is observed that the round-trip efficiency of the storage process increases significantly with the upper temperature of the system. However, it is also observed that the range of the round-trip efficiency is 46–63% for all the practical gas turbine inlet temperatures. Hence, the energy dissipation in CAESs is significant and may be close to half of the energy spent for the storage process.

4.3. Flywheels

Flywheels have been extensively used in the past with reciprocating engines, attached to the crankshaft. They have also been used with subway cars in urban transportation systems—to store energy during the braking process and release it during the acceleration process. Such applications store relatively small quantities of energy and release this energy after short time periods, on the order of minutes. Flywheels used for electric power generation are enclosed in a protective shield and oftentimes operate in vacuum to reduce the aerodynamic, frictional loss of energy. The latest models of flywheels operate with magnetically levitated bearings (including superconducting technologies) to minimize friction and, also, to extend the life cycle of the device [73]. A single piece of equipment, coupled to the flywheel, serves as a motor when energy is stored, as well as a generator, when energy is re-generated [74,75].
The energy stored in a flywheel is rotational energy:
E = I ω 2 2 = 2 I π 2 n 2
where I is the moment of inertia of the flywheel; ω is the angular velocity; and n is the number of revolutions per second (ω = 2πn). It is apparent that the stored energy primarily depends on the angular velocity of the flywheels. For this reason, flywheels are classified as lower speed (up to 6000 revolutions per minute, or n=100 rev/s) and high speed (up to 60,000 rpm, or n = 1000 rev/s) [73].
If a high fraction of the mass of the flywheel is at the metal rim, then I = mR2 and the energy stored in the flywheel may be approximated by the equation:
E = 2 π 2 m R 2 n 2
If a flywheel is a cylinder with its mass uniformly distributed, then I = 1/2 mR2 and the energy stored becomes:
E = π 2 m R 2 n 2
where R is the external radius of the flywheel/cylinder [25]. Accordingly, a solid metal cylinder flywheel weighing 2 tons (2000 kg) and rotating at 30 revolutions per second would store approximately 5 kWh. The largest known flywheel system is a pair of cylindrical flywheels located at the Culham Fusion Center in England. The two flywheels are used to supply high pulsing power for a fusion reactor and each one is capable of storing 8600 MJ (2389 kWh) and delivering electric power up to 400 MW for approximately 30 s [39,76].
A glance at the capacity of flywheels to store energy proves that, because of mass and angular speed limitations, they cannot store as much energy as the PHSs and CAESs. Therefore, flywheels are not considered grid-level and utility-level storage systems. In addition, friction in the bearings and wind resistance—this is always present even if the flywheels operate in a relative vacuum—continuously reduce the stored energy. If flywheels continue rotating for long periods of time (on the order of hours), their entire energy would be dissipated. For this reason, they are considered fast-responding, short-term ES systems that may supply, in a short time, intermediate amounts of energy. Their most common applications are to facilitate the transition between sources of power and for frequency regulation [77,78]. Due to their fast response time, flywheels have also been proposed as ES devices (instead of batteries) in datacenters that need uninterrupted power supply [79].

4.4. Springs and Torsion Bars

Springs and torsion bars have the capacity to store significantly less energy than flywheels. The stored energy in springs and bars is on the order of kJ and not of kWh (1 kWh is equal to 3600 kJ) [13,25]. For this reason, they are not good candidates for the storage of significant amounts of energy that would provide electric power. These mechanical devices may store mechanical energy for long periods of time and are typically used in highly specialized, very low-energy applications, such as mechanical clocks, retro-fashion wrist watches and weight-balancing equipment.

5. Electrical and Magnetic Energy Storage

5.1. Capacitors and Superacapacitors

Common electric capacitors consist of two metal surfaces (plates or concentric cylinders) separated by a dielectric, non-conducting material. Electric ES in capacitors has been used for several decades to facilitate the starting of electric motors, when high torsion and excess energy are required for very short periods of time. The energy stored in a common electric capacitor is given by the expression:
E = 1 2 C V 2
where C is the capacitance, a property of the dielectric material, which depends greatly on the size of the capacitor, and V is the applied voltage. The capacitance increases monotonically with the distance between the plates or concentric cylinders. Since the latter have fixed surface areas, the capacitance becomes a monotonic function of the volume/size of the capacitor and this limits the energy density a common capacitor may achieve. A glance at the available dielectric materials and the voltage they may sustain proves that the energy stored in capacitors is on the order of kJ. While this amount of energy is sufficient for the smooth starting of motors, it is not suitable for ES, even at the household level.
Supercapacitors, which are also referred to as ultracapacitors, were developed in the first decade of the 21st century. Their operation is based on the electrochemical double electric layer that is formed in electrolytic solutions [80]. Since the double layers may be very thin, on the order of 10 nm, a suitable choice of the materials and geometry allows the packing of very large surface areas into very small volumes.
Supercapacitor cells have two electrodes, typically made of porous carbon or other well-conducting materials with a large surface area, and an aqueous or organic electrolytic solution, which is divided by a porous separator. During the charging process, the ions in the electrolyte separate and move towards the electrodes of opposite polarity, thus storing high energy in the thin double layers that form in the vicinity of the electrodes [46]. The very small spacing between the charged layers not only allows close packing, but also increases the capacitance per unit area of the aqueous solution.
The very small size/distance of the double layers allows the creation of a plethora of such layers within the volume of the supercapacitors and produces extremely high bulk material capacitances, C, in the range 350–2700 F [81] as well as the capacitance per unit area. As a result, supercapacitors may store significantly larger amounts of energy than conventional capacitors [82,83]. One of the disadvantages of supercapacitors is that the voltage across a double layer in the electrolyte cannot exceed a few volts—it is limited to 1 V for aqueous electrolytes and 3–4 V for organic electrolytes. This imposes a strong limitation on the amount of energy a single supercapacitor cell may store [25,81]. However, supercapacitors have very low internal resistance, and this allows the development of commercial devices that are made in modules of several single cells connected in series or in a series/parallel combination. These modules have high storage capacity and may generate voltages in the range 200–400 V [39].
The main advantage of capacitors and supercapacitors is that they may be charged and discharged in milliseconds. As a result, they will deliver very high power for short durations. While the specific energy and energy density of common capacitors is low, those of supercapacitors can be very high, because of the tightly packed double layers between the electrodes. Researchers using graphene-based electrodes developed supercapacitors with specific energy 206 Wh/kg (741.6 kJ/kg) and energy density close to 60 Wh/L (60 kWh/m3 or 215.1 MJ/m3). This type of supercapacitor delivers specific power of 496 W/kg and power density of 9800 kW/m3 [84]. Similar claims were made for other graphene-based nanomaterial devices [85,86]. Recent research accomplishments in nanotechnology (especially in carbon nanotubes and graphene sheets) and nanofluids have resulted in the manufacturing of very small supercapacitors—with double layers separated by mere nanometers—that may store energy on the order of several kJ [87,88].
Supercapacitors charge and discharge at very high efficiencies. Their round-trip efficiencies are in the range 85–98%. In addition, they are very durable, having life cycles on the order of 100,000 cycles [39,40,88]. However, the present generation of supercapacitors exhibits current drift, similar to that of certain types of batteries (see Section 6.7). As a result, part of the energy stored in supercapacitors is gradually lost, and this makes the devices suitable for only short-duration ES applications, on the order of minutes and unsuitable for long-term energy storage.

5.2. Electric and Magnetic Coils—Superconductors

The energy stored in an electric coil (solenoid) is given by the equation [25]:
E = 1 2 L I 2
where I is the current flowing in the coil and L is the inductance of the coil. The inductance is proportional to the square of the radius of the coil, r2, and to the square of the number of turns of the coil, N2 (L~r2N2), for cylindrical coils and proportional to the radius (L~rN2) for flat spiral coils. As long as the current flows in the coil, the energy is preserved, but when the current decreases or stops, the stored energy follows accordingly. All the usual metal conductors have finite resistance, R, and this leads to continuous power dissipation, I2R, which would eventually consume all the stored energy. For this reason, conventional coils are not considered suitable media for ES.
Superconducting materials have almost vanishing resistance (R→0), extremely low ohmic energy losses, allow the development of electric current fluxes on the order of 108 A/m2 and electric currents on the order of 10,000 A. These characteristics have ushered the development of superconducting magnetic ES (SMES). With typical inductance values of 500 H, a superconducting coil has 2.5 × 10¹⁰ J storage capacity or approximately 7000 kWh, a significant amount of stored energy. The SMES coils may be charged and discharged within very short times, i.e., milliseconds, so they are able to deliver extremely large amounts of power in a well-controlled process. The energy dissipation during magnetization and demagnetization of the coil is very low, resulting in round-trip efficiencies in the range 90–97% [39,40,89]. However, most of the materials become superconductors at very low (cryogenic) temperatures. Even the very low power dissipation would raise the temperature of the materials—and may transition them from superconductors to highly dissipating conductors—if heat is not promptly removed, a process that is accomplished by immersing the superconducting coil in a cryogenic fluid, typically liquid helium or nitrogen. SMES coils are currently used for ES at short timescales—on the order of seconds or minutes—and this makes SMES technology suitable only for power-quality applications.
Significant progress has been made in the early 21st century with the development of materials—typically metal oxides and metal or non-metal hydrides at very high pressures [90,91]—that superconduct at relatively high temperatures. Recent research determined that carbonaceous sulfur hydride at high pressure (approximately 220 GPa) superconducts at ambient temperatures [92]. The development of functional superconducting materials at ambient temperatures has removed an earlier obstacle, to operate only at very low (almost cryogenic) temperatures [93], but introduced a new constraint, that of the very high pressures.
A superconducting material that would operate at moderate pressure and at temperatures higher than the ambient would be ideal for future SMES applications, because all the dissipated energy would be transferred to the environment. This would enable ES in superconducting coils for longer periods of time. The significant advances in superconducting materials since the 1990s offer the hope that, in the future, the very efficient superconducting coils will be able to store energy for hours or days and will be used in microgrid- or even utility-level ES.

6. Electrochemical Energy Storage

Most of the energy we currently use for electricity generation and propulsion emanates from the chemicals of fossil fuels. Coal, oil and natural gas are composed of chemicals that were formed millions of years ago and their energy has been stored since their formation. Chemical energy has very high specific energy and energy density and is easily converted to thermal or electrical energy. These characteristics make chemical storage a very desired mode of ES.
The thermal energy (heat) released during the combustion of a chemical compound is equal to the enthalpy of combustion, Ho, while the maximum amount of electrical energy that may be obtained (in direct energy conversion devices) is equal to the Gibbs free energy, −∆Go. For most solid and liquid chemicals, the difference between the two is less than 2% and, hence, it is often stipulated that Ho ≈ −Go [71]. The maximum voltage (electromotive force) that may be obtained from a chemical reaction occurs during a reversible process and is given by the expression:
Δ G o = ζ F V m a x V m a x = Δ G o ζ F
where F is Faraday’s constant, 96,000,000 Cb/kmol, and ζ is the valence number of the reaction—the number of electrons transferred per reacting atom. In the Zn–Cu reaction, which is the principal reaction of the Daniel cell, ΔGo = 212,500 kJ/kmol and ζ = 2. Hence, the maximum voltage the Daniel cell may generate is approximately 1.1 V. This low voltage is a typical value for most electrochemical cells, and, for this reason, several electrochemical cells are connected in series in a battery to develop voltages in the range 10–20 V, which is recommended for most applications. In practice, internal irreversibilities connected to the passage of ions in the electrolyte and external irreversibilities related to the flowing current reduce the voltage which is actually available from a cell by 5–20% of its maximum value [13].
Batteries are much smaller than PHSs and CAESs and, in general, hold significantly less energy than these utility-level storage systems. Very large banks of batteries may be used for such large-scale storage, but their costs will be by far greater than those of PHSs and CAESs. However, batteries are very convenient to use, they have significantly lower dissipation rates and have higher round-trip efficiencies. Given their importance in modern applications such as laptop computers, cell phones, electric vehicles of all types, instrumentation, communications and other electronics, several types of batteries have been developed and marketed in the first two decades of the 21st century. The following subsections describe some of the commonly used types of batteries, starting with five categories of rechargeable batteries. It must be emphasized that this is not a review on batteries and battery types and that a great deal more information may be found in specific and dedicated reviews that are cited below.

6.1. Lead–Acid Batteries

This is one of the most common types of batteries, used for the starting of automobiles and all marine applications. The electrochemical energy conversion is based on the following overall reaction in the cells:
P b + P b O 2 + 2 H 2 S O 4 2 P b S O 4 + 2 H 2 O
The lead–acid batteries are products of a mature technology that originated in the mid-19th century and are widely used in automobile and marine (deep-cycle) applications. Each cell of a lead–acid battery generates approximately 2 V, according to Equation (10), and this implies that six cells can be combined in series to produce the 12 V required by most automobile and marine diesel starters [25].
Lead and its compounds are very dense materials, and this makes the typical lead–acid batteries heavy. Commercial lead–acid batteries may be discharged down to 20% of their capacity, thus offering approximately 0.35 kWh of electricity storage. These batteries typically weigh approximately 18 kg and—with their wiring and “breathing space”—occupy a volume of 10 L. This implies that typical lead–acid batteries have relatively low specific energy (~0.02 kWh/kg, 72 kJ/kg) but relatively high energy density (35 kWh/m3). Recent research with lead-acid batteries adopted lead-carbon electrodes, which extend the amount of ES and the durability of the batteries [94,95]. Another design modification has produced the so-called “ultra-battery,” which uses a split design for the negative electrode and combines an asymmetric supercapacitor and a lead-acid cell in one unit. The addition of the supercapacitor functions as a buffer in charging and discharging and enhances the power and lifespan of the lead-acid cell [96,97].
As lead–acid batteries are inexpensive and their technology is well known, systems of multiple deep-cycle lead-acid (DCLA) batteries that provide steady current over long periods of time have been developed to be used in the power industry. Banks of DCLA batteries may provide up to 1 MW of power, which makes them suitable for microgrid ES applications and peak shifting with PV systems [39,98].

6.2. Nickel-Based Batteries

This family of batteries includes, among other types, nickel-cadmium (NiCd), nickel metal hydrates, nickel hydroxide and several of their modifications and derivatives. The nickel-based battery technology is relatively mature without a large environmental footprint [99], the batteries have long life cycles, relatively high specific energy in the range 0.05–0.075 kWh/kg and relatively high energy density in the range 170–420 kWh/m3 [39,97,98]. Their superior performance at elevated temperatures and harsh environmental conditions makes them suitable for PV applications. However, and because of their high rates of self-discharge, they are not recommended for long-term microgrid- or grid-level ES and management systems [98,100,101].

6.3. Sodium-Based Batteries

Two commercially available members of this battery family are sodium–sulfur (NaS) and sodium/metal chloride—with NaNiCl and NaAlCl being the most common batteries in the latter category. Both types of batteries are high-temperature systems operating close to 350 °C, where the sodium is in the liquid state. The NaS cells develop voltage in the range 1.75–2.08 V depending on their state of charge; they have relatively low specific energy (0.15–0.24 kWh/kg) compensated by significant specific power (0.15–0.24 kW/kg); they have very high ES capacity—close to 245 MWh—and significantly high round-trip efficiency, in the range 75–90% [39,102]. The NaS batteries represent a mature technology and have been used since the 1960s in the electric power industry for load leveling and power quality [98]. Due to their high temperatures and because molten sodium is corrosive, these batteries only come in large, stationary systems for microgrid and partial grid storage applications with relatively low power generators, such as wind turbines [103,104]. Ongoing research with NaS batteries includes lower temperature operation and safety factors [105].
The characteristics of the NaNiCl and NaAlCl batteries, which are also known as zero-emission battery research activities (ZEBRA) batteries, are similar to those of NaS batteries [106]. They also operate at high temperatures where the sodium is liquid, and their voltage is slightly higher at 2.58 V. One of the advantages of the NaNiCl cells is that they develop very low internal resistance when a fault occurs in the cell. As a result, any failure of a cell, when connected in series with others, does not cause the failure of the entire system. This and the relatively high energy density make them suitable for automotive as well as renewable energy applications at the distributed storage (household) level [39,107].

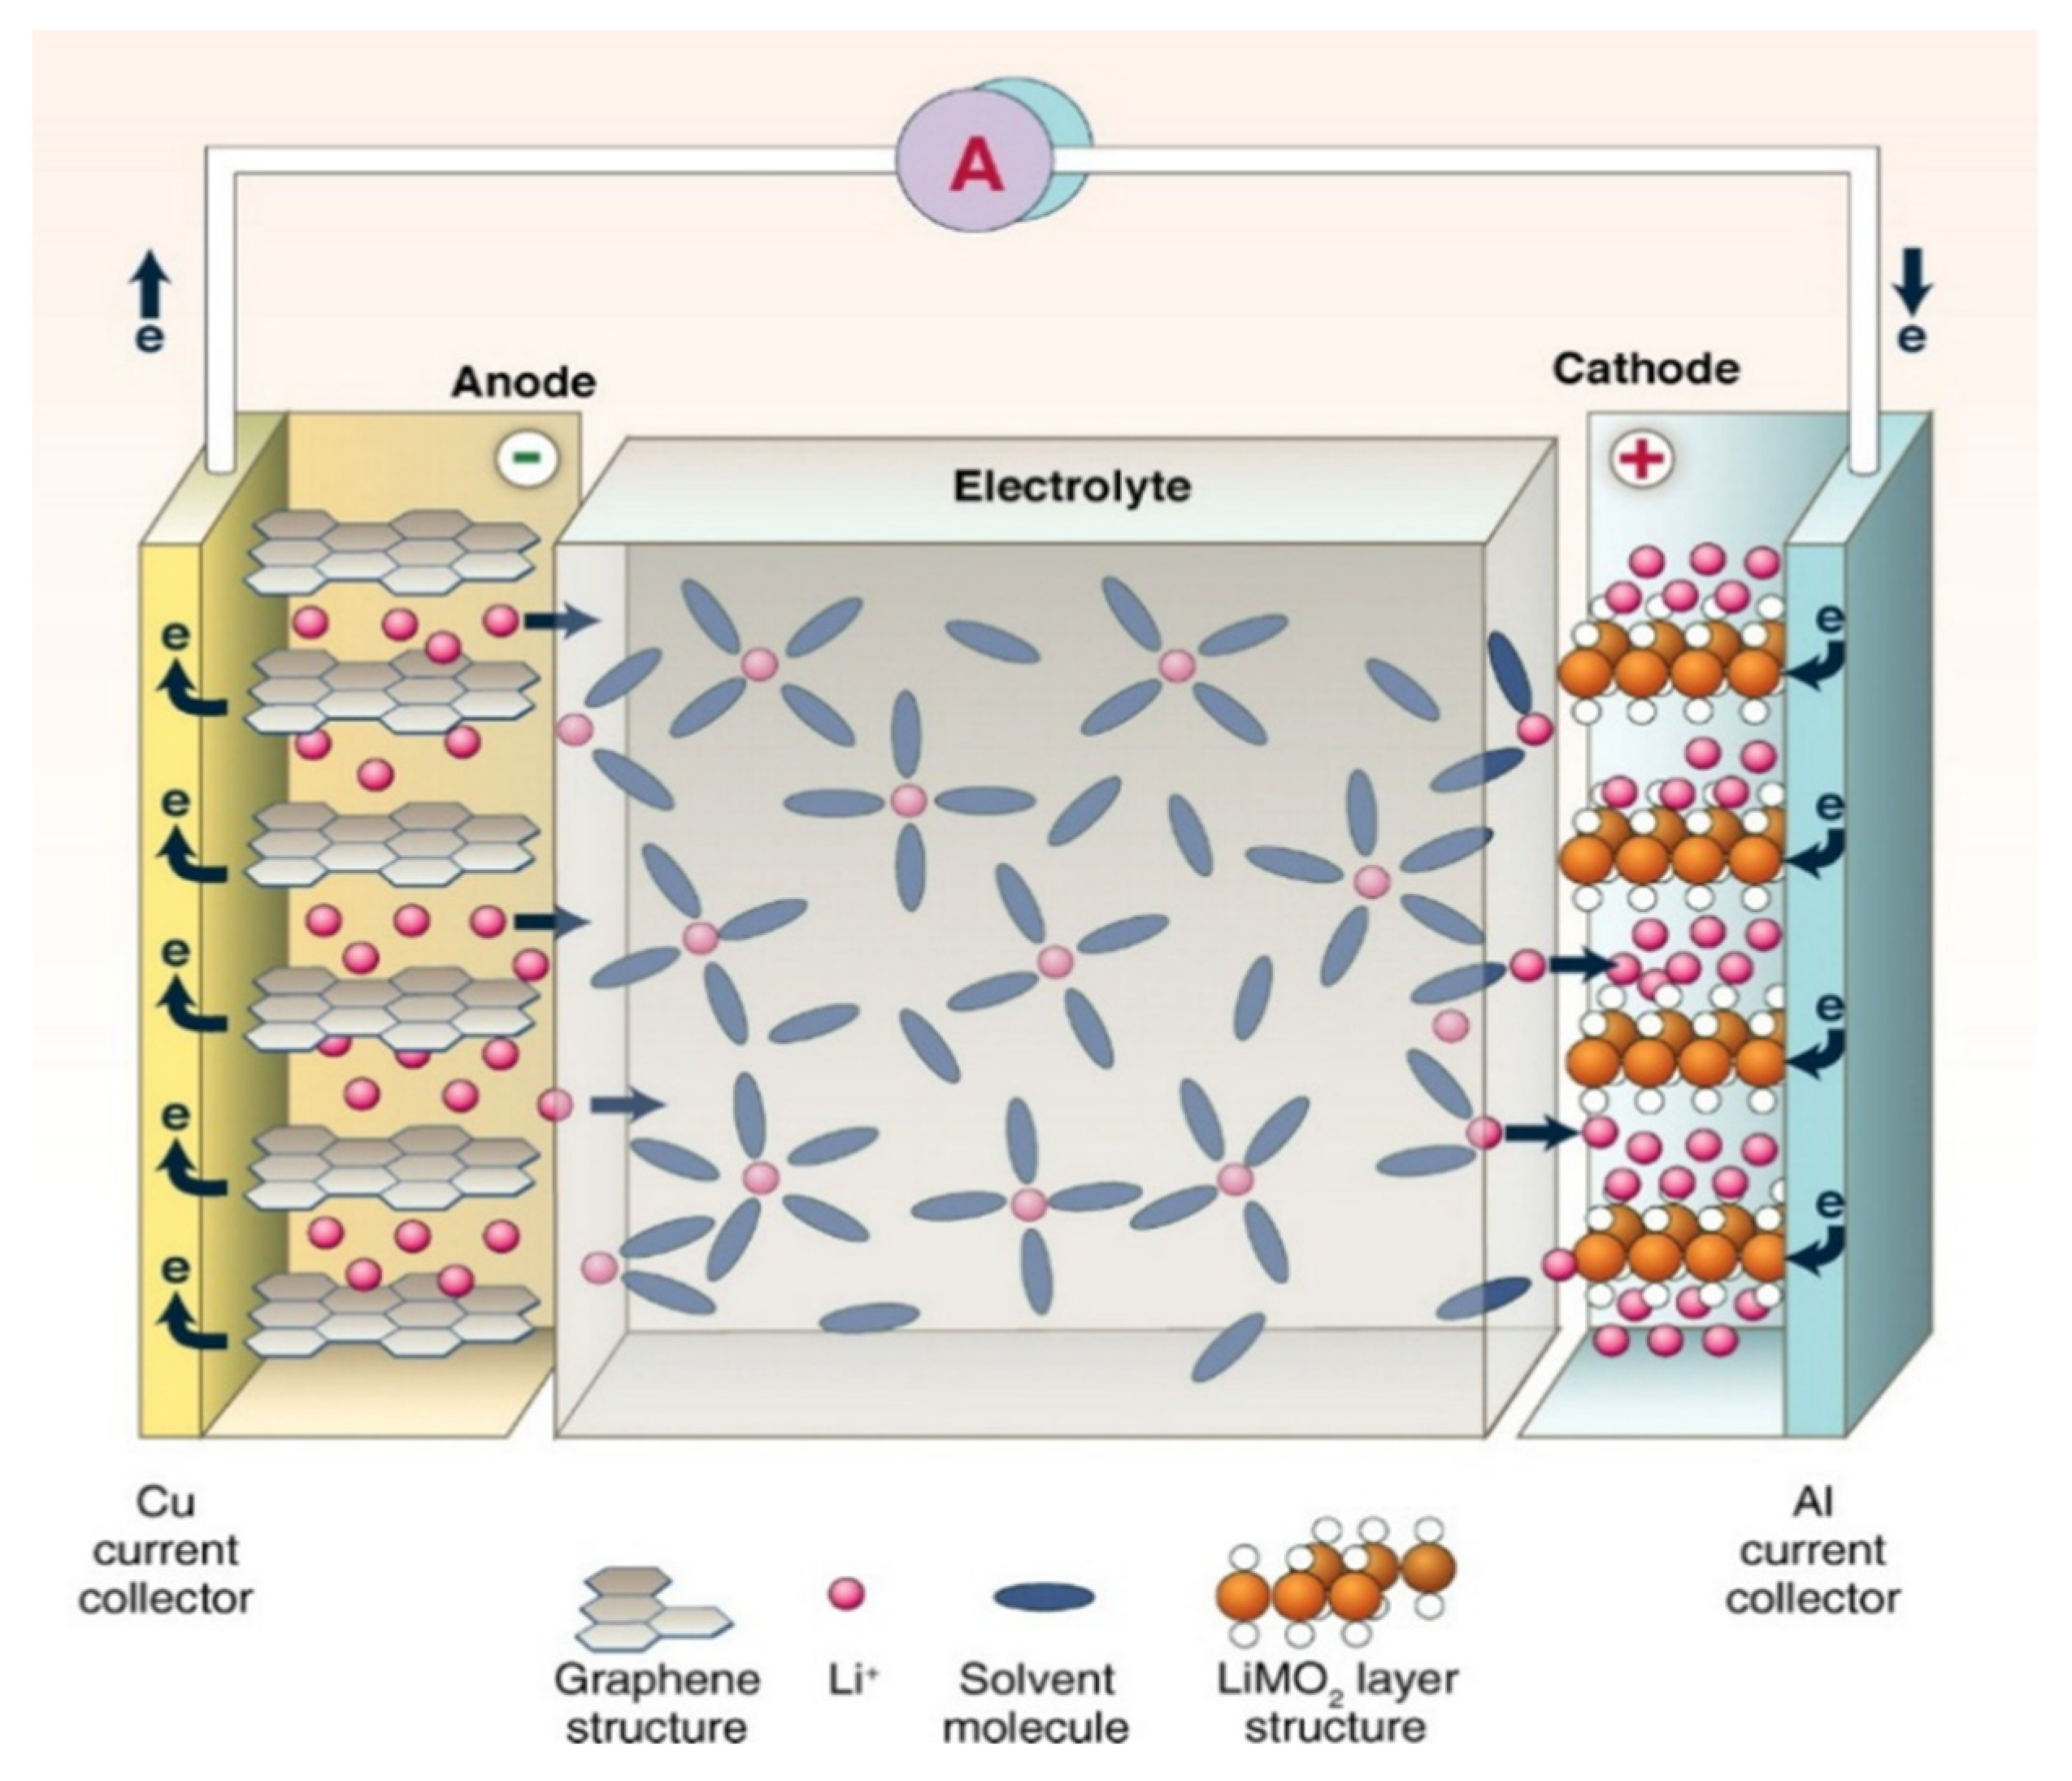
6.4. Lithium-Based Batteries

The family of lithium-based batteries includes the lithium-ion batteries, which operate with migrating lithium ions and a large cohort of electrodes. The first members of this family were developed in the 1990s and now comprise more than one hundred members, which were originally developed for a variety of applications, including electric vehicles, both plug-in and hybrid.
Lithium is the lightest element that exists in the solid state at ambient conditions, its atom and ionic radius are very small and its atoms and ions readily diffuse in the matrix of any host material. In addition, the redox potential of lithium is −3.04 V, which is low compared with other ions—e.g., that of standard hydrogen. This enables higher voltages to be developed in lithium-based batteries as well as higher specific energies. With such attractive material properties, the Li-ion technology has captured the markets of portable electronics and small power tools [108,109]. The development of the graphene matrix for the anodes has significantly improved the specific energy and durability of the batteries [110,111]. In some applications, prelithiated graphite (LinC6) has been used to supply the anode of batteries with lithium and generate “lithiated” compounds that are used in the manufacture of amphi-redox LMO batteries, which have significantly high storage capacity.
Figure 6 is a schematic diagram of the operation of a Li-ion cell. The anode consists of a carbon matrix (graphene in this case), where the small Li atoms are loosely dispersed in the graphene matrix, and a copper layer (often called the “current collector”) that facilitates the flow of electrons in the external circuit. The anode is separated from the electrolyte solution by a semipermeable membrane that allows the lithium atoms (Li+) to diffuse in the bulk of the electrolyte. The electrolyte may be an organic liquid or a solid. In the latter case, the solid matrix of the electrolyte acts as separator and membranes are not needed at the two electrodes. The cathode is typically composed of a metal oxide or phosphate, such as LiCoO2, LiMnO2 or LiFePO4, with an aluminum conductor (the second “current collector”) that facilitates the flow of electrons from the external circuit [110,112]. During the discharge of the battery, Li in the anode is oxidized (de-intercalates) to Li+ ions and diffuses towards the electrolyte, thus separating the Li+ ions and the electrons, which enter the external circuit. The external voltage causes the Li+ ions to migrate toward the cathode. The flow of electrons is impeded by the electrolyte matrix or the separator and, hence, the path of the electrons is through the current collectors and the external circuit [113]. A reduction reaction takes place in the cathode, where the Li+ ions combine with the electrons that flow through the external circuit, a process known as intercalation.
Table 4 shows the ES properties of four types of Li-ion cells, the voltage they generate, the electric charge capacity they have, in Ampere-hours per kg of weight, and the specific energy that may be stored in such cells, in kJ/kg [25].
It is apparent that Li-ion batteries may store more energy per unit weight than other types of batteries and for this reason they have been recommended to be used for electric vehicles where weight matters [113,114]. However, their energy-to-weight ratio is significantly lower than that of octane (44,430 kJ/kg), the principal constituent of gasoline. The weight of the battery in the typical plug-in electric vehicles is compensated by the absence of the (heavier) internal combustion engine [25,115].
A significant drawback of the Li-ion batteries is that the metal oxide electrodes are unstable at higher temperatures. If they decompose, they release oxygen that reacts exothermically with other materials in the battery and generates heat, which causes fires in confined spaces, such as luggage. This has become a significant concern in the airline industry, where a few laptop battery fires have caused enormous safety problems, including the emergency landing of aircraft, prompting several airlines to ban the storage of Li-ion batteries in checked baggage [116]. In order to minimize this problem, the batteries are equipped with monitoring devices to avoid over-charging; to keep the current within safe limits; and to maintain the battery temperature within safe limits [117,118]. The development of new, more stable materials for the electrodes and continuing research on the safety of Li-ion batteries are expected to alleviate these safety-related problems in the future [39,119].

6.5. Metal-Air Batteries
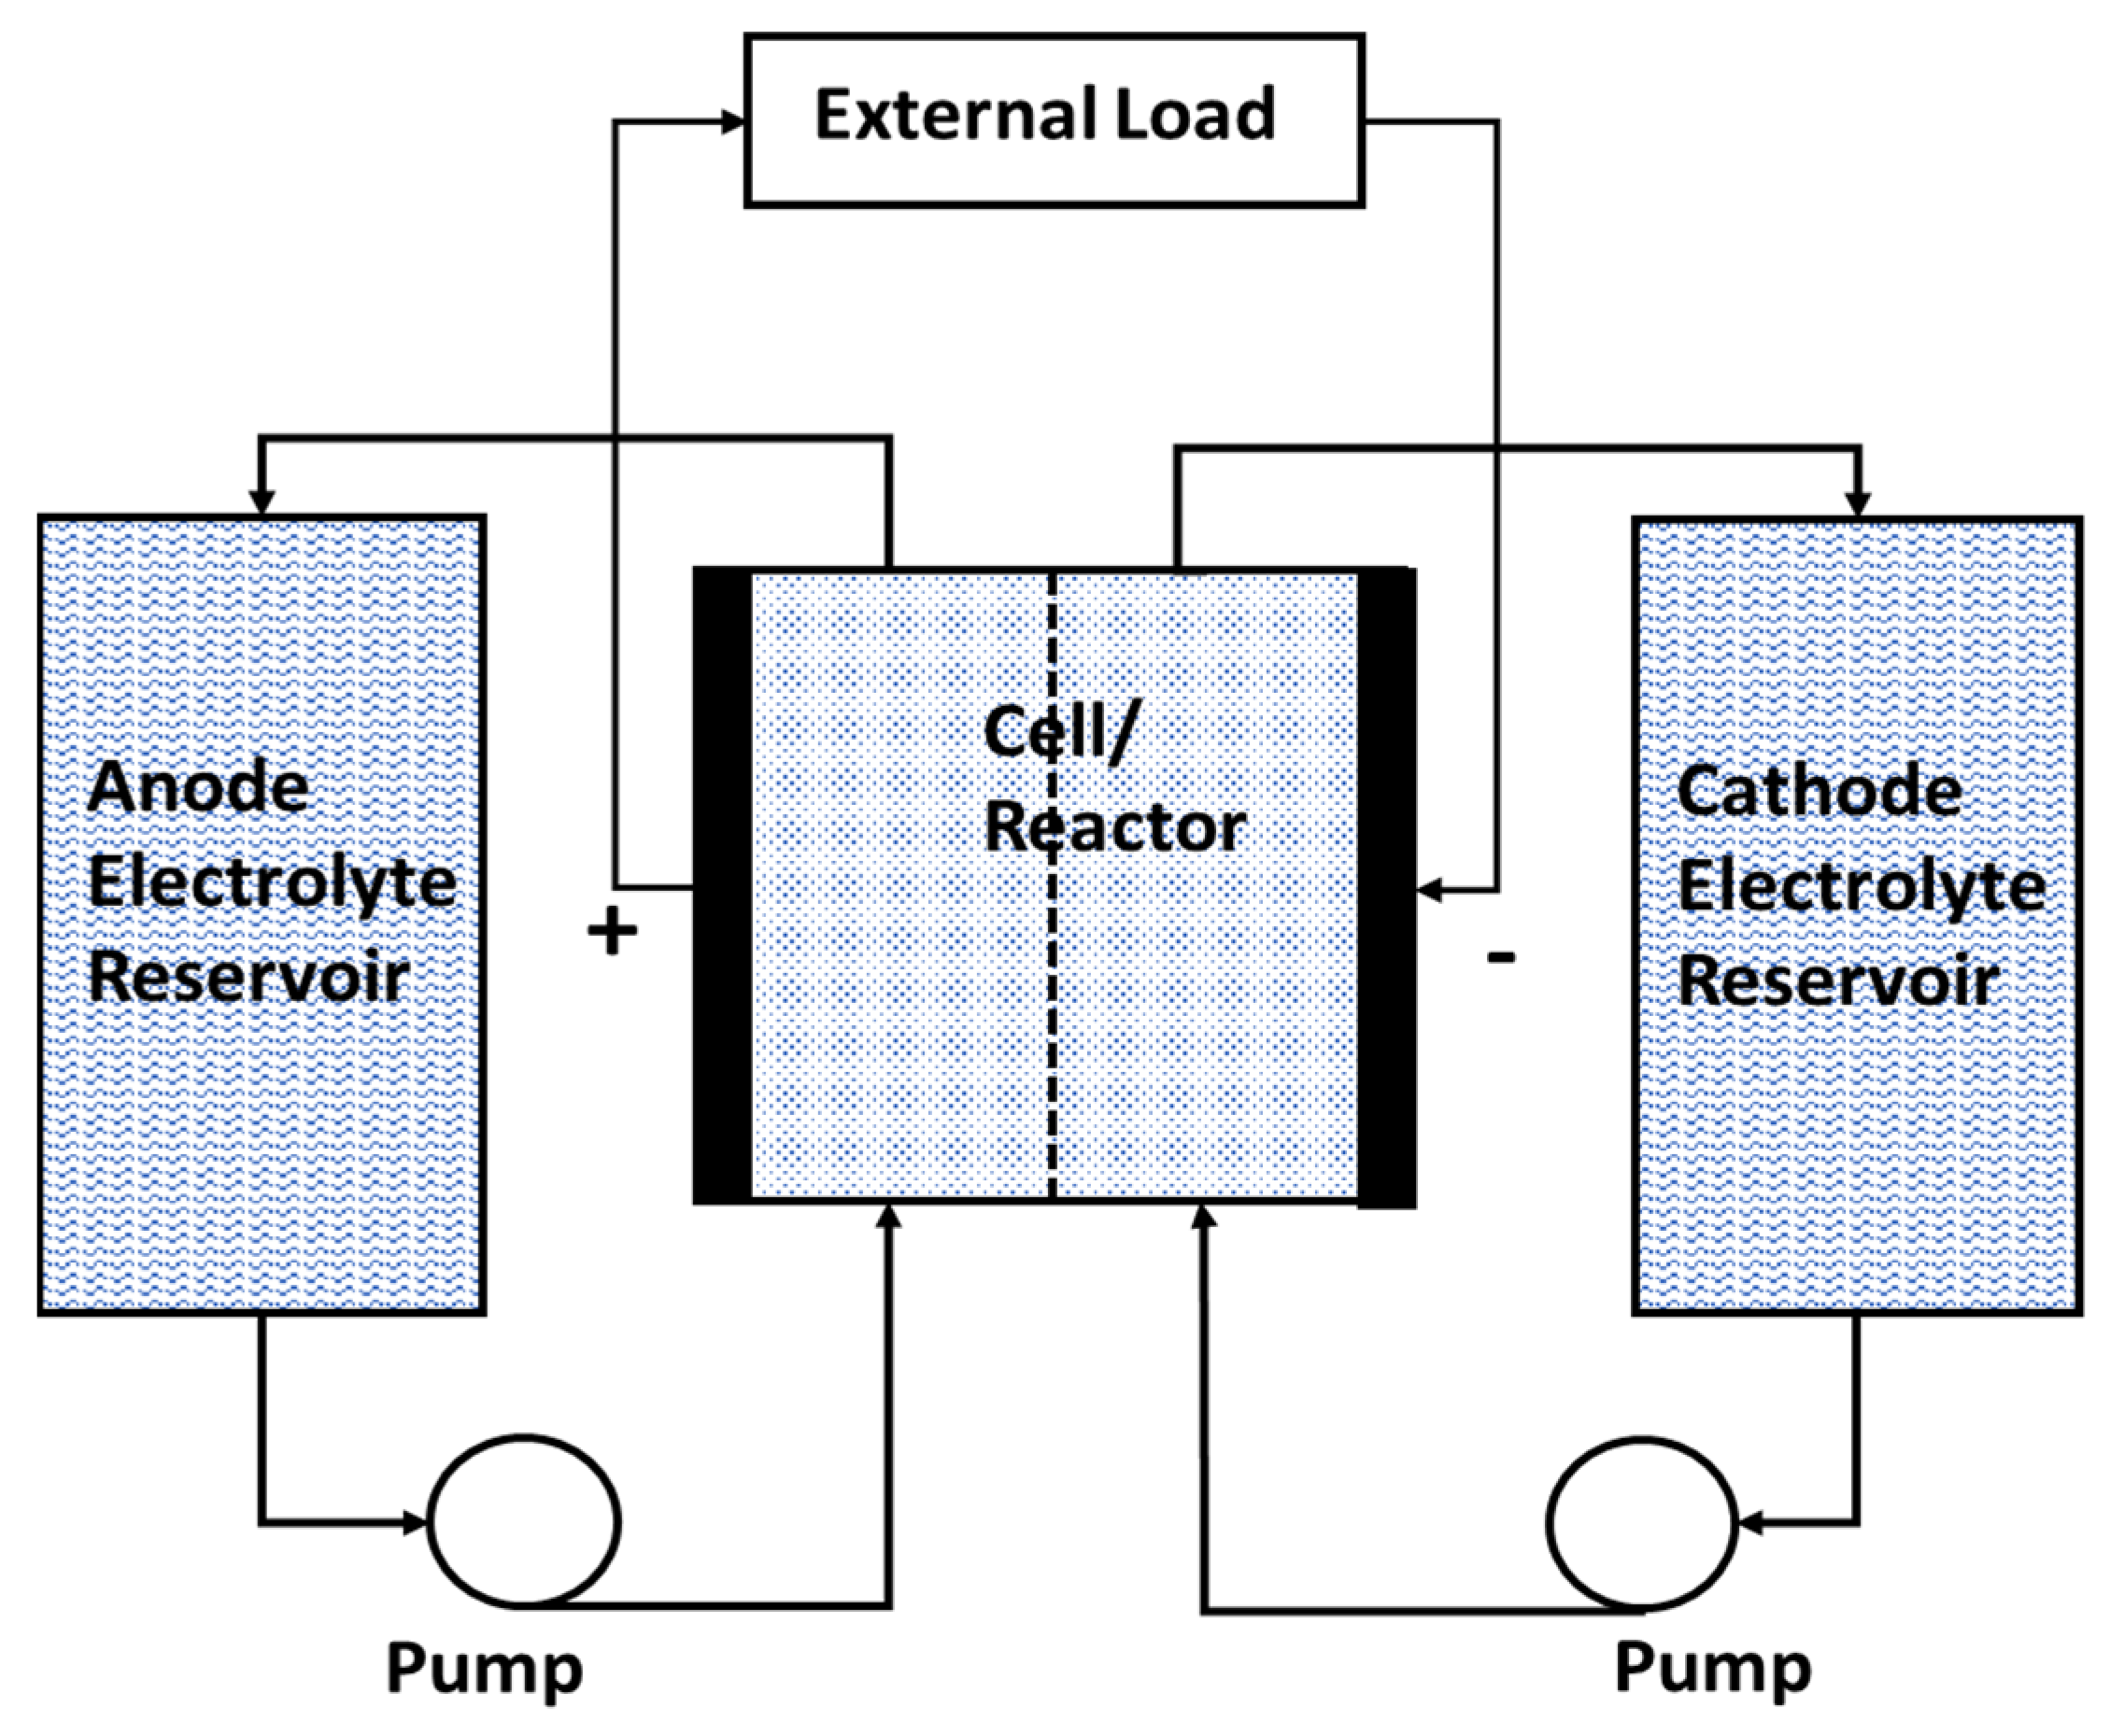
The operation of these batteries is based on the oxidation of a metal anode. Oxygen from the air diffuses in an aqueous electrolyte via a porous carbon cathode and forms OH- ions, which migrate in the anode and convert the metal to its hydroxide. Due to the high Gibbs’ free energy of several metals, this type of battery may reach high specific energy. The zinc-air battery, which has been commercially developed, has an upper limit of specific energy of 0.65 kWh/kg.
The theoretical limit of the lighter lithium–air battery is approximately 11 kWh/kg—only lower than that of octane by a factor of four. However, because lithium in its metal form has very high reactivity with ambient air and moisture, it is doubtful that this type of battery will be commercially developed. A second disadvantage of all the metal-air batteries is their lower round-trip efficiency, which is close to 50%. Developments in materials technologies and further research in this area may make these high energy-to-weight ratio batteries safer and marketable in the future [46,83,97,120].

6.6. Flow Batteries

The conventional batteries, described in Section 6.1, Section 6.2, Section 6.3, Section 6.4 and Section 6.5, are essentially closed thermodynamic systems, where all the stored energy is in the mass of the electrodes. After the batteries discharge, the mass of the electrodes must be replenished by electric charging, typically a very slow process. Faster charging of conventional batteries is laden with significant thermodynamic irreversibility, high energy dissipation and poorer round-trip efficiency. The slow charging is a significant impediment to the market penetration of plug-in electric vehicles that need several hours to recharge their batteries. Another problem with the sizing of the conventional batteries is their stored energy–power dependence; all the stored energy resides in the volume of the electrodes, and the available power is a monotonic function of the electrode area. As a result, the stored energy and the available power are connected to the size of the battery and are not independent—actually, the two vary monotonically with the size/volume of the battery.
Flow batteries are free of the slow charging limitations. Energy in the flow batteries is stored in liquid electrolytes, which are kept in reservoirs and circulate in the cell (sometimes called the reactor) of the battery either by pumps or by gravity. Thus, the electrolyte replenishment and recharging of the flow batteries takes place in minutes, while the recharging of conventional batteries takes place in several hours. In addition, the stored energy and the available power are independent in flow batteries; the size of the tanks determines the stored energy and the area of the cell/reactor determines the available power [121,122,123]. Figure 7 is a schematic diagram of a flow battery. Pumps supply the anode and the cathode of the central cell (reactor) with liquid electrolytes from two external reservoirs. The semipermeable membrane at the center of the cell selectively allows the ions to pass from one side of the cell to the other.
It must be noted that the operation of the flow batteries is similar to that of fuel cells, which are also open thermodynamic systems. The difference between the two types of direct energy conversion devices is that, in the fuel cells, it is only the fuel and the oxidant (typically air) that enter the cell, with the electrolyte remaining in the fuel cell, while in the flow batteries the entire mass of the electrolytes is pumped into the cell.
Two types of flow batteries have been developed: the redox and the hybrid. The vanadium redox battery (VRB) utilizes vanadium ions in different oxidation states; at the positive electrode, the exchange of the ions VO2+ and VO2+ takes place, while in the negative electrode, the exchange is between the ions V2+ and V3+ and H+ ions are exchanged through the semipermeable membrane. For example, during the discharge of the VRB, the following reactions take place [124,125,126]:
V O 2 + + 2 H + + e V O 2 + + H 2 O c a t h o d e   ( + ) V 2 + V 3 + + e a n o d e   ( )
The zinc-bromine battery is a representative of the hybrid type flow batteries, which are so-named because their electrodes are eroded or replenished by one of the components in the electrolyte. During the discharge cycle of this type of battery, bromide ions are converted to bromine gas in the negative electrode (anode) and zinc ions are converted to zinc in the positive electrode (cathode) [127,128,129].
Z n 2 + + 2 e Z n c a t h o d e   ( + ) 2 B r B r 2 + 2 e a n o d e   ( )
It is apparent that, during the discharge phase, Zn is electroplated on the cathode and this weakly connects the amount of power produced and energy stored, as in the conventional batteries. The production of the corrosive bromine gas at the anode may become an environmental problem, e.g., following an accident when the gas is released for this and other types of flow batteries that produce corrosive materials [130].
Among the advantages of the two types of flow batteries are [39,98,131,132,133]:
  • Ability to discharge to 0% of charge (100% depth of discharge).
  • Higher cycle life at 100% depth of discharge.
  • No shelf-life limitations since flow batteries are non-perishable.
  • Scalable ES capacity that depend only on the volume of the electrolyte reservoirs.
  • The ability to store energy from any electricity-generating source.
  • High rate of discharge over significant times.
  • Fast recharge of the battery-operated systems by replenishing the electrolyte in the reservoirs.
  • Low equivalent carbon emissions during their life cycle [134].
  • Higher specific energy and energy density relative to the lead-acid batteries, but lower than that of lithium-based batteries.
The major disadvantages of the flow batteries are [39,40,125,135,136,137]:
  • Significantly higher cost. However, the cost may improve with larger systems and longer hours of discharge.
  • Relatively low round-trip efficiency.
  • Limited operational temperature range, typically 10–35 °C.
Even though they represent new technologies, because of their capacity to store large quantities of energy, flow battery facilities have been developed in several parts of the globe. According to the DOE database [49], there are 89 ES installations worldwide. Among these, the Dalian VFB-UET/Rongke power facility in Dalian, China has a 800 MWh capacity—it may supply 200 MW for four hours—and it uses vanadium technology and is connected to the main grid of Liaoning Province. A facility in Kazakhstan operating with Zn-Br flow batteries supplies 25 MW for four hours (100 MWh capacity) and is designed to help this country reach its goals of 30% renewable electricity by 2030.

6.7. Advantages and Disadvantages of Conventional Batteries

Most conventional battery types represent mature technologies and they are easy to manufacture and use. Batteries readily provide power at demand, within milliseconds, and their operation is clean. Charging conventional batteries takes a long time but is typically accomplished with high efficiency. Similarly, their discharging efficiency is high. As a result, the round-trip efficiency of commercial batteries may be as high as 90%, when charged and discharged optimally.
Conventional batteries are not suitable for the storage of large quantities of energy. A glance at Table 4 proves that the storage of 1 kWh of electricity (3.6 × 10³ kJ) requires the equivalent of 1.7 to 2.5 kg of Li-ion batteries. This range becomes 24–30 kg/kWh for lead batteries [138]. For this reason, conventional batteries (flow batteries are excluded here) for grid-level and utility-level storage must be installed in buildings with foundations that will support the total weight—provided that the cost favors such an application. Conventional batteries may be of use for the storage of smaller quantities of energy in distributed storage applications (households) and microgrids for small communities.
One of the disadvantages of lead-acid batteries as well as several other types of batteries is the self-discharge caused by the current drift [25,139,140]; the voltage difference and the finite resistance of the battery cells create an internal current, even when the poles of the batteries are not connected to an external circuit. This is the reason that automobile batteries “die” or “are drained” when the car remains idle for long periods of time. The current drift dissipates the stored energy and, over long time periods, discharges the batteries. Typical self-discharge rates for common rechargeable cells are for lead–acid 4% to 6% per month; for nickel–cadmium 15% to 20% per month; for nickel metal hydride 30% per month; and for lithium 2% to 3% per month [141,142,143]. It has also been observed that the self-discharge rate may accelerate when the batteries are exposed to even routine short-term thermal exposure [144]. This implies that batteries are not suitable for seasonal ES, for example, harnessing the high winds of the spring to store energy in order to satisfy the high electricity demand of the summer.
A second disadvantage of all batteries, especially in high energy-demand regions, is the limitation of charging-discharging cycles. After a few thousand charge-recharge cycles, batteries fail to efficiently recharge and need to be chemically regenerated (recycled). With the current electric energy demand, battery ES in typical households in the south and southwest parts of the USA, where the use of air conditioning is widespread, necessitates the installation of the equivalent of 180 heavy-duty marine batteries per household [16,145,146]. Consequently, every household in these and similar regions must send for recycling or replacement the equivalent of 45 to 90 vehicle batteries per year. The volume of this battery traffic is very high and the environmental risk from misplaced, discarded and badly disposed batteries is substantial, because all batteries contain heavy metals (Pb, Ni, Co, Mn, Cd, etc.) that have been proven to be harmful to animals and humans [147,148,149].
For conventional batteries to play an important role in seasonal electric ES, even at the household level, significant research and technological advances must occur with goals to:
  • Increase their specific energy and energy density.
  • Reduce the recharge time and associated energy losses (dissipation).
  • Eliminate or significantly diminish the internal current drift and self-discharge.

7. Hydrogen Energy Storage

The storage of energy in hydrogen and its conversion to electricity in fuel cells is basically a type of electrochemical process. Due to the unique characteristics of hydrogen and the attention it has drawn in the scientific and engineering community in the last fifty years in anticipation of the so-called hydrogen economy [150,151], hydrogen storage is presented as a separate section. The physical properties of hydrogen and the variables that are pertinent to its suitability as an ES medium are shown in Table 5.
Hydrogen may be used both in direct energy conversion (DEC) devices, such as fuel cells, and in internal combustion (IC) engines and burners. As a result, it is a direct substitute for all fossil fuels, in power plants, IC engines and jet engines. In the transition from fossil fuels to renewables, hydrogen has been advocated as an effective and environmentally friendly ES medium for the following reasons:
  • It is the lightest element with very high specific energy (ΔHo = −142.7 MJ/kg; ΔGo = −118.6 MJ/kg). For comparison, ΔHo for octane is −49.5 MJ/kg and for most batteries ΔHo is on the order of 1 MJ/kg [98,152].
  • The energy density of hydrogen at ambient conditions is relatively high, but not as high as the energy density of liquid fuels. Compressed hydrogen and liquid hydrogen have significantly higher energy densities. As is shown in Table 5, the energy density is significantly higher at higher pressures with 1 m3 of hydrogen at 500 bar storing the equivalent of 1 MWh of electric energy. Liquid hydrogen at atmospheric pressure has extremely high specific energy and energy density but needs to be stored at about 20 K (−253 °C) [72,153].
  • As hydrogen is a constituent of water in the hydrosphere, this element is abundant and almost inexhaustible.
  • Hydrogen is a stable compound. It may be stored and used after a long time, e.g., for the seasonal storage of wind energy from the spring to the summer season.
  • Hydrogen may be easily generated by the electrolysis or thermolysis of water and hydrocarbon splitting—all mature and well-known technologies [154,155,156,157]. Microbial electrolysis is also possible [158,159]. The efficiency of the several electrolysis processes is relatively high, in the range 70–90%, and hydrogen production does not appear to create an environmental pollution risk [160,161,162].
  • The emissions from hydrogen conversion systems are water, a harmless and non-polluting compound.
  • If released, hydrogen is not harmful to the environment and does not pose any health threats to humans.
  • It may be used in IC engines and as combustion fuel in gas turbines, as well as in fuel cells.
  • It has very low viscosity. Hydrogen may be transported in pipelines, similar to natural gas pipelines, with low frictional losses [163,164].
  • Handling and storing hydrogen are mature technologies, where significant industrial expertise has been accumulated [151,165,166].
  • Hydrogen-operated automobiles and trucks do not emit pollutants and may be recharged in very short times. As such, hydrogen vehicles are ideal for inner city and long-distance transportation. There are already several operational “hydrogen routes” for hydrogen vehicles in Europe, Japan and several states in the USA [167,168].
Hydrogen production and utilization as an ES medium also have several disadvantages and shortcomings:
  • Hydrogen does not naturally occur as a chemical compound. It must be artificially produced by electrolysis or chemical reactions at the expense of other energy forms [153,169].
  • Since the hydrogen molecule is very small, hydrogen readily diffuses through the atomic matrices of metals, including steel, causing hydrogen embrittlement and decarburization. These processes weaken the hydrogen containers that need to be coated with special polymer films [170].
  • It is flammable and explosive in air.
  • As shown in Table 5, its energy density is very low under ambient conditions. This implies hydrogen needs to be transported and stored at high pressures.
  • The liquefaction of hydrogen—a phase with high energy density—is cumbersome because its Joule-Thompson coefficient only becomes positive below 200 K. As a result, hydrogen does not cool in throttling processes at temperatures above 200 K and needs to be precooled by liquid nitrogen [171,172,173].
If hydrogen gas is to be used as an ES medium it must be stored under high pressure and this necessitates the manufacturing of strong container vessels with thicker walls and coatings to eliminate hydrogen embrittlement. This may entail increased cost but does not represent a momentous technological challenge. The automobile industry manufactures several passenger vehicles (e.g., the Toyota Mirai, the Hyundai Nexo, the Honda Clarity and the Hyundai Nexo). Compressed hydrogen tanks that store the gas in the range 300–700 atm are in place for these vehicles and several trucks, which are currently in the market and operate with fuel cells. It must be noted, however, that the compression process consumes significant quantities of energy that are not recovered in the typical fuel cells and burners. For example, the energy required for the compression of hydrogen to 500 atm (in a two-stage compression system with 82% efficiency) is 16.94 MJ/kg, or approximately 14% of the stored specific exergy, ΔGo.
The formation and transport of hydrogen-based compounds that would release the gas when needed is another method that has been successfully developed. Hydrogen forms van der Waals bonds with many elements. This enables hydrogen to be adsorbed on materials with large specific areas. Porous carbon, zeolites and porous polymers are among the materials successfully used for hydrogen adsorption [152,174,175]. However, hydrogen adsorption is an exothermic reaction that requires significant cooling—currently supplied by liquid nitrogen in typical hydrogen adsorption systems. It has been estimated that approximately 10 kg of liquid nitrogen are required to remove the heat of adsorption of 1 kg of hydrogen [152].
Another method for hydrogen storage and transport is the formation of metal hydrides. Among these, magnesium hydride, MgH2, may store 7.6% hydrogen by weight, but the chemical bond is very strong and significant energy is required to release the hydrogen. In addition, the reactions of both the formation and the dissociation of MgH2 are sluggish, requiring high temperatures [176,177,178]. Aluminum hydride, AlH3, may store up to 10.1% hydrogen by weight and the hydrogen bonds with Al are weaker. However, the formation reaction is highly irreversible and requires very high pressures [179,180]. Complex metal hydrides [181,182], such as alanates (e.g., NaAlH4) [183], borohydrides [184] and metal amides [185], have also been researched and recommended as hydrogen carriers that combine high specific energy and high energy density.
Common chemicals, such as ammonia (NH3), formic acid (HCO2H) and methanol (CH3OH), which are industrially manufactured and commercially used in large quantities, have also been proposed as hydrogen carriers. Apart from their relatively high specific energy and energy density, significant advantages of these chemicals are that they represent well-known technologies, they are cheap to manufacture, they are easy to transport, and they are relatively environmentally benign [186,187,188,189,190,191]. The development of fuel cells that would efficiently utilize these high-density, chemically stable and easy to produce hydrogen carriers would revolutionize the electricity generation and automobile industries.

8. Thermal Energy Storage

As thermal energy (heat) is needed in several domestic applications, such as space heating and hot water, and because heat may also be converted to motive power and electricity, the storage of heat is an alternative ES medium. Thermal energy storage (TES) applications are met in a wide range of temperatures from very high (e.g., in molten salts) to cryogenic (e.g., in liquid nitrogen). TES systems are characterized as sensible heat storage (e.g., in hot water, solid beds of pebbles or organic liquids) and latent heat storage (e.g., in liquid nitrogen, steam, molten salts or phase change materials). The temperature of the sensible TES systems decreases when heat is extracted and increases when heat is added. In the latent TES systems, the temperature remains almost constant during both heat addition and heat extraction. Typically, TES systems based on latent heat have higher specific energies and energy densities. In particular, specifically designed phase-change materials (PCMs) not only have superior specific heats and higher energy densities, but also absorb and supply heat at desired temperatures [25,82,192,193,194].
One of the disadvantages of the TES systems is that, because they are at temperatures significantly different than the ambient, they exchange heat with their environment, and part of their thermal energy advantage is dissipated. When the temperature of the TES, T, is different than that of the ambient, Tamb, heat is exchanged with the natural environment:
Q ˙ = U A ( T T a m b )
where U is the overall heat transfer coefficient of the storage vessel of the TES system and A is the outside area of the vessel. For sensible heat TES systems, if the initial temperature of the thermal storage material is T(0), after a time period t, the temperature becomes [25]:
T = T ( 0 ) + [ T a m b T ( 0 ) ] [ 1 exp ( t / τ s t ) ] .
where τst is the characteristic time for the thermal storage material. For a material with density ρ and specific heat capacity c, contained in a vessel with volume V and outside area A, the thermal characteristic time τst is given by the expression [13]:
τ s t = V ρ c A U .
As a result of the heat exchange with the environment, the difference in the thermal energy of the TES when the temperature changes from T(0) to T is:
E ( 0 ) E ( t ) = V ρ c [ T ( 0 ) T ] = V ρ c [ T ( 0 ) T a m b ] [ 1 e x p ( t / τ s t ) ] .
It is apparent that when τ→∞, then T→Tamb and E(t)→0. Equations (15) and (17) demonstrate that the temperature of a sensible heat storage system drops exponentially and that eventually—at high values of the ratio t/τst—it becomes approximately equal to the ambient temperature. A typical 400 L hot water heater, if left without recharging, would dissipate 25% of its stored heat during one day and 87% of its energy during a week. Similarly, with a latent heat TES system, the storage material will gradually undergo phase change and its temperature will tend to the ambient temperature. At their environmental state (dead state) the exergy of all materials is zero and the materials do not store any useful energy [71,195,196,197]. Therefore, TES systems are unsuitable for long-term ES, because their energy (or energy deficit if they operate at lower temperatures) dissipates in the environment. The layers of insulating materials currently used with TES systems exhibit low enough values of U to enable heat storage for 6–16 h, without a significant temperature drop and energy exchange with the environment. For this reason, TES systems are used with diurnal heating cycles (e.g., storage of solar-generated heat during the day and use during the night) but not with seasonal cycles (e.g., heat storage during the spring and summer to be used in the winter).

8.1. High-Temperature Storage

Steam at temperatures higher than 100 °C, organic fluids, molten oxides and molten salts are the main types of materials that would supply heat at high temperatures. The most significant applications of TES systems at high temperatures are:
  • To supply with heat a Rankine cycle for the generation of electricity. Gemasolar, the largest thermal solar power plant in the world (formerly known as Solar Tres), makes use of a large molten salt (primarily nitrate salts) storage tank. Heat is stored in a large tank containing the nitrates at 565 °C and is used during the dusk and night hours to raise steam for the turbines of the thermal solar power plant [198]. This enables Gemasolar to continuously generate electricity for fifteen hours after sunset, allowing the plant to run 24/7 during the summer months. The predecessor of this plant, Solar Two in California, also relied on molten salts to extend its hours of electricity generation. High-temperature TES systems enable the concentrated solar power plants to reach high-capacity factors and generate dispatchable power [199,200]. TES systems may also be used with nuclear power plants, both water and gas cooled; given that the thermal output of nuclear power plants must remain within narrow boundaries, the use of high-temperature TES systems in nuclear installations has been proposed to meet the electric power-demand fluctuations at the utility level [201].
  • To supply high-temperature industrial processes. In such cases, steam (at both high and low pressure) is generated and stored in large, insulated tanks to supply industrial processes with heat at well-controlled temperatures for a plethora of applications [25,202,203,204]. A few types of district heating also use low-pressure steam [205,206].
  • To supply heat to an absorption or adsorption cycle for cooling, a process commonly called solar cooling [207]. A temperature higher than 100 °C is considered to be of “high quality.” Cooling systems that are supplied with high-quality heat may operate chillers with two or three effects, the chillers are more efficient and their refrigeration capacity is significantly higher [206,208,209]. Figure 8 is a schematic diagram of a system that uses solar heat to supply a building with chilled water for air conditioning. When the heat from the collectors exceeds the heat required by the chiller, the hot water tank of the building is charged. Conversely, when the heat required by the chiller exceeds the supplied solar heat, the thermal storage is discharged to match the demand.
It must be noted that the TES medium, which is labeled as water in Figure 8, may be any other suitable fluid or a latent heat storage material [210]. Air conditioning for buildings using absorption cycles consumes significantly less electric power than compression cycles, because electric power is only used to pump liquids and not to compress the vapor of the refrigerant [151,211]. Given that air conditioning demand is increasing at a very fast pace globally, and the peak of air conditioning demand coincides with the electric power demand peak in most OECD countries, the spread of solar cooling will both decrease the peak power demand and will reduce the electric energy demand in the electricity grids during the summer months [212,213].
The process of using the stored thermal energy (heat) for the generation of electricity or motive power is subjected to the Carnot limitations. This, in combination with the low heat collection efficiencies—in the range 40–70%—results in significantly lower round-trip, first-law and exergetic efficiencies, in the range 10–30%. Despite this, the use of high-temperature TES systems is growing because: (a) it is based on mature technologies; (b) it is one of the very few methods to store thermal energy from concentrated solar collectors.

8.2. Lower-Temperature Storage

The primary reason for lower-temperature heat is for domestic comfort: heating for buildings, hot water supply and cooling. From the beginning, it must be noted that, currently, most buildings are equipped with a tank to store hot water at temperatures in the range 45–60 °C. When hot water is needed in the building, water is withdrawn from the tank and, when the water temperature in the tank falls, water is heated by an external source (solar, natural gas or oil) and the tank is recharged. The proliferation of solar collectors, especially in Mediterranean countries, has significantly improved the technology of solar heating for both hot water and space heating/cooling during the winter months [206,214].
In the case of heating (either hot water for domestic use or for space heating) a hot fluid—either water or a water-based mixture—is heated in solar collectors and stored in well-insulated tanks for its thermal energy to be used when needed. The insulation of the tanks is typically good enough to store the hot water for 10–20 h without significant heat loss and a significant temperature drop [209,215].
In the case of cooling, an absorption or adsorption cycle is employed, as shown in Figure 8. For the cooling of buildings, the storage medium is chilled water or a mixture of water and ethylene glycol, at typical temperatures of 0–8 °C. Industrial refrigeration requires lower temperatures and the storage media are organics with lower freezing points, or suitable phase-change materials [216,217]. Several large buildings (including those in several universities, hospitals and airport terminals throughout the world) already use this method to shave the peak electric power demand and avoid buying the more expensive electricity during peak demand hours. For example, the Dallas–Fort Worth (DFW) international airport has available a large tank of 22,712 m3 (6 million gallons), where chilled water is stored at an average temperature of 8 °C, to be used during the peak electric power-demand hours in the summer. This TES system has 90,000 ton-hours of refrigeration capacity (1.08 × 10⁹ Btu or 1.14 × 10¹² J) and provides the five terminals of the DFW airport with air conditioning [25,218]. A recent study on clusters of grid-independent homes concluded that the inclusion of similar TES systems in communities solely relying on RESs for their electric power would reduce the required solar power (PV) installation by about 40%, would reduce the energy dissipation associated with ES for electricity generation by a factor of three and would reduce the needed ES capacity by a factor of four [144].
Given that heating and air conditioning in buildings account for more than one-third of the total energy consumption globally, and also for approximately 40% of the CO2 emissions [219], low-temperature heat storage in the range of applications for buildings is of particular importance for the scientific community. Materials with very high specific energy and energy density, able to be charged with solar energy and subsequently provide both heating and air conditioning to buildings, will revolutionize the HVAC industry. Novel materials with thermal hysteresis operating in the range 10–45 °C would be ideal for this function. Figure 9 shows the operation of an ideal material that exhibits thermal hysteresis, melts at approximately 10 °C and solidifies at approximately 45 °C, while the interior temperature of the building is in the range of comfort, 22–25 °C [25]. During the hot season, the material is cooled by a refrigeration cycle below its melting temperature when energy is available (e.g., during the early morning hours). The melting of the thermal hysteresis material keeps the building cool for the rest of the day. During the cold season, the operation of the refrigeration cycle is reversed to a heat pump that heats up the molten thermal hysteresis material at a temperature higher than 45 °C. The solidification of the material supplies heat to the building and keeps the interior temperature at the desired level. Significant research has been conducted for the discovery and commercial development of thermal hysteresis materials that would accomplish similar functions for domestic comfort in buildings [220,221,222].

8.3. Cryogenic Temperature Storage

As the name implies, cryogenic ES (CES) systems generate a cryogenic fluid—typically liquid nitrogen or liquid air—which is to be used by a separate engine for the generation of electricity or motive power [83,132,223]. Figure 10 depicts the schematic diagram of a cyclic engine for the generation of electricity using a cryogenic liquid. The environment supplies the high-temperature heat to the engine and the cryogenic fluid maintains the low temperature for the condenser of the engine. The engine receives heat Q0 from the environment ejects heat Q to the cryogenic fluid and produces work W = Q0Q. The “waste heat” from the cycle, which is typically at sub-atmospheric temperature, may be used to partially cool the cryogenic fluid during its production.
Strictly speaking, CES systems are not energy storage systems but “energy deprived systems,” or “coolness storage systems.” They may produce mechanical work because the exergy of all materials is positive at sub-environmental temperatures [71,194,195]. Due to the high electric energy needed for the liquefaction of gases, and the relatively low efficiencies of the cryogenic engines that are subjected to the Carnot limitations, the round-trip efficiency of CES is very low, in the range 10–30%. For this reason, at present, there are no commercially operating CES facilities for electricity generation. There have been several attempts to use cryogens (primarily liquid nitrogen) for automobile propulsion [224,225] but they did not progress beyond the prototype experimental stage, because of their low overall efficiency (the well-to-wheels efficiency [25]) and the loud noise generated during the nitrogen evaporation and expansion processes in engine cylinders fitted with pistons.

8.4. Thermo-Chemical Materials

It is apparent in Equation (14) through Equation (17) that materials used with physical thermal storage processes (sensible or latent materials) attain temperatures significantly different than the ambient and that their stored energy dissipates via heat transfer to the environment. Thermo-chemical thermal ES (TCTES) materials rely on the energy absorbed and released in chemical reactions, whose directions may be reversed, or in molecular sorption mechanisms. An example is the sodium sulfide pentahydrate reaction that takes place at 83 °C [226]:
N a 2 S · 5 H 2 O N a 2 S · 2 H 2 O + 3 H 2 O
This pentahydrate has material density of 1580 kg/m3, specific energy of 1162 kJ/kg and energy density of 1836 MJ/m3 (510 kWh/m3)—significantly higher than most sensible heat materials. Most importantly, the materials in the r.h.s. of the reaction may be separated and stored for long periods of time to be used whenever desired. In the case of liquid–solid and gas–solid materials, the separation process is natural, by gravity. Gas-solid TCTES materials present several advantages related to the stability of the chemicals formed, their durability and their performance even at very high temperatures. Such materials have been the focus of several research and development projects [227,228,229].
Effectively, the TCTES materials store energy in chemical bonds at any temperature, including the ambient. As a result, these materials would store energy for long periods of time and are suitable for seasonal thermal/chemical ES. TES systems based on sorption reactions are primarily used for cooling applications, while systems based on chemical reactions are typically used for ES at higher temperatures. At present, most TCTES materials are in the research and development stages. While some promising materials have been developed, significant improvements (primarily in the long-term stability of the chemical compounds formed, the life-cycle of the systems and the resulting coefficients of performance) need to be achieved before these materials and the TCTES technology become widely used [230,231,232].

8.5. Borehole Thermal Energy Storage

Some of the better thermal insulating materials are materials found underground. The various types of dry rock (and even dry soils) are excellent insulators. In addition, they occupy vast amounts of space, which is available for thermal energy storage. The borehole thermal energy storage (BTES) systems make use of the low conductivity and the relatively high specific energy and volumetric heat capacity of rock minerals. For example, the various types of basalt, granite and sandstone have specific heat capacities in the range 0.8–1.2 kJ/kgK, volumetric heat capacities (energy density per unit temperature) in the range 1.8–3.2 MJ/m3 and thermal diffusivities in the range 5–6 × 10⁻⁷ m2/s [233]. Such materials may be used to store large quantities of heat or “coolness” underground on timescales that span seasons. In the last thirty years, the booming ground source heat pump (GSHP) technology has made use of the underground materials to achieve more efficient heating and air conditioning and has proven that the underground environment may be readily used as a source or sink of heat for applications related to domestic comfort in buildings [234].
The BTES technology essentially utilizes the properties of the underground materials to store energy using an array of borehole heat exchangers. Several BTES pilot project systems have been constructed including the Luleåvärme Project, in Luleå, Sweden, which was discontinued in 1989 [235]; the Drake Landing Project, in the model community of Okatoga, in Alberta, Canada, which utilizes a cylindrical array of 144 boreholes with depth down to 35 m depth, has a volume of 34,000 m3, and is used to store heat from solar collectors during the summer to be used during the cold winters [236,237]; and the system in Annenberg, Sweden, which utilizes an array of 100 boreholes with a depth of 65 m and extends to a volume of approximately 65,000 m3 [238].
While BTES systems are well insulated and have performed relatively well as seasonal thermal storage systems for district heating, the long durations of energy storage (e.g., from the summer to winter) imply significant energy loss to the underground environment. When the water table is high, and water is present in the underground porous materials of the rocks, advection and natural convection by water will dissipate a very high fraction of the stored energy. For this reason, underground water movement suppression (or site choice where the water table is permanently very low) and borehole placement optimization are needed for the satisfactory functioning of the BTES systems [239,240]. A recent overview of BTES concluded that even well-designed BTES systems will dissipate a significant amount of their stored energy to the subsurface environment and that round-trip efficiencies of even 50% “are difficult to obtain” [241]. This study concluded that the most efficient array shape will, typically, be a cylinder with approximately equal diameter and depth, covered by a well-insulated top. Despite their large energy dissipation, and because of their very high volumes and the vast quantities of heat they may store, BTES is still considered an attractive method—perhaps the only one—for seasonal thermal energy storage [240].

9. Cost and Price Considerations

Thermodynamics is a branch of physics and its principles (the laws of thermodynamics) are permanent and universally valid. On the contrary, economics is a social science, based on empirical principles that are derived from contemporary observations of persons and groups. Prices and costs emanate from correlations of data, are not permanent and heavily depend on place, time, current demand and current supply. Unlike thermodynamic properties such as internal energy, enthalpy and exergy, the prices of systems and commodities, such as fuels, do not reflect any physical laws. Energy-related prices and costs exhibit very high uncertainty because (in addition to supply-demand effects) the economics of energy are subject to geopolitical and military events [25,242]. Figure 11 depicts the nominal and real prices of anthracite and gasoline in the USA in the period 1980 to 2015 [243,244]. The real prices are expressed as US dollars of 2015.
It is observed that both sets of prices exhibit very high fluctuations, with the percentage standard deviations of the real prices being 30.4% for gasoline and 25.4% for anthracite. The standard deviation of the nominal prices, which are always quoted in the markets, is 50.7% for gasoline and 22.1% for anthracite. The uncertainty of a variable is usually defined as a multiple of two or three standard deviations. Therefore, the uncertainty of the prices—both nominal and real—is close to the average price and this implies that any future price calculations are laden with very high uncertainty.
In addition, it has always been observed that the prices of appliances and equipment drop significantly when they are mass-produced and become household appliances. For example, the real price of refrigerators has dropped by a factor of 26 since they were first introduced in the beginning of the 20th century. The real price of personal computers has dropped by a factor of eight since 1980 (and their performance increased a hundredfold), and similar trends are currently observed with laptop computers and cellular phones. Commercial competition among the manufacturers, technological breakthroughs, manufacturing improvements and government initiatives contribute to the significant cost reductions of commonly used appliances (At the time of writing this article the US Department of Energy announced an initiative to reduce by 80% the cost of hydrogen production from RESs.).
In the transition process from fossils to RESs, several ES systems will become household appliances. They will be mass-produced appliances/equipment, and their nominal prices will be very much different than current prices. For example, if hydrogen becomes the ES medium in future grid-independent buildings [16,144], most new households will be equipped with a reliable storage tank and a hydrogen generation engine. The engine and tank will become common household appliances (similar to refrigerators and hot water tanks of today), will be mass produced and their prices will be much lower than their current (2021) prices, following the similar trends of refrigerators, hot water tanks and, perhaps, personal computers. Due to this and because of the high uncertainty of energy prices, it is very difficult to make determinations with any degree of accuracy on the prices of ES systems in the future. For this reason, this review does not make any predictions and does not include any definitive information on the cost of ES systems that will be implemented in the distant future.
This assertion on prices notwithstanding, one may still make certain general statements about the economics of ES systems: ES entails both fixed costs (investment, insurance, administration, rents, etc.) and operational costs (energy dissipation, maintenance, warranties, etc.). Both types of costs will add to the price of electricity paid by the consumers [245]. Investors and ES operators will make their decision on which ES systems to employ based on the net present value (NPV) concept of their systems. This will include the price paid for energy storage, which will have two components for available power and available energy [246]. In the calculation of the NPV, the fixed costs of ES systems will be weighted more heavily for seasonal storage systems (e.g., store wind energy in March to be used by air conditioners in July) than daily storage systems. On the contrary, the round-trip efficiency (and energy loss during charging-recharging) will play a more important role in the case of short duration (minutes to days) storage systems. As a consequence, economics will favor the less expensive systems for seasonal storage and the more efficient systems for short duration systems. System reliability will be an important factor in these economic decisions. The price of energy sold, which ultimately is passed to the consumers, will be one of the primary variables (in conjunction, perhaps, with governmental incentives) that will determine whether or not ES systems are profitable for their owners.

10. Concluding Remarks

The development of ES capacity is necessary for the transition of the electricity generation industry from fossil fuels to the most abundant renewable energy sources, namely solar and wind energy. ES capacity will be needed at different scales, from very low for appliances, to very high for grid-level storage. Table 6 summarizes some of the thermodynamic parameters for the most important ES systems and gives the range of their round-trip efficiencies (Thermal-to-thermal energy storage efficiency).
The storage capacity of PHSs, CAESs and hydrogen storage systems only depends on the vessels of their containment and can become high enough for grids and utilities. Equally important, these systems may store energy for very long periods of time to provide seasonal storage. However, the round-trip efficiencies of these systems are relatively low. Conventional and flow batteries will store smaller quantities of energy and for shorter times—days to weeks—but their round-trip efficiencies can be significantly high. In general, superconducting electromagnetic coils and supercapacitors have lower energy capacities and store energy for shorter time periods with very high round-trip efficiencies. Flywheels may store significant energy at relatively high round-trip efficiencies, but for very short periods of time, typically minutes. Thermal ES for the generation of electricity is subjected to Carnot limitations and exhibits very low round-trip efficiencies. However, thermal ES for domestic comfort (heating and cooling of buildings) can greatly help both the amount of energy stored and the overall efficiency of the storage systems. Figure 12 is a schematic diagram (a Ragone chart) of the several ES systems and visually exhibits the range of their capacity level and storage duration. It must be noted that the upper rectangles show the approximate upper level of ES duration, with the lower level for all being on the order of minutes, e.g., stored hydrogen may be directed to a fuel cell and generate power in very short time (minutes) after its generation.
It becomes apparent from the information above that not a single ES system is ideal for all pertinent applications, from the grid scale to the household scale. In a future society that largely generates its electricity from RESs, it is expected that combinations of more than one ES system—the so-called hybrid systems—will be used. The hybrid systems integrate more than one ES technology and combine the advantages and desirable characteristics of these technologies. The combination may also result in the avoidance or mitigation of undesirable characteristics. For example, a hybrid system consisting of a PHS and a combination of flow and conventional batteries would enable the seasonal storage of energy and also improve the round-trip efficiency of storage by transacting short-term storage needs through the batteries. Similarly, a thermal-hydrogen combination system for a microgrid maintains the advantages of hydrogen ES, while avoiding the lower round-trip efficiency of the electrolysis/fuel cell system by using the PV-generated electricity to directly produce chilled water for air conditioning or hot water for heating. There is a plethora of combinations that may be used for the optimization of ES systems, including several that have already been proposed and studied, such as hydrogen–superconductors [247,248], hydrogen–supercapacitors [249,250], CAES-supercapacitors [251] and battery-flywheel [252,253], as well as combinations of thermal storage with several other ES forms [144,254].

Funding

This research received no external funding.

Institutional Review Board Statement

Not applicable.

Informed Consent Statement

Not applicable.

Acknowledgments

This research was partly supported by the Tex Moncrief Chair of Engineering at TCU.

Conflicts of Interest

The author declares no conflict of interest.

References

  1. IPCC. Climate Change 2007: Synthesis Report; Contribution of Working Groups I, II and III to the Fourth Assessment Report of the Intergovernmental Panel on Climate Change; IPCC: Geneva, Switzerland, 2007. [Google Scholar]
  2. Fisher, D.A.; Hales, C.H.; Wang, W.C.; Ko, M.K.W.; Sze, N.D. Model calculations of the relative effects of CFCs and their replacements on global warming. Nature 1990, 344, 513–516. [Google Scholar] [CrossRef]
  3. EIA. Kigali Amendment to the Montreal Protocol: A Crucial Step in the Fight against Catastrophic Climate Change. In Proceedings of the 22nd Conference of the Parties (CoP22) to the United Nations Framework Convention on Climate Change (UNFCCC), Marrakech, Morocco, 7–18 November 2016. [Google Scholar]
  4. U.S. EPA (U.S. Environmental Protection Agency). Inventory of U.S. Greenhouse Gas Emissions and Sinks: 1990–2014. 2016; EPA 430-R-16-002. Available online: https://www.osti.gov/biblio/1464240 (accessed on 20 September 2021).
  5. International Energy Agency. CO2 Emissions from Fuel Combustion—Overview; IEA-Chirat: Paris, France, 2019. [Google Scholar]
  6. International Energy Agency. Key World Statistics; IEA-Chirat: Paris, France, 2018. [Google Scholar]
  7. International Energy Agency. Key World Statistics; IEA-Chirat: Paris, France, 2020. [Google Scholar]
  8. Energy Information Agency. Coal Explained; US Department of Energy: Washington, DC, USA, 2020.
  9. Ritchie, H.; Roser, M. CO2 and Greenhouse Gas Emissions, Our World in Data. 2020. Available online: https://ourworldindata.org/co2-and-other-greenhouse-gas-emissions (accessed on 10 April 2021).
  10. IPCC. Climate Change 2014: Synthesis Report; Contribution of Working Groups I, II and III to the Fifth Assessment Report of the Intergovernmental Panel on Climate Change; Core Writing Team, Pachauri, R.K., Meyer, L.A., Eds.; IPCC: Geneva, Switzerland, 2014. [Google Scholar]
  11. Miller, A.I.; Suppiah, S.; Duffey, R.B. Climate change gains more from nuclear substitution than from conservation. Nucl. Eng. Des. 2006, 236, 1657–1667. [Google Scholar] [CrossRef]
  12. Kim, J.H.; Song, M.M.; Alameri, S.A. Emerging areas of nuclear power applications. Nucl. Eng. Des. 2019, 354, 110183. [Google Scholar] [CrossRef]
  13. Michaelides, E.E. Alternative Energy Systems; Springer: Heidelberg, Germany, 2012. [Google Scholar]
  14. Freeman, E.; Occello, D.; Barnes, F. ES for Electrical Systems in the USA. AIMS Energy 2016, 4, 856–875. [Google Scholar] [CrossRef]
  15. California ISO (CAISO). What the Duck Curve Tells Us about Managing a Green Grid. 2016. Available online: https://www.caiso.com/Documents/FlexibleResourcesHelpRenewables_FastFacts.pdf (accessed on 5 May 2021).
  16. Leonard, M.D.; Michaelides, E.E. Grid-Independent Residential Buildings with Renewable Energy Sources. Energy 2018, 148C, 448–460. [Google Scholar] [CrossRef]
  17. Available online: http://www.ercot.com/gridinfo/generation (accessed on 15 April 2021).
  18. Michaelides, E.E. ES and Installed Wind Capacity Requirements for the Substitution of Fossil Fuels in the Electricity Generation Sector. J. Energy Power Technol. 2021, 3, 18. [Google Scholar] [CrossRef]
  19. Denholm, P.; O’Connell, M.; Brinkman, G.; Jorgenson, J. Over-Generation from Solar Energy in California: A Field Guide to the Duck Chart; National Renewable Energy Laboratory: Golden, CO, USA, 2015. [Google Scholar]
  20. Schoenung, S.M.; Keller, J.O. Commercial potential for renewable hydrogen in California. Int. J. Hydrogen Energy 2017, 42, 13321–13328. [Google Scholar] [CrossRef]
  21. Zhang, N.; Lu, X.; McElroy, M.B.; Nielsen, C.P.; Chen, X.; Deng, Y. Reducing curtailment of wind electricity in China by employing electric boilers for heat and pumped hydro for ES. Appl. Energy 2016, 184, 987–994. [Google Scholar] [CrossRef] [Green Version]
  22. Denholm, P.; Margolis, R.M. Evaluating the limits of solar photovoltaics (PV) in electric power systems utilizing ES and other enabling Technologies. Energy Policy 2007, 35, 4424–4433. [Google Scholar] [CrossRef]
  23. Chaudhary, P.; Rizwan, M. Energy management supporting high penetration of solar photovoltaic generation for smart grid using solar forecasts and pumped hydro storage system. Renew. Energy 2018, 118, 928–946. [Google Scholar] [CrossRef]
  24. Hou, Q.; Zhang, N.; Du, E.; Mia, M.; Peng, F.; Kang, C. Probabilistic duck curve in high PV penetration power system: Concept, modeling, and empirical analysis in China. Appl. Energy 2019, 242, 205–215. [Google Scholar] [CrossRef]
  25. Michaelides, E.E. Energy, the Environment, and Sustainability; CRC Press: Boca Raton, FL, USA, 2018. [Google Scholar]
  26. Lazar, J. Teaching the “Duck” to Fly; RAP Publications: Paris, France, 2014; Available online: www.raponline.org (accessed on 10 April 2021).
  27. Sanandaji, B.M.; Vincent, T.L.; Poolla, K. Ramping rate flexibility of residential HVAC loads. IEEE Trans. Sustain. Energy 2016, 7, 865–874. [Google Scholar] [CrossRef]
  28. Hassan, A.S.; Cipcigan, L.; Jenkins, N. Optimal battery storage operation for PV systems with tariff incentives. Appl. Energy 2017, 20, 422–441. [Google Scholar] [CrossRef]
  29. Sevilla, F.R.S.; Parra, D.; Wyrsch, N.; Patel, M.; Kienzle, F.; Korba, P. Techno-economic analysis of battery storage and curtailment in a distribution grid with high PV penetration. J. Energy Storage 2018, 18, 73–83. [Google Scholar] [CrossRef]
  30. Ding, Y.; Shao, C.; Yan, J.; Song, Y.; Zhang, C.; Guo, C. Economical flexibility options for integrating fluctuating wind energy in power systems: The case of China. Appl. Energy 2018, 228, 426–436. [Google Scholar] [CrossRef]
  31. Kumar, N.; Venkataraman, S.; Lew, D.; Brinkman, G.; Palchak, D.; Cochran, J. Retrofitting Fossil Power Plants for Increased Flexibility. In Proceedings of the ASME Power Conference, Baltimore, MD, USA, 28–31 July 2014. [Google Scholar]
  32. Janko, S.A.; Arnold, M.R.; Johnson, N.G. Implications of high-penetration renewables for ratepayers and utilities in the residential solar photovoltaic (PV) market. Appl. Energy 2016, 180, 37–51. [Google Scholar] [CrossRef]
  33. Michaelides, E.E. Fossil Fuel Substitution with Renewables for Electricity Generation—Effects on Sustainability Goals. Eur. J. Sustain. Dev. Res. 2020, 4, em0111. [Google Scholar] [CrossRef] [Green Version]
  34. IRENA. Electricity Storage and Renewables: Costs and Markets to 2030; International Renewable Energy Agency: Abu Dhabi, United Arab Emirates, 2017. [Google Scholar]
  35. Schmidt, O.; Hawkes, A.; Gambhir, A.; Staffell, I. The future cost of electrical ES based on experience rates. Nat. Energy 2017, 2, 17110. [Google Scholar] [CrossRef]
  36. Darling, R.M.; Gallagher, K.G.; Kowalski, J.A.; Ha, S.; Brushett, F.R. Pathways to low-cost electrochemical ES: A comparison of aqueous and nonaqueous flow batteries. Energy Environ. Sci. 2014, 7, 3459–3477. [Google Scholar] [CrossRef] [Green Version]
  37. Janoschka, T.; Martin, N.; Martin, U.; Friebe, C.; Morgenstern, S.; Hiller, H.; Hager, M.D.; Schubert, U.S. An aqueous, polymer-based redox-flow battery using non-corrosive, safe, and low-cost materials. Nature 2015, 527, 78–81. [Google Scholar] [CrossRef]
  38. Mahlia, T.M.I.; Saktisahdan, T.J.; Jannifar, A.; Hasan, M.H.; Matseelar, H.S.C. A review of available methods and development on ES.; Technology update. Renew. Sustain. Energy Rev. 2014, 33, 532–545. [Google Scholar] [CrossRef]
  39. Argyrou, M.C.; Christodoulides, P.; Kalogirou, S.A. ES for electricity generation and related processes: Technologies appraisal and grid scale applications. Renew. Sustain. Energy Rev. 2018, 94, 804–821. [Google Scholar] [CrossRef]
  40. Zakeri, B.; Syri, S. Electrical ES systems: A comparative life cycle cost analysis. Renew. Sustain. Energy Rev. 2015, 42, 569–596. [Google Scholar] [CrossRef]
  41. Hoppmann, J.; Volland, J.; Schmidt, T.S.; Hoffmann, T.H. The economic viability of battery storage for residential solar photovoltaic systems—A review and a simulation model. Renew. Sustain. Energy Rev. 2014, 39, 1101–1118. [Google Scholar] [CrossRef]
  42. Parra, D.; Valverde, L.; Pino, F.J.; Patel, M.K. A review on the role, cost and value of hydrogen energy systems for deep decarbonization. Renew. Sustain. Energy Rev. 2019, 101, 279–294. [Google Scholar] [CrossRef]
  43. Staffell, I.; Scamman, D.; Velazquez Abad, A.; Balcombe, P.; Dodds, P.E.; Ekins, P.; Shahd, N.; Warda, K.R. The role of hydrogen and fuel cells in the global energy system. Energy Environ. Sci. 2019, 12, 463–491. [Google Scholar] [CrossRef] [Green Version]
  44. Parra, D.; Swierczynski, M.; Stroeb, D.I.; Norman, S.A.; Abdond, A.; Worlitschek, J.; O’Doherty, T.; Rodrigues, L.; Gillotte, M.; Zhang, X.; et al. An interdisciplinary review of ES for communities: Challenges and perspectives. Renew. Sustain. Energy Rev. 2017, 79, 730–749. [Google Scholar] [CrossRef]
  45. Katsivelakis, M.; Bargiotas, D.; Daskalopulu, A.; Panapakidis, I.P.; Tsoukalas, L. Techno-Economic Analysis of a Stand-Alone Hybrid System: Application in Donoussa Island, , Greece. Energies 2021, 14, 1868. [Google Scholar] [CrossRef]
  46. Hadjipaschalis, I.; Poullikkas, A.; Efthimiou, V. Overview of current and future ES technologies for electric power applications. Renew. Sustain. Energy Rev. 2009, 13, 1513–1522. [Google Scholar] [CrossRef]
  47. Morabito, A.; Steimes, J.; Bontems, O.; Al Zohbi, G.; Hendrick, P. Set-up of a pump as turbine use in micro-pumped hydro ES: A case of study in Froyennes Belgium. J. Phys. Conf. Ser. 2017, 813, 012033. [Google Scholar] [CrossRef]
  48. de Oliveira e Silva, G.D.; Hendrick, P. Pumped hydro ES in buildings. Appl. Energy 2016, 179, 1242–1250. [Google Scholar] [CrossRef]
  49. United States Department of Energy. DOE Global ES Database. 2021. Available online: https://www.sandia.gov/ess-ssl/global-energy-storage-database-home (accessed on 20 May 2021).
  50. Yang, C.; Jackson, R.B. Opportunities and barriers to pumped-hydro ES in the United States. Renew. Sustain. Energy Rev. 2011, 15, 839–844. [Google Scholar] [CrossRef]
  51. Poullikkas, A. Optimization analysis for pumped ES systems in small isolated power systems. J. Power Technol. 2013, 93, 78–89. [Google Scholar]
  52. Beaudin, M.; Zareipour, H.; Schellenberglabe, A.; Rosehart, W. ES for mitigating the variability of renewable electricity sources: An updated review. Energy Sustain. Dev. 2010, 14, 302–314. [Google Scholar] [CrossRef]
  53. Pump Efficiency—What Is Efficiency? 2012. Available online: https://www.pumpsandsystems.com/pump-efficiency-what-efficiency (accessed on 20 May 2021).
  54. Hydraulic Efficiency. Mobil Service. 2018. Available online: https://www.mobil.com/industrial (accessed on 20 May 2021).
  55. Liu, X.; Luo, Y.; Karney, B.; Wang, W. A selected literature review of efficiency improvements in hydraulic turbines. Renew. Sustain. Energy Rev. 2015, 51, 18–28. [Google Scholar] [CrossRef]
  56. Efficiency in Electrcity Generation, Report by Euro Electric in Collaboration with VGB. July 2003. Available online: https://wecanfigurethisout.org/ENERGY/Web_notes/Bigger_Picture/Where_do_we_go_Supporting_Files/Efficiency%20in%20Electricity%20Generation%20-%20EURELECTRIC.pdf (accessed on 20 September 2021).
  57. Paik, J.; Sotiropoulos, F.; Sale, M.J. Numerical simulation of swirling flow in complex hydroturbine draft tube using unsteady statistical turbulence models. J. Hydraul. Eng. 2005, 131, 441–456. [Google Scholar] [CrossRef]
  58. Munson, B.R.; Young, D.F.; Okiishi, T.H.; Huwbsch, W.W. Fundamentals of Fluid Mechanics; Wiley: Hoboken, NJ, USA, 2009. [Google Scholar]
  59. American Concrete Pipe Association. Design data—22, Flotation of Circular Concrete Pipe. 2012. Available online: https://www.concretepipe.org/pipe-box-resources/design/design-data/ (accessed on 20 September 2021).
  60. American Concrete Pipe Association. Flow Friction Characteristics of Concrete Pressure Pipe. ACPA Technical Series. 2021. Available online: https://acppa.org/wp-content/uploads/2011/05/ACPPA-TechSeries-11-FlowCharacteristics-1.pdf (accessed on 20 September 2021).
  61. Wolf, D.; Kanngießer, A.; Budt, M.; Doetsch, C. Adiabatic compressed air ES co-located with wind energy-multifunctional storage commitment optimization for the German market using GOMES. Energy Syst. 2012, 3, 181–208. [Google Scholar] [CrossRef]
  62. Madlener, R.; Latz, J. Economics of centralized and decentralized compressed air ES for enhanced grid integration of wind power. Appl. Energy 2013, 101, 299–309. [Google Scholar] [CrossRef]
  63. Geissbühler, L.; Becattini, V.; Zanganeh, G.; Zavattoni, S.; Barbato, M.; Haselbacher, A.; Steinfeld, A. Pilot-scale demonstration of advanced adiabatic compressed air energy storage, Part 1: Plant description and tests with sensible thermal-energy storage. J. Energy Storage 2018, 17, 129–139. [Google Scholar] [CrossRef]
  64. Becattini, V.; Geissbühler, L.; Zanganeh, G.; Haselbacher, A.; Steinfeld, A. Pilot-scale demonstration of advanced adiabatic compressed air energy storage, Part 2: Tests with combined sensible/latent thermal-energy storage. J. Energy Storage 2018, 17, 140–152. [Google Scholar] [CrossRef]
  65. Salgi, G.; Lund, H. System behavior of compressed-air energy-storage in Denmark with a high penetration of renewable energy sources. Appl. Energy 2008, 85, 182–189. [Google Scholar] [CrossRef]
  66. Lund, H.; Salgi, G. The role of compressed air ES (CAES) in future sustainable energy systems. Energy Convers. Manag. 2009, 50, 1172–1179. [Google Scholar] [CrossRef]
  67. Lund, H.; Salgi, G.; Elmegaard, B.; Andersen, A.N. Optimal operation strategies of compressed air ES (CAES) on electricity spot markets with fluctuating prices. Appl. Therm. Eng. 2009, 29, 799–806. [Google Scholar] [CrossRef] [Green Version]
  68. Drury, E.; Denholm, P.; Sioshansi, R. The value of compressed air ES in energy and reserve markets. Energy 2011, 36, 4959–4973. [Google Scholar] [CrossRef]
  69. Gu, Y.; McCalley, J.; Ni, M.; Bo, R. Economic modeling of compressed air ES. Energies 2013, 6, 2221–2241. [Google Scholar] [CrossRef]
  70. Swiss Federal Office of Energy (SFOE). Demonstration of the Ability of Caverns for Compressed Air Storage with Thermal En-ergy Recuperation; Swiss Federal Office of Energy (SFOE): Bern, Switzerland, 2016. [Google Scholar]
  71. Michaelides, E.E. Exergy and the Conversion of Energy; Cambridge University Press: Cambridge, UK, 2021. [Google Scholar]
  72. REFPROP. Reference Fluid Thermodynamic and Transport. Properties, Version 9.1; NIST Standard Reference Data Basis: Washington DC, USA, 2012. [Google Scholar]
  73. Koshizuka, N.; Ishikawa, F.; Nasu, H. Progress of superconducting bearing technologies for flywheel ES systems. Phys. C 2003, 386, 444–450. [Google Scholar] [CrossRef]
  74. Mousavi, G.S.M.; Faraji, F.; Majazi, A.; Al-Haddad, K. A comprehensive review of flywheel ES system technology. Renew. Sustain. Energy Rev. 2017, 67, 477–490. [Google Scholar] [CrossRef]
  75. Sebastián, R.; Peña, D.; Alzola, R. Flywheel ES systems: Review and simulation for an isolated wind power system. Renew. Sustain. Energy Rev. 2012, 16, 6803–6813. [Google Scholar] [CrossRef]
  76. Rendell, D.; Shaw, S.R.; Pool, P.J.; Oberlin-Harris, C. Thirty Year Operational Experience of the JET Flywheel Generators. Proc. 28th Symp. On Fusion Technology (SOFT-28). Fusion Eng. Des. 2015, 98–99, 1140–1143. [Google Scholar] [CrossRef]
  77. Intrator, J.; Elkind, E.; Abele, A.; Weissman, S.; Sawchuk, M.; Bartlett, E. 2020 Strategic Analysis of ES in California; California Energy Commission: Sacramento, CA, USA, 2011; CEC-500-2011-047.
  78. Prodromidis, G.N.; Coutelieris, F.A. Simulations of economical and technical feasibility of battery and flywheel hybrid ES systems in autonomous projects. Renew. Energy 2012, 39, 149–153. [Google Scholar] [CrossRef]
  79. Wang, D.; Ren, C.; Sivasubramaniam, A.; Urgaonkar, B.; Fathy, H. ES in datacenters: What, where, and how much? Perform. Eval. Rev. 2012, 40, 187–198. [Google Scholar] [CrossRef]
  80. Probstein, R.F. Physicochemical Hydrodynamics, 2nd ed.; Elsevier: New York, NY, USA, 1994. [Google Scholar]
  81. Carrasco, J.M.; Franquelo, L.G.; Bialasiewicz, J.T.; Galván, E.; Guisado, R.C.P.; Prats, Á.M.; Leon, J.I.; Moreno-Alfonso, N. Power-electronic systems for the grid integration of renewable energy sources: A survey. IEEE Trans. Ind. Electron. 2006, 53, 1002–1016. [Google Scholar] [CrossRef]
  82. Hall, P.J.; Mirzaeian, M.; Fletcher, S.I.; Sillars, F.B.; Rennie, A.J.R.; Shitta-Bey, G.O.; Wilson, G.; Cruden, A.; Carter, R. ES in electrochemical capacitors: Designing functional materials to improve performance. Energy Env. Sci. 2011, 3, 1238–1251. [Google Scholar] [CrossRef]
  83. Chen, H.; Cong, T.N.; Yang, W.; Tan, C.; Li, Y.; Ding, Y. Progress in electrical ES system: A critical review. Prog. Nat. Sci. 2009, 19, 291–312. [Google Scholar] [CrossRef]
  84. Rani, J.R.; Thangavel, R.; Oh, S.I.; Lee, Y.S.; Jang, J.H. An Ultra-High-Energy Density Supercapacitor; Fabrication Based on Thiol-functionalized Graphene Oxide Scrolls. Nanomaterials 2019, 9, 148. [Google Scholar] [CrossRef] [Green Version]
  85. Rani, J.R.; Thangavel, R.; Oh, S.I.; Woo, J.M.; Chandra Das, N.; Kim, S.Y.; Lee, Y.S.; Jang, J.H. High Volumetric Energy Density Hybrid Supercapacitors Based on Reduced Graphene Oxide Scrolls. ACS Appl. Mater. Interfaces 2017, 9, 22398–22407. [Google Scholar] [CrossRef]
  86. Patil, A.M.; Kitiphatpiboon, N.; An, X.; Hao, X.; Li, S.; Hao, X.; Abudula, A.; Guan, G. Fabrication of a High-Energy Flexible All-Solid-State Supercapacitor Using Pseudocapacitive 2D-Ti3C2Tx-MXene and Battery-Type Reduced Graphene Oxide/Nickel-Cobalt Bimetal Oxide Electrode Materials. ACS Appl. Mater. Interfaces 2020, 12, 52749–52762. [Google Scholar] [CrossRef]
  87. Michaelides, E.E. Nanofluidics: Thermodynamic and Transport Properties; Springer: New York, NY, USA, 2014. [Google Scholar]
  88. Liu, S.; Sun, S.; You, X.Z. Inorganic nanostructured materials for high performance electrochemical supercapacitors. Nanoscale 2014, 6, 2037–2045. [Google Scholar] [CrossRef]
  89. Zhu, J.; Zhang, H.; Yuan, W.; Zhang, M.; Lai, X. Design and Cost Estimation of Superconducting Magnetic ES (SMES) Systems for Power Grids. In Proceedings of the IEEE Power and Energy Society General Meeting, Vancouver, BC, Canada, 1–5 July 2013. [Google Scholar]
  90. Drozdov, A.P.; Eremets, M.I.; Troyan, I.A.; Ksenofontov, V.; Shylin, S.I. Conventional superconductivity at 203 kelvin at high pressures in the sulfur hydride system. Nature 2015, 525, 73–76. [Google Scholar] [CrossRef]
  91. Drozdov, A.P.; Kong, P.P.; Minkov, V.S.; Besedin, S.P.; Kuzovnikov, M.A.; Mozaffari, S.; Balicas, L.; Balakirev, F.; Graf, D.E.; Prakapenka, V.B.; et al. Superconductivity at 250 K in lanthanum hydride under high pressures. Nat. Cell Biol. 2019, 569, 528–531. [Google Scholar] [CrossRef] [Green Version]
  92. Snider, E.; Dasenbrock-Gammon, N.; McBride, R.; Debessai, M.; Vindana, H.; Vencatasamy, K.; Lawler, K.V.; Salamat, A.; Dias, R.P. Room-temperature superconductivity in a carbonaceous sulfur hydride. Nat. Cell Biol. 2020, 586, 373–377. [Google Scholar] [CrossRef]
  93. Xue, X.; Cheng, K.; Sutanto, D.A. Study of the status and future of superconducting magnetic ES in power systems. Supercond. Sci. Technol. 2006, 19, R31–R39. [Google Scholar] [CrossRef]
  94. Cole, J.F. Battery ES systems—An emerging market for lead/acid batteries. J. Power Sources 1995, 53, 239–243. [Google Scholar] [CrossRef]
  95. Parker, C.D. Lead–acid battery ES systems for electricity supply networks. J. Power Sources 2001, 100, 18–28. [Google Scholar] [CrossRef]
  96. Lam, L.T.; Louey, R. Development of ultra-battery for hybrid-electric vehicle applications. J. Power Sources 2006, 158, 1140–1148. [Google Scholar] [CrossRef]
  97. Cho, J.; Jeong, S.; Kim, Y. Commercial and research battery technologies for electrical ES applications. Prog. Energy Combust. Sci. 2015, 48, 84–101. [Google Scholar] [CrossRef]
  98. Poullikkas, A. A comparative overview of large-scale battery systems for electricity storage. Renew. Sustain. Energy Rev. 2013, 27, 778–788. [Google Scholar] [CrossRef]
  99. Goncalves-Lacerda, V.; Barbosa-Mageste, A.; Boggione-Santos, I.J.; Henrique-Mendes, L. Separation of Cd and Ni from NiCd batteries by an environmentally safe methodology employing aqueous two-phase systems. J. Power Sources 2009, 193, 908–913. [Google Scholar] [CrossRef]
  100. Avril, S.; Arnaud, G.; Florentin, A.; Vinard, M. Multi-objective optimization of batteries and hydrogen storage technologies for remote photovoltaic systems. Energy 2010, 35, 5300–5308. [Google Scholar] [CrossRef]
  101. Connolly, D.; Lund, H.; Mathiesen, B.V.; Leahy, M. The first step towards a 100% renewable energy system for Ireland. Appl. Energy 2011, 88, 502–507. [Google Scholar] [CrossRef]
  102. Kawakami, N.; Iijima, Y.; Sakanaka, Y.; Fukuhara, M.; Ogawa, K.; Bando, M. Development and Field Experiences of Stabilization System Using 34 MW NAS Batteries for a 51 MW Wind Farm. In Proceedings of the 2010 IEEE International Symposium on Industrial Electronics, Bari, Italy, 4–7 July 2010. [Google Scholar]
  103. Yuan, Y.; Zhang, X.; Ju, P.; Qian, K.; Fu, Z. Applications of battery ES system for wind power dispatchability purpose. Electr. Power Syst. Res. 2012, 93, 54–60. [Google Scholar] [CrossRef]
  104. Sebastián, R.; Peña-Alzola, R. Simulation of an isolated wind diesel system with battery ES. Electr. Power Syst. Res. 2001, 81, 677–686. [Google Scholar] [CrossRef]
  105. Wen, Z.; Cao, J.; Gu, Z.; Xu, X.; Zhang, F.; Lin, Z. Research on sodium sulfur battery for ES. Solid State Ionics 2008, 179, 1697–1701. [Google Scholar] [CrossRef]
  106. Doughty, D.H.; Butler, P.C.; Akhil, A.A.; Clark, N.H.; Boyes, J.D. Batteries for large-scale stationary electrical ES. Electrochem. Soc. Interface 2010, 19, 49–53. [Google Scholar] [CrossRef] [Green Version]
  107. Dunn, B.; Kamath, H.; Tarascon, J.-M. Electrical ES for the grid: A battery of choices. Science 2011, 334, 928–935. [Google Scholar] [CrossRef] [Green Version]
  108. Armand, M.; Tarascon, J.M. Building better batteries. Nature 2008, 451, 652–657. [Google Scholar] [CrossRef]
  109. Nazri, G.A.; Pistoia, G.F. (Eds.) Lithium Batteries: Science and Technology; Science and Business Media: New York, NY, USA, 2009. [Google Scholar]
  110. Cai, X.; Lai, L.; Shen, Z.; Lin, J. Graphene and graphene-based composites as Li-ion battery electrode materials and their application in full cells. J. Mater. Chem. A 2017, 5, 15423–15446. [Google Scholar] [CrossRef]
  111. Jiao, L.; Liu, Z.; Sun, Z.; Wu, T.; Gao, Y.; Li, H.; Li, F.; Niu, L. An advanced lithium ion battery based on a high quality graphitic graphene anode and a Li [Ni0.6 Co0.2 Mn0.2]O2 cathode. Electrochim. Acta 2018, 259, 48–55. [Google Scholar] [CrossRef]
  112. Arora, P.; Zhang, Z. Battery Separators. Chem. Rev. 2004, 104, 4419–4468. [Google Scholar] [CrossRef]
  113. Smith, K.; Wang, C.Y. Solid-state diffusion limitations on pulse operation of a lithium ion cell for hybrid electric vehicles. J. Power Sources 2006, 161, 628–639. [Google Scholar] [CrossRef]
  114. Hall, C. Future Batteries, Coming Soon: Charge in Seconds, Last Months and Power over the Air, Pocket, 22 March 2021. Available online: https://www.pocket-lint.com/gadgets/news/130380-future-batteries-coming-soon-charge-in-seconds-last-months-and-power-over-the-air (accessed on 6 June 2021).
  115. Michaelides, E.E. Thermodynamics and Energy Consumption of Electric Vehicles. Energy Convers. Manag. 2019, 203, 112246. [Google Scholar] [CrossRef]
  116. Lowy, J. Feds Urge Airlines to Ban Laptops in Checked Bags, Citing Fire, Explosion Risk; Associate Press: New York, NY, USA, 2017. [Google Scholar]
  117. Ellabban, O.; Abu-Rub, H.; Blaabjerg, F. Renewable energy resources: Current status, future prospects and their enabling technology. Renew. Sustain. Energy Rev. 2014, 39, 748–764. [Google Scholar] [CrossRef]
  118. Luo, X.; Wang, J.; Dooner, M.; Clarke, J. Overview of current development in electrical ES technologies and the application potential in power system operation. Appl. Energy 2015, 137, 511–536. [Google Scholar] [CrossRef] [Green Version]
  119. Son, I.H.; Park, J.H.; Park, S.; Park, K.; Han, S.; Shin, J.; Doo, S.G.; Hwang, Y.; Chang, H.; Choi, J.W. Graphene balls for lithium rechargeable batteries with fast charging and high volumetric energy densities. Nat. Commun. 2017, 8, 1516. [Google Scholar]
  120. International Electrotechnical Commission (IEC); Electrical ES: Geneva, Switzerland, 2011.
  121. Leadbetter, J.; Swan, L.G. Selection of battery technology to support grid- integrated renewable electricity. J. Power Sources 2012, 216, 376–386. [Google Scholar] [CrossRef]
  122. Chakrabarti, M.H.; Pelham, E.; Lindfield, R.; Bae, C.; Saleem, M. Ruthenium based redox flow battery for solar ES. Energy Conv. Manag. 2001, 52, 2501–2508. [Google Scholar] [CrossRef]
  123. Huang, K.-L.; Li, X.-G.; Liu, S.-Q.; Tan, N.; Chen, L.-Q. Research progress of vanadium redox flow battery for energys torage in China. Renew. Energy 2008, 33, 186–192. [Google Scholar] [CrossRef]
  124. Choi, C.; Kim, S.; Kim, R.; Choi, Y.; Kim, S.; Jung, H.Y.; Yang, J.H.; Kim, H.T. A review of vanadium electrolytes for vanadium redox flow batteries. Renew. Sustain. Energy Rev. 2017, 69, 263–274. [Google Scholar] [CrossRef]
  125. Akinyele, D.; Belikov, J.; Levron, Y. Battery storage technologies for electrical applications: Impact in stand-alone photovoltaic systems. Energies 2017, 10, 1760. [Google Scholar] [CrossRef] [Green Version]
  126. Ponce-de-León, C.; Frías-Ferrer, A.; González-García, J.; Szánto, D.A.; Walsh, F.C. Redox flow cells for energy conversion. J. Power Sources 2006, 160, 716–732. [Google Scholar] [CrossRef] [Green Version]
  127. Lex, P.; Jonshagen, B. The zinc bromine battery system for utility and remote area applications. Power Eng. J. 1999, 13, 142–148. [Google Scholar] [CrossRef]
  128. Arenas, L.F.; Loh, A.; Trudgeon, D.P.; Li, X.; Ponce de León, C.; Walsh, F.C. The characteristics and performance of hybrid redox flow batteries with zinc negative electrodes for ES. Renew. Sustain. Energy Rev. 2018, 90, 992–1016. [Google Scholar] [CrossRef] [Green Version]
  129. Scamman, D.P.; Gavin, W.R.; Roberts, E.P.L. Numerical modelling of a bromide—polysulphide redox flow battery. Part 1: Modelling approach and validation for a pilot-scale system. J. Power Sources 2009, 189, 1220–1230. [Google Scholar] [CrossRef]
  130. Rydh, C.J. Environmental assessment of vanadium redox and lead—acid bat-teries for stationary ES. J. Power Sources 1999, 80, 21–29. [Google Scholar] [CrossRef]
  131. Aditya, S.K.; Das, D. Battery ES for load frequency control of an interconnected power system. Electr. Power Syst. Res. 2001, 58, 179–185. [Google Scholar] [CrossRef]
  132. Koohi-Kamali, S.; Tyagi, V.V.; Rahim, N.A.; Panwar, N.L.; Mokhlis, H. Emergence of ES technologies as the solution for reliable operation of smart power systems: A review. Renew. Sustain. Energy Rev. 2013, 25, 135–165. [Google Scholar] [CrossRef]
  133. Wang, W.; Luo, Q.; Li, B.; Wei, X.; Li, L.; Yang, Z. Recent progress in redox flow battery research and development. Adv. Funct. Mater. 2013, 23, 970–986. [Google Scholar] [CrossRef]
  134. Hartikainen, T.; Mikkonen, R.; Lehtonen, J. Environmental advantages of super- conducting devices in distributed electricity-generation. Appl. Energy 2007, 84, 29–38. [Google Scholar] [CrossRef]
  135. Leung, P.; Li, X.; Ponce De León, C.; Berlouis, L.; Low, C.T.J.; Walsh, F.C. Progress in redox flow batteries, remaining challenges and their applications in ES. RSC Adv. 2012, 2, 10125–10256. [Google Scholar] [CrossRef]
  136. Skyllas-Kazacos, M.; Chakrabarti, M.H.; Hajimolana, S.A.; Mjalli, F.S.; Saleem, M. Progress in flow battery research and development. J. Electrochem. Soc. 2011, 158, R55–R79. [Google Scholar] [CrossRef]
  137. Uhrig, M.; Koenig, S.; Suriyah, M.R.; Leibfried, T. Lithium-based vs. vanadium redox flow batteries—A comparison for home storage systems. Energy Procedia 2016, 99, 35–43. [Google Scholar] [CrossRef] [Green Version]
  138. Available online: https://www.renogy.com/deep-cycle-agm-battery-12-volt-200ah/ (accessed on 11 August 2021).
  139. Trócoli, R.; Morata, A.; Erinmwingbovo, C.; La Mantia, F.; Tarancó, A. Self-discharge in Li-ion aqueous batteries: A case study on LiMn2O4. Electrochim. Acta 2021, 373, 137847. [Google Scholar] [CrossRef]
  140. Chung, S.H.; Manthiram, A. Lihium–Sulfur Batteries with the Lowest Self-Discharge and the Longest Shelf life. ACS Energy Lett. 2017, 2, 1056–1061. [Google Scholar] [CrossRef]
  141. Battery University. What Does Elevated Self-Discharge Do? 2021. Available online: https://batteryuniversity.com/learn/article/elevating_self_discharge (accessed on 21 June 2021).
  142. Bajpai, P.; Dash, V. Hybrid renewable energy systems for power generation in stand-alone applications: A review. Renew. Sustain. Energy Rev. 2012, 16, 2926–2939. [Google Scholar] [CrossRef]
  143. Li, N.; Uckun, C.; Constantinescu, E.M.; Birge, J.R.; Hedman, K.W.; Botterud, A. Flexible Operation of Batteries in Power System Scheduling with Renewable Energy. IEEE Trans. Sustain. Energy 2016, 7, 685–696. [Google Scholar] [CrossRef]
  144. Seong, W.M.; Park, K.Y.; Lee, M.W.; Moon, S.; Oh, K.; Park, H.; Lee, S.; Kang, K. Abnormal self-discharge in lithium-ion batteries. Energy Environ. Sci. 2018, 11, 970–978. [Google Scholar]
  145. DeValeria, M.K.; Michaelides, E.E.; Michaelides, D.N. Energy and Thermal Storage in Clusters of Grid-Independent Buildings. Energy 2019, 190, 116440. [Google Scholar] [CrossRef]
  146. Cusenza, M.A.; Guarino, F.; Longo, S.; Mistretta, M.; Cellura, M. Reuse of Electric Vehicle Batteries in Buildings: An Integrated Load Match Analysis and Life Cycle Assessment Approach. Energy Build. 2019, 186, 339–354. [Google Scholar] [CrossRef]
  147. Harper, G.; Sommerville, R.; Kendrick, E.; Driscoll, L.; Slater, P.; Stolkin, R.; Walton, A.; Christensen, P.; Heidrich, O.; Lambert, S.; et al. Recycling Lithium-Ion Batteries from Electric Vehicles. Nature 2019, 575, 75–86. [Google Scholar] [CrossRef] [Green Version]
  148. Mossali, E.; Picone, N.; Gentilini, L.; Rodrìguez, O.; Pérez, J.M.; Colledani, M. Lithium-Ion Batteries towards Circular Economy: A., Literature Review of Opportunities and Issues of Recycling Treatments. J. Environ. Manag. 2020, 264, 110500. [Google Scholar] [CrossRef]
  149. Faessler, B. Stationary, Second Use Battery ES Systems and Their Applications: A Research Review. Energies 2021, 14, 2335. [Google Scholar] [CrossRef]
  150. Bockris, J.O. The Origin of Ideas on a Hydrogen Economy and Its Solution to the Decay of the Environment. Intern. J. Hydrog. Energy 2002, 27, 731–740. [Google Scholar] [CrossRef]
  151. Rifkin, J. The Hydrogen Economy: The Creation of the Worldwide Energy Web and the Redistribution of Power on Earth; Tarcher/Penguin: New York, NY, USA, 2003. [Google Scholar]
  152. Moran, M.J.; Shapiro, H.N. Fundamentals of Engineering Thermodynamics, 6th ed.; Wiley: New York, NY, USA, 2004. [Google Scholar]
  153. Anderson, J.; Greonkvist, S. Large-scale storage of hydrogen. Int. J. Hydrogen Energy 2019, 44, 11901–11919. [Google Scholar] [CrossRef]
  154. Mazloomi, K.; Sulaiman, N.; Moayedi, H. Review—Electrical Efficiency of Electrolytic Hydrogen Production. Int. J. Electrochem. Sci. 2012, 7, 3314–3326. [Google Scholar]
  155. Mao, Y.; Gao, Y.; Dong, W.; Wu, H.; Song, Z.; Zhao, X.; Sun, J.; Wang, W. Hydrogen production via a two-step water splitting thermochemical cycle based on metal oxide—A review. Appl. Energy 2020, 267, 114860. [Google Scholar] [CrossRef]
  156. Wang, M.; Zuo, Y.; Wang, J.; Wang, Y.; Shen, X.; Qiu, B.; Cai, L.; Zhou, F.; Lau, S.P.; Chai, Y. Remarkably Enhanced Hydrogen Generation of Organolead Halide Perovskites via Piezocatalysis and Photocatalysis. Adv. Energy Mater. 2019, 9, 1901801. [Google Scholar] [CrossRef]
  157. Salam, M.K.; Ahmed, K.; Akter, N.; Hossain, T.; Abdullah, B. A review of hydrogen production via biomass gasification and its prospect in Bangladesh. Int. J. Hydrogen Energy 2018, 43, 14944–14973. [Google Scholar] [CrossRef]
  158. Kadier, A.; Simayi, Y.; Abdeshahian, P.; Farhana-Azman, N.; Chandrasekhar, K.; Sahaid-Kalil, M. A comprehensive review of microbial electrolysis cells (MEC) reactor designs and configurations for sustainable hydrogen gas production. Alex. Eng. J. 2016, 55, 427–443. [Google Scholar] [CrossRef] [Green Version]
  159. Liu, H.; Grot, S.; Logan, B.E. Electrochemically assisted microbial production of hydrogen from acetate. Environ. Sci. Technol. 2005, 39, 4317–4320. [Google Scholar] [CrossRef]
  160. Cheng, J.; Zhang, V.; Chen, G.; Zhang, Y. Study of IrxRu1-xO2 oxides as anodic electrocatalysts for solid polymer electrolyte water electrolysis. Electrochim. Acta 2009, 54, 6250–6256. [Google Scholar] [CrossRef]
  161. Nikolaidis, P.; Poullikkas, A. A comparative overview of hydrogen production processes. Renew. Sustain. Energy Rev. 2017, 67, 597–611. [Google Scholar] [CrossRef]
  162. Jua, H.K.; Badwalb, S.; Giddey, S. A comprehensive review of carbon and hydrocarbon assisted water electrolysis for hydrogen production. Appl. Energy 2018, 231, 502–533. [Google Scholar] [CrossRef]
  163. Gillette, J.; Kolpa, R. Overview of Interstate Hydrogen Pipeline Systems. Argonne National Laboratory Report 2007; ANL: Chicago, IL, USA, 2007. [Google Scholar]
  164. Ball, M.; Weeda, M. The hydrogen economy—Vision or reality? Int. J. Hydrogen Energy 2015, 40, 7903–7919. [Google Scholar] [CrossRef]
  165. Ren, J.; Musyoka, N.M.; Langmi, H.W.; Mathe, M.; Liao, S. Current research trends and perspectives on materials-based hydrogen storage solutions: A critical review. Int. J. Hydrogen Energy 2017, 42, 289–311. [Google Scholar] [CrossRef]
  166. Lai, Q.; Paskevicius, M.; Sheppard, D.A.; Buckley, C.; Thornton, A.; Hill, M.; Gu, Q.; Mao, J.; Huang, Z.; Liu, H.K.; et al. Hydrogen Storage Materials for Mobile and Stationary Applications: Current State of the Art. ChemSusChem 2015, 8, 2789–2825. [Google Scholar] [CrossRef]
  167. BEUC. Low Carbon Cars in the 2020s: Consumer Impacts and EU Policy Implications; Bureau Européen des Unions de Consommateurs: Brussells, Belgium, 2016. [Google Scholar]
  168. Fuel Cell Electric Vehicles, Alternative Fuels Data Center; US Department of Energy, EERE, 2021. Available online: https://afdc.energy.gov/vehicles/fuel_cell.html (accessed on 24 September 2011).
  169. Shiva-Kumar, S.; Himabindu, V. Hydrogen production by PEM water electrolysis—A review. Mater. Sci. Energy Technol. 2019, 2, 442–454. [Google Scholar] [CrossRef]
  170. Fekete, J.R.; Sowards, J.W.; Amaro, R.L. Economic impact of applying high strength steels in hydrogen gas pipelines. Int. J. Hydrogen Energy 2015, 40, 10547–10558. [Google Scholar] [CrossRef] [Green Version]
  171. Cardella, U.; Decker, L.; Klein, H. Roadmap to economically viable hydrogen liquefaction. Int. J. Hydrogen Energy 2017, 42, 13329–13338. [Google Scholar] [CrossRef]
  172. Krasae-in, S.; Stang, J.H.; Neksa, P. Development of large-scale hydrogen liquefaction processes from 1898 to 2009. Int. J. Hydrogen Energy 2010, 35, 4524–4533. [Google Scholar] [CrossRef]
  173. Wilhelmsen, O.; Berstad, D.; Aasen, A.; Neksa, P.; Skaugen, G. Reducing the exergy destruction in the cryogenic heat exchangers of hydrogen liquefaction processes. Int. J. Hydrogen Energy 2018, 43, 5033–5047. [Google Scholar] [CrossRef] [Green Version]
  174. Xia, Y.D.; Yang, Z.X.; Zhu, Y.Q. Porous carbon-based materials for hydrogen storage: Advancement and challenges. J. Mater. Chem. 2013, 1, 9365–9381. [Google Scholar] [CrossRef]
  175. Blankenship, I.I.T.S.; Balahmar, N.; Mokaya, R. Oxygen-rich microporous carbons with exceptional hydrogen storage capacity. Nat. Commun. 2017, 8, 1545. [Google Scholar] [CrossRef] [Green Version]
  176. Crivello, J.C.; Dam, B.; Denys, R.V.; Dornheim, M.; Grant, D.M.; Huot, J.; Jensen, T.R.; de Jongh, P.; Latroche, M.; Milanese, C.; et al. Review of magnesium hydride-based materials: Development and optimisation. Appl. Phys. Mater. Sci Process. 2016, 122, 97. [Google Scholar] [CrossRef] [Green Version]
  177. Webb, C.J. A review of catalyst-enhanced magnesium hydride as a hydrogen storage material. J. Phys. Chem. Solids. 2015, 84 (Suppl. C), 96–106. [Google Scholar] [CrossRef]
  178. Shao, H.; He, L.; Lin, H.; Li, H.W. Progress and trends in magnesium-based materials for energy-storage research: A review. Energy Technol. 2018, 6, 445–458. [Google Scholar] [CrossRef] [Green Version]
  179. Graetz, J.; Reilly, J.J.; Yartys, V.A.; Maehlen, J.P.; Bulychev, B.M.; Antonov, V.E.; Tarasov, B.P.; Gabis, I.E. Aluminum hydride as a hydrogen and ES material: Past, present and future. J. Alloys Compd. 2011, 509S, S517–S528. [Google Scholar] [CrossRef]
  180. Graetz, J.; Hauback, B.C. Recent developments in aluminum-based hydrides for hydrogen storage. MRS Bull. 2013, 38, 473–479. [Google Scholar] [CrossRef]
  181. Orimo, S.; Nakamori, Y.; Eliseo, J.R.; Züttel, A.; Jensen, C.M. Complex hydrides for hydrogen storage. Chem. Rev. 2007, 107, 4111–4132. [Google Scholar] [CrossRef]
  182. Møller, K.T.; Sheppard, D.; Ravnsbæk, D.B.; Buckley, C.E.; Akiba, E.; Li, H.-W.; Jensen, T.R. Complex Metal Hydrides for Hydrogen, Thermal and Electrochemical Energy Storage. Energies 2017, 10, 1645. [Google Scholar] [CrossRef] [Green Version]
  183. Liu, Y.; Ren, Z.; Zhang, X.; Jian, N.; Yang, Y.; Gao, M.; Pan, H. Development of catalyst-enhanced sodium alanate as an advanced hydrogen-storage material for mobile applications. Energy Technol. 2018, 6, 487–500. [Google Scholar] [CrossRef]
  184. Ley, M.B.; Meggouh, M.; Moury, R.; Peinecke, K.; Felderhoff, M. Development of hydrogen storage tank systems based on complex metal hydrides. Materials 2015, 8, 5891–5921. [Google Scholar] [CrossRef]
  185. Gregory DH, Lithium nitrides, imides and amides as lightweight, reversible hydrogen stores. J. Mater. Chem. 2008, 18, 2321–2330. [CrossRef]
  186. Klerke, A.; Christensen, C.H.; Nørskov, J.K.; Vegge, T. Ammonia for hydrogen storage: Challenges and opportunities. J. Mater. Chem. 2008, 18, 2304–2310. [Google Scholar] [CrossRef]
  187. Pfromm, P.H. Towards sustainable agriculture: Fossil-free ammonia. J. Renew. Sustain. Energy 2017, 9, 034702. [Google Scholar] [CrossRef] [Green Version]
  188. Muller, K.; Brooks, K.; Autrey, T. Hydrogen storage in formic acid: A comparison of process options. Energy Fuels 2017, 31, 12603–12611. [Google Scholar] [CrossRef]
  189. Grasemann, M.; Laurenczy, G. Formic acid as a hydrogen source-recent developments and future trends. Energy Env. Sci. 2012, 5, 8171–8181. [Google Scholar] [CrossRef]
  190. Goeppert, A.; Czaun, M.; Jones, J.P.; Surya Prakash, G.K.; Olah, G.A. Recycling of carbon dioxide to methanol and derived products-closing the loop. Chem. Soc. Rev. 2014, 43, 7995–8048. [Google Scholar] [CrossRef]
  191. Pontzen, F.; Liebner, W.; Gronemann, V.; Rothaemel, M.; Ahlers, B. CO2-based methanol and DME-Efficient technologies for industrial scale production. Catal. Today 2011, 171, 242–250. [Google Scholar] [CrossRef]
  192. Kenisarin, M.M.; Mahkamov, K. Solar ES using phase change materials. Renew. Sustain. Energy Rev. 2007, 11, 1913–1965. [Google Scholar] [CrossRef]
  193. Sharma, S.D.; Sagara, K. Latent heat storage materials and systems: A review. Int. J. Green Energy 2003, 2, 1–56. [Google Scholar] [CrossRef]
  194. Zalba, B.; Marín, J.M.; Cabeza, L.F.; Mehling, H. Review on thermal ES with phase change: Materials, heat transfer analysis and applications. Appl. Therm. Eng. 2003, 23, 251–283. [Google Scholar] [CrossRef]
  195. Keenan, J.H. A Steam Chart for Second Law Analysis. A Study of Thermodynamics Availability in a Steam Power Plant. Mech. Eng. 1932, 54, 195–204. [Google Scholar]
  196. Kestin, J. Availability—The Concept and Associated Terminology. Energy-Int. J. 1980, 5, 679–692. [Google Scholar] [CrossRef] [Green Version]
  197. Ahrendts, J. Reference States. Energy-Int. J. 1980, 5, 667–677. [Google Scholar] [CrossRef]
  198. Burgaleta, J.I.; Arias, S.; Ramirez, D. Gemasolar, the First Tower Thermosolar Commercial Plant with Molten Salt Storage. In Proceedings of the SolarPACES Congress, Granada, Spain, 20–23 September 2011. [Google Scholar]
  199. Relloso, S.; Gutierrez, Y. Real Application of Molten Salt Thermal Storage to Obtain High Capacity Factors in Parabolic Trough Plants. In Proceedings of the SolarPACES Congress, Las Vegas, NV, USA, 4–7 March 2008. [Google Scholar]
  200. Olaso, J.; Ortega, J.I. Solar Power Dispatchability through Thermal storage—Solar TRES. In Proceedings of the SolarPACES Congress, Las Vegas, NV, USA, 4–7 March 2008. [Google Scholar]
  201. Denholm, P.; King, J.C.; Kutcher, C.F.; Wilson, P.P.H. Decarbonizingtheelectric sector: Combining renewable and nuclear energy using thermal storage. Energy Policy 2012, 44, 301–311. [Google Scholar] [CrossRef]
  202. Deng, T.; Tian, L.; Liu, J. Spatial and temporal multiscale analysis on ES in heat supply units’ boiler and heat supply nets. Proc. CSEE 2017, 37, 599–606. [Google Scholar]
  203. Wang, L.; Yu, S.; Kong, F.; Sun, X.; Zhou, Y.; Zhong, W.; Lin, X. A study on ES characteristics of industrial steam heating system based on dynamic modeling. Energy Rep. 2020, 6, 190–198. [Google Scholar] [CrossRef]
  204. Deng, T.; Tian, L.; Liu, J. A control method of heat supply units for improving frequency control and peak load regulation ability with thermal storage in heat supply net. Proc. CSEE 2015, 35, 3626–3633. [Google Scholar]
  205. Lund, H.; Werner, S.; Wiltshire, R.; Svendsen, S.; Thorsen, J.E.; Hvelplund, F.; Mathiesen, B.V. 4th generation district heating (4GDH). Integrating smart thermal grids into future sustainable energy systems. Energy 2014, 68, 1–11. [Google Scholar] [CrossRef]
  206. Wang, H.; Meng, H. Improved thermal transient modeling with new 3-order numerical solution for a district heating network with consideration of the pipe wall’s thermal inertia. Energy 2018, 160, 171–183. [Google Scholar] [CrossRef]
  207. Pintaldi, S.; Perfumo, C.; Sethuvenkatraman, S.; White, S.; Rosengarten, G. A review of thermal ES technologies and control approaches for solar cooling. Renew. Sustain. Energy Rev. 2015, 41, 975–995. [Google Scholar] [CrossRef]
  208. Eicker, U.; Pietruschka, D. Design and performance of solar powered absorption cooling systems in office buildings. Energy Build. 2009, 41, 81–91. [Google Scholar] [CrossRef]
  209. Yabase, H.; Makita, K. Steam Driven Triple Effect Absorption Solar Cooling System. In Proceedings of the International Refrigeration and Air Conditioning Conference, Paper 1272; Purdue: Lafayette, IN, USA, 2012. [Google Scholar]
  210. Kuravi, S.; Trahan, J.; Goswami, D.Y.; Rahman, M.M.; Stefanakos, E.K. Thermal ES technologies and systems for concentrating solar power plants. Prog. Energy Combustion Sci. 2013, 39, 285–319. [Google Scholar] [CrossRef]
  211. Lu, Z.S.; Wang, R.Z.; Xia, Z.Z.; Lu, X.R.; Yang, C.B.; Ma, Y.C. Study of a novel solar adsorption cooling system and a solar absorption cooling system with new CPC collectors. Renew. Energy 2013, 50, 299–306. [Google Scholar] [CrossRef]
  212. Li, Z.; Sumathy, K. Experimental studies on a solar powered air conditioning system with partitioned hot water storage tank. Sol. Energy 2001, 71, 285–297. [Google Scholar] [CrossRef]
  213. Calise, F. High temperature solar heating and cooling systems for different Mediterranean climates: Dynamic simulation and economic assessment. Appl. Therm. Eng. 2012, 32, 108–124. [Google Scholar] [CrossRef]
  214. Kousksou, T.; Bruel, P.; Jamil, A.; El Rhafiki, T.; Zeraouli, Y. ES: Applications and challenges. Sol. Energy Mater. Sol. Cells 2014, 120, 59–80. [Google Scholar] [CrossRef]
  215. Pinel, P.; Cruickshank, C.A.; Beausoleil-Morrison, I.; Wills, A. A review of available methods for seasonal storage of solar thermal energy in residential applications. Renew. Sustain. Energy Rev. 2011, 15, 3341–3359. [Google Scholar]
  216. Sharma, A.; Tyagi, V.V.; Chen, C.R.; Buddhi, D. Review on thermal ES with phase change materials and applications. Renew. Sustain. Energy Rev. 2009, 13, 318–345. [Google Scholar] [CrossRef]
  217. Gil, A.; Oró, E.; Peiró, G.; Álvarez, S.; Cabeza, L.F. Material selection and testing for thermal ES in solar cooling. Renew. Energy 2013, 57, 366–371. [Google Scholar] [CrossRef]
  218. Hodapp, R.T. Dallas/Fort Worth International Airport District Energy Plant Upgrades Project—Making More with Less. In Proceedings of the Sustainable Communities Conference, Dallas, TX, USA, 18–20 March 2009. [Google Scholar]
  219. IEA. 2021. Available online: https://www.iea.org/topics/buildings (accessed on 21 July 2021).
  220. Gottschall, T.; Gràcia-Condal, A.; Fries, M.; Taubel, A.; Pfeuffer, L.; Mañosa, L.; Planes, A.; Skokov, K.P.; Gutfleisch, O. A multicaloric cooling cycle that exploits thermal hysteresis. Nat. Mater. 2018, 17, 929–934. [Google Scholar] [CrossRef] [PubMed]
  221. Hess, T.; Maier, L.M.; Bachmann, N.; Corhan, P.; Schäfer-Welsen, O.; Wöllenstein, J.; Bartholomé, K. Thermal hysteresis and its impact on the efficiency of first-order caloric materials. J. Appl. Phys. 2020, 127, 075103. [Google Scholar] [CrossRef]
  222. Rodionov, V.; Amirov, A.; Annaorazov, M.; Lähderanta, E.; Granovsky, A.; Aliev, A.; Rodionova, V. Thermal Hysteresis Control in Fe49Rh51 Alloy through Annealing Process. Processes 2021, 9, 772. [Google Scholar] [CrossRef]
  223. Wen, D.S.; Chen, H.S.; Ding, Y.L.; Dearman, P. Liquid nitrogen injection into water: Pressure build-up and heat transfer. Cryogenics 2006, 46, 740–748. [Google Scholar] [CrossRef]
  224. Knowlen, C.; Williams, J.; Mattick, A.T.; Deparis, H.; Hertzberg, A. Quasi-Isothermal Expansion Engines for Liquid Nitrogen Automotive Propulsion. SAE Tech. Pap. Ser. 1997. [Google Scholar] [CrossRef] [Green Version]
  225. Knowlen, C.; Mattick, A.T.; Bruckner, A.P.; Hertzberg, A. High Efficiency Energy Conversion Systems for Liquid Nitrogen Automobiles. SAE Tech. Pap. Ser. 1998. [Google Scholar] [CrossRef] [Green Version]
  226. Tatsidjodoung, P.; le Pierrès, N.; Luo, L. A review of potential materials for thermal ES in building applications. Renew. Sustain. Energy Rev. 2013, 18, 327–349. [Google Scholar] [CrossRef]
  227. Pan, Z.H.; Zhao, C.Y. Gasesolid thermochemical heat storage reactors for high-temperature applications. Energy 2017, 130, 155–173. [Google Scholar] [CrossRef]
  228. André, L.; Abanades, S. Recent Advances in Thermochemical ES via Solid–Gas Reversible Reactions at High Temperature. Energies 2020, 13, 5859. [Google Scholar] [CrossRef]
  229. Zhou, X.; Mahmood, M.; Chen, J.; Yang, T.; Xiao, G.; Ferrari, M.L. Validated model of thermochemical energy storage based on cobalt oxides. Appl. Therm. Eng. 2019, 159, 113965. [Google Scholar] [CrossRef]
  230. Abedin, A.H.; Rosen, M.A. A critical review of thermochemical ES systems. Open Renew. Energy J. 2011, 4, 42–46. [Google Scholar] [CrossRef] [Green Version]
  231. Cot-Gores, J.; Castell, A.; Cabeza, L.F. Thermochemical ES and conversion: A-state-of-the-art review of the experimental research under practical conditions. Renew. Sustain. Energy Rev. 2012, 16, 5207–5224. [Google Scholar] [CrossRef]
  232. Zsembinszki, G.; Solé, A.; Barreneche, C.; Prieto, C.; Fernández, A.; Cabeza, L. Review of Reactors with Potential Use in Thermochemical ES in Concentrated Solar Power Plants. Energies 2018, 11, 2358. [Google Scholar] [CrossRef] [Green Version]
  233. Hartlieb, P.; Toifl, M.; Kuchar, F.; Meisels, R.; Antretter, T. Thermo-physical properties of selected hard rocks and their relation to microwave-assisted comminution. Miner. Eng. 2016, 91, 34–41. [Google Scholar] [CrossRef]
  234. Ochsner, K. Geothermal Heat Pumps—A Guide for Planning and Installing; Earthscan: London, UK, 2008. [Google Scholar]
  235. Banks, D. An Introduction to Thermogeology: Ground Source Heating and Cooling, 2nd ed.; Wiley: Chichester, UK, 2012. [Google Scholar]
  236. Sibbitt, B.; Onno, T.; McClenahan, D. The Drake Landing solar community project—Early results. In Proceedings of the 32. annual conference of the Solar Energy Society of Canada and the 2. Canadian Solar Research Network conference, Calgary, AB, Canada, 10–14 June 2007. [Google Scholar]
  237. Sibbitt, B.; McClenahan, D.; Djebbar, R.; Thornton, J.; Wong, B.; Carriere, J.; Kokko, J. The performance of a high solar fraction seasonal storage district heating system–five years of operation. Energy Procedia 2012, 30, 856–865. [Google Scholar] [CrossRef] [Green Version]
  238. Lundh, M.; Dalenbäck, J.O. Swedish solar heated residential area with seasonal storage in rock: Initial evaluation. Renew. Energy 2008, 33, 703–711. [Google Scholar] [CrossRef]
  239. Kjellsson, E.; Hellström, G.; Perers, B. Optimization of systems with the combination of ground-source heat pump and solar collectors in dwellings. Energy 2010, 35, 2667–2673. [Google Scholar] [CrossRef]
  240. Gustafsson, A.-M.; Westerlund, L.; Hellström, G. CFD modelling of natural convection in a groundwater-filled borehole heat exchanger. Appl. Therm. Eng. 2010, 30, 683–691. [Google Scholar] [CrossRef] [Green Version]
  241. Skarphagen, H.; Banks, D.; Frengstad, B.S.; Gether, H. Design Considerations for Borehole Thermal Energy Storage (BTES): A Review with Emphasis on Convective Heat Transfer. Geofluids 2019, 2019, 1–26. [Google Scholar] [CrossRef]
  242. Michaelides, E.E. A New Model for the Lifetime of Fossil Fuel Resources. Nat. Resour. Res. 2017, 26, 161–175. [Google Scholar] [CrossRef]
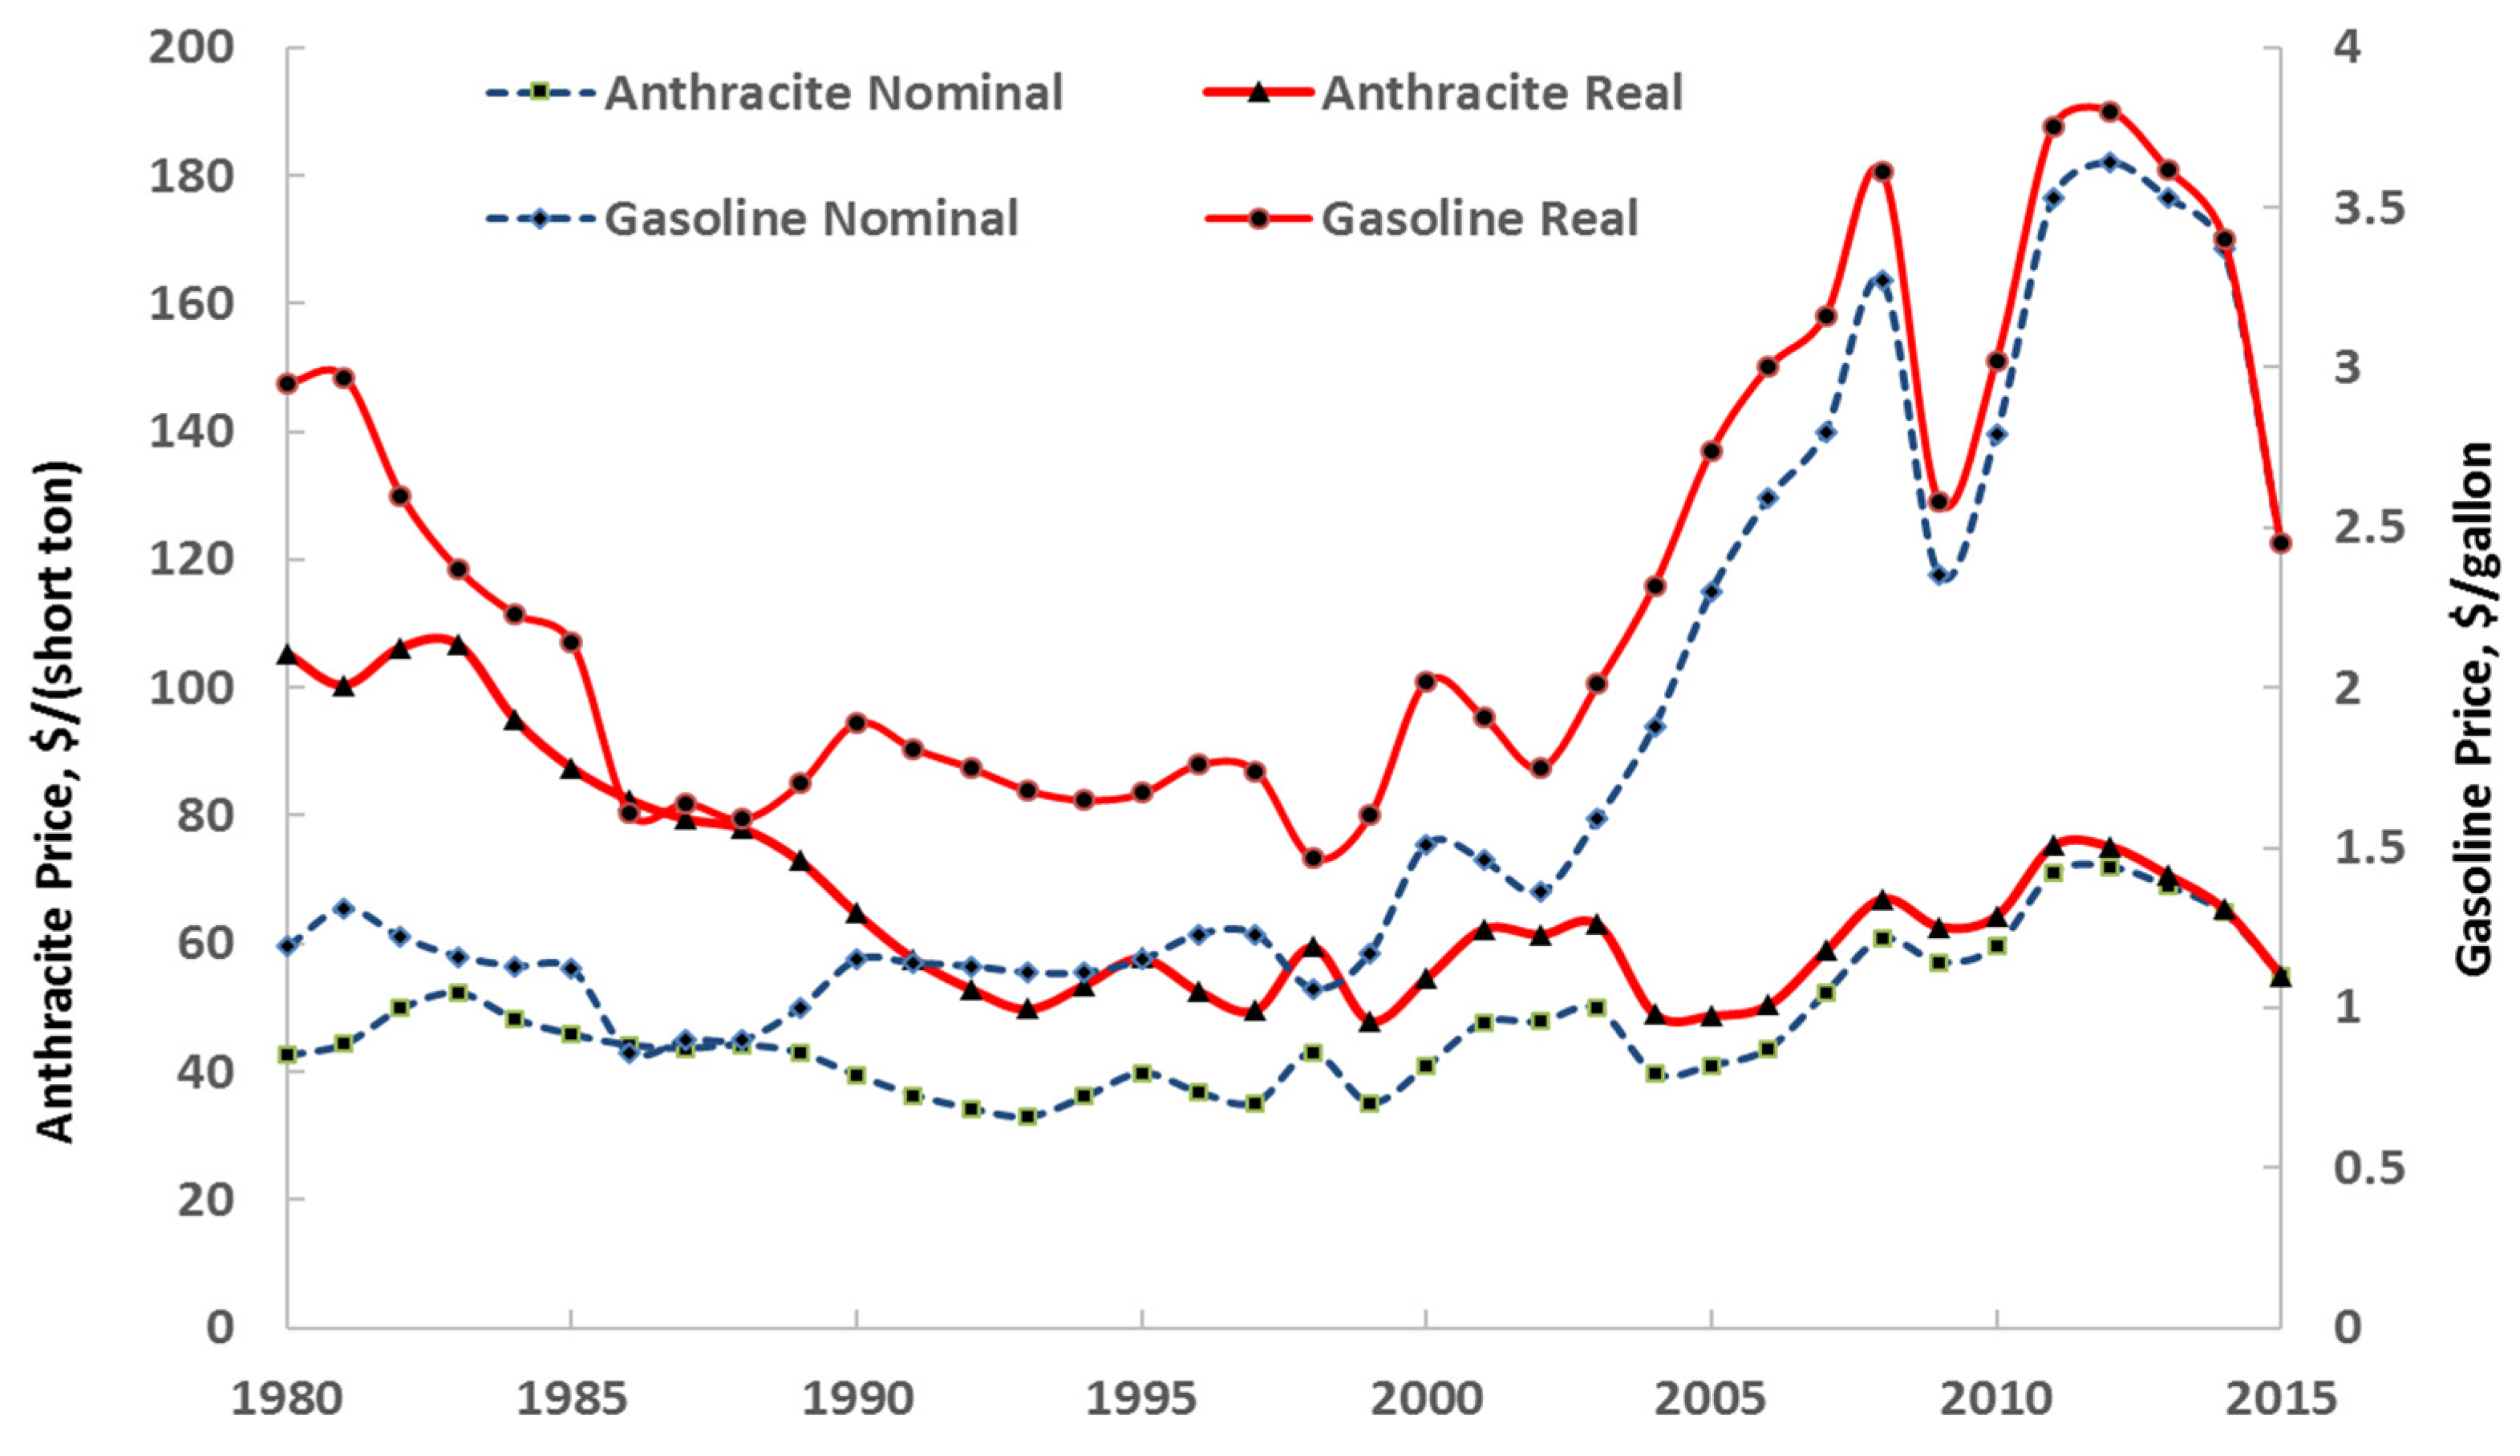
  243. Available online: https://www.energy.gov/eere/vehicles/fact-915-march-7-2016-average-historical-annual-gasoline-pump-price-1929-2015 (accessed on 20 November 2019).
  244. Available online: https://www.eia.gov/totalenergy/data/annual/index.php (accessed on 31 January 2021).
  245. Michaelides, E.E. Thermodynamic Analysis and Power Requirements of CO2 Capture, Transportation, and Storage in the Ocean. Energy 2021, 230, 120804. [Google Scholar] [CrossRef]
  246. Mongird, K.; Viswanathan, V.; Alam, J.; Vartanian, C.; Sprenkle, V.; Baxter, R. 2020 Grid Energy Storage Technology Cost and Performance Assessment; DOE/PA-0204; Pacific Northwest National Laboratory: Seattle WA, USA, 2020. [Google Scholar]
  247. Sander, M.; Gehring, R. LIQHYSMES—A novel ES concept for variable renewable energy sources using hydrogen and SMES. IEEE Trans. Appl. Supercond. 2011, 21, 1362–1366. [Google Scholar] [CrossRef]
  248. Hamajima, T.; Amata, H.; Iwasaki, T.; Atomura, N.; Tsuda, M.; Miyagi, D.; Shintomi, T.; Makida, Y.; Takao, T.; Munakata, K.; et al. Application of SMES and fuel cell system combined with liquid hydrogen vehicle station to renewable energy control. IEEE Trans. Appl. Supercond. 2012, 22, 5701704. [Google Scholar] [CrossRef]
  249. Thounthong, P.; Raël, S.; Davat, B. Control strategy of fuel cell/supercapacitors hybrid power sources for electric vehicle. J. Power Sources 2006, 158, 806–814. [Google Scholar] [CrossRef]
  250. Uzunoglu, M.; Alam, M.S. Dynamic modeling, design, and simulation of a combined PEM fuel cell and ultracapacitor system for stand-alone residential applications. IEEE Trans. Energy Convers 2006, 21, 767–775. [Google Scholar] [CrossRef]
  251. Martinez, M.; Molina, M.G.; Frack, F.; Mercado, P.E. Dynamic modeling, simulation and control of hybrid ES system based on compressed air and supercapacitors. Lat. Am. Trans. IEEE 2013, 11, 466–472. [Google Scholar] [CrossRef]
  252. Barelli, L.; Bidini, G.; Bonucci, F.; Castellini, L.; Castellini, S.; Ottaviano, A.; Pelosi, D.; Zuccari, A. Dynamic analysis of a hybrid ES system (H-ESS) coupled to a photovoltaic (PV) plant. Energies 2018, 11, 396. [Google Scholar] [CrossRef] [Green Version]
  253. Beaman, B.G.; Rao, G.M. Hybrid Battery and Flywheel ES System for LEO Spacecraft. In Proceedings of the Annual Battery Conference on Applications and Devices, Proceeding of the IEEE 13th Annual Battery Conference on Applications and Advances, Long Beach, CA, USA, 16 January 1998; pp. 113–116. [Google Scholar]
  254. Lemofouet, S.; Rufer, A. A Hybrid ES System Based on Compressed Air and Supercapacitors with Maximum Efficiency Point Tracking (MEPT). IEEE Trans. Ind. Electron. 2006, 53, 1105–1115. [Google Scholar] [CrossRef]
Figure 1. The duck curve resulting when the PV-generated electricity reached 10%, 20% and 25% of the annually generated electricity in the San Antonio, Texas region.
Energies 14 06121 g001
Figure 2. Demand-supply mismatches in the ERCOT system during a day in the spring. Significant power surpluses are created at several periods of high winds during the day.
Energies 14 06121 g002
Figure 3. Schematic representation of a PHS.
Energies 14 06121 g003
Figure 4. Schematic diagram of a CAES with a water pond to maintain constant pressure.
Energies 14 06121 g004
Figure 5. Round-trip efficiency of a CAES at 80 bar with variable turbine inlet temperature.
Energies 14 06121 g005
Figure 6. Schematic diagram of the Li-ion cell operation.
Energies 14 06121 g006
Figure 7. Schematic diagram of a flow battery.
Energies 14 06121 g007
Figure 8. Schematic diagram of solar cooling with an absorption refrigeration cycle.
Energies 14 06121 g008
Figure 9. Material with suitable hysteresis for the heating and air conditioning of buildings.
Energies 14 06121 g009
Figure 10. A cyclic heat engine operating with two heat sources: the environment and a cryogenic fluid.
Energies 14 06121 g010
Figure 11. Nominal and real price fluctuations of anthracite and gasoline in the USA. Data from [243] and [244].
Energies 14 06121 g011
Figure 12. Applications and timescales of ES systems.
Energies 14 06121 g012
Table 1. The effect of the height, H, the specific energy, the energy density, the mass flow rate, the volume of water and the mass of water withdrawn after four hours of continuous operation.
Height, H3005001000
Specific energy, kJ/kg2.94.99.8
Energy density, kJ/m3294349059810
Mass flow rate, kg/s39,74123,84511,922
Volume flow rate, m3/s39.723.811.9
Volume for 4 h, m3572,276,767343,366,060171,683,030
Mass for 4 h, kg572,276,767,352343,366,060,41171,683,030,205
Table 2. Dimensions and other characteristics of parallel pipelines that would carry the water for the operation of a 100 MW unit with H = 500 m.
Nominal OD, InchesID, mNumber of PipelinesVelocity, m/sFriction FactorFrictional Loss, MW/kmEfficiency, % per kmEfficiency, 5 km, %
360.762114.750.0321.0590.1259.46
481.01664.900.0251.2293.7572.40
721.52434.350.0191.0197.4087.66
962.03223.670.0120.5599.0595.35
Table 3. Exergy of compressed air at different conditions and exergetic efficiency of the two-stage compression process.
T, KP, barSpecific Energy, kJ/kgEnergy Density, kJ/m3ηex
30060351.424,72253.6
40060366.018,83855.8
50060401.016,40261.1
30080376.035,25152.5
40080390.826,64254.6
50080426.123,05559.5
Table 4. Voltage, charge capacity and specific energy (in kJ/kg and kWh/kg) for several types of Li-ion cells.
CathodeVoltage, VCharge Capacity, A-hr/kgSpecific Energy, kJ/kg (kWh/kg)
LiCoO23.71401865, (0.518)
LiMnO24.01001440, (0.400)
LiFePO43.31201426, (0.396)
Li2FePO4F3.61151490, (0.414)
Table 5. Hydrogen properties relevant to ES [72].
T, KP, barρ, kg/m3Specific EnergyEnergy Density
Gaseous MJ/kgkWh/kgMJ/m3kWh/m3
30010.1118.632.99.62.7
300100.8118.632.995.326.5
3001007.6118.632.9904.4251.2
30020014.4118.632.91707.8474.4
30050030.7118.632.93636.51010.1
30070039.1118.632.94631.71286.6
300100049.2118.632.95839.21622.0
Liquid
20.324170.9118.632.98408.62335.7
Table 6. Thermodynamic properties and round-trip efficiencies of ES systems.
Specific Energy, kJ/kgEnergy Density, MJ/m3Round-Trip Efficiency, %
PHS3–103–1055–75
CAES300–40016–3645–60
Flywheels5–100100–500070–95
Supercapacitors100–750100–22080–95
Superconducting Coils50,000–200,00080,000–240,00090–97
Conventional Batteries70–2000120–160075–90
Flow Batteries500–1000500–100060–85
Hydrogen118,60010–840060–75
Thermal Storage100–1200100–200050–90
Publisher’s Note: MDPI stays neutral with regard to jurisdictional claims in published maps and institutional affiliations.

