Abstract
This paper utilises a two-stage demand response-enabled energy management algorithm for a typical Turkish self-sufficient living space. The proposed energy management model provides an additional gain in line with the goal of self-sufficiency by scheduling flexible loads and energy storage systems at home according to a static time of use tariff. The impact of load scheduling and battery optimisation were evaluated in the scope of self-sufficiency, economic gain and return on investment performances. According to the results, the proposed two-stage structure provided a net saving increase of 9.5% in the one-battery scenario, and it rises to 14% in the design with three batteries. On the other hand, when we inspect the energy management scenarios with the return on investment (ROI) calculations, we see that the single battery system has a higher ROI than the two or three battery systems due to the increased battery cost. Moreover, the ROI value, 13.9% without optimisation, increased to 15.3% in the proposed Home Energy Management System (HEMS) model. As can be seen from this calculation, intelligent management of batteries and flexible loads provided a 10% increase in ROI value.
1. Introduction
Renewable energy transactions have gained significant momentum with climate change concerns and increasing demand for electricity. In this process, energy production generally tends towards decentralised renewable energy sources (RES) from centralised, fossil fuel-based generation plants. On the other hand, in some parts of the world, this trend comes along with the energy industry becoming more liberal and human-centric [1]. With the cheapening of photovoltaic (PV) systems, energy storage solutions and the connection of energy consumer assets, households will become virtual energy system networks with the increase and smart use of distributed energy assets. In the light of these developments, individuals who used to be passive energy users now become active participants in the energy system [2].
It is clear that distributed and local energy communities will become more widespread in the future [3]. However, the large share of intermittent and less predictable renewable sources leads to significant technical challenges. Since generation capacities directly depend on weather conditions, sudden fluctuations in generation affect the stability and power quality of the grid and make supply-demand management more challenging [4,5].
Demand-side participation is a balance mechanism where supply-demand balance is not only the supplier’s responsibility, but the consumers are also actively engaged in it. With the advancement and affordability of Information and Communications Technologies (ICT), bidirectional data exchange in the energy network has increased. Thus, supply and demand mechanisms have become more flexible, and end-users can easily participate in them [6]. The most straightforward incentive-based Demand Side Management (DSM) application is called Time of Use (ToU) tariff, in which the long-term price of electricity is fixed. However, a 24 h day is divided into intervals with different pricing. In addition, Distribution System Operators (DSOs) can offer higher frequency and user-specific smart tariffs for the flexibility they need [7,8].
Active energy users with Distributed Energy Sources (DER), or prosumers, should participate in the DSM incentives and shape their energy use according to these tariffs to maximise their profits or savings. However, these actions are trials that contaminate the user comfort area, are difficult to follow in daily life, and, therefore, can be unsustainable. Either the majority of end-users are unaware of existing DSM mechanisms, or their knowledge level in the energy field is insufficient. Hence, it is not reasonable to expect them to solve such multi-variable optimisation problems [9]. Energy management systems close this gap by automating all distributed energy sources in coordination with each other and revealing the maximum potential of the DERs. Therefore, energy management systems increase self-sufficiency and indirectly help balance the grid and provide support for users to maximise their earnings. Besides, it also enables DERs to be economically affordable and widespread [10,11].
This paper aims to propose a self-sufficient hybrid Home Energy Management System (HEMS) model that meets the energy needs of a typical prosumer household in a self-sufficient manner. The proposed model is designed and developed for a household that has the following features: a roof-top PV system, Tesla Powerwall battery as storage, basic non-shiftable household appliances, shiftable water purifier and an Electric Vehicle. HEMS provides economic and self-sufficiency improvement by scheduling shiftable electricity loads and batteries based on the ToU tariff.
This paper is structured as follows: Section 2 presents a literature review on HEMS. In Section 3, we describe the materials and system of the HEMS architecture and datasets of ODIH as the use case. In Section 4, we specify the hybrid home energy management algorithm methodology. In Section 5, we describe the comparison of methodologies in terms of self-sufficiency and net saving. In Section 6, we present the impact analysis. Section 7 includes the results of the energy optimisation models that we employed. Finally, in Section 8, we present a conclusion and a brief discussion for future work.
2. State of the Art
2.1. Literature Review on Residential Energy Management Systems
Energy management systems have been the focus of attention for many researchers in recent years. A significant amount of research examining many different sub-applications has been conducted on this topic, such as [12,13,14,15]. While the main target of most of the studies is the reduction of cost, some studies also cover DSM, smart Electric Vehicle (EV) charging and community-scale resource management [16,17,18,19,20]. In addition, all studies propose their optimisation methodologies and use case examples.
There are several studies on distributed energy resources management at the residential scale, which also inspired the study. As demonstrated in a study by Chekired et al. [21], the fulfilment of the home energy demand can be compensated by an energy flow management algorithm. This algorithm manages the flow of energy in the house through the combination of four switches. The algorithm aims to produce maximum power from the photovoltaic generator, protect the batteries against overcharge and deep discharge, satisfy the user’s energy needs by avoiding energy shortage and power the grid when there is an excess of energy. To attain these, the four switches used in different operating modes, which reach photovoltaic production, should be utilised as much as possible to reach self-sufficiency. However, the study does not have any battery optimisation in the proposed model.
With the spread of EVs, coordinated EV charging methods have been added to many of the energy management system applications. As in our study, most of the studies approached the EV as a flexibility reserve and provided optimisation by shifting the vehicle charge load to the most appropriate time periods. In the study of Fachrizal and Munkhammar [22], EV smart charging scheme for residential buildings based on installed photovoltaic power output and household electricity consumption was investigated. The smart charging schemes are designed to determine the optimal EV charging schedules to minimise the net load variability and flatten the net load profile. Subsequently, the smart charging schemes optimise net load with uncontrolled charging and reduce peak load. Additionally, it provides increased PV self-consumption in a considered time interval. In fact, the work showed that the energy management for EVs does not consider the energy demand according to the usage of EVs by residents. In addition, the smart charging scheme can be implemented and developed to sustainable and convenient residential’s energy management algorithm.
Thailand has good case practises in terms of HEMS due to its Smart Grid Master Plan [23], which aims at the financial feasibility and attractiveness of installing residential solar roof-top systems with integration of the HEMS and battery systems. According to [24], residential customers benefit from energy by using solar PV systems with HEMS and batteries. The study reached the following results using its system advisor model; residents obtained a lower bill when the HEMS was implemented with a battery system that increased PV self-consumption and reduced the exported amount of excess electricity from a PV system. The study [25] developed a HEMS model that solved a multi-variable energy optimisation problem with different weights of energy cost and peak to average ratio dimensions. The proposed model optimised household energy consumption by combining particle swarm optimisation and binary particle swarm optimisation.
Demand response (DR) solutions for residential houses results in bill savings outcomes. It affects reducing energy consumption and providing renewable energy management. In [26], a hybrid lightning search algorithm (LSA)-based artificial neural network (ANN) was developed to provide a demand response algorithm for home appliances. As a result, the energy-saving for the total power consumption was 9.7% per seven hours without any effect on the comfort level of the end-users. The study was applied to home appliances without considering EVs. The study [27] proposed an EMS model that facilitated the orchestration of DERs and a structure that integrated residences into the DSM market. In the study, genetic algorithm (GA), binary particle swarm optimisation (BPSO), wind-driven optimisation (WDO), bacterial foraging optimisation (BFO) and hybrid GA-PSO (HGPO) algorithms were tested separately on the same case using MATLAB and performance analysis was made.
The paper [28] focuses on an integrative DR study for optimal home energy management based on approximate dynamic programming. In designing the DR mechanism, the paper considers vehicle-to-home (V2H) and vehicle-to-grid (V2G) functions for EV energy storage and the cost of EV battery depletion incurred by V2H/V2G activity. The proposed methodology provides optimum home appliances, energy storage systems (ESS) and V2G/V2H-enabled EVs. The study [29] proposed a quality of experience (QoE)-aware smart appliance control algorithm for the SHEMS for renewable energy sources RES and EVs to reduce peak load and electricity bill while maintaining consumer convenience. By correctly arranging EV charging and discharging, EV batteries can be used to reduce the user’s power bill by controlling grid demand. As a result, developing a QoE-aware smart appliance control algorithm for the SHEMS that considers RES and EV is a must. In fact, the system could have been made according to a demand response by using the users’ time of arrival and departure. This situation shows that the system can be further improved. In [30], the authors proposed a two-stage energy management model that lowers electricity cost and reduces peak consumption using ToU pricing, household power trend, solar production trend and EV profiles. Algorithms stages are divided in terms of the availability of photovoltaic production.
2.2. Progress beyond the State of Art
Our main contribution in this research is to enhance the HEMS algorithm by considering flexible and non-flexible energy management systems, including extensive subsystem studies. The energy management algorithm considers user preferences such as EV departure time or minimum SOC. Another important contribution is the creation of a comprehensive one-year-long hourly data set for the validation of the developed algorithms. The created dataset includes the data of the ODIH project in Turkey, which was selected as a pilot, and the ToU tariff, which is subject to residents in Turkey. Another area of study is self-sufficiency and ROI calculations on battery scaling in the current scenario. Briefly, this paper provides self-sufficient and shiftable HEMS algorithm stages divided into load scheduling and battery scheduling by managing them using nine modes.
3. Materials and System Description
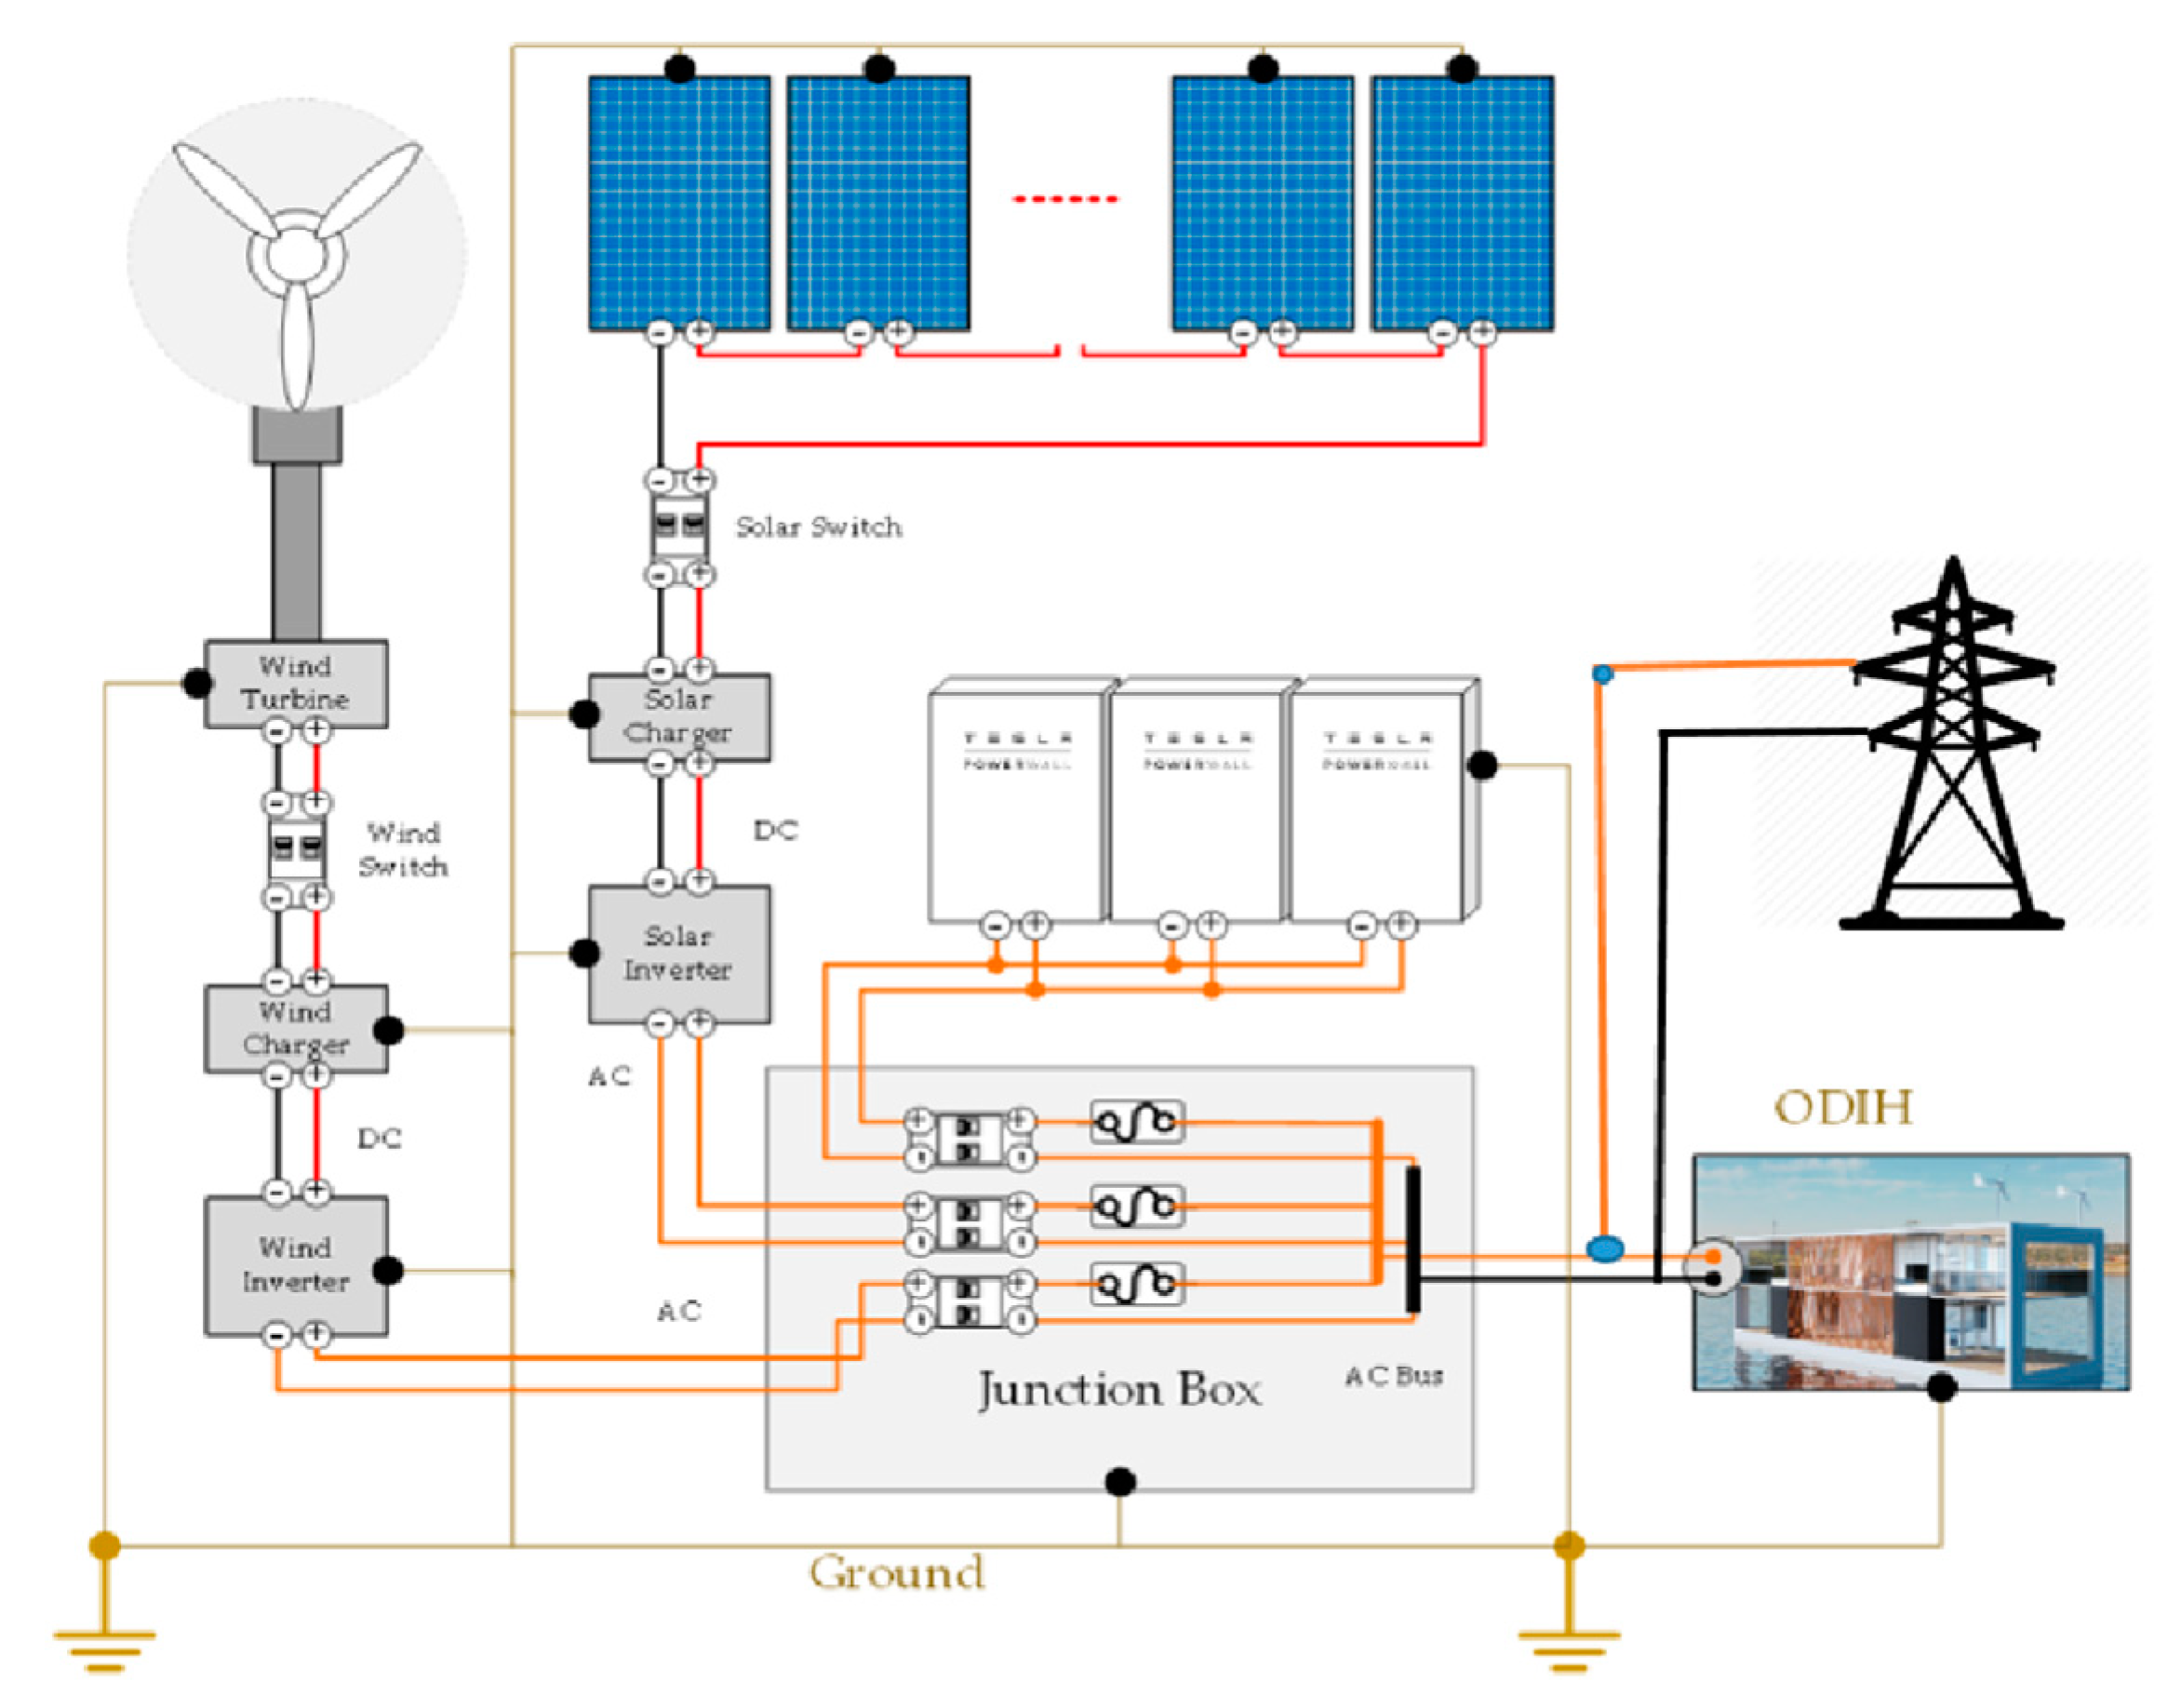
The energy management algorithms developed in this study were tested on the datasets of the Open Digital Innovation HUB (ODIH) project designed in Istanbul, Turkey [31]. ODIH aims to create a self-sufficient and fully digital living space. In the study, a living space needed by two people was designed, and then the energy, food and water demand for the whole year was calculated. Based on the calculations, a treatment system to meet the water need, a soilless agriculture system and a photovoltaic and storage system were designed. This comprehensive study has created a proper use case for testing our algorithm, as it contains annual data on the energy production of a roof-top PV system and the consumption of typical household devices [31]. This paper is an enhanced version of the Open Digital Innovation HUB (ODIH) project designed in Istanbul, Turkey [31]. The energy management model used in this paper is developed using the following systems that are shown in Figure 1. This comprehensive study has created a good use case for testing our algorithm. It contains annual data on the energy production of a roof-top PV system and the consumption of typical household devices [31].

Figure 1.
The energy system of the ODIH, reprinted with permission from [31]. Copyright 2021 Springer.
3.1. Photovoltaic System
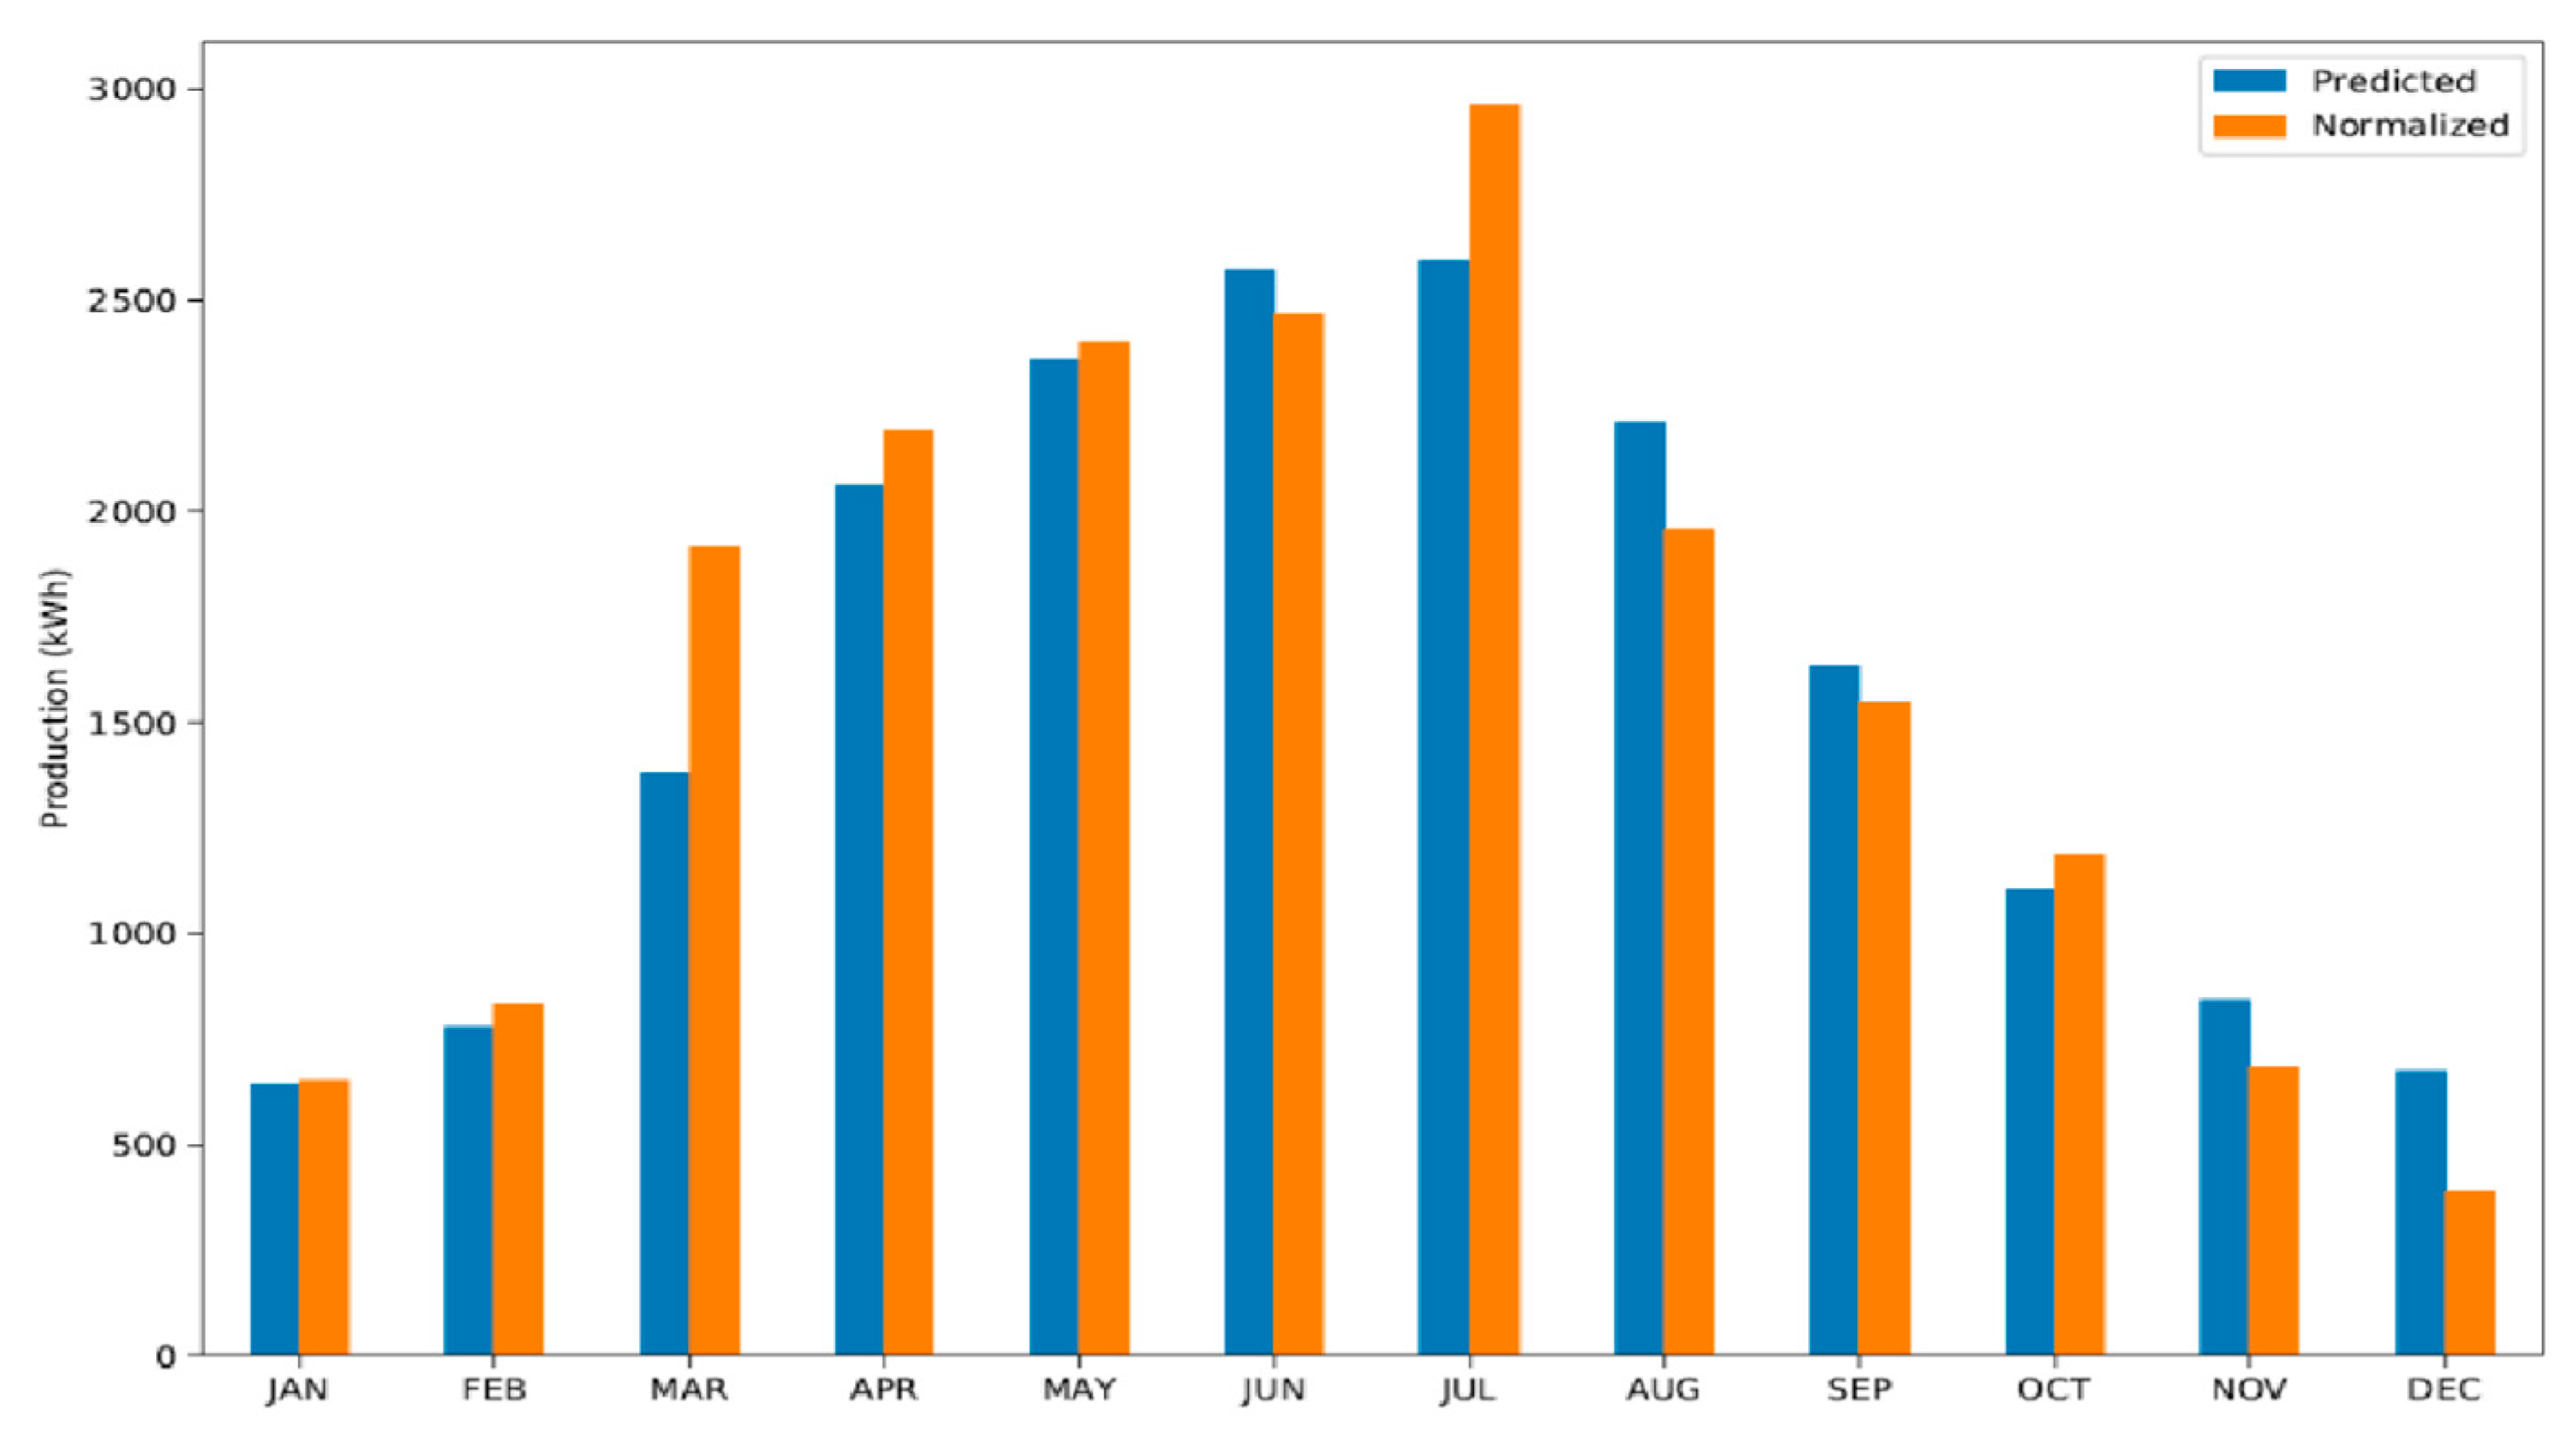
The dataset includes hourly solar energy production for a 10 kW roof-top PV system. The size of the photovoltaic system was chosen at the level allowed by the roof area of the project building. With a solar system of this size, the annual cumulative energy consumption is met, and the net-zero target of the ODIH system is realised. During the preparation of the one-year data study, two sources were used: the historical hourly energy production data set of an existing solar power plant in Istanbul [32] and the monthly production calculation of ODIH project PV system from [31]. The average monthly energy production of ODIH system, described in [33], was calculated based on the system installed power, location, asset efficiency and historical radiation data shared by the meteorological agency. Then, results were normalised with hourly energy generation of the solar power plant dataset, which was accessed from the Istanbul Municipality Open Data Portal [32]. Thus, the monthly calculations of the system were processed with hourly data of a solar power plant in the same region and a dataset with hourly frequency was created. Figure 2 shows the comparison of predicted and normalised values of solar production.

Figure 2.
Comparison of predicted and normalised values of monthly solar production.
3.2. Battery Storage System
The Tesla Power Wall model was used as an energy storage system in the ODIH system. Each battery pack has an energy capacity of 14 kWh [31]. In our model, each battery capacity was defined as 14 kWh, and the number of batteries will change by each scenario. One of the constraints in the model was battery state of charge (SOC) limits. In the model, the batteries were limited to 12 kWh at the maximum SOC level and 3.5 kWh at the minimum to consider battery ageing precautions. In light of these parameters, Equations (1) and (2) giving the battery model defined in the algorithm are as follows. With the calculation given in Equation (1), the new battery capacity was calculated over the initial capacity BattCap0 in the next hours. As seen in the equation, the capacity for the next hour BattCap was calculated over three parameters, which were solar production Epro, total consumption Eload and net energy flow in the grid Egrid. While Epro is constantly positive and Eload is constantly negative, Egrid may have a positive or negative value according to the system’s energy import or export to the grid. By adding the net value of these three parameters to the initial battery capacity, the battery charge or discharge amount and the capacity of the next hour are calculated. Each row of the dataset represents an hour, and the algorithm calculates the new capacity of the battery then writes it on the next row. In addition, in the model, the usable capacity of the battery is limited by entering the minimum ( and maximum capacity values. These constraints are introduced to the algorithm as in Equation (2). Under no circumstances does the battery capacity go beyond the specified limits.
where:
- : Battery capacity of next hour
- : Initial battery capacity
- : Determined minimum battery capacity
- : Determined maximum battery capacity
- : Produced solar energy
- : Total home consumption including appliances, water purifier and EV
- : Imported or exported energy from grid
3.3. Electric Vehicle Charging
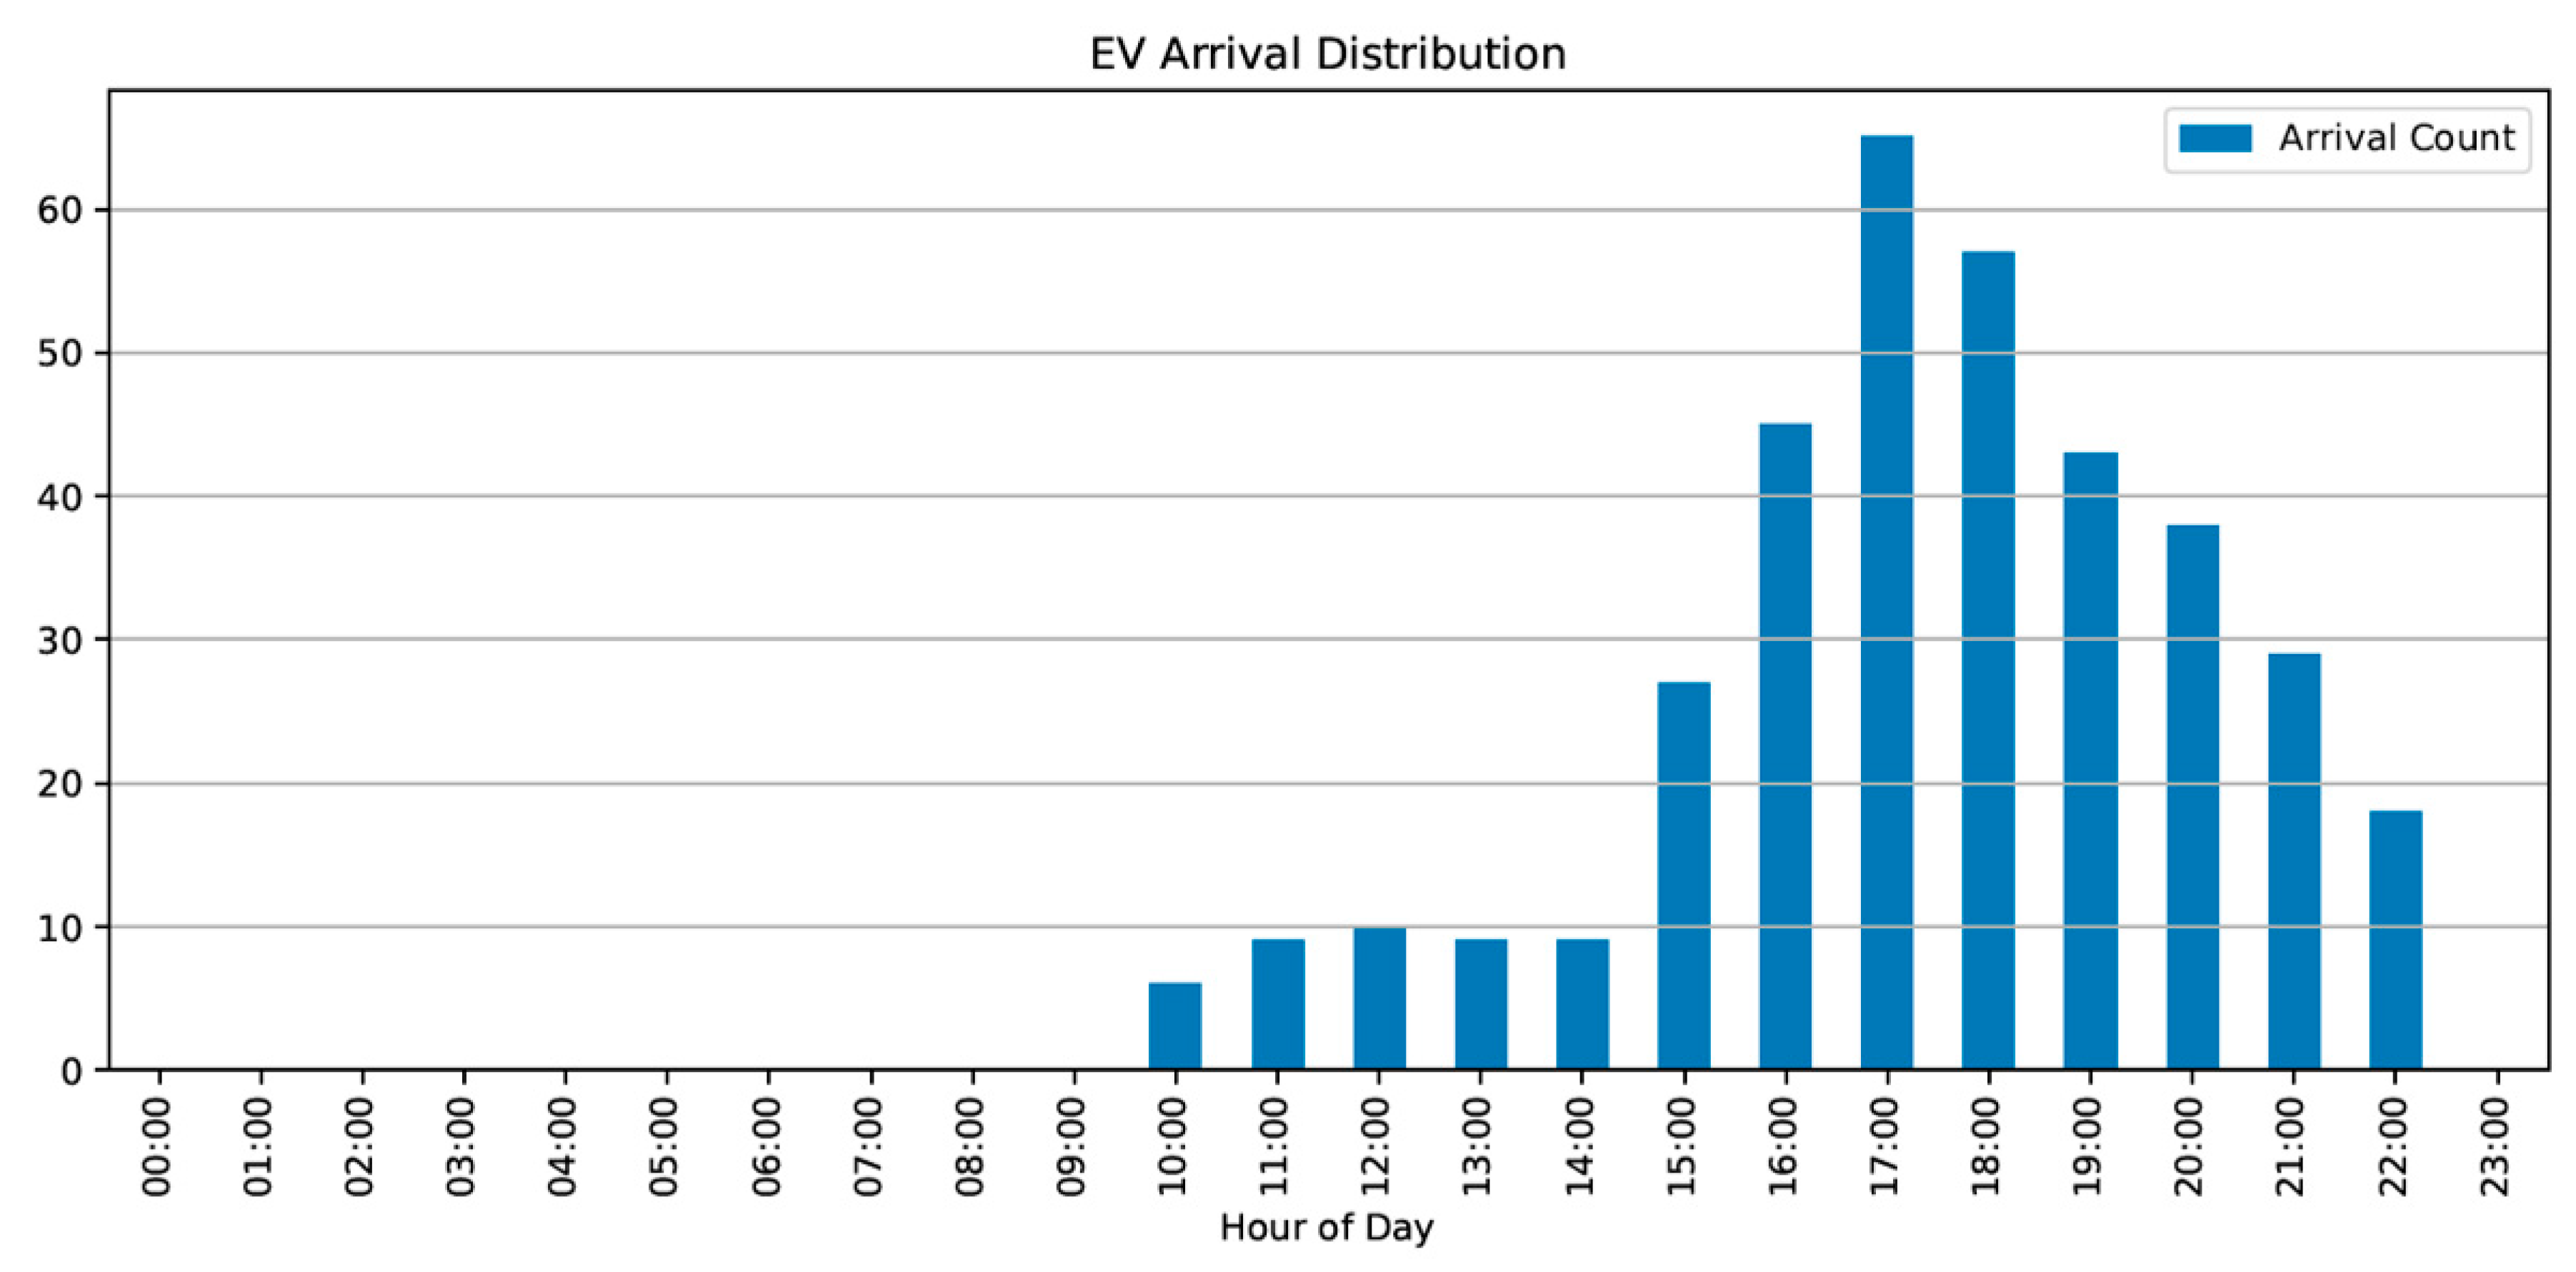
The report from UK Power Networks [34] was used to create usage patterns for a residual charging station. This report includes charging data collected from hundreds of battery electric vehicles (BEV) and plug-in hybrid electric vehicles (PHEV) jointly released by many public and commercial stakeholders within the United Kingdom (UK). From the data in the report, only the patterns of the battery electric vehicle users in the commuter profile, which is the target group of this work, were used. The first data needed was the hourly time for commuting to work and arriving time to home for the smart charging algorithm. To achieve it, the comprehensive data sets in the report were examined, and the hourly distribution of the commuters’ vehicles arrival profiles for weekdays and the weekends were used. It was concluded from these datasets that the distribution of average arrival time to home for commuters was between 4 and 11 p.m. Thus that, these data were used and distributed in the same proportions and generated one-year data, as shown in Figure 3. The cases of being an electrical plug-in in the generated dataset were entered as 0–1 and introduced in the algorithm. In this way, the vehicle plug-in time constraint was added with a distribution suitable for the scenario in accordance with the commuter profile. HEMS algorithms consider this constraint and decide on the most appropriate load shifting according to the available hours of the vehicles. While the most reasonable option seems to be shifting the EV load directly to the time with surplus energy, the vehicle plug-in profile cannot usually be connected during the day. In this case, the algorithm tends to charge EV from stored energy. If it is not possible, the algorithm decides to shift EV loads into the most affordable ToU periods. Another essential piece of information needed for the algorithm is the daily energy consumption of electric vehicles. The number of daily charges for weekdays and weekends was adopted from the report [34]. In order to conduct this, commuters’ profile who lived in urban was examined, and their daily charging need was calculated from the report. Using the average daily charging events and the average kWh energy requirement per charge presented in the report [34], the average daily energy requirement of the electric vehicle was estimated as 7.7 kWh/day on weekdays and 6.6 kWh/day on weekends.

Figure 3.
Yearly distribution of electric vehicle arrival hours.
3.4. Residential Demand
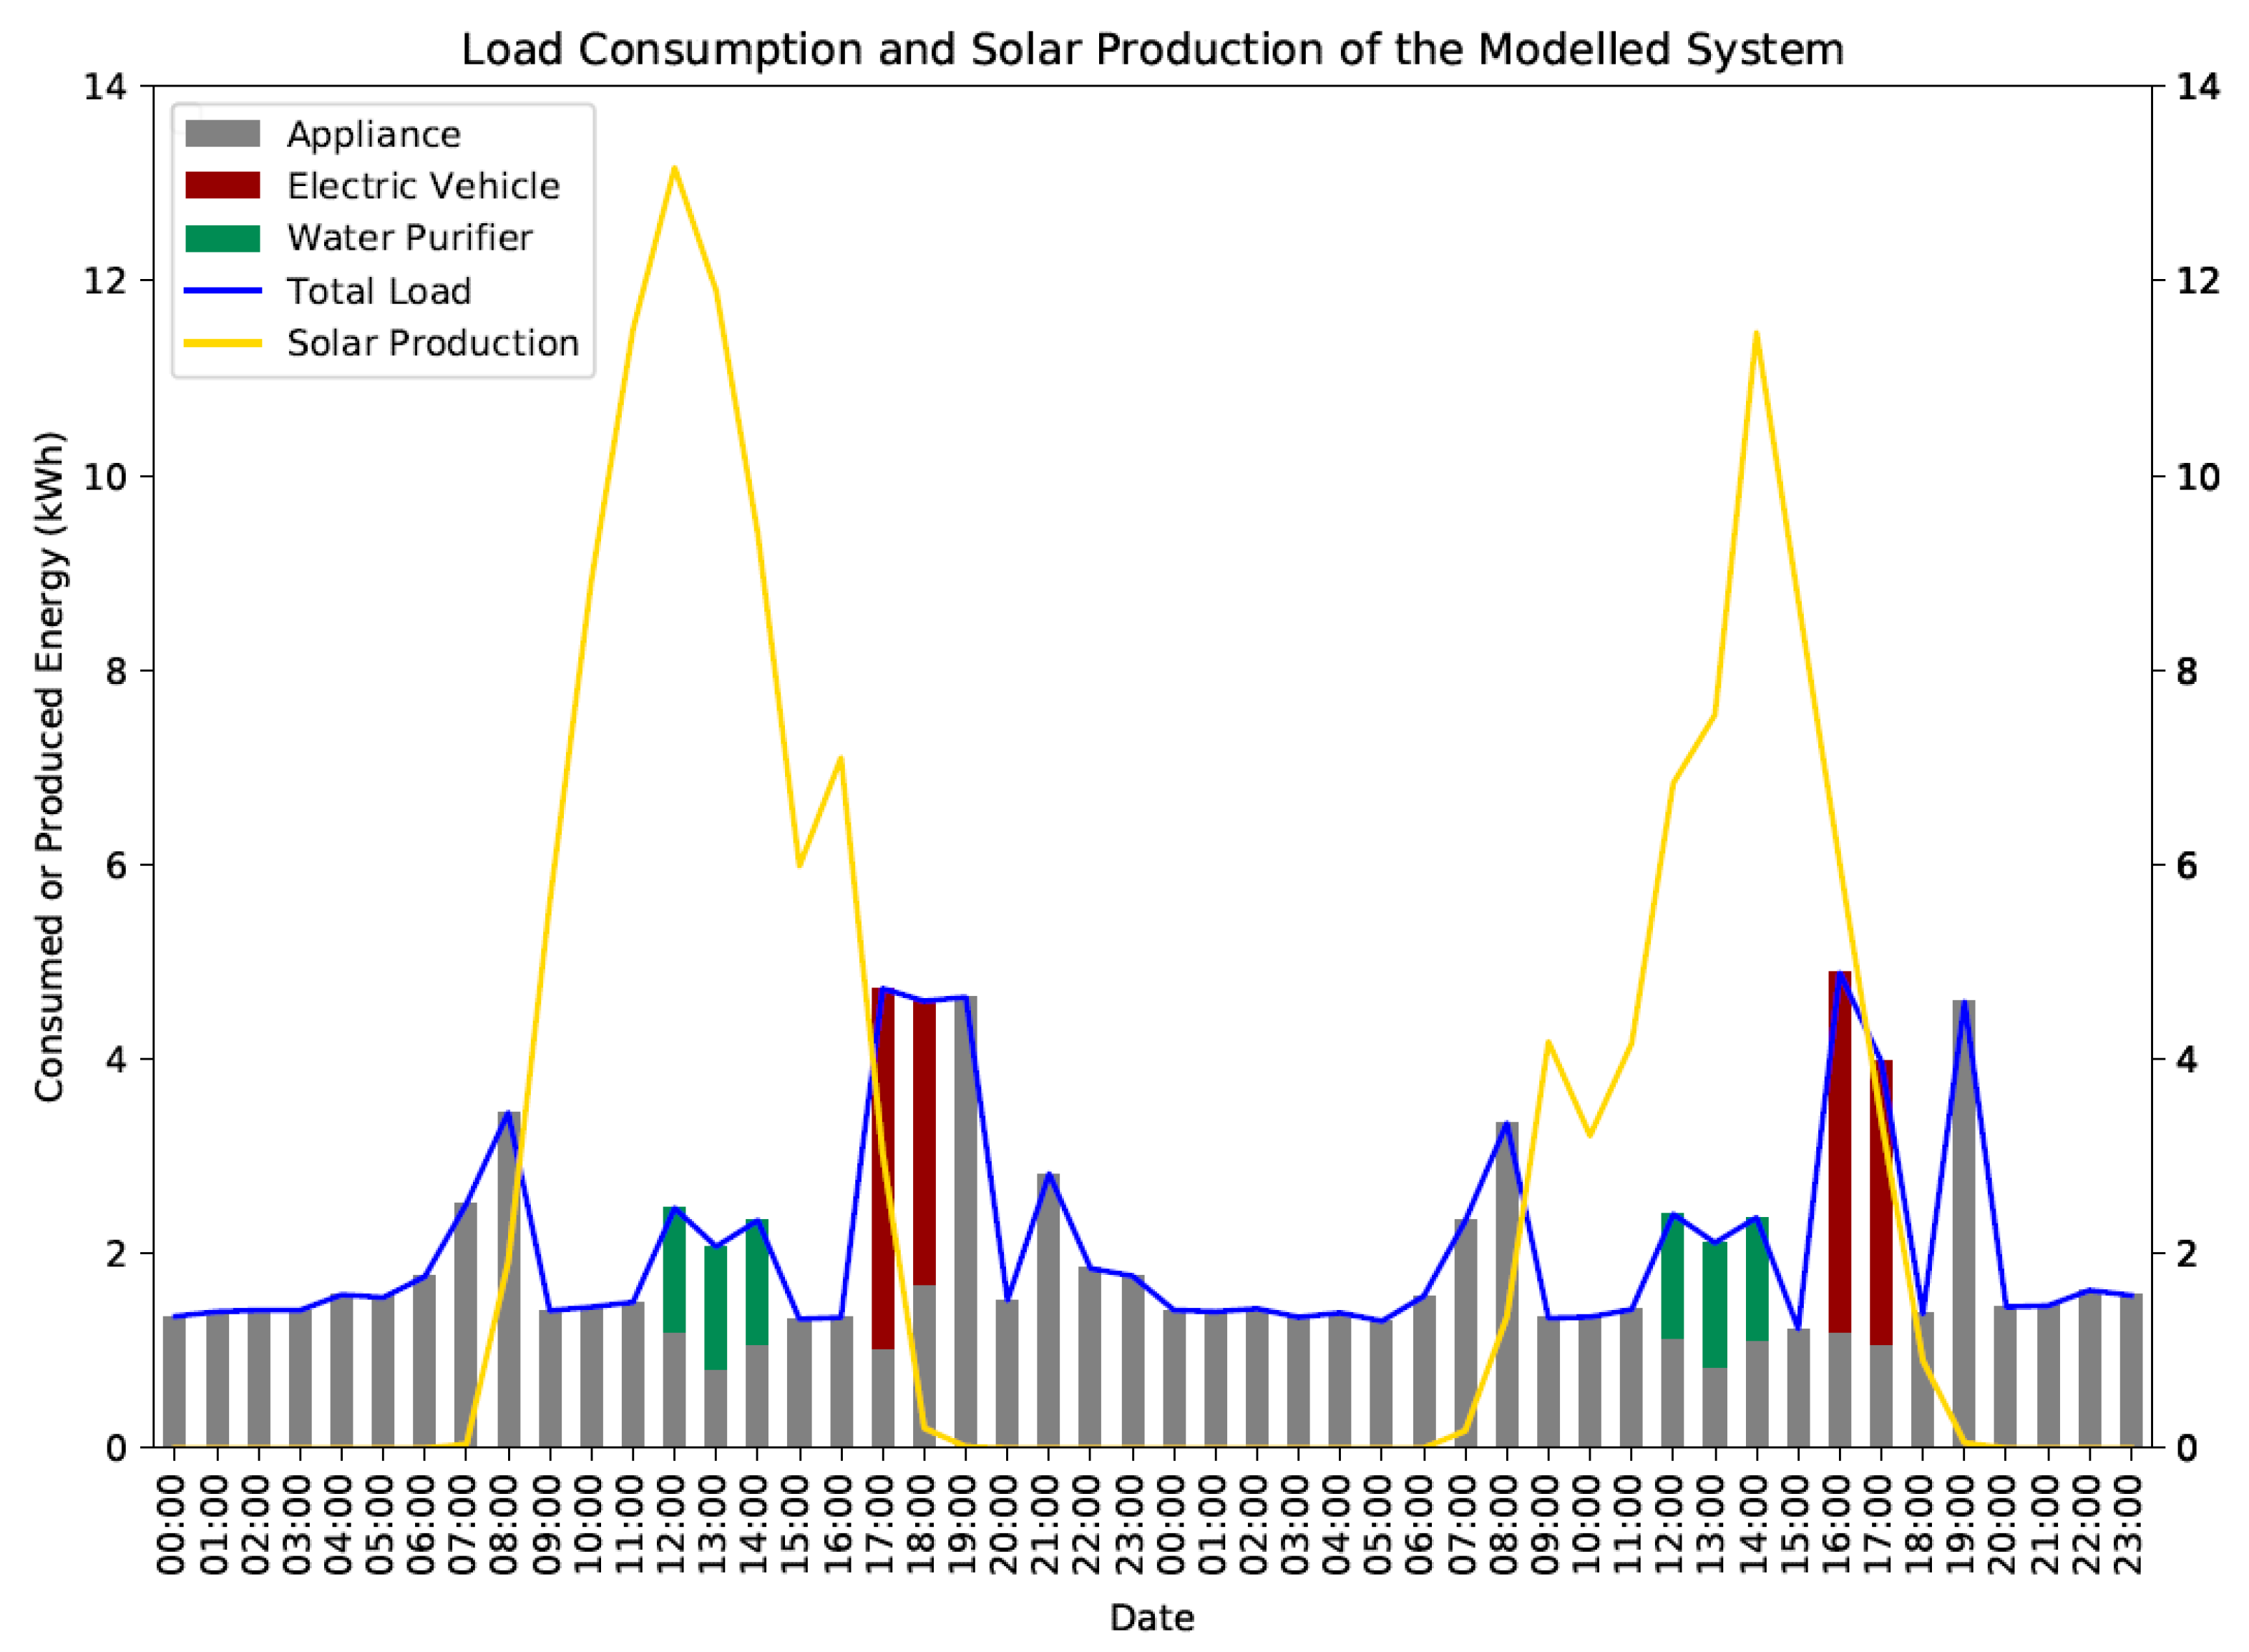
Smart meters and smart sensors can collect the energy load of the house in real-time. In addition, by correctly distributing the energy loads of the appliances in the building, a consumption dataset was obtained. Residential loads are divided into three according to DR suitability. The first group is defined as appliance loads, and no-load shifting is applied to loads in this group in the algorithm. All household appliances are in this group since they directly affect the user’s comfort. On the other hand, the water purifier and the electric vehicle are two shiftable loads. The water purifier is in the second group requiring 3.8 kWh energy for providing enough water for two people per day. This demand may be fed at any time of day. Therefore, a water purifier has flexibility for DR operations. The last group is the electric vehicle. As mentioned, an average electric vehicle requires an average of 7.7 kWh and 6.6 kWh depending on the day of the week. As an EV will not be present at home during the whole day, there is an availability limitation. Therefore, the EV also provides demand flexibility, but there is a time limit to take into account [31]. Figure 4 shows the energy production and consumption data of the system over a period of two days.
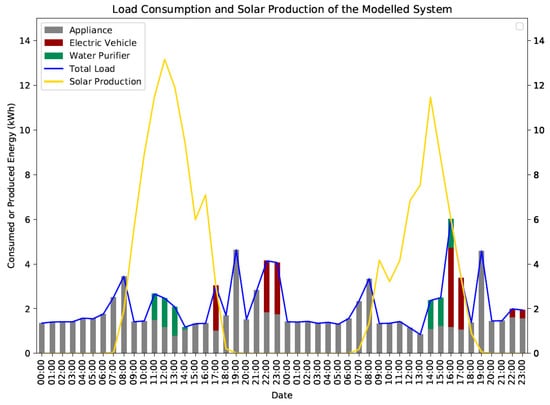
Figure 4.
Energy production and load trend modelled system.
3.5. Time of Use (ToU) Tariff
The Time of Use (ToU) tariff is one of the DR-related smart tariffs that charge customers differently at different times of the day [35]. Because electricity consumption peaks in the evening, this period is the most expensive time. Similarly, prices are at the lowest during nights as electricity consumption is relatively low. The Turkish ToU tariff, which can be obtained from the Epias web service, is shown in Figure 5 [36].
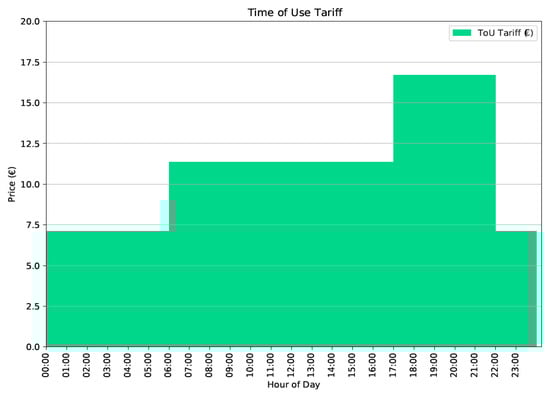
Figure 5.
Currently used time of use tariff in Turkey. From [36].
4. Hybrid Home Energy Management Algorithm Methodology
In our hybrid HEMS, there were several operating modes addressing different transaction conditions. The model is a kind of multi-objective and multi-variable optimisation algorithm. The main purpose is to create, as much as possible, a self-sufficient building energy system. Therefore, the algorithm tries to supply the whole building’s energy demand from renewable sources by scheduling charging and discharging periods of the installed battery. However, the battery capacity is not enough to store total surplus energy. Consequently, the hybrid system requires energy transactions with the power grid. In this case, the algorithm tries to match energy import/export and tariff data in the most economical way. For this, as in every energy optimising model, estimating the produced and consumed energy on the horizon is necessary. Since the study does not directly focus on a forecasting application, it is assumed that production and consumption data for 24 h ahead of the current time are estimated in the scenario prepared. In this way, the HEMS algorithm can process up to 24 lines ahead of the line it is in and can decide on its operations based on these data. In each subsequent hour, the 24th hour can be reached. The optimisation algorithm is trained according to the data of the production and consumption groups in the aforementioned dataset. The dataset groups and the variables of the algorithm are;
- ▪
- Generated energy from PV
- ▪
- Non-shifting loads, or the household appliances
- ▪
- A water purification system that can be operated at any time of the day and thus provides flexibility
- ▪
- An electric vehicle that plugs in at certain times of the day and provides a flexible charging opportunity within a plug-in time interval.
- ▪
- A battery system with a certain energy storage capacity
- ▪
- A Time of Use (ToU) tariff
Each specified dataset contains the hourly frequency values of a year. Therefore, the time step of the algorithm and simulation is in the form of a clock. According to production, consumption or tariff parameters, the management system makes decisions among the operation modes for each hour. Operation modes of HEMS can be seen in Table 1 with allocated equations. The table indicates the energy imported into the grid expressed with Eimport, the energy exported from the grid expressed with Eexport, and the equivalent of the equation given in Equation (3) for each mode. While creating energy management algorithms, some operation modes are assigned to the second level to simplify the model. The simultaneous operation of the battery and the network has been reduced in the proposed algorithm. The relation between the system and the grid is represented in Equation (3).
where:
- : Produced solar energy
- : Total house consumption including appliances, water purifier and electric vehicle
- : Discharged energy from the battery
- : Energy loaded into the battery
- : Imported energy from the grid
- : Exported energy from the grid

Table 1.
Operation Modes of proposed energy management model.
Table 1.
Operation Modes of proposed energy management model.
| Modes | Equation | Description | Level |
|---|---|---|---|
| Mode 1 | PV feeds House Load | Level 1 | |
| Mode 2 | PV feeds House Load and Battery | Level 1 | |
| Mode 3 | PV feeds House Load, Battery, and Grid | Level 2 | |
| Mode 4 | PV feeds House Load and Grid | Level 1 | |
| Mode 5 | PV and Battery feed House Load | Level 1 | |
| Mode 6 | PV and battery feed House Load and Grid | Level 1 | |
| Mode 7 | PV and Grid feed House Load | Level 1 | |
| Mode 8 | PV and Battery and Grid feed House Load | Level 2 | |
| Mode 9 | PV and grid feed House Load and Battery | Level 1 |
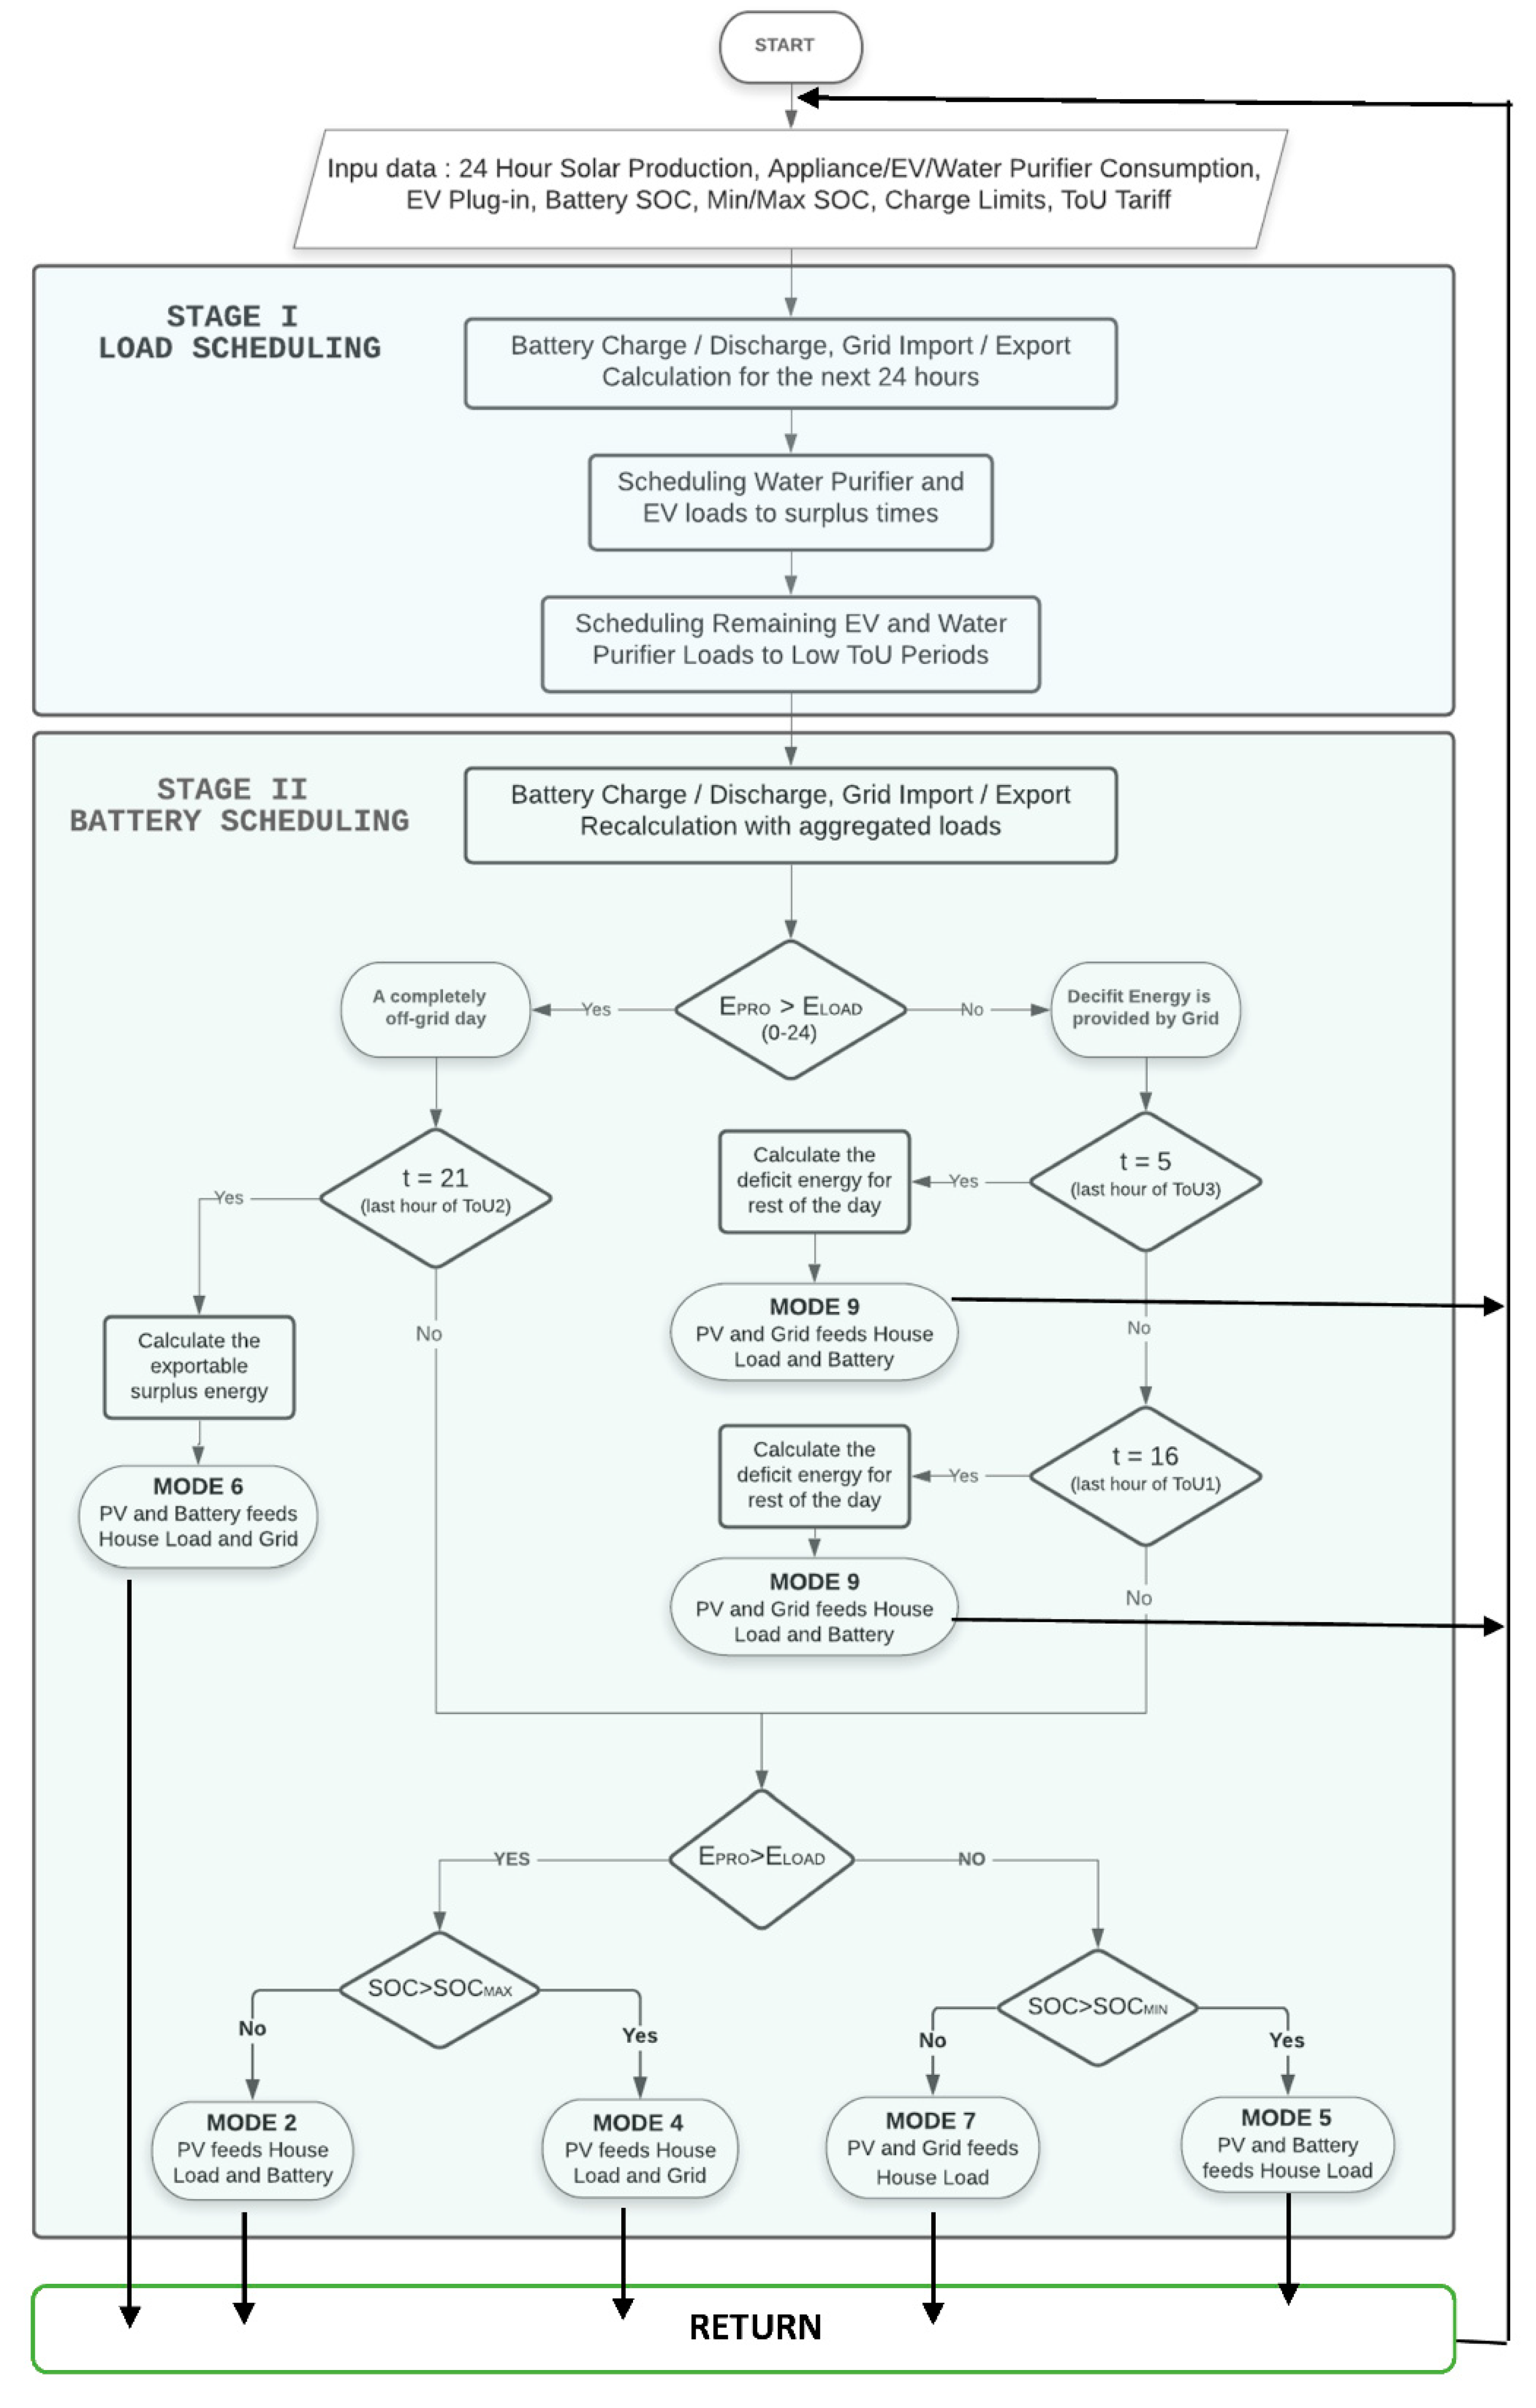
The flowchart of the algorithm is shown in Figure 6. The proposed algorithm has 2 stages. In the first stage, the algorithm operates its load scheduling decisions. At first, the algorithm calculates the production and total consumption of the next 24 h for each hour, checking whether the entire day will be completed independent from the grid with the current battery capacity. Then, the algorithm finds the surplus hours when there is excess energy left over from the non-shiftable appliances. At this point, the primary purpose of the algorithm is to shift the water purifier and EV loads to the calculated surplus times as much as possible. For this purpose, the flexible water purifier loads are firstly shifted to the calculated surplus times. If possible, the entire load is fed from surplus energy, or the unmet part is shifted to the cheap tariff period. After the water purifier scheduling process is finished, a similar decision mechanism is applied for the EV. Here, an important difference and limitation for the EV are that the vehicle is only available during certain hours. Considering this constraint, if possible, the vehicle is tried to be fed with the remaining surplus energy. Except on weekends, this is usually not possible since the vehicle arrives home in the evening. In this case, the vehicle load is shifted to the cheap time tariff, partly to be fed by batteries and from the grid. In conclusion, in the load shifting process, firstly, the energy needs are met from the produced energy, and then, in cases where it is not possible, cost optimisation is achieved by shifting the loads to cheap energy tariff periods.

Figure 6.
Flowchart of the proposed algorithm (RETURN).
After completing the load scheduling operation in the first stage, the algorithm recalculates the production and total consumption of the next 24 h. Battery charging and discharging scheduling are operated in Stage 2. If all the demand is met with the produced energy and the existing battery storage, the system does not import any energy from the grid during the day. Besides, the algorithm tries to obtain maximum earnings from the energy exported to the grid by scheduling the export times with high price intervals. At times when energy production is high, particularly during summer seasons, surplus energy is transferred to the network after the battery is fully charged. Apart from that, there is also a battery capacity at the end of the day, and it is more than enough until the next day for solar production to resume. In these cases, before the last hour of the most expensive tariff, our model calculates the energy that can be exported by taking into account the production and consumption in the hours and provides a significant increase in revenue by selling it in the most expensive period.
When the system cannot meet the consumption even with the battery, the energy shortfall must be met from the grid. In this case, the energy deficit is calculated, and this amount is imported from the cheapest tariff. Depending on the battery capacity, it cannot be imported completely in a low-tariff period; in this case, it is imported just before the most expensive time frame again. In this way, the required energy is provided in the cheapest possible way. In both cases, the charge and discharge between the system and the network are shifted only to the appropriate hours. The transactions made do not increase the energy exchange with the network. In this way, self-sufficiency, which is the first goal, is achieved and maximised, while the economic gain from the home’s energy sources is increased.
The proposed algorithm was described as a flow chart, which can be seen in Figure 6.
5. Comparison of Methodologies
To measure the impact of the proposed algorithm, the algorithm is compared to the case created in three different methods as basic control, battery scheduling, and load plus battery scheduling methods, which are compared, respectively, on the data set described in the previous section. Each of the three methods are compared according to the net saving and return on investment rates in cases where there are different numbers of batteries.
5.1. Basic Control
The base product method for impact is the basic control without any optimisation. This control structure is taken as an example from the algorithm for a grid-connected-photovoltaic and battery storage system in work [21]. In this method, the priority is given to supplying the loads, then charging the batteries with surplus solar energy until the battery reaches maximum SOC, and then feeding the excess energy into the grid without any battery scheduling operation. In the opposite scenario, where the produced energy is insufficient, the battery feeds the household demand in addition to the solar production. The energy deficit is satisfied first by the battery until the minimum SOC is reached, then by the grid. Water purifier loads are located in the afternoon, and EV charging starts upon plug-in. There are four operation modes (Mode 2, 4, 5 and 7 in Table 1) depending on conditions. Figure 7 presents the basic control algorithm flowchart.
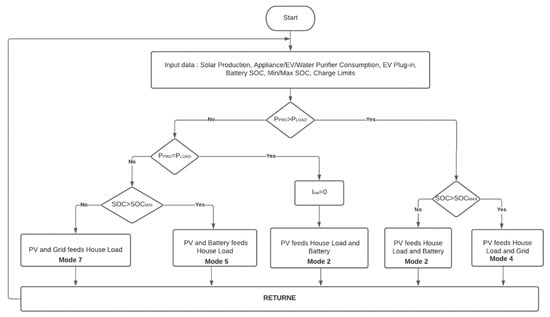
Figure 7.
Flowchart of the basic control algorithm.
5.2. Battery Optimisation without Load Scheduling
In this model, battery optimisation without load scheduling is considered. As mentioned in the proposed algorithm, battery optimisation is positioned in Stage II, as can be seen in Figure 6. The battery charge and discharge processes are scheduled to maximise profit according to 24 h solar generation and energy consumption trends. As mentioned before, the battery scheduling stage maximises earnings by scheduling surplus energy export into high tariff periods and minimises expenses by shifting grid import times into low tariff periods. As in basic control, the water purifier load is located in the afternoon, and EV charging starts upon plug-in.
5.3. Proposed 2-Stage Hybrid Energy Management Algorithm
Finally, the 2-stage management algorithm, represented in Figure 6, offers more advantageous optimisation by combining load and battery charge/discharge scheduling operations. The proposed methodology, in which both optimisation techniques are applied, firstly performs the load scheduling operation, and then it performs the battery scheduling operation explained in the previous method over the obtained aggregated load briefly.
Unlike other methods, there is a load scheduling layer that makes use of shiftable loads in the proposed structure. The shiftable loads were determined according to the elements that will minimally affect the daily comfort of the user. These two are the electric vehicle, which can be shifted between the time it is plugged in at home, and the water purifier that is available the whole time. The algorithm first calculates the production and consumption of the next 24 h. According to the capacity of the produced energy to meet the consumption, firstly, the water purifier and then the EV load is scheduled by considering the availability constraint. After this stage, aggregated loads are recalculated, and the battery scheduling stage tries to match grid import/export operations in the most beneficial way, as in the previous method.
6. Impact Analysis
To compare the energy management algorithms and scenarios described in the previous section, performance indicators parallel to the self-sufficiency and cost efficiency targets were determined. All cases were evaluated in terms of independence from the network, earnings gained by the system and return on investment.
6.1. Annual and Monthly Self-Sufficiency Rate
The self-sufficiency target in resources is evaluated in terms of energy parameters only. For this, in each scenario, monthly and annual independence rates were calculated based on energy exchange with the grid, total energy production and consumption. The Self Sufficiency Rate for the desired period was calculated as in Equation (4). In this formula, the total consumption for any time is  while the imported energy from the grid is represented as .
6.2. Net Saving and Return on Investment
As mentioned, the main purpose of the study is to create a cost-optimised energy management algorithm for a self-sufficient living space. The economic contribution of the proposed energy management algorithms was calculated over the ODIH case and included in the study. To calculate the economic impact, the cost of energy consumption, without load shifting, was calculated for each hour in the TOU tariff. Then, the grid import value at the relevant hour (zero if there is no electricity from the grid) is added to the cost as negative, and the grid export value (zero if there is no export to the grid) is added to the cost as positive. Finally, the results of each hour are summed to calculate the annual saving. Thus, the financial saving created by energy production, load shifting or battery optimisation is calculated according to the TOU tariff. The relation is shown in Equation (5). The price of 1 kWh of electricity of related hour is represented as , and exported energy to the grid is
In order to calculate the annual return on investment (ROI) rates (%), the net saving amount calculated over the year was divided by the total system cost. In the scenarios tested, a solar system with an installed power of 10kW and from 1 to 3 batteries was used. The average cost of 10 kW solar system installation is 8200€ [37,38,39]. As mentioned, calculations are made on Tesla Powerwall features. Based on the values taken from Tesla’s product sales website, the cost of the battery was 8700€ for a single battery, 16,000€ for a double battery and 23,000€ for three batteries [40]. Accordingly, return on investment rate calculation for different cases is shown in Equation (6).
7. Results
The simulation was carried out to verify the performance and benefit of the proposed two-stage energy management algorithm in terms of self-sufficiency and net saving. The basic control and two-stage structure described in the previous section were tested in a one-year data set prepared in the test case, ODIH, by using developed Python programs. The prepared dataset provides quite an extensive scenario, including low PV production in winter, intermitted production periods, high and low energy demand, realistic EV user profile. For instance, solar production trends belonging to different periods are presented in Figure 2. It can be seen that when the three-day solar production trends of two different periods in the graph are examined, the solar energy production decreases by almost half between the seasons. On the other hand, intermittence is observed even between consecutive days. In all these scenarios, it was aimed to achieve the most efficient result by making appropriate decisions by HEMS.
The datasets were run on each proposed optimisation program, and the algorithm results were recorded in separated datasets. The simulation outputs were then analysed and visualised.
7.1. Load Scheduling Operation
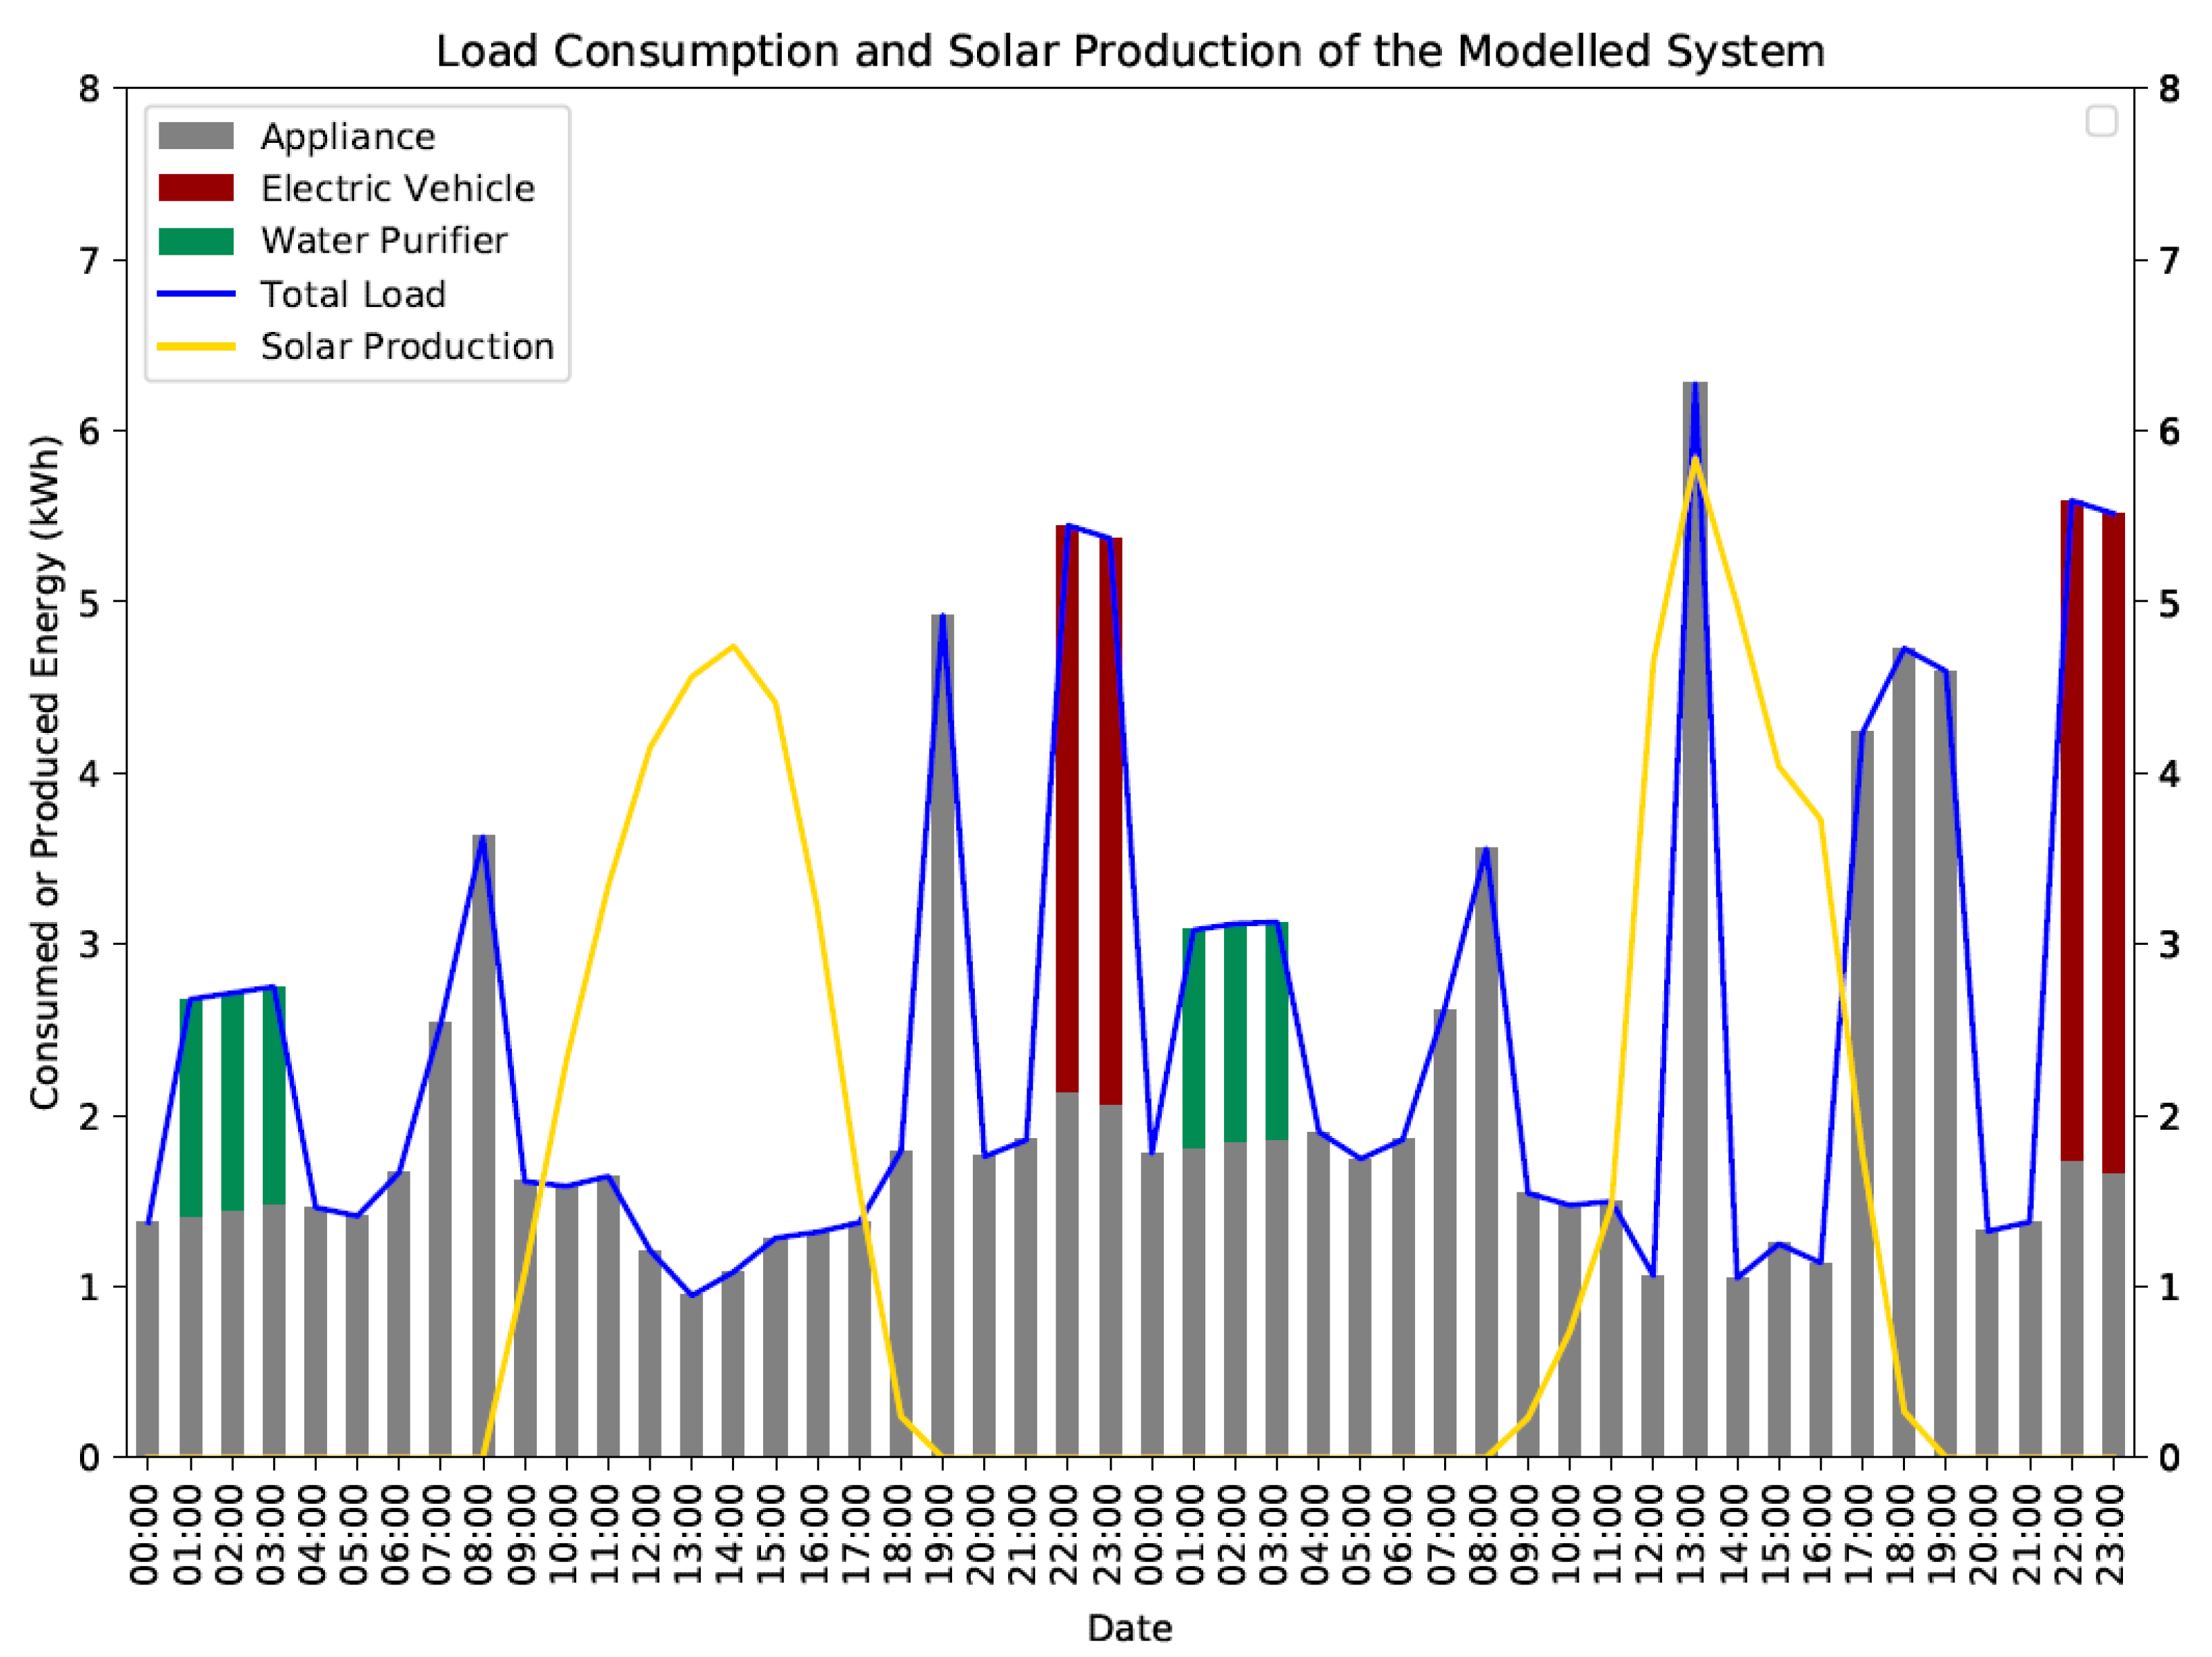
In the optimisation algorithm, the production and consumption profiles of the day were calculated first, and then the shiftable EV and water purifier loads were scheduled for the most appropriate time. Figure 8 shows an example of the load scheduling process. As can be seen, both the water purifier and the EV were charged by fully utilising solar energy by shifting to the surplus energy times. Figure 9 shows a different use case. In this scenario, although the surplus energy was sufficient for the water purifier, the electric vehicle could not be fed during this period. Thus, it was not plugged-in in these hours. Therefore, while the water purifier was shifted entirely to times when solar energy was excessive, the electric vehicle was shifted to a cheaper period.
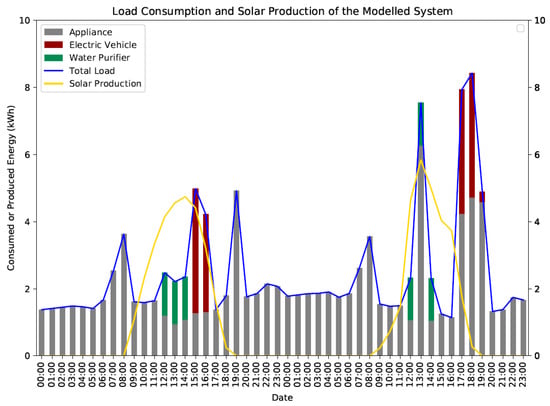
Figure 8.
Basic control example.

Figure 9.
Proposed load scheduling operation.
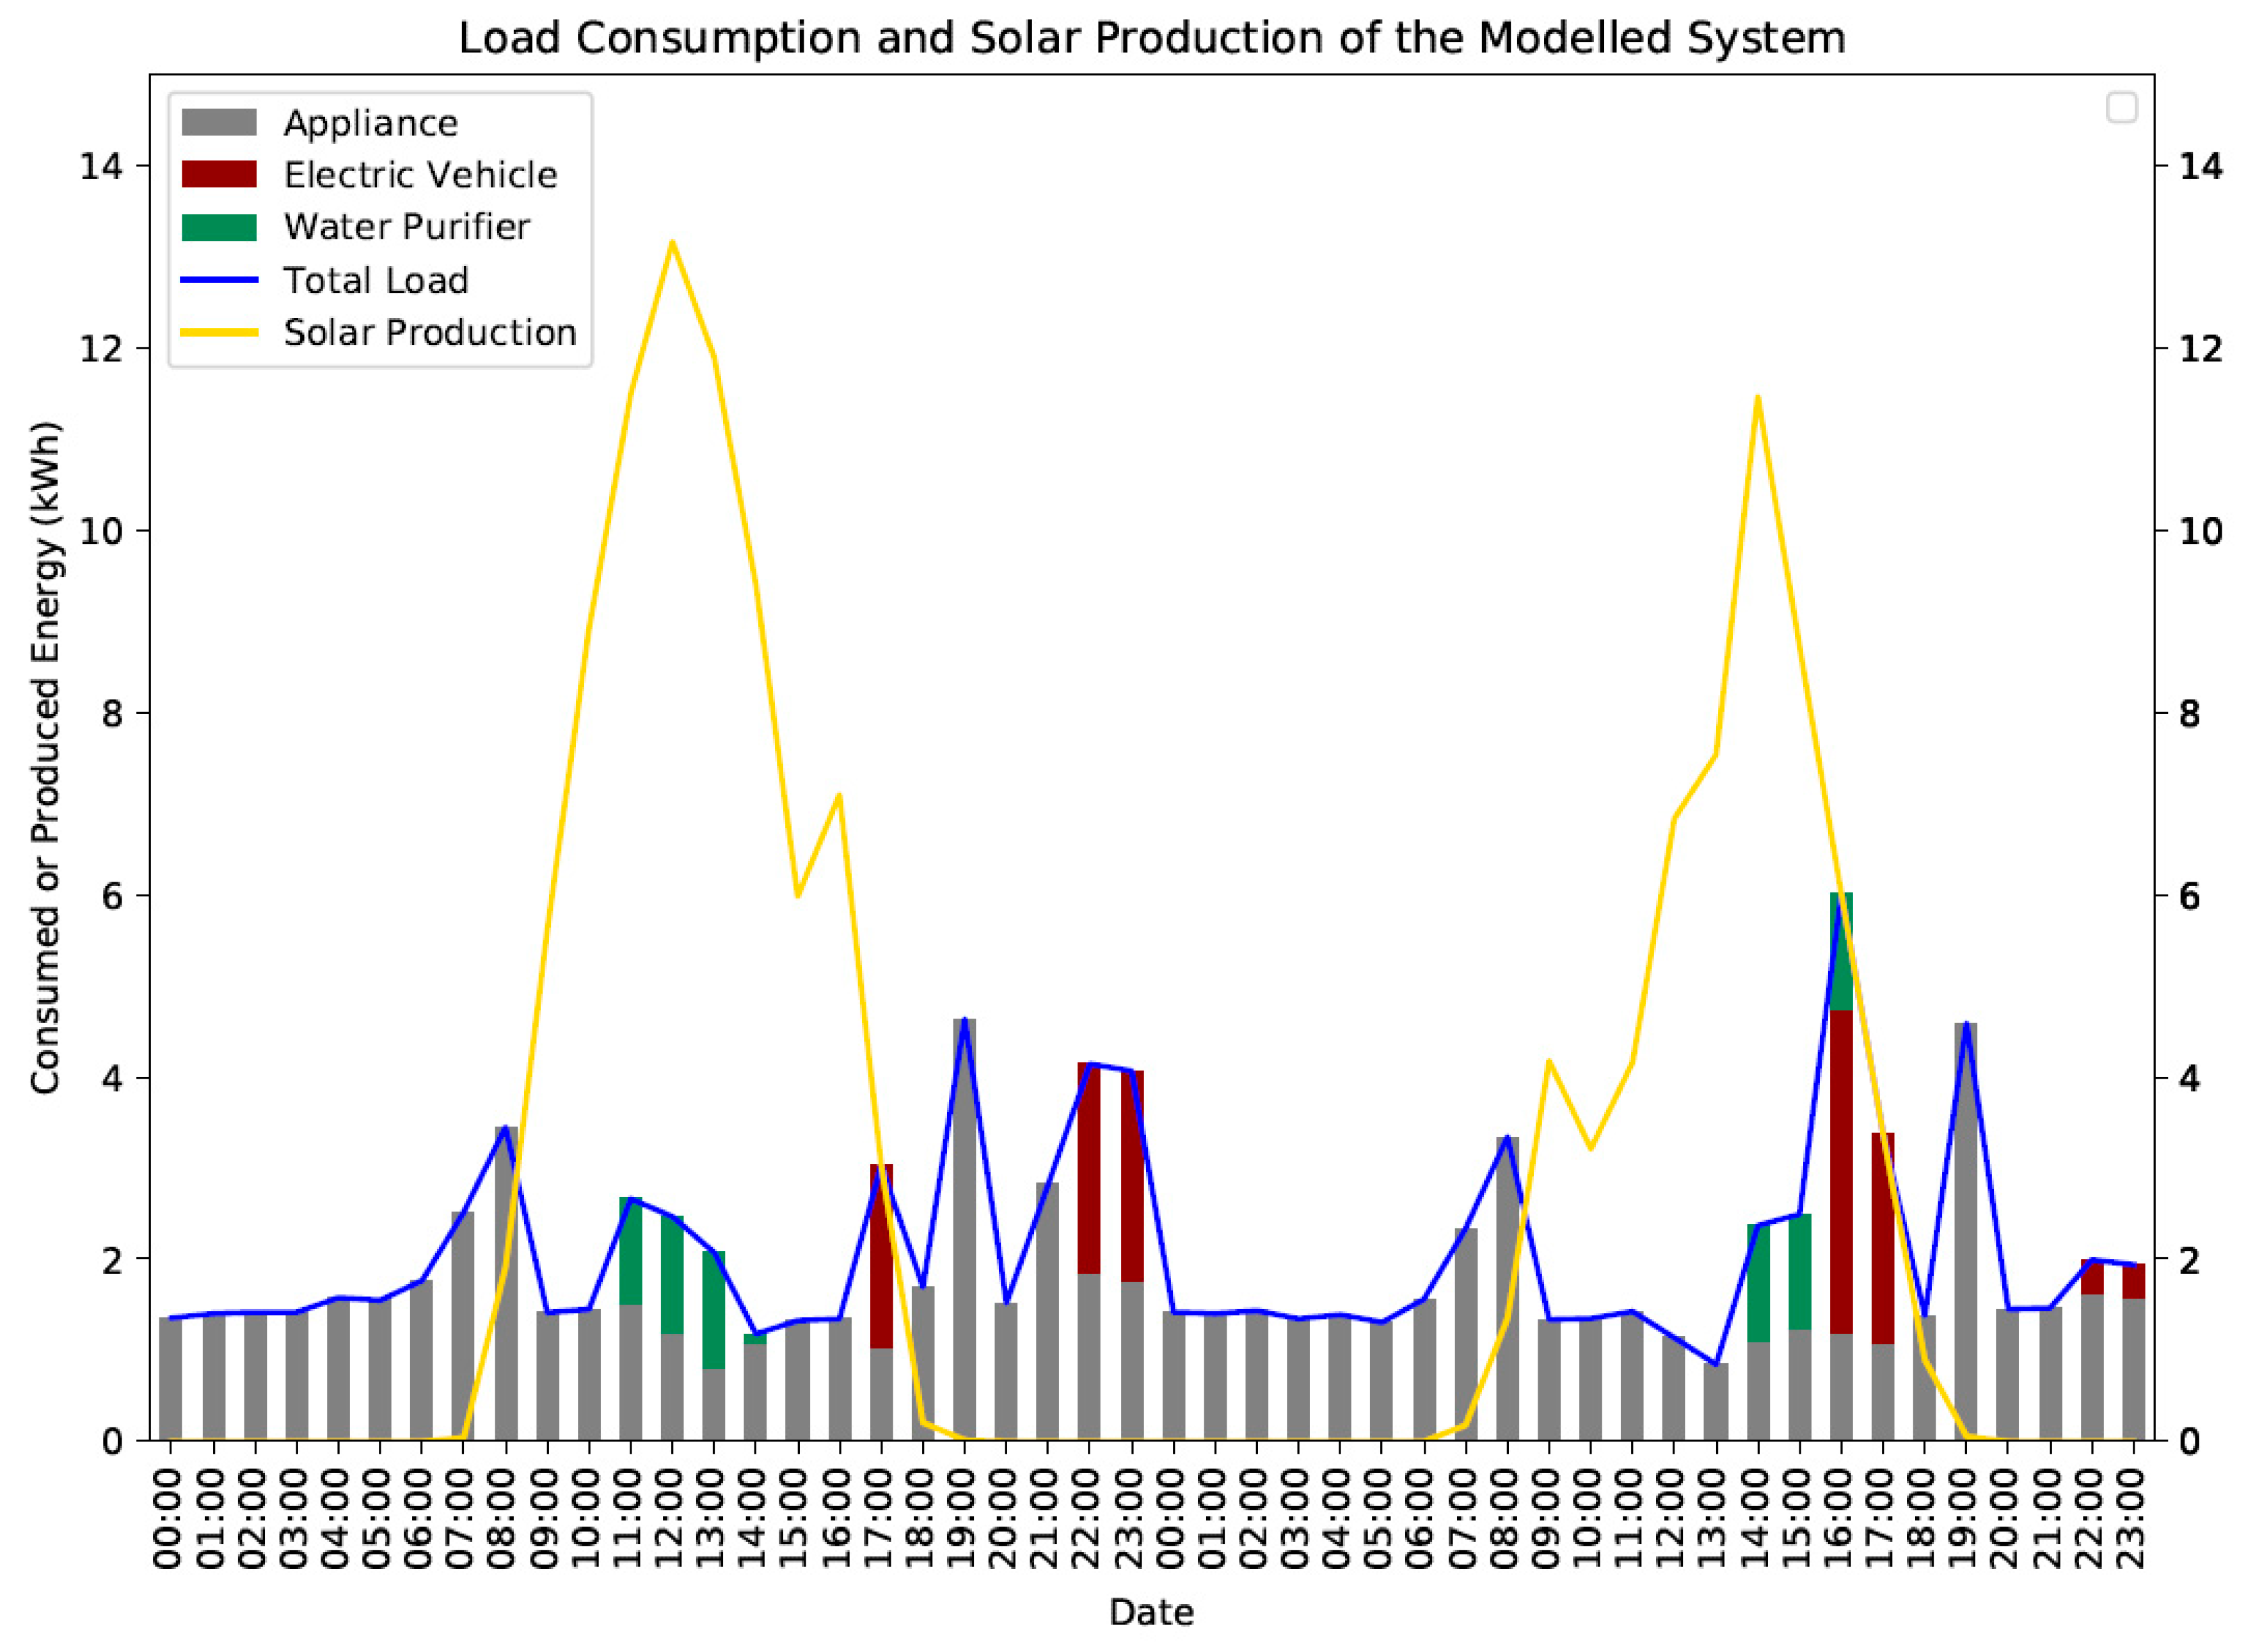
In the optimisation algorithm, the production and consumption profiles of the day were calculated first, and the shiftable electric vehicle and water purifier loads were scheduled to the most appropriate time. Figure 8 and Figure 9 show the behaviour of the basic control and proposed energy management system in the winter period when solar production is low and consumption is high due to the use of intensive heat pumps. As can be seen in Figure 8, a peak occurred in the most expensive period since the electric vehicle was energised upon plug-in. Therefore, a negative situation occurred in terms of both energy cost and demand-side management. When the proposed two-stage model is examined in Figure 9, it is seen that loads of electric vehicles and water purifiers are shifted to the low tariff segment. By calculating the daily energy requirement and production, the algorithm decided that both flexible loads could not be met with the produced and stored energy and, therefore, made a cost-effective decision.
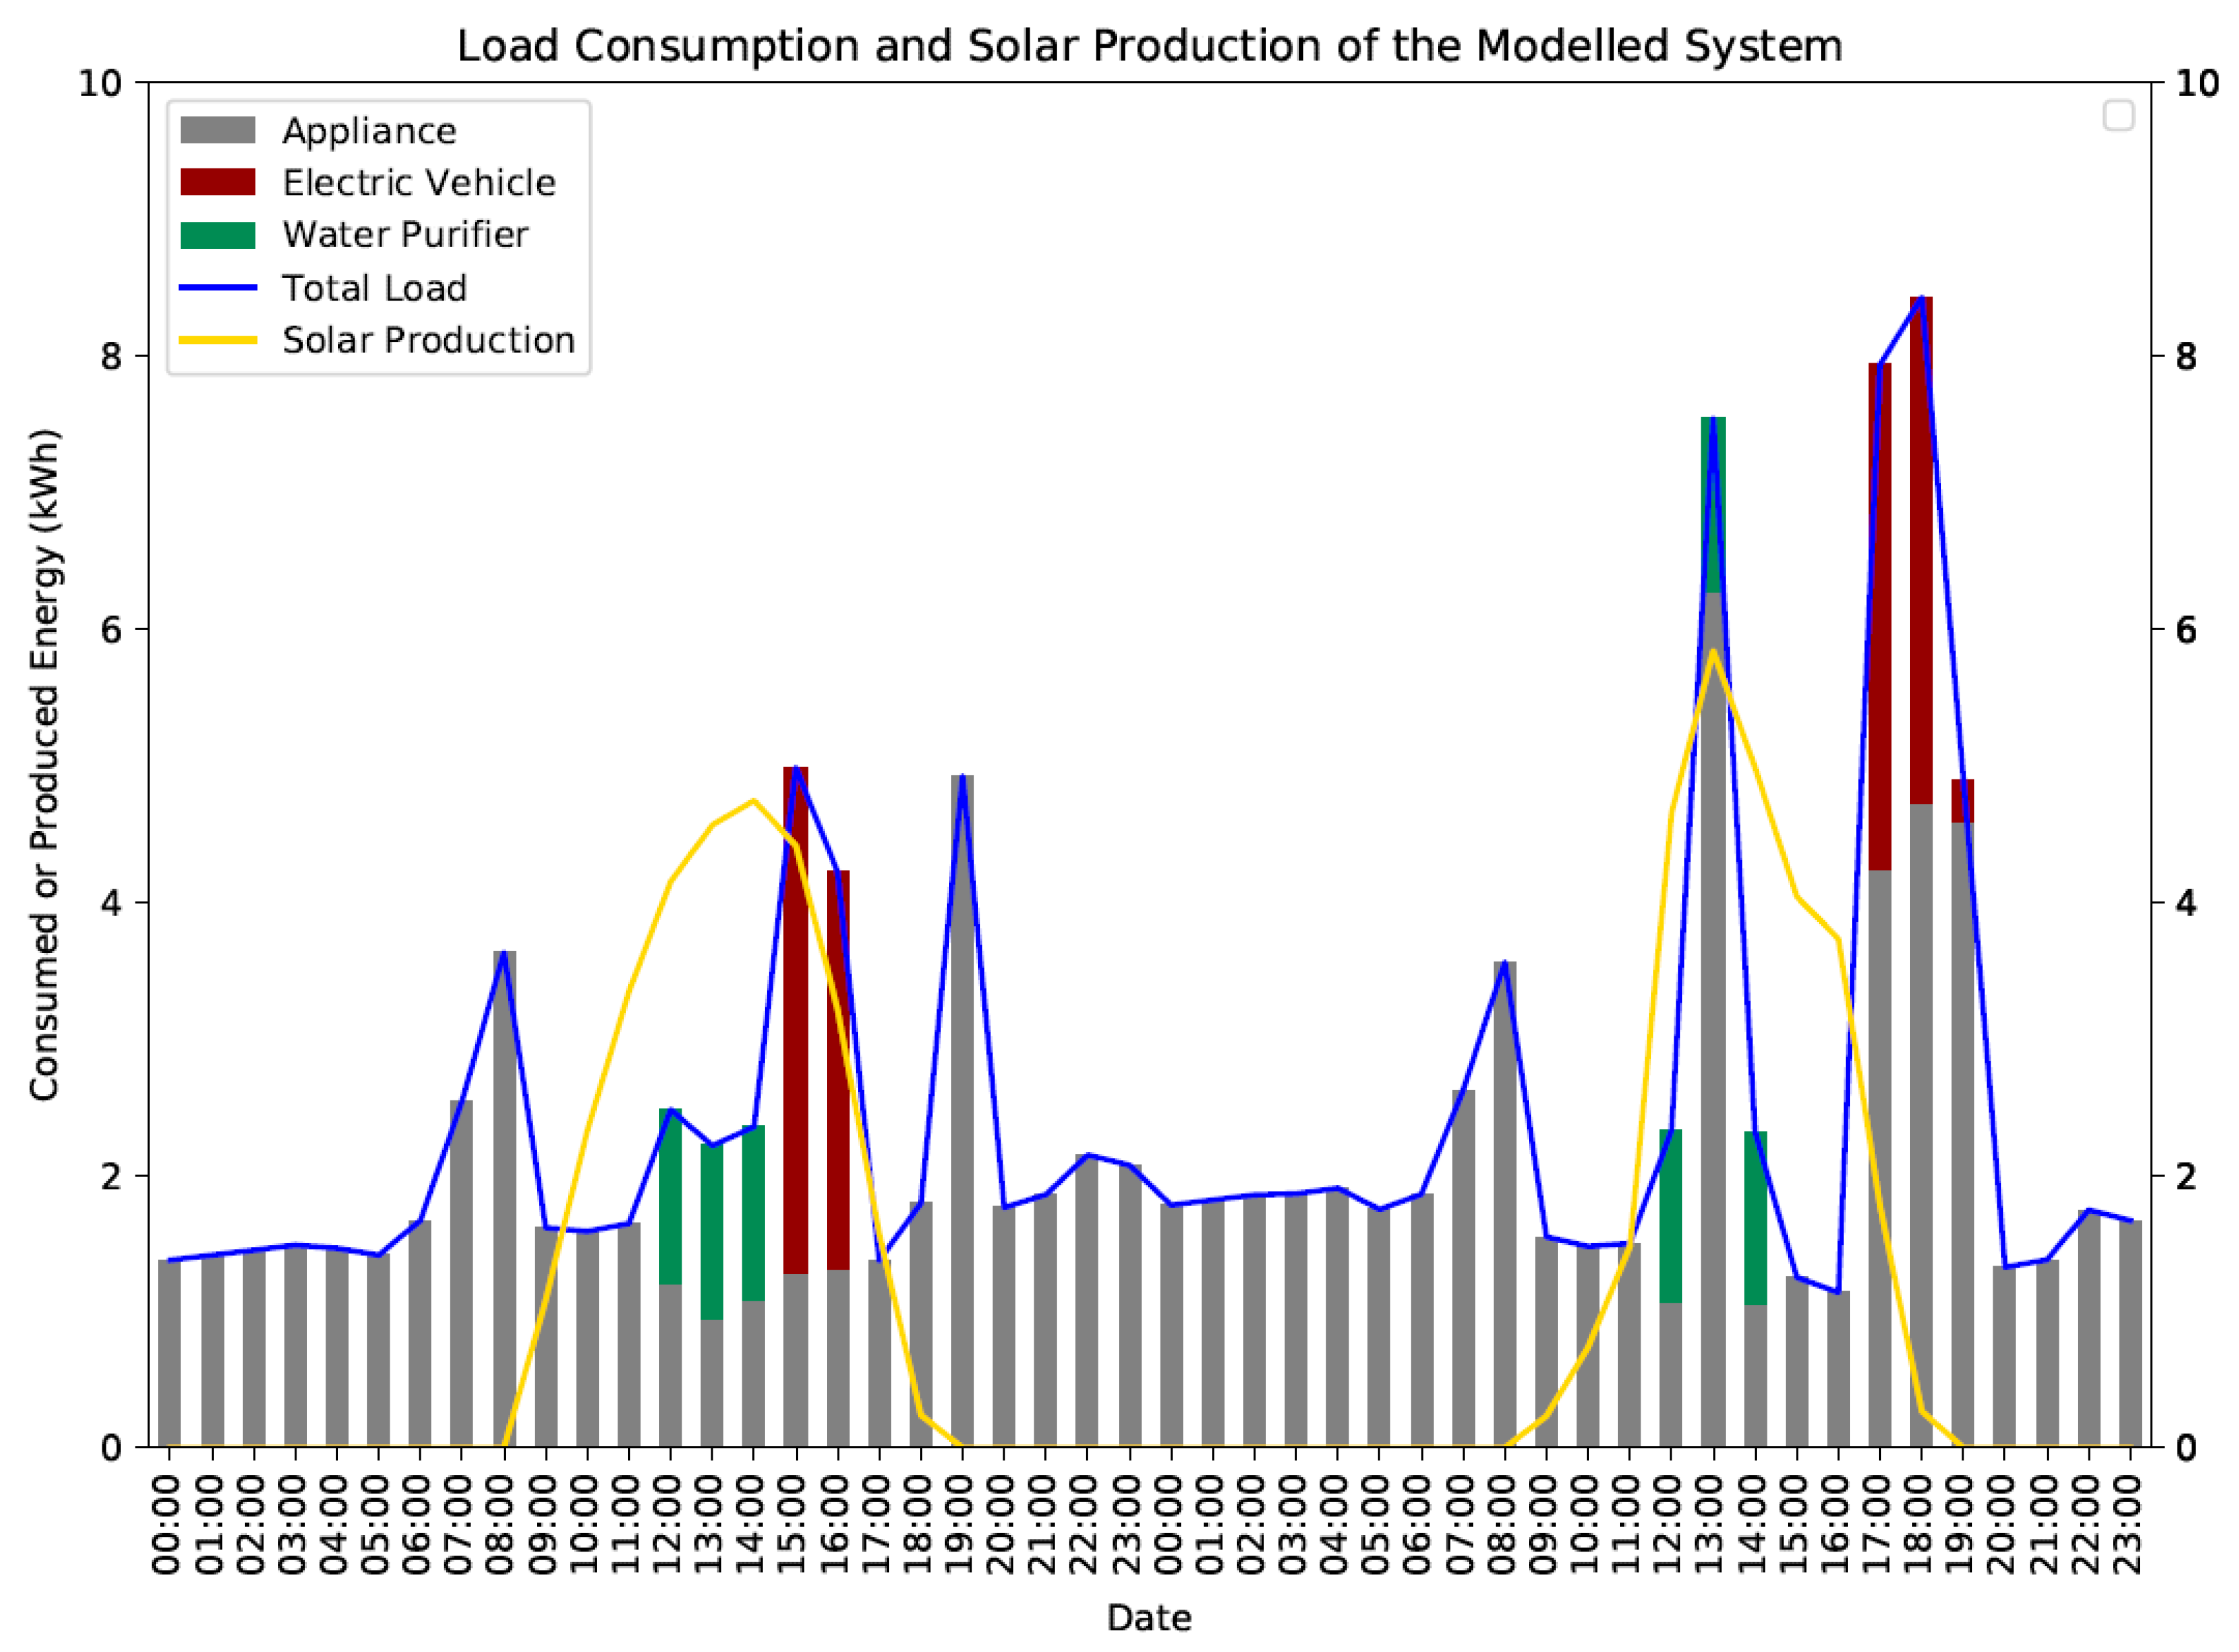
In a different case shared in Figure 10 and Figure 11, a period was chosen in March, when solar production was high. In this case, high energy production is at a level that can meet the entire water purifier load and a part of the electric vehicle load. Unlike the basic control structure in Figure 11, the proposed model water purifier shifted its loads only to the times when there was surplus, and the remaining surplus energy and the hours connected to the electric vehicle fed a part of the electric vehicle consumption. The remaining energy was transferred to the cheap tariff zone and fed from the battery and the grid.

Figure 10.
Load scheduling example in March.
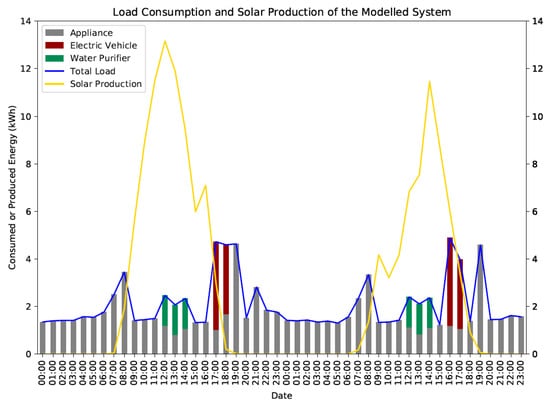
Figure 11.
Same dates of March without load scheduling.
7.2. Battery Charge/Discharge Scheduling
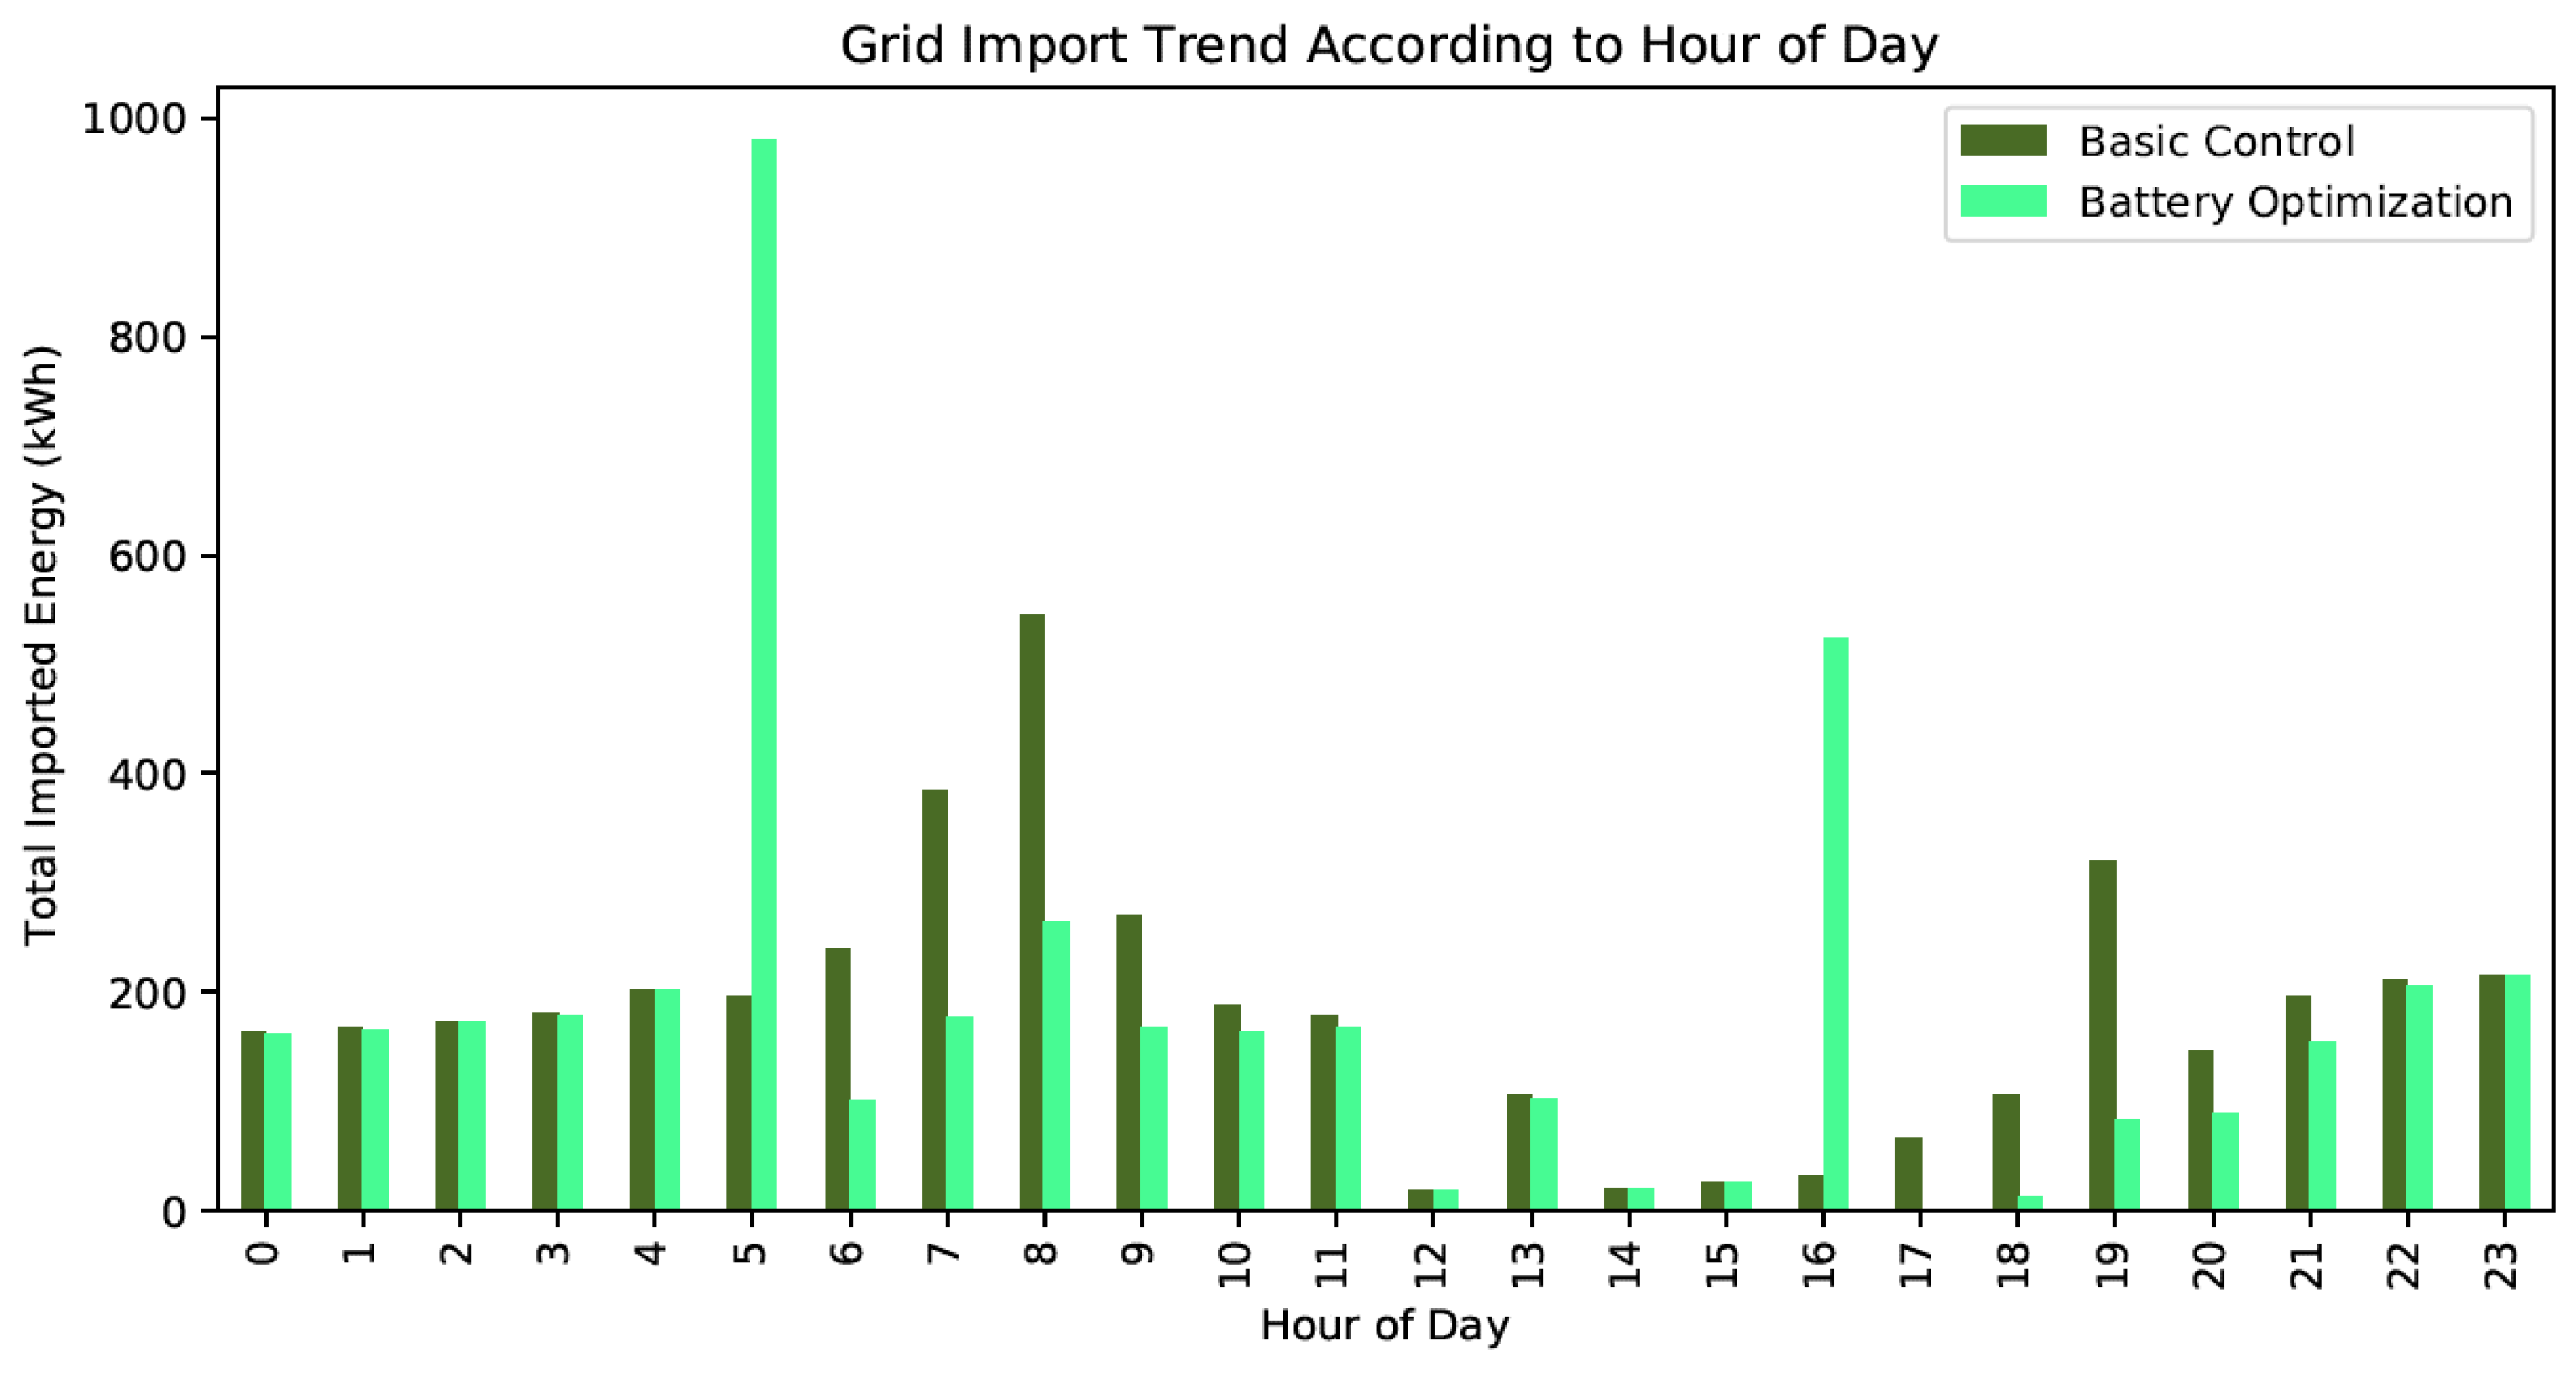
In the second stage of the proposed algorithm, the charging and discharging time of the battery was shifted to the most appropriate time according to production, consumption, tariff and battery capacity. Figure 12 and Figure 13 show the energy exchange with the grid depending on the use of basic control and the proposed algorithm. While the battery is discharged according to the surplus or deficit energy in the basic control structure, the battery and main charge-discharge time are scheduled according to the ToU tariff in the optimisation algorithm. The optimisation algorithm provides additional savings by shifting to the right time without making additional energy exchange from the grid, according to the trend of generation and consumption during the day. It can be seen in Figure 12 and Figure 13 that imports and exports to the grid are concentrated, especially during the transition hours between the tariff time. For example, in import time, the battery and system loads were fed together from the grid and the solar system at 5 a.m. and 4 p.m., which is the transition time to more expensive time in the ToU tariff. Thus, the amount of energy drawn in the next high-tariff hours was reduced. Additional savings are provided, especially in the winter months when solar production is low. On the other hand, additional savings were achieved by shifting the exported energy to 9 p.m., the last hour of the most expensive time zone. Besides, there is no extra energy exchange with the grid in either process.
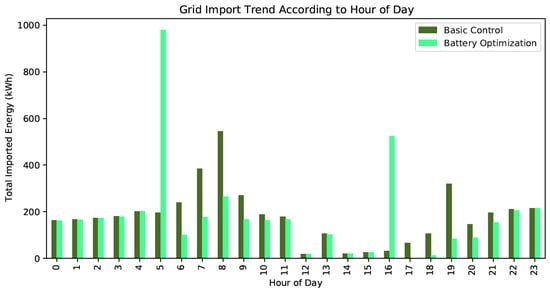
Figure 12.
Grid import distribution between EMS methodologies.
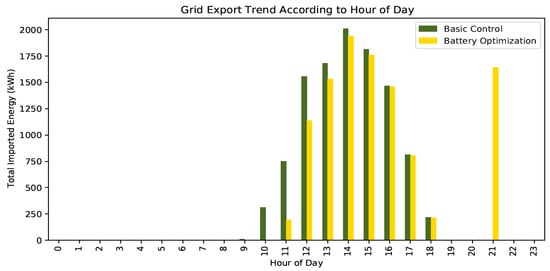
Figure 13.
Grid export distribution between methodologies.
7.3. Self-Sufficiency Analysis
As has been repeated many times, one of the main purposes of this study is to create a self-sufficient living space in terms of energy prosumer. In this context, efforts are made to ensure that the energy exchange of the system with the network is as low as possible. For this purpose, the most dominant constraint in the developed algorithms has been to minimise the energy transaction. However, in the same way, different limits are also valid for self-sufficiency.
Battery capacity is the most important parameter in this sense, and there is an important trade-off between system return on investment and self-sufficiency. To measure impact, all three energy management methods were tested in the following scenarios:
- -
- BC 1 Batt: Basic Control Method tested on a 1-battery system
- -
- BC 2 Batt: Basic Control Method tested on a 2-battery system
- -
- BC 3 Batt: Basic Control Method tested on a 3-battery system
- -
- OPT 1 Batt: Battery Optimization Method tested on a 1-battery system
- -
- OPT 2 Batt: Battery Optimization Method tested on a 2-battery system
- -
- OPT 3 Batt: Battery Optimization Method tested on a 3-battery system
- -
- OPT + DR 1 Batt: 2-Stage Optimisation Method tested on a 1-battery system
- -
- OPT + DR 2 Batt: 2-Stage Optimisation Method tested on a 2-battery system
- -
- OPT + DR 3 Batt: 2-Stage Optimisation Method tested on a 3-battery system
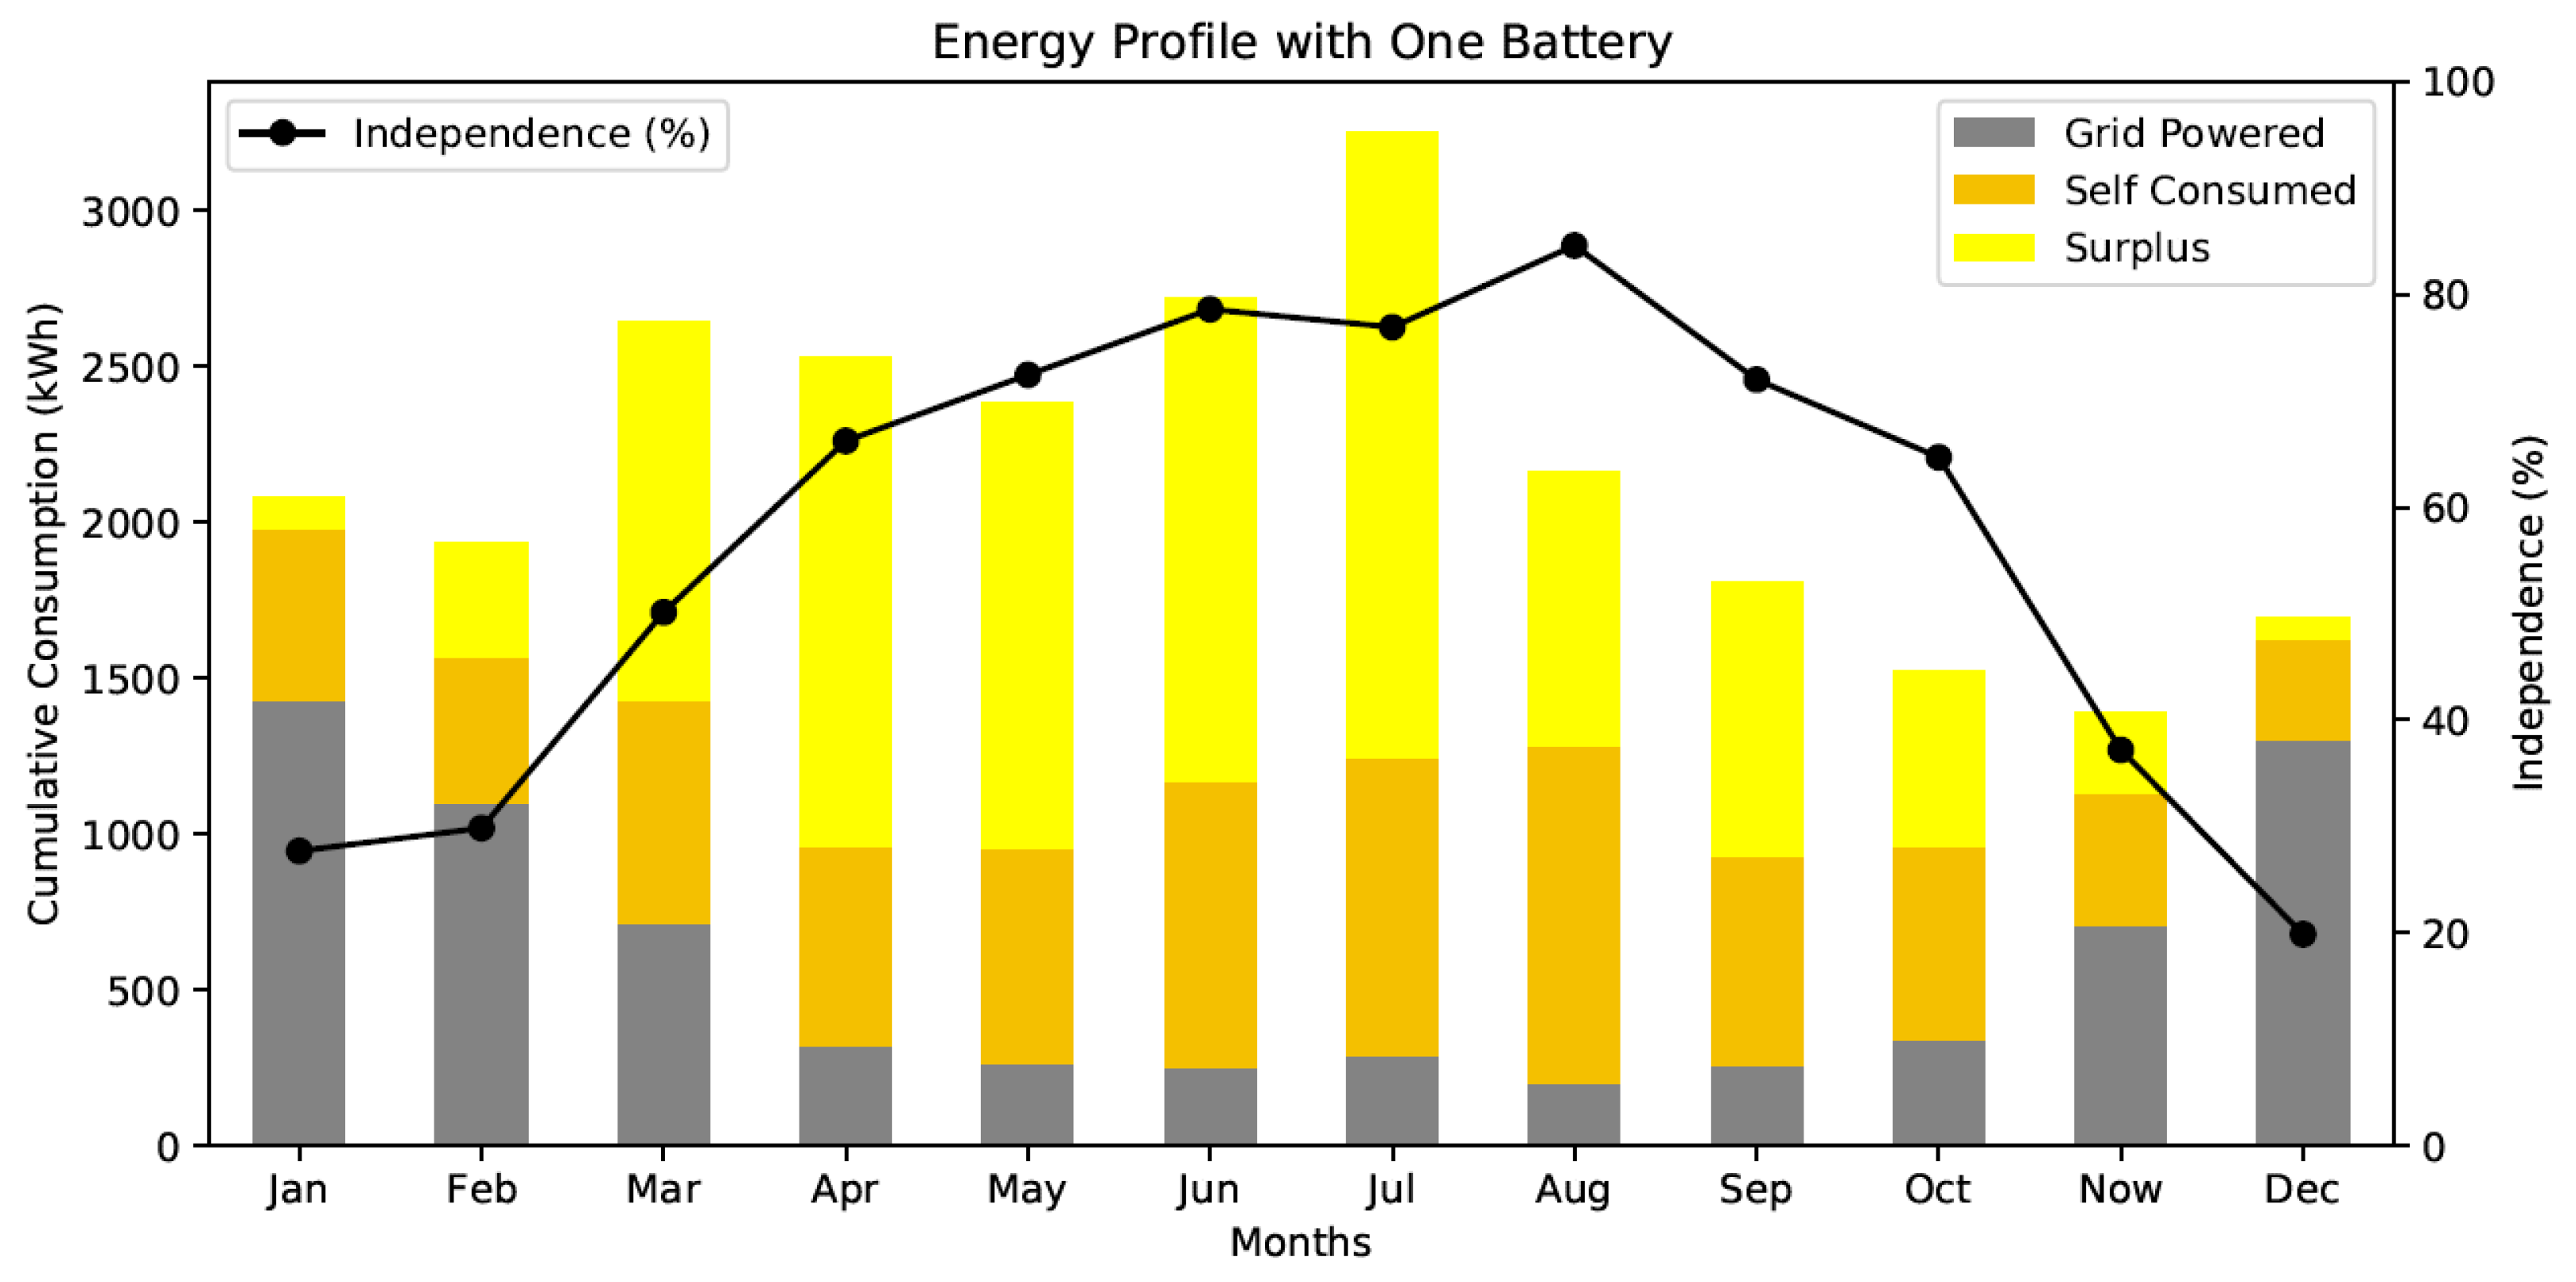
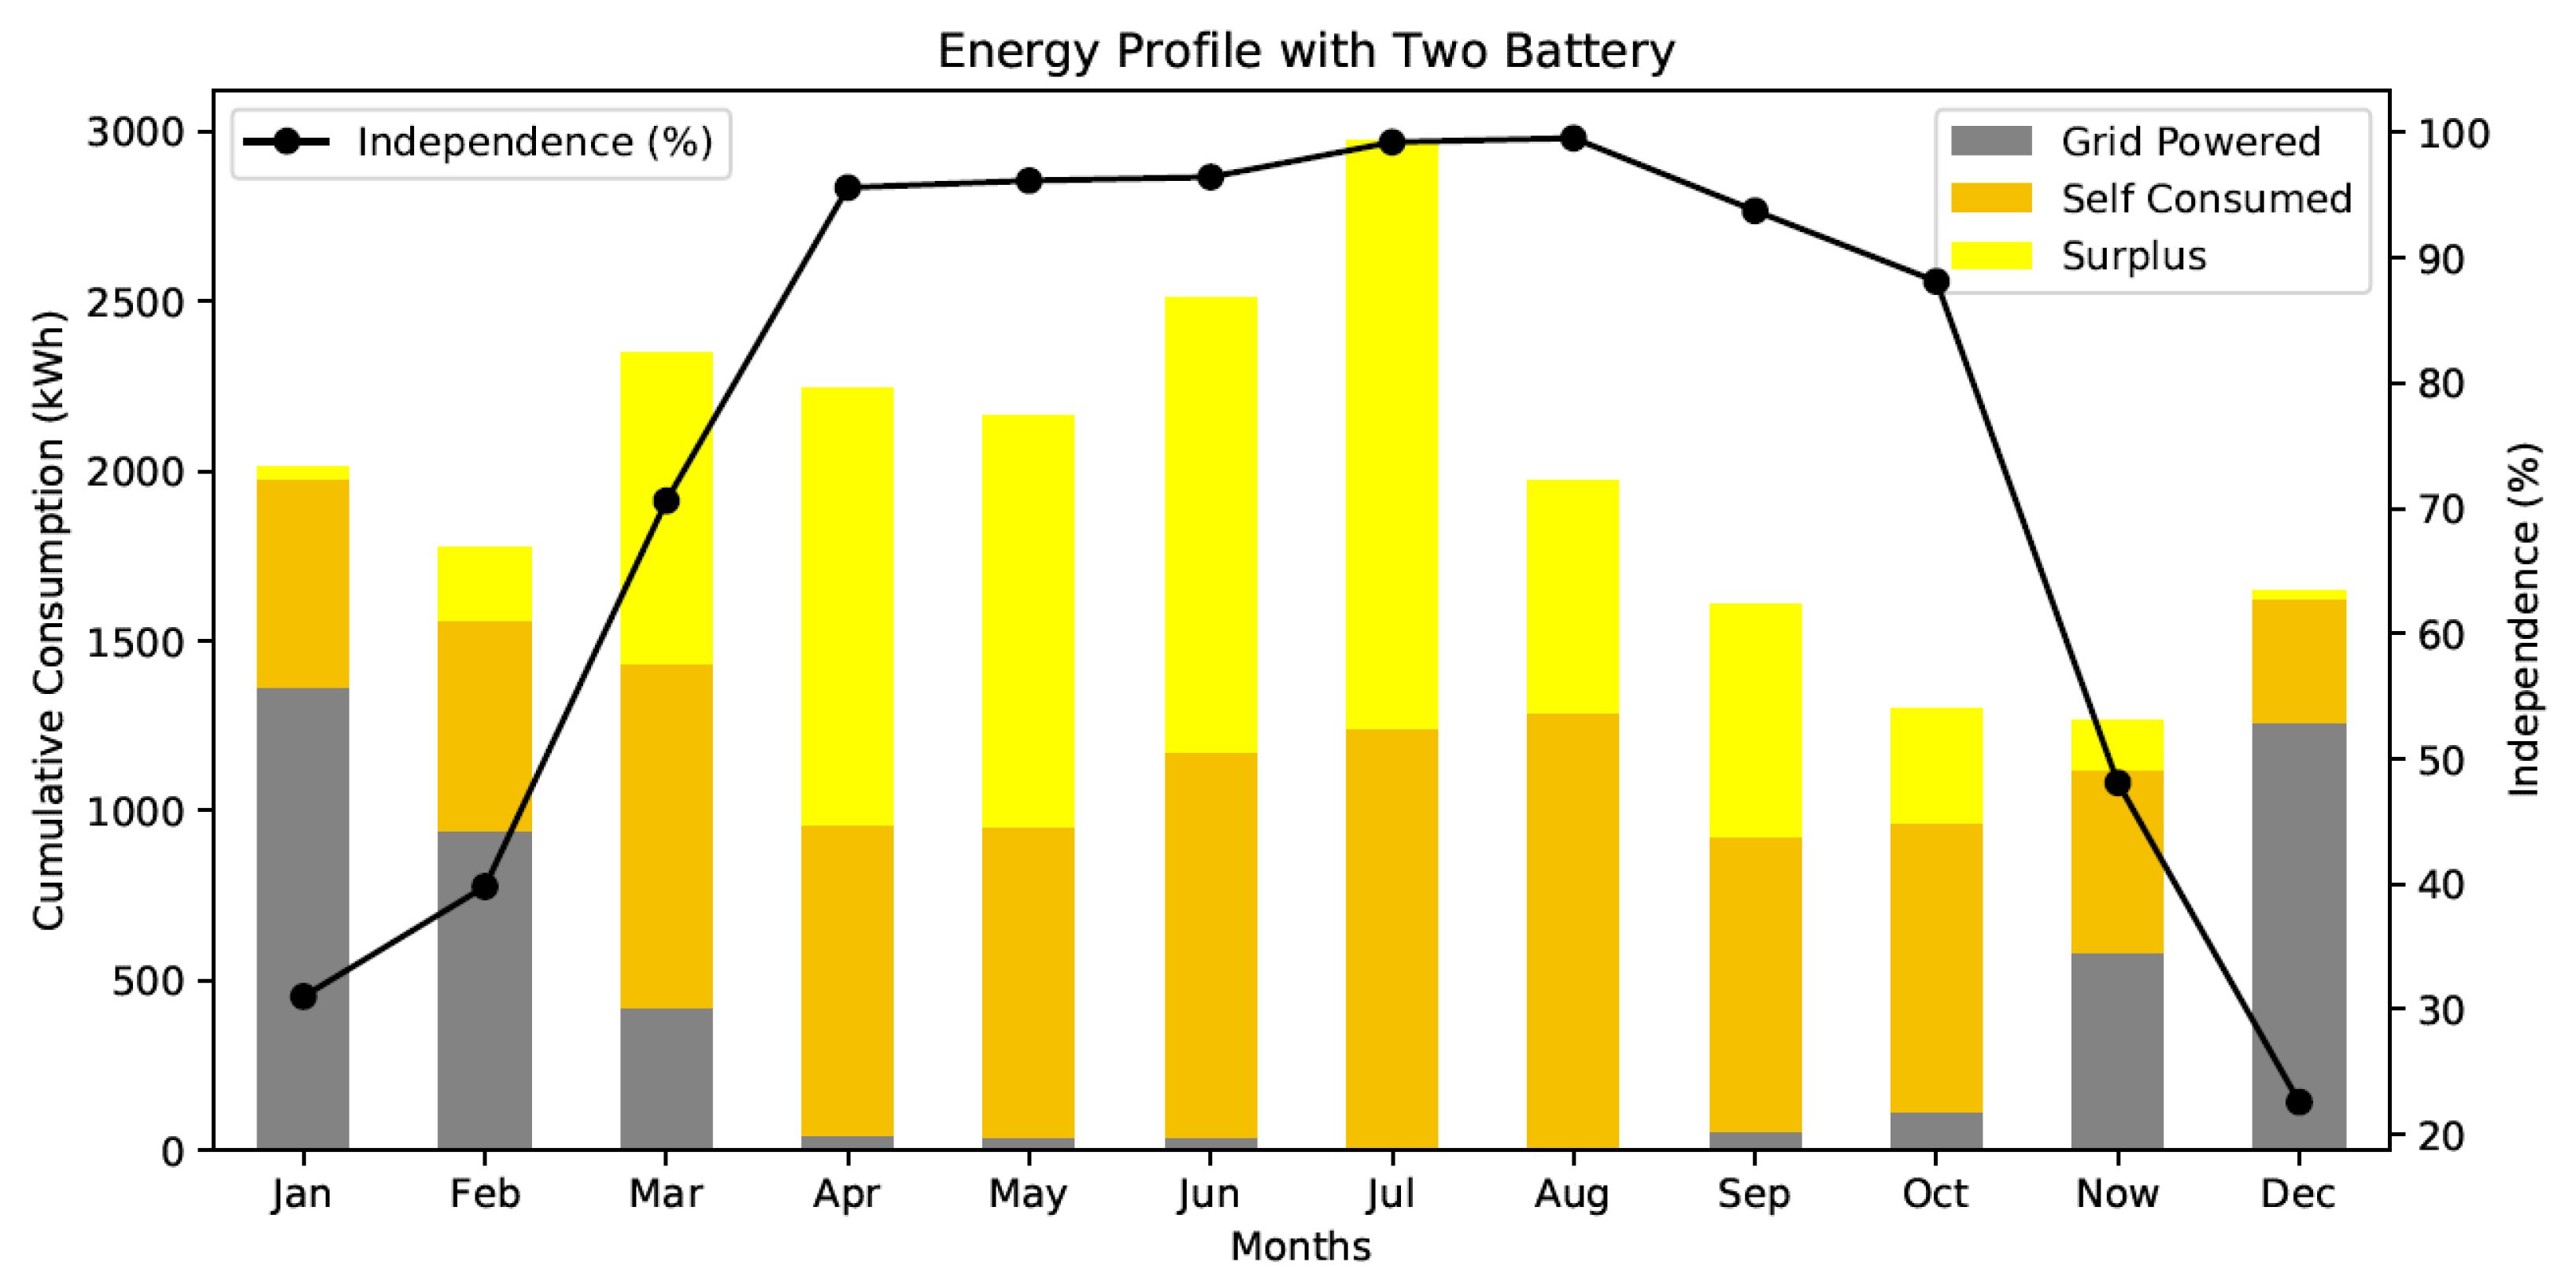
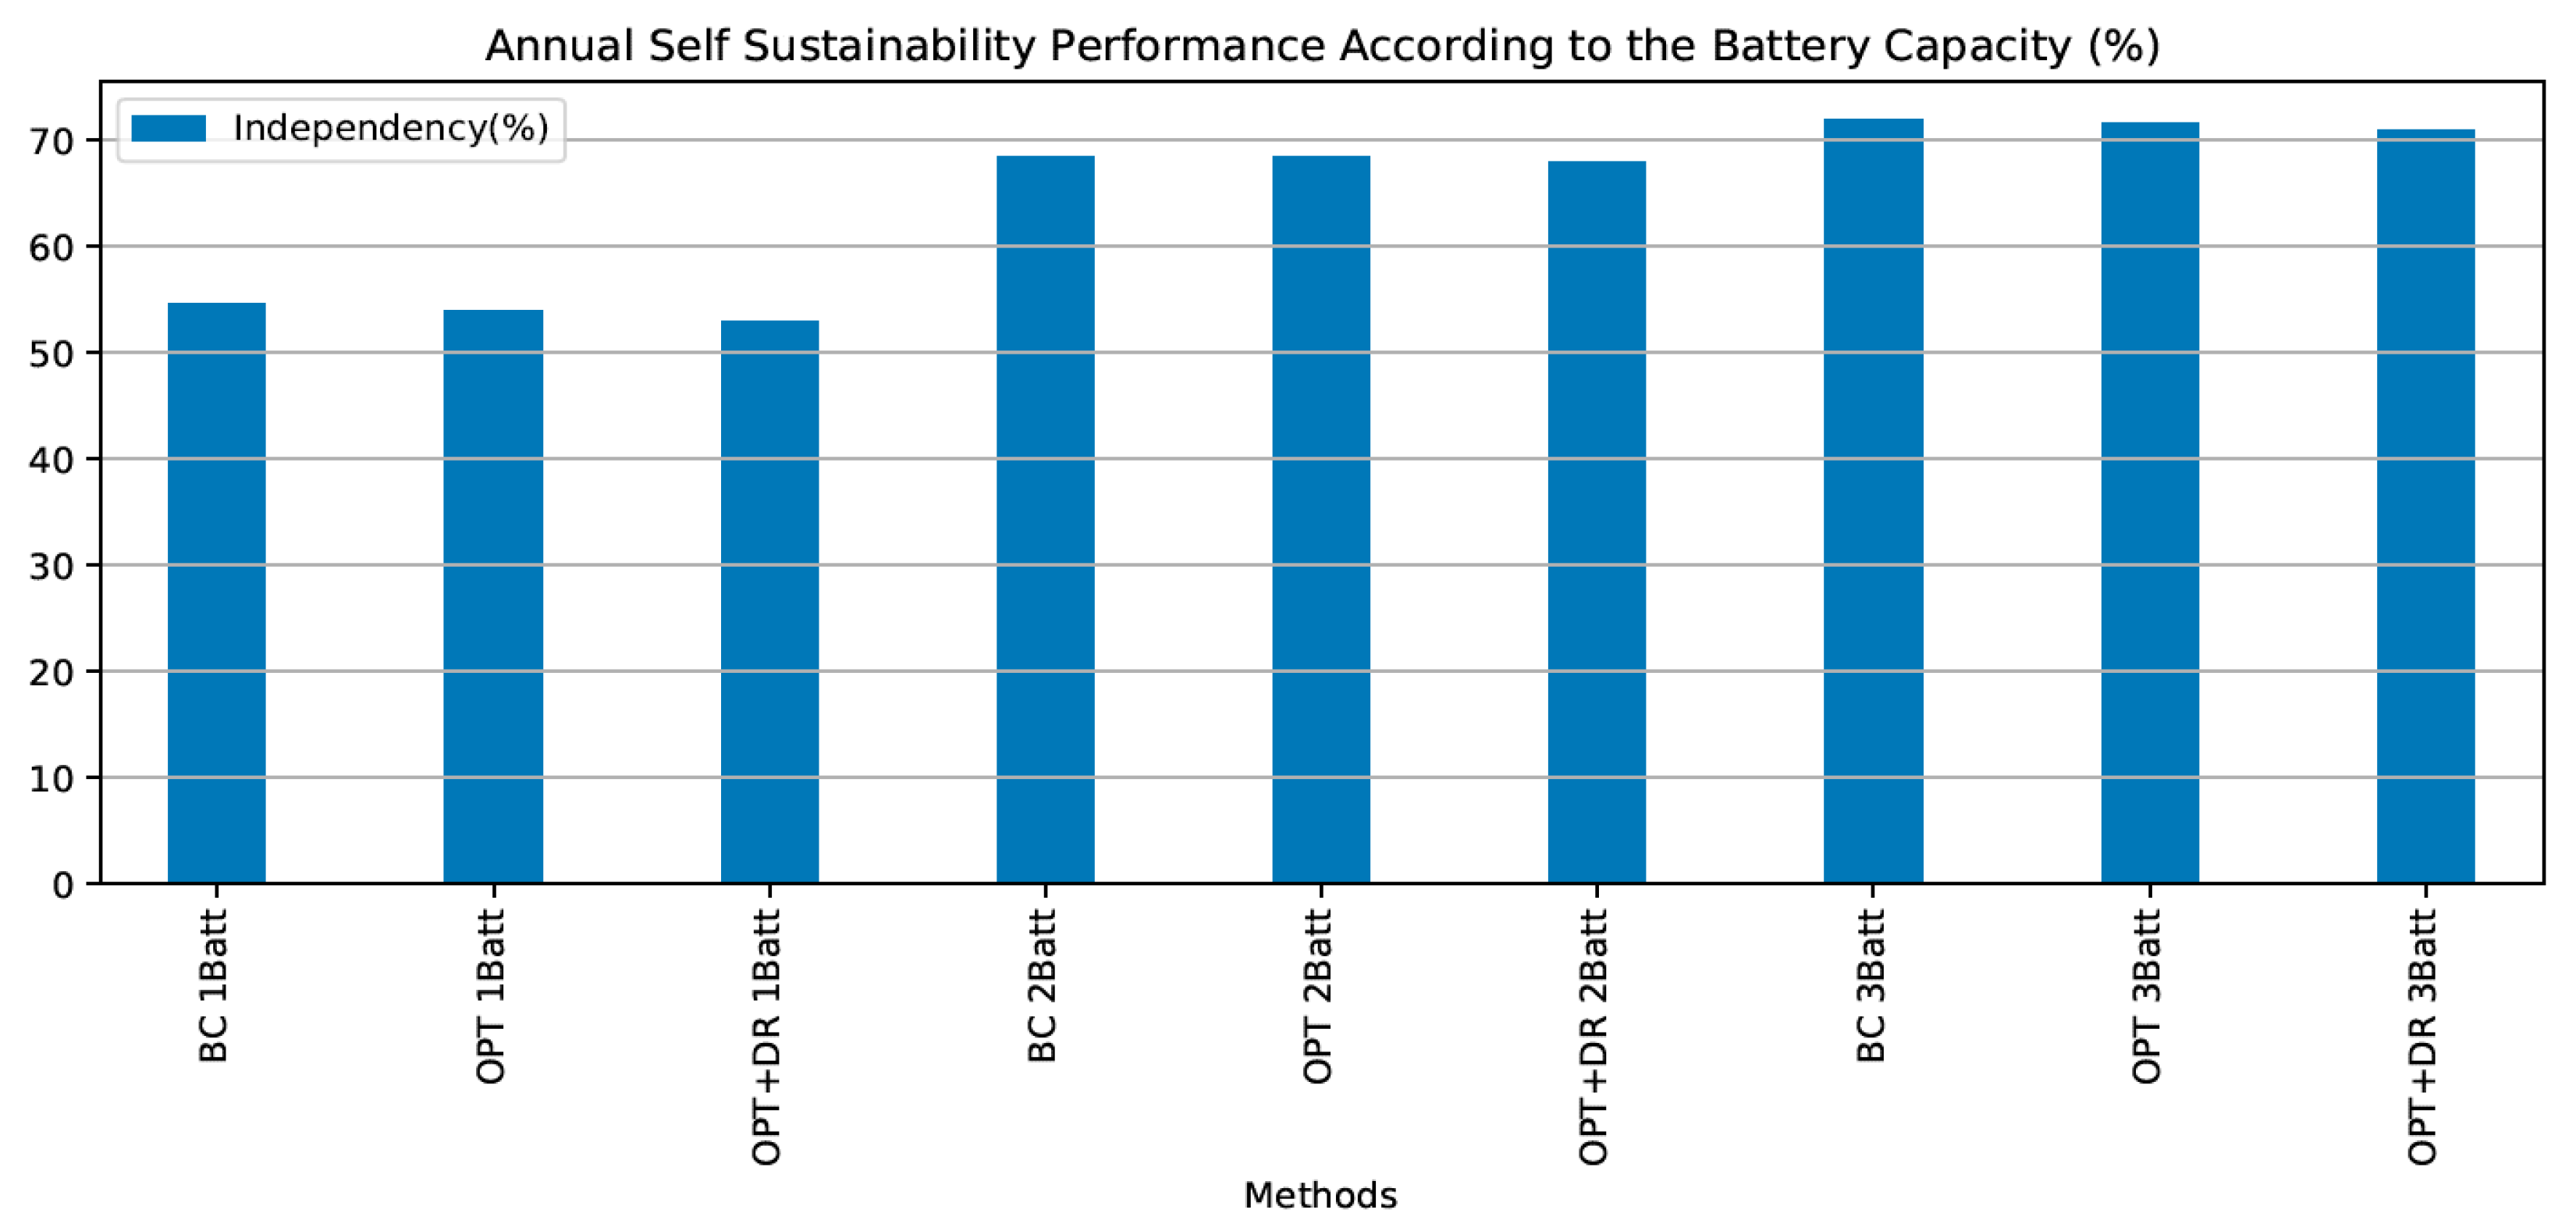
The distribution of produced and consumed energy and self-sufficiency ratio by months can be seen in Figure 14 and Figure 15. It is obvious that, with the increase in the number of batteries, more of the consumed energy can be fed by solar energy. However, as can be seen, there is not an increase as much as in seasonal transitions in the summer and winter months. However, with the additional battery capacity, almost complete self-sufficiency was achieved between April and October.

Figure 14.
Energy production and consumption results with one battery.
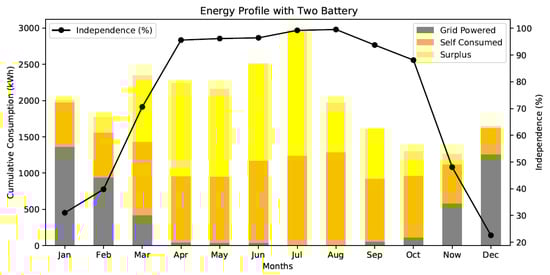
Figure 15.
Energy production and consumption results with two batteries.
Figure 16 presents a more comprehensive analysis of all scenarios. According to the results, self-sufficiency performances are almost equal among the energy management methods. This result supports the aim of the algorithm that we developed. On the other hand, it is seen that there is not a significant difference between two and three-battery systems. Therefore, considering the additional cost of a third battery to the system, it can be said that this is not a viable option.

Figure 16.
Annual self-sufficiency performance among different cases.
7.4. Cost-Benefit Analysis
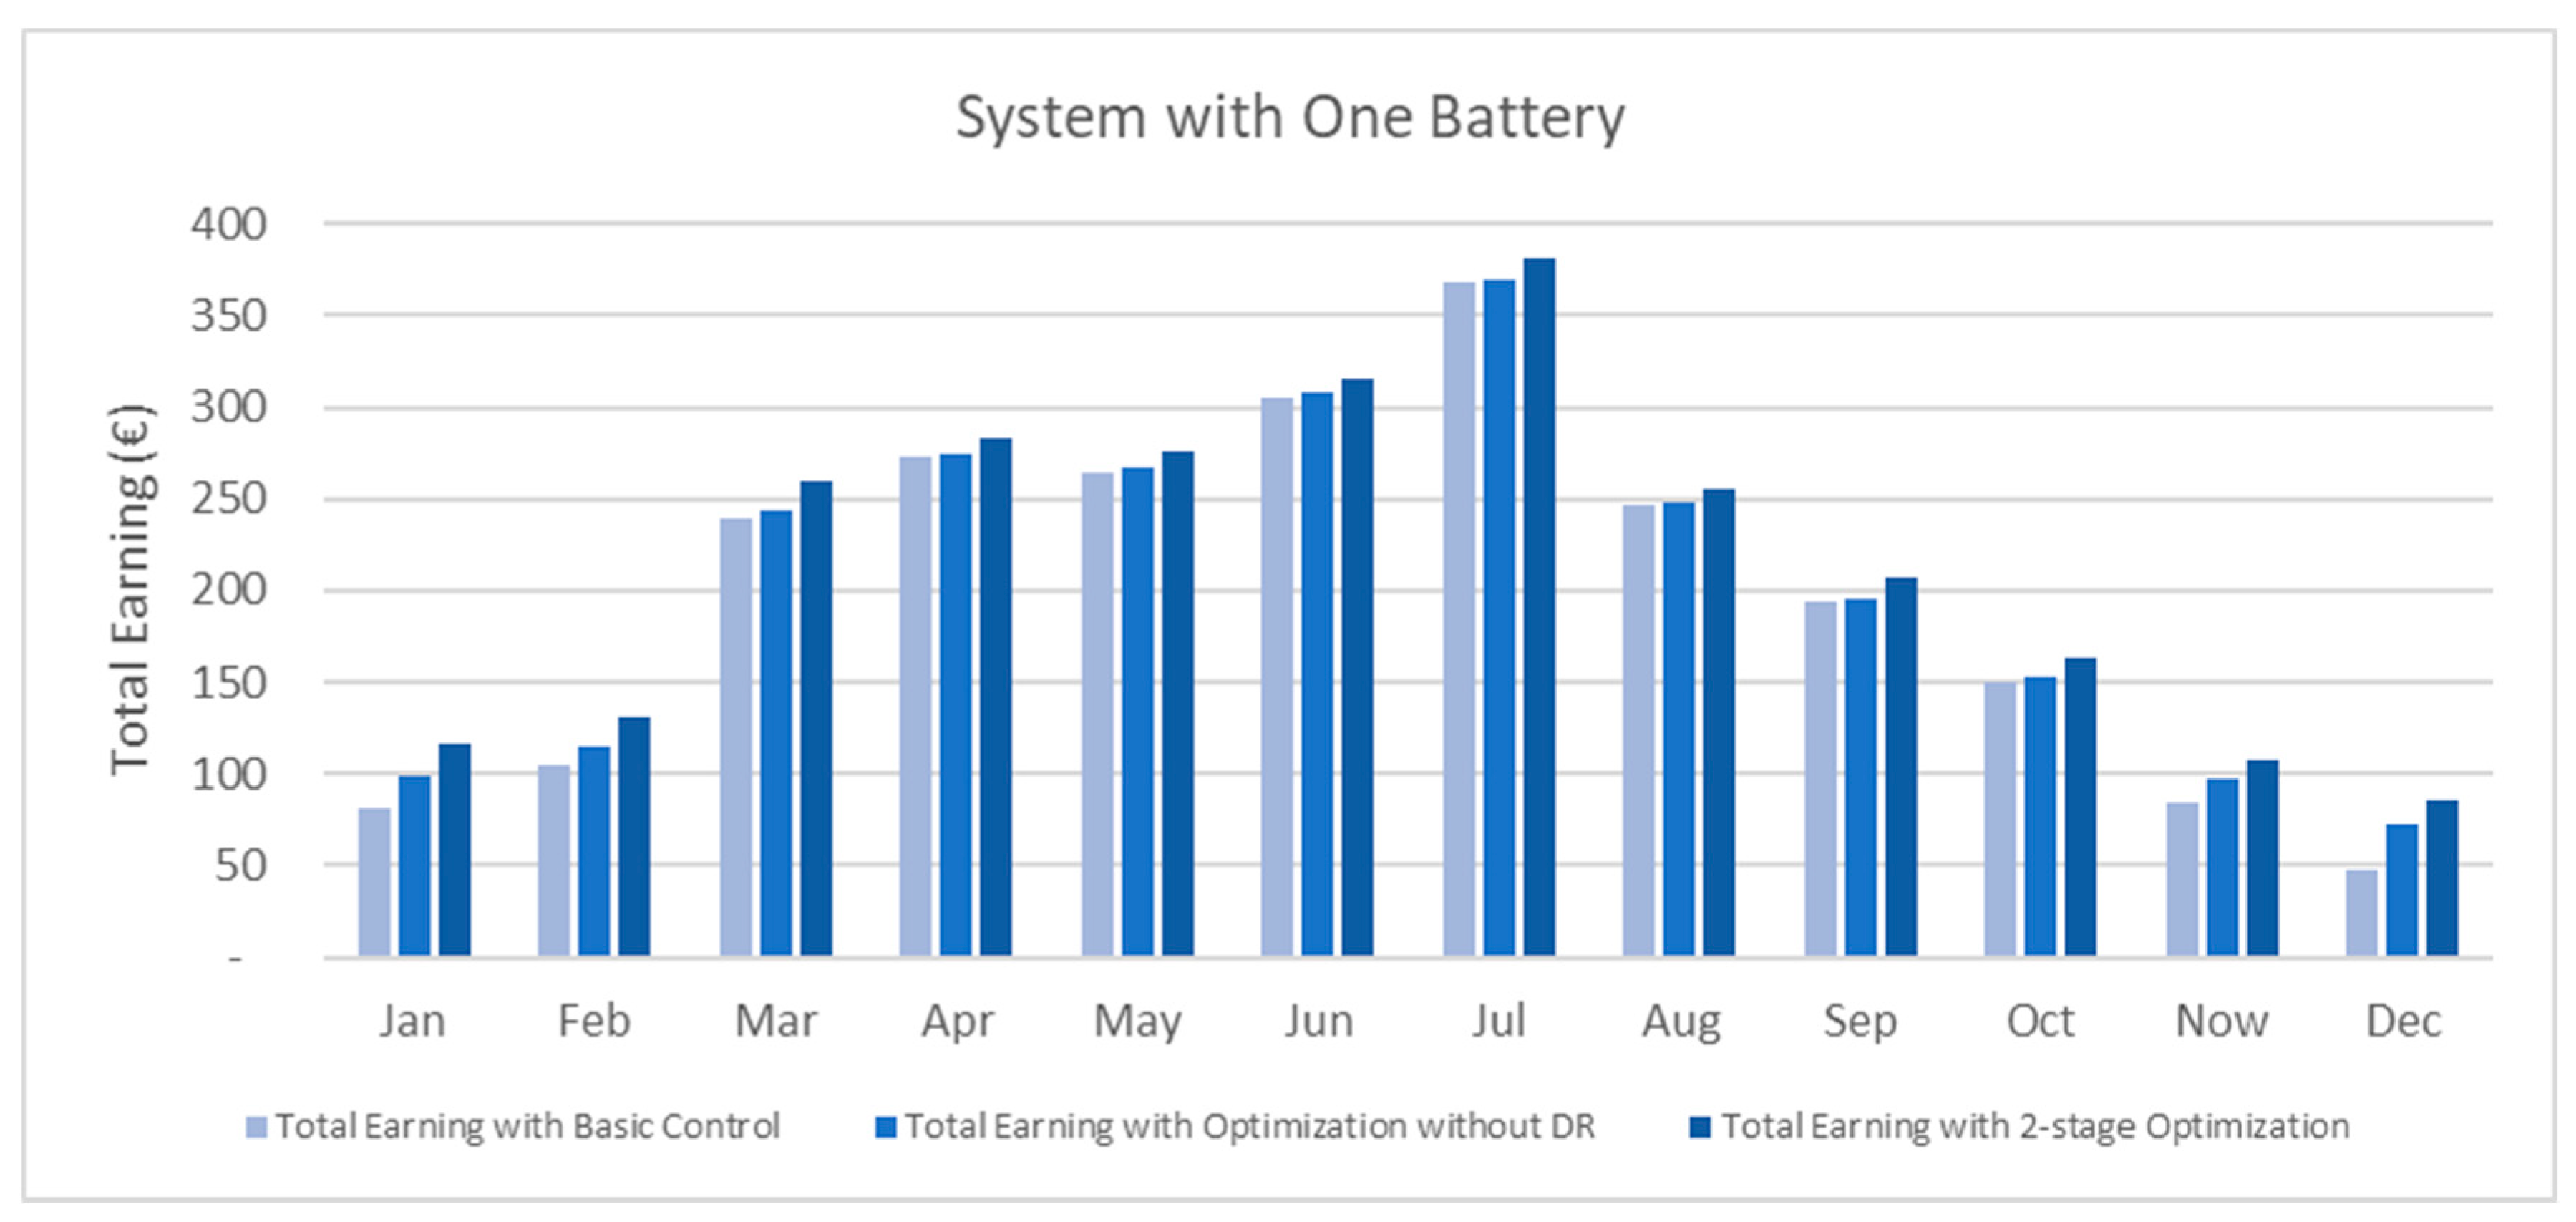
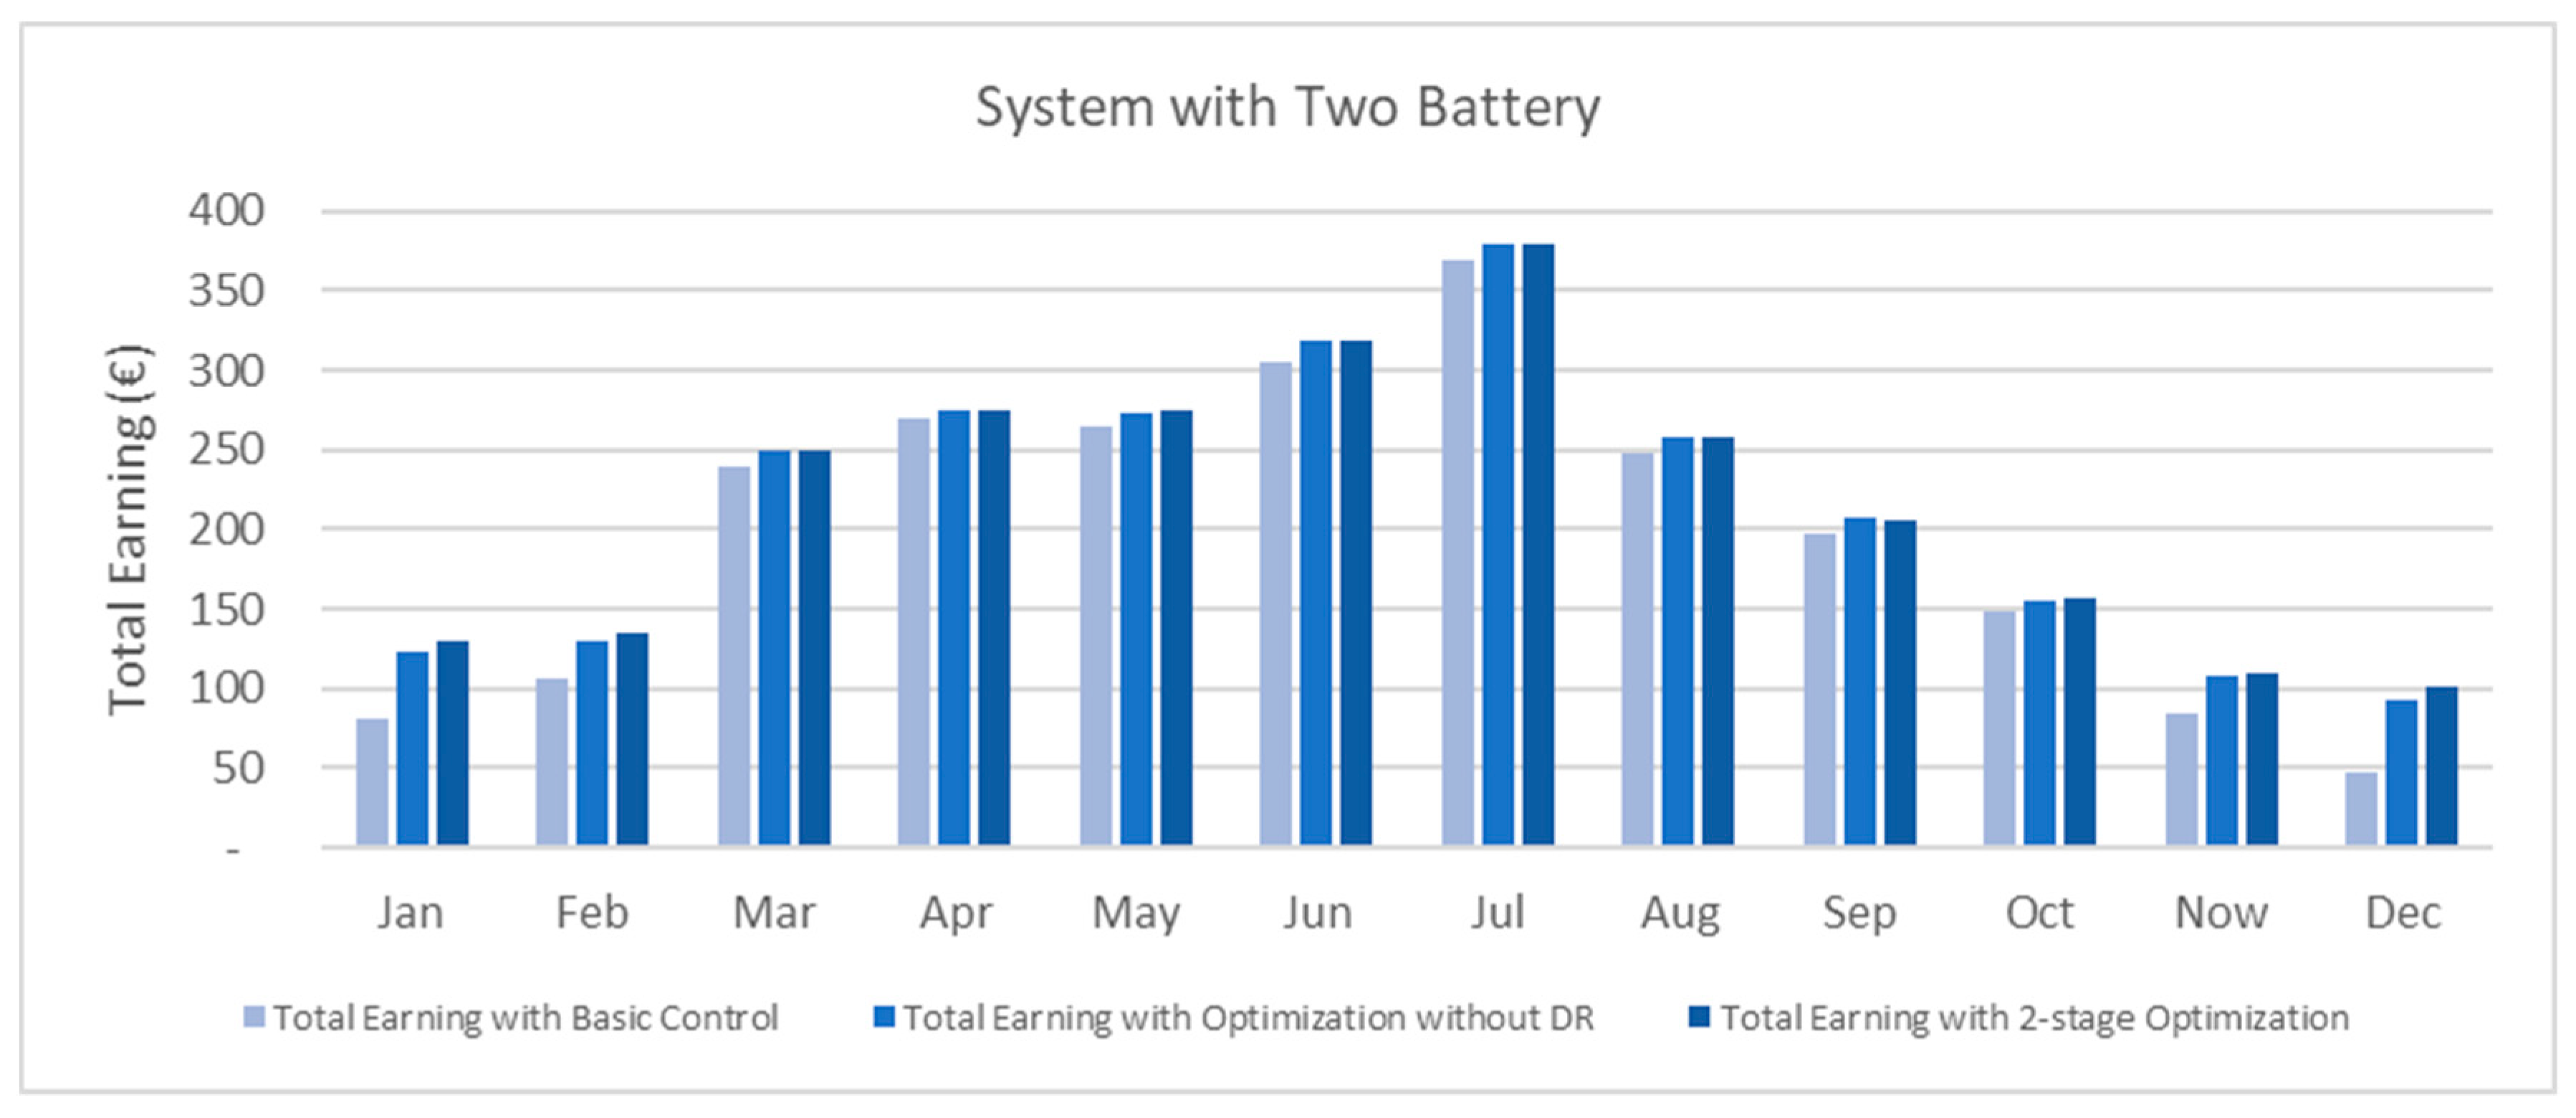
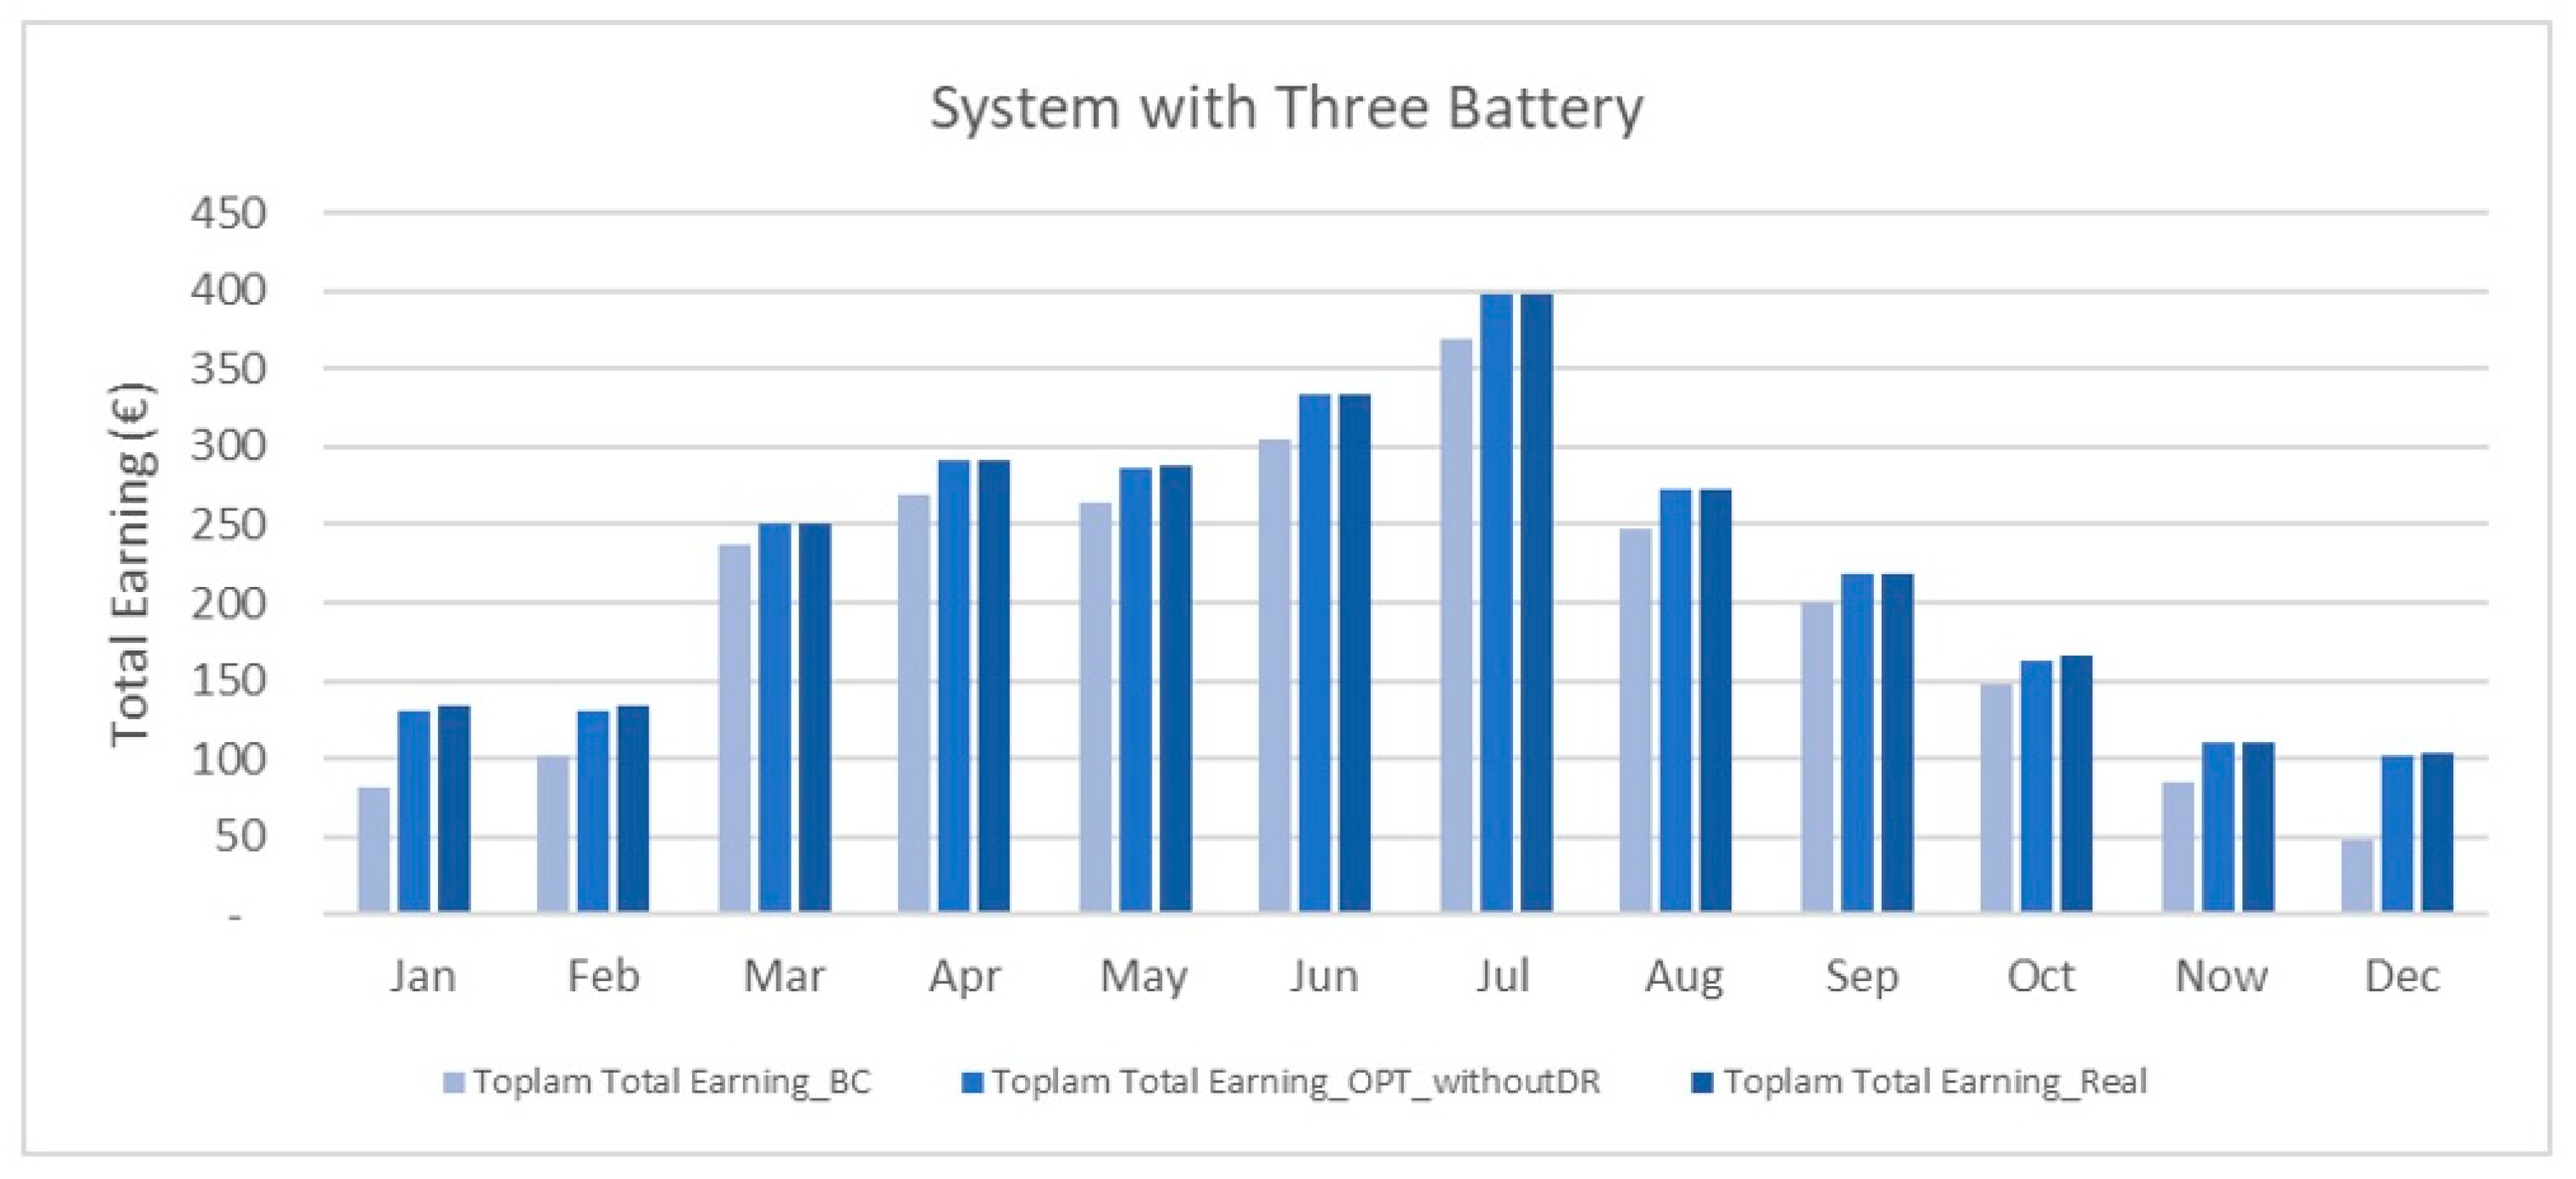
The main motivation of the optimisation study was to increase the earnings and reduce the depreciation costs of the system and thus make renewable energy systems more feasible for residential customers. The cost of benefit was compared for each case by making use of the earnings comparison formulas explained in the previous section. Figure 17, Figure 18 and Figure 19 show the calculated monthly earnings of the three methodologies according to the different battery numbers.
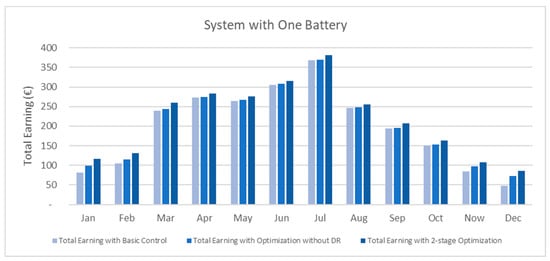
Figure 17.
Methodology comparison for a one-battery case.

Figure 18.
Methodology comparison for a two-battery case.

Figure 19.
Methodology comparison for a three-battery case.
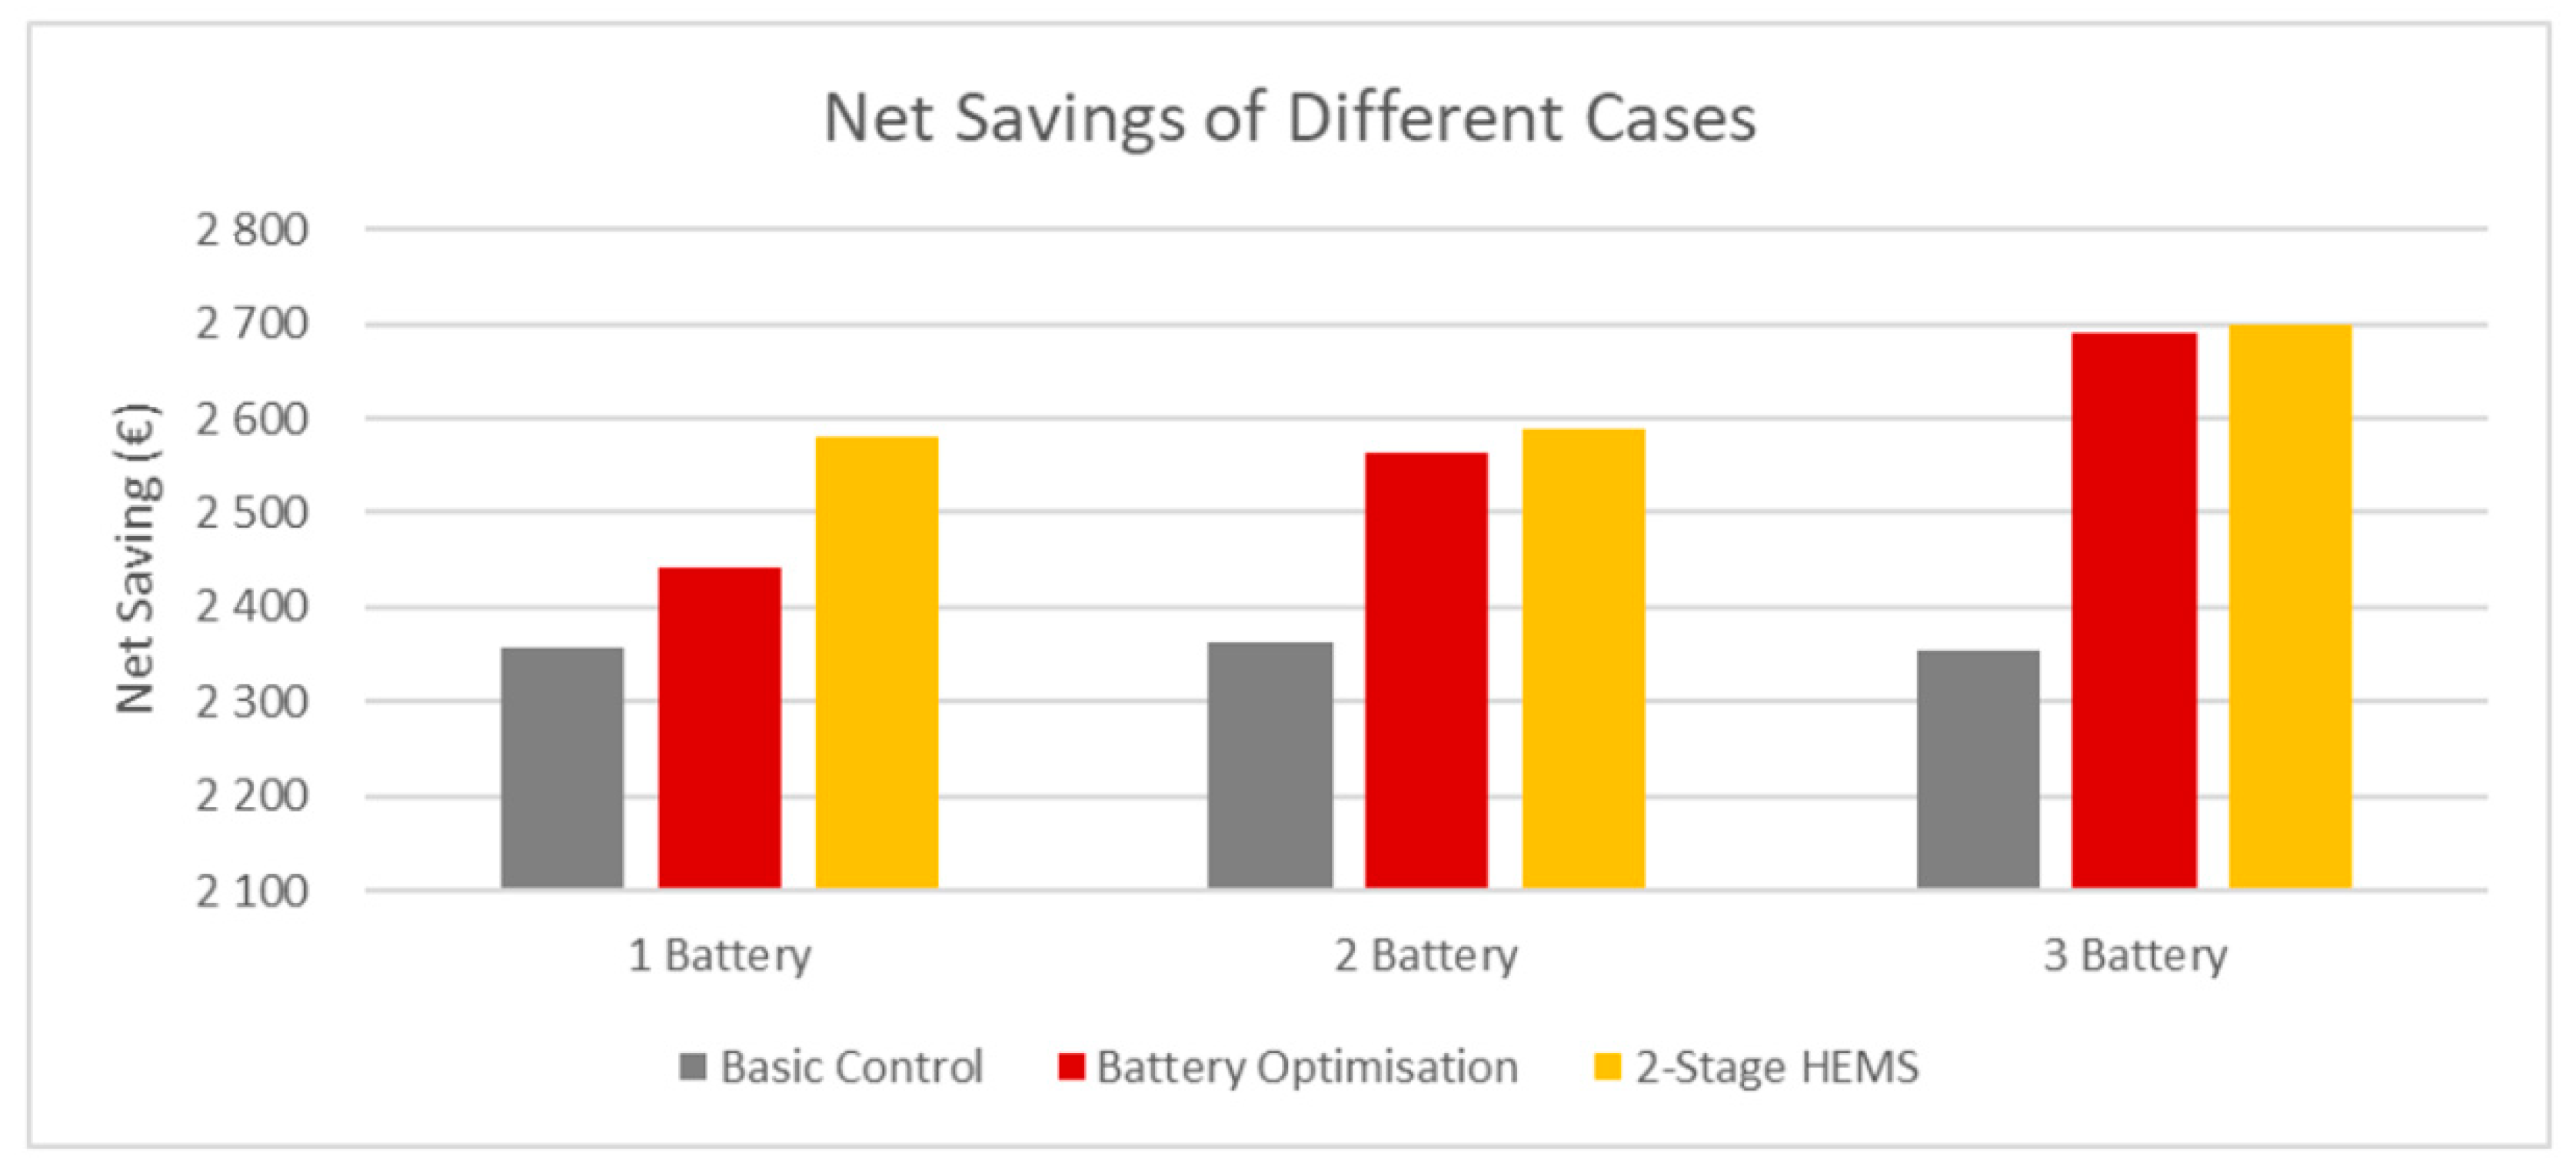
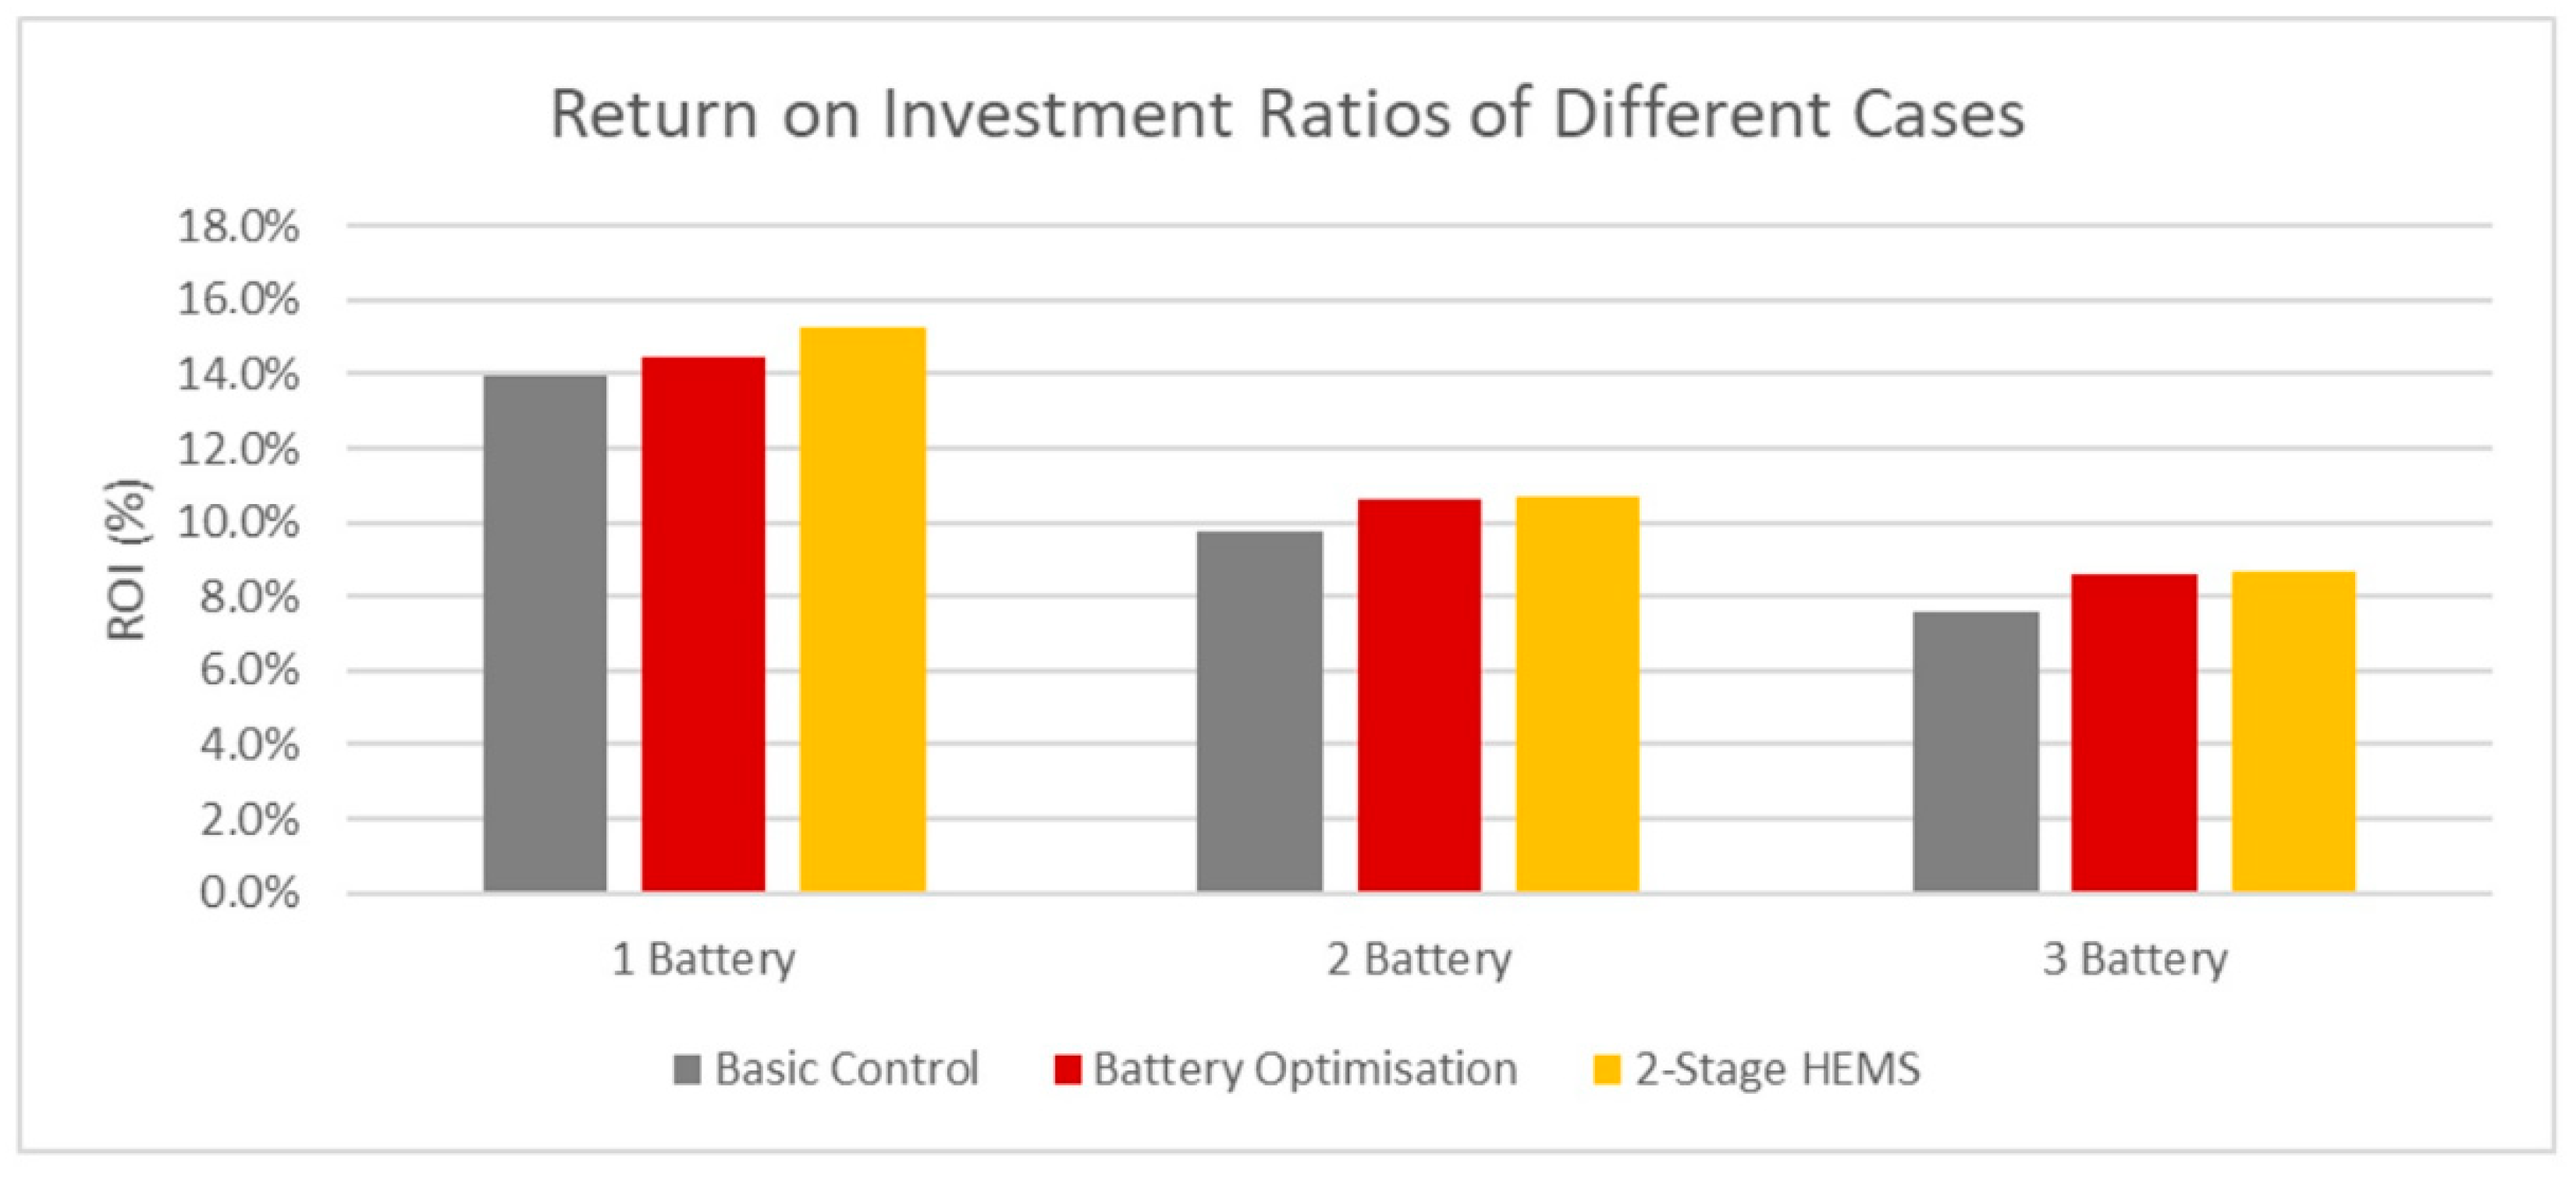
Figure 20 shows the annual results of net savings. As can be seen, in the single-battery scenario, battery optimisation increased by 3.7%, and the proposed two-stage structure provided a net saving increase of 9.5%. While the increase was almost the same in the scenario with two batteries, it rose to 14% in the scenario with three batteries. By including the system installation cost, the return on investments of the system and all cases were calculated and given in Figure 21. It is easily seen that the optimisation methods in each of the cases used provided additional gains each month. The fact that optimisation methodologies provide additional gain in every condition and time shows the success of the system. According to the results, the single-battery scenario, which is the most efficient system, and the two-stage structure, which includes load scheduling, increase the return-on-investment value from 13.9% to 15.3%, resulting in an increase of 10%.

Figure 20.
Annual net saving of different cases.

Figure 21.
Return on investment of different cases.
8. Conclusions
This paper assumes a self-sufficient residential prosumer in Turkey with a roof-top PV system as a resource, an EV, battery storage and a water purifier as the controllable energy consumption unit. We ignored shiftable and controllable household appliances by considering that the control mechanism might undermine user satisfaction and comfort and assumed the household appliances are non-controllable devices. There are three models that we applied, namely: basic control, battery optimisation and Hybrid Home Energy Management System (HEMS). As stated in the previous sections, the basic control method offers no optimisation. The battery optimisation model governs charging and discharging processes that are scheduled to maximise profit according to 24 h solar generation and energy consumption trends. The HEMS model aims for self-sufficiency only. The model is a kind of multi-objective and multi-variable optimisation algorithm.
When the results are examined in detail, we reach the following conclusions:
- The number of batteries does not provide any additional savings in the system managed with the Basic Control structure. The net saving, which is 2.357 with a single battery, is 2.362 with two batteries and 2.354 with three batteries. Moreover, the ROI value decreases from 13.9% to 9.8% in a 2-battery system and 7.5% in a 3-battery system. Therefore, optimisation algorithms are needed.
- Even with the optimisation algorithms, it is seen that the increase in the number of batteries is not effective enough. In such a netting model, the increase in the number of batteries reduces the ROI from 15.3% (single-battery scenario) to 8.6% (three-battery scenario).
- Adding load scheduling to the model in a single battery system makes a greater contribution than adding a battery. Despite the additional revenue a second battery brings, the ROI drops from 14.5% to 10.6%. Alternatively, when additional load scheduling is used for a single battery, this value increases to 15.3%. In this respect, it is very cost-effective to provide a smart management system without the additional battery cost.
- When the load scheduling effect is examined in systems with two and three batteries, it is seen that it provides a much lower effect than a system with a single battery. Even in the double and single battery system, 2-stage energy management has provided the same added value. The reason for this is that, with the increase in battery capacity, the electric vehicle can be fed from the energy stored in the battery. In this case, it makes no sense to shift the electric vehicle load.
- Finally, when the ROI values are examined, it is seen that the use of optimisation methodology increases the ROI value, but the ROI decreases with the increase in the number of batteries. For instance, the proposed 2-stage structure single-battery system increases the ROI value from 13.9% to 15.3%, but as the number of batteries increases, the ROI decreases to 10.7% in the dual-battery scenario and 8.6% in the three-battery scenario, respectively. There is a need for new generation smart tariffs that will meet the flexibility needs of network operators, increase the use of renewable energy, and encourage prosumers. Although conventional ToU tariffs are beneficial in reducing peak consumption, they do not provide sufficient incentive for prosumers and cause the system load to be shifted to the night period when there is no solar generation at night.
- The energy optimisation model that is presented in this paper targets only residential usage. However, the model can be improved or implemented into residential communities—districts—to increase and sustain efficiency by controlling more than one residential electricity customer. As this paper shows, optimisation methods are needed to enhance more efficient energy production and consumption. Besides, a machine-learning algorithm should be developed to control and predict momentary and future energy production and consumption, as this paper only focuses on real-time data. Last but not least, residential EV fleet management should be considered and enhanced when residential communities are included in future work.
Author Contributions
Conceptualization, D.A.; methodology, D.A. and F.Ö.; validation, F.Ö., U.Ö. and B.B.İ.; formal analysis, D.A.; investigation, U.Ö.; resources, F.Ö.; data curation, B.B.İ.; writing—original draft preparation, D.A.; writing—review and editing, S.K.; visualization, F.Ö.; supervision, S.K.; project administration, S.K.; funding acquisition, S.K. All authors have read and agreed to the published version of the manuscript.
Funding
This research was funded by Scientific and Technological Research Council of Turkey, grant number 118C370.
Institutional Review Board Statement
Not applicable.
Informed Consent Statement
Not applicable.
Data Availability Statement
Data is contained within the article. The data presented in this study are available in “Küfeoğlu, S. The Home of the Future. In Digitalization and Resource Management; Springer International Publishing: The Netherlands, 2021”.
Conflicts of Interest
The authors declare no conflict of interest.
Abbreviations
| ICT | Information and Communications Technology |
| ODIH | Open Digital Innovation HUB |
| DSM | Demand Side Management |
| TOU | Time of Use |
| DSO | Distribution System Operators |
| DER | Distributed Energy Sources |
| HEMS | Home Energy Management Systems |
| EV | Electric Vehicles |
| PV | Photovoltaic |
| LSA | Hybrid Lightning Search Algorithm |
| ANN | Artificial Neural Network |
| EMS | Energy Management System |
| GA | Genetic Algorithm |
| BPSO | Binary Particle Swarm Optimization |
| WDO | Wind Driven Optimization |
| BFO | Bacterial Foraging Optimization |
| HGPO | Hybrid Genetic Algorithm and Particle swarm Optimisation |
| DR | Demand Response |
| V2H | Vehicle to Home |
| V2G | Vehicle to Grid |
| ESS | Energy Storage Systems |
| QoE | Quality of Experience |
| SHEMS | Smart Home Energy Management System |
| RES | Renewable Energy Sources |
| SOC | State of Charge |
| ROI | Return on Investment |
References
- Ekkert, M. Global Energy Transformation: A Roadmap to 2050; The International Renewable Energy Agency (IRENA): Abu Dhabi, United Arab Emirates, 2018. [Google Scholar]
- IRENA. Innovation Outlook Mini-Grids; International Renewable Energy Agency: Abu Dhabi, United Arab Emirates, 2016. [Google Scholar]
- Caramizaru, A.; Uihlein, A. Energy Communities: An Overview of Energy and Social Innovation, EUR 30083 EN.; Publications Office of the European Union: Luxembourg, 2020. [Google Scholar]
- Guo, F.; Wen, C.; Song, Y.-D. Distributed Control and Optimisation Technologies in Smart Grid Systems; CRC Press: Boca Raton, FL, USA, 2017. [Google Scholar]
- Cole, W.; Frazier, A.W. Impacts of increasing penetration of renewable energy on the operation of the power sector. Electr. J. 2018, 31, 24–31. [Google Scholar] [CrossRef]
- Palensky, P.; Dietrich, D. Demand Side Management: Demand Response, Intelligent Energy Systems. IEEE Trans. Ind. Inform. 2011, 7, 381–388. [Google Scholar] [CrossRef] [Green Version]
- Shao, S.; Pipattanasomporn, M.; Rahman, S. Demand Response as a Load Shaping Tool in an Intelligent Grid with Electric Vehicles. IEEE Trans. Smart Grid 2011, 2, 624–631. [Google Scholar] [CrossRef]
- Maharjan, I.K. Demand Side Management: Load Management, Load Profiling, Load Shifting, Residential and Industrial Consumer, Energy Audit, Reliability, Urban, Semi-Urban and Rural Setting; LAP Lambert Academic Publishing: Saarbrucken, Germany, 2010. [Google Scholar]
- Christensen, T.H.; Larsen, S.P.A.K.; Knudsen, H.N. How to engage households in energy demand response solutions? In ECEEE 2019 Summer Study Proceedings: Is Efficient Sufficient? European Council for an Energy Efficient Economy: Toulon, France, 2019. [Google Scholar]
- Patel, K.; Khosla, A. Home energy management systems in future smart grid networks: A systematic review. In Proceedings of the 2015 1st International Conference on Next Generation Computing Technologies (NGCT), Dehradun, India, 4–5 September 2015. [Google Scholar]
- Mahapatra, B.; Nayyar, A. Home Energy Management System (HEMS): Concept, Architecture, Infrastructure, Challenges and Energy Management Schemes. Energy Syst. 2019, 1–27. [Google Scholar] [CrossRef]
- Anvari-Moghaddam, A.; Guerrero, J.M.; Vasquez, J.C.; Monsef, H.; Rahimi-Kian, A. Efficient energy management for a grid-tied residential microgrid. IET Gener. Transm. Distrib. 2017, 11, 2752–2761. [Google Scholar] [CrossRef] [Green Version]
- Hussain, H.M.; Javaid, N.; Iqbal, S.; Hasan, Q.U.; Aurangzeb, K.; Alhussein, M. An Efficient Demand Side Management System with a New Optimized Home Energy Management Controller in Smart Grid. Energies 2018, 11, 190. [Google Scholar] [CrossRef] [Green Version]
- Samuel, O.; Javaid, S.; Javaid, N.; Ahmed, S.H.; Afzal, M.K.; Ishmanov, F. An Efficient Power Scheduling in Smart Homes Using Jaya Based Optimisation with Time-of-Use and Critical Peak Pricing Schemes. Energies 2018, 11, 3155. [Google Scholar] [CrossRef] [Green Version]
- Aslam, S.; Iqbal, Z.; Javaid, N.; Khan, Z.A.; Aurangzeb, K.; Haider, S.I. Towards Efficient Energy Management of Smart Buildings Exploiting Heuristic Optimization with Real Time and Critical Peak Pricing Schemes. Energies 2017, 10, 2065. [Google Scholar] [CrossRef] [Green Version]
- Alilou, M.; Tousi, B.; Shayeghi, H. Home energy management in a residential smart micro grid under stochastic penetration of solar panels and electric vehicles. Sol. Energy 2020, 212, 6–18. [Google Scholar] [CrossRef]
- Asadinejad, A.; Tomsovic, K. Optimal use of incentive and price based demand response to reduce costs and price volatility. Electr. Power Syst. Res. 2017, 144, 215–223. [Google Scholar] [CrossRef] [Green Version]
- Lujano-Rojas, J.M.; Monteiro, C.; Dufo-López, R.; Agustín, J.L.B. Optimum residential load management strategy for real time pricing (RTP) demand response programs. Energy Policy 2012, 45, 671–679. [Google Scholar] [CrossRef]
- Rezaee, Y.; Sedaghati, A. Optimal Operation Strategy of Power Systems in the Presence of Smart Grids and Electric Vehicles. Majlesi J. Mechatron. Syst. 2018, 6, 31–40. [Google Scholar]
- Wang, Z.; Yang, R.; Wang, L. Multi-agent control system with intelligent optimization for smart and energy-efficient buildings. In Proceedings of the IECON 2010—36th Annual Conference on IEEE Industrial Electronics Society, Glendale, AZ, USA, 7–10 November 2010; pp. 1144–1149. [Google Scholar] [CrossRef]
- Chekired, F.; Smara, Z.; Mahrane, A.; Chikh, M.; Berkane, S. An Energy Flow Management Algorithm for a Photovoltaic Solar Home. Energy Procedia 2017, 111, 934–943. [Google Scholar] [CrossRef]
- Fachrizal, R.; Munkhammar, J. Improved Photovoltaic Self-Consumption in Residential Buildings with Distributed and Centralized Smart Charging of Electric Vehicles. Energies 2020, 13, 1153. [Google Scholar] [CrossRef] [Green Version]
- Thailand Smart Grid Master Plan 2015–2036; Energy Policy and Planning Office, Ministry of Energy: Bangkok, Thailand, 2015; (Online); Available online: http://www.eppo.go.th/images/Power/pdf/smart_gridplan.pdf (accessed on 25 May 2021).
- Srikranjanapert, M.; Junlakarn, S.; Hoonchareon, N. How an Integration of Home Energy Management and Battery System Affects the Economic Benefits of Residential PV System Owners in Thailand. Sustainability 2021, 13, 2681. [Google Scholar] [CrossRef]
- Dinh, H.T.; Yun, J.; Kim, D.M.; Lee, K.H.; Kim, D. A Home Energy Management System with Renewable Energy and Energy Storage Utilising Main Grid and Electricity Selling. IEEE Access 2020, 8, 49436–49450. [Google Scholar] [CrossRef]
- Ahmed, M.S.; Mohamed, A.; Homod, R.Z.; Shareef, H. Hybrid LSA-ANN Based Home Energy Management Scheduling Controller for Residential Demand Response Strategy. Energies 2016, 9, 716. [Google Scholar] [CrossRef] [Green Version]
- Ahmad, A.; Khan, A.; Javaid, N.; Hussain, H.M.; Abdul, W.; Almogren, A.; Alamri, A.; Niaz, I.A. An Optimised Home Energy Management System with Integrated Renewable Energy and Storage Resources. Energies 2017, 10, 549. [Google Scholar] [CrossRef] [Green Version]
- Li, H.; Zeng, P.; Zang, C.; Yu, H.; Li, S. An Integrative DR Study for Optimal Home Energy Management Based on Approximate Dynamic Programming. Sustainability 2017, 9, 1248. [Google Scholar] [CrossRef] [Green Version]
- Li, M.; Li, G.-Y.; Chen, H.-R.; Jiang, C.-W. QoE-Aware Smart Home Energy Management Considering Renewables and Electric Vehicles. Energies 2018, 11, 2304. [Google Scholar] [CrossRef] [Green Version]
- Abdalla, M.A.A.; Min, W.; Mohammed, O.A.A. Two-Stage Energy Management Strategy of EV and PV Integrated Smart Home to Minimise Electricity Cost and Flatten Power Load Profile. Energies 2020, 13, 6387. [Google Scholar] [CrossRef]
- Küfeoğlu, S. The Home of the Future. In Digitalization and Resource Management; Springer International Publishing: Dordrecht, The Netherlands, 2021. [Google Scholar]
- IBB. IBB Open Data Portal. 2020. (Online). Available online: https://data.ibb.gov.tr/dataset/ikitelli-gunes-enerjisi-santrali-elektrik-uretim-miktarlari (accessed on 20 September 2020).
- Ekrekli, M.Y.E.İ.A.C.A. Energy Production and Storage of a Self-Sustaining Hub. In The Home of the Future: Digitalization and Resource Management; Springer: Dordrecht, The Netherlands, 2021. [Google Scholar]
- Dodson, T. Charger Use Study: UK Power Networks’ Recharge the Future Project; UK Power Networks: London, UK, 2018. [Google Scholar]
- Küfeoğlu, S.; Üçler, Ş. Designing the business model of an energy Datahub. Electr. J. 2021, 34, 106907. [Google Scholar] [CrossRef]
- Epias. Exist Transparency Platform. 2021. (Online). Available online: https://seffaflik.epias.com.tr/transparency/piyasalar/gop/ptf.xhtml (accessed on 24 April 2021).
- Solar Power Blog. How Much Does a 10 kW Solar Power System Cost?—2021 Update. (Online). Available online: https://solarpoweredblog.com/how-much-does-a-10kw-solar-power-system-cost/ (accessed on 5 June 2021).
- Çilli, K. Enerji Portali. (Online). Available online: https://www.enerjiportali.com/is-yerimize-bugun-10-kw-gunes-enerjisi-kursak/ (accessed on 5 June 2021).
- Power Energy. Power Energy. (Online). Available online: https://satis.powerenerji.com/cati-uzeri-10-kw-gunes-enerjisi-elektrik-uretimi-maliyeti (accessed on 5 June 2021).
- Tesla Inc. Tesla Powerwall. (Online). Available online: https://www.tesla.com/en_gb/powerwall/design?redirect=no (accessed on 5 June 2021).


Publisher’s Note: MDPI stays neutral with regard to jurisdictional claims in published maps and institutional affiliations. |
© 2021 by the authors. Licensee MDPI, Basel, Switzerland. This article is an open access article distributed under the terms and conditions of the Creative Commons Attribution (CC BY) license (https://creativecommons.org/licenses/by/4.0/).