Abstract
To enhance the cooling capacity of a single air inlet induced draft cooling tower (SIDCT), the stepped fill layout pattern is proposed in this paper. A three-dimensional numerical model is established and validated by field measurement data. The cooling capacity of towers equipped with uniform fill and stepped fill is compared under various crosswind velocities (0 m/s–12 m/s) and crosswind angles (0°–180°). The results showed that the ventilation rate of the total tower with stepped fill is increased. Under the studied crosswind velocity and angle, the cooling capacity of the stepped fill tower is superior to the uniform fill tower. After using stepped fill, the mean drop of outlet water temperature rises by 0.29 °C, 0.27 °C, 0.17 °C, 0.10 °C, and 0.19 °C, corresponding to crosswind angles from 0° to 180°. The increment of cooling capacity is the maximum under the crosswind angles of 0° and 45° and is the minimum under the crosswind angles of 90° and 135°. The maximum increased value of is 0.65 under the crosswind velocity of 4 m/s, 0.85 under 8 m/s, and 0.95 under 12 m/s.
1. Introduction
Mechanical draft cooling towers (MDCTs) are mainly cooling equipment, with heat transfer from circulating water (heat water) to the ambient air. With different installation positions of a fan, MDCTs can be classified into forced draft cooling towers (FDCTs) and induced draft cooling towers (IDCTS) [1]. MDCTs are widely used in metallurgy, the pharmaceutical industry, and air conditioner cooling. The cooling capacity and ventilation performance of MDCTs markedly affect the working efficiency of these industrial processes. In recent years, researchers have been interested in the effect mechanism of ambient wind on the performance of the MDCT. Performance optimization methods of MDCTs are becoming research hotspots.
Many investigations have been performed by scholars to analyze the impact of operation parameters on ventilation and thermal performance of the MDCT. Rahmati et al. [2,3] revealed that input parameters influence the cooling tower performance, including hot water temperature, water flow rate, air mass flow rate, and stage numbers of packing, with combination thermal image technology. The results indicated that the air mass flow rate, hot water temperature, and stage numbers of packing directly influence cooling efficiency. Meanwhile, the water temperature difference and cooling efficiency are larger when the water flow rate is lower. To estimate the water uptake rate of an environment’s air, Naik and Muthukumar [4] proposed a calculation model for a cross-flow wet cooling tower, finding that the water evaporation loss increases with the rising temperature of inlet water. Lucas et al. [5,6] clarified the influence of drift eliminators on thermal performance and concluded an optimization scheme between different water distribution systems and drift eliminators for a MDCT. Their results showed that drift eliminators can be seen as an additional fill with the heat and mass transferred, and the pressure water distribution systems have superior cooling capacity. To obtain thermal characteristics of a SIDCT, Chen et al. [1] conducted field measurement for the SIDCT under crosswind conditions, elaborating that the air–water ratio and heat transfer coefficient increase with the rising crosswind velocity under the crosswind directions of the α1 and α2, however drop under α3 (i.e., α1, α2 and α3 standing for the angle between the crosswind direction and the normal of air inlet plane). That is, the crosswind direction has a significant influence on the thermal performance of the SIDCT due to special form of the air inlet. However, this study fails to discuss the impact on the crosswind angles of 90° and 135° under the anti-clockwise direction of normal of air inlet. Singh et al. [7,8,9,10] experimentally investigated trickle, film, splash, and wire mesh fill impact on water evaporation, heat rejection, and Merkel number. They demonstrated that the Merkel number is directly influenced by the air–water ratio, and the wire mesh is the best fill pattern in lab conditions; then, an optimization model was proposed to improve thermal performance of the tower. To degrade energy waste, Muller and Craig [11] conducted a control model using a genetic algorithm, and provided an optimization scheme of the pump and fan combination. Ruiz et al. [12] performed drift deposition for the MDCT in the urban environment and discussed the relationship between environmental parameters and downwind deposition, finding that area and amount of drift deposition are substantially impacted by wind velocity and direction. Viljoen et al. [13] established a dynamic model for a MDCT with parallel heat exchangers, pumps, and cooling water networks; however, the heat transfer process was not mentioned. Based on the MDCT, Guo et al. [14] developed a parallel hybrid model to optimize and evaluate the cooling ability of the tower. In past years, the influence of crosswind on the Merkel number [15], water droplet diameter distribution [16], cooling capacity [17], ventilation efficiency [18], and air intake uniformity coefficient [19] of towers have been researched substantially, with research aimed at natural draft cooling towers and not mechanical draft cooling towers.
Many measures, including the dry–wet hybrid rain zone, air duct, wind deflector, arranging fan inside the tower etc., have been employed by scholars.
To intensify ventilation rate and decrease water temperature of the tower under crosswind conditions, Zhang et al. [19,20] presented a dry–wet hybrid rain zone, which can classify an existing rain zone into the dry parts and wet parts. Their finding was that the dry–wet hybrid rain zone can increase ventilation rate and eliminate the high temperature zone of center of the tower. To sufficiently use the water-dropping potential of the rain zone, Dang et al. [21] and Zhou et al. [22] installed an axial fan on the top of the fill. The fan was driven by the water-dropping potential of the rain zone, and the influence of the fan diameter on pumping force of cooling tower was analyzed. Chen et al. [23,24] firstly arranged the air duct in the rain zone, and a 3D numerical model was performed for this study. The results showed that the ventilation rate of the center of the rain zone was significantly enhanced. The water surface temperature reduced by a maximum of 0.68 °C compared with no air duct. For making full use of the cooling capacity of the fill in a natural draft wet cooling tower, Zhou et al. [25] and Gao et al. [26] presented a non-uniform fill so that the height of the fill is higher in the air inlet, while lower in the center of the tower, and found that non-uniform fill improved thermal performance and decreased outlet water temperature, compared to uniform fill. Lye et al. [27] also researched non-uniform fill in the wet cooling tower with high-level water-collecting devices, where the height of fill is higher in the center of the tower region and the height is lower in the air inlet. The results revealed that the uniformity of the airflow distribution is improved when one adopts a non-uniform fill. The research conclusion indicated that injecting flue gas into the tower can intensify the cooling capacity of the tower [28,29,30].
A non-uniform fill is widely used to improve the cooling performance of the natural draft wet cooling tower. However, the application of non-uniform fill in MDCT has not been found. There are many differences between the natural draft wet cooling tower and the MDCT, such as the form of air intake, aerodynamic field and pumping force distribution inside the tower. Therefore, research on the non-uniform fill in the MDCT is necessary.
In this study, a stepped fill is applied to a SIDCT for the first time. The synergistic mechanism of the stepped fill of the SIDCT is analyzed under the studied crosswind velocity and angle. To conduct this research more accurately, a 3D numerical model of the SIDCT with stepped fill is established and validated by field measurement dates. The parameters, including air dynamic field, Merkel number, water temperature drop, and the cooling percentage in each zone, are investigated for both types of tower. The findings of this study produced a theoretical reference for the energy-saving optimization of a SIDCT.
2. Numerical Model
In this part, the working process of the SIDCT and the structure size of stepped fill are introduced. The mathematical model, boundary conditions, and solution method are proposed. Finally, the verification of both grid independence and mathematical model is conducted.
2.1. Geometric Model
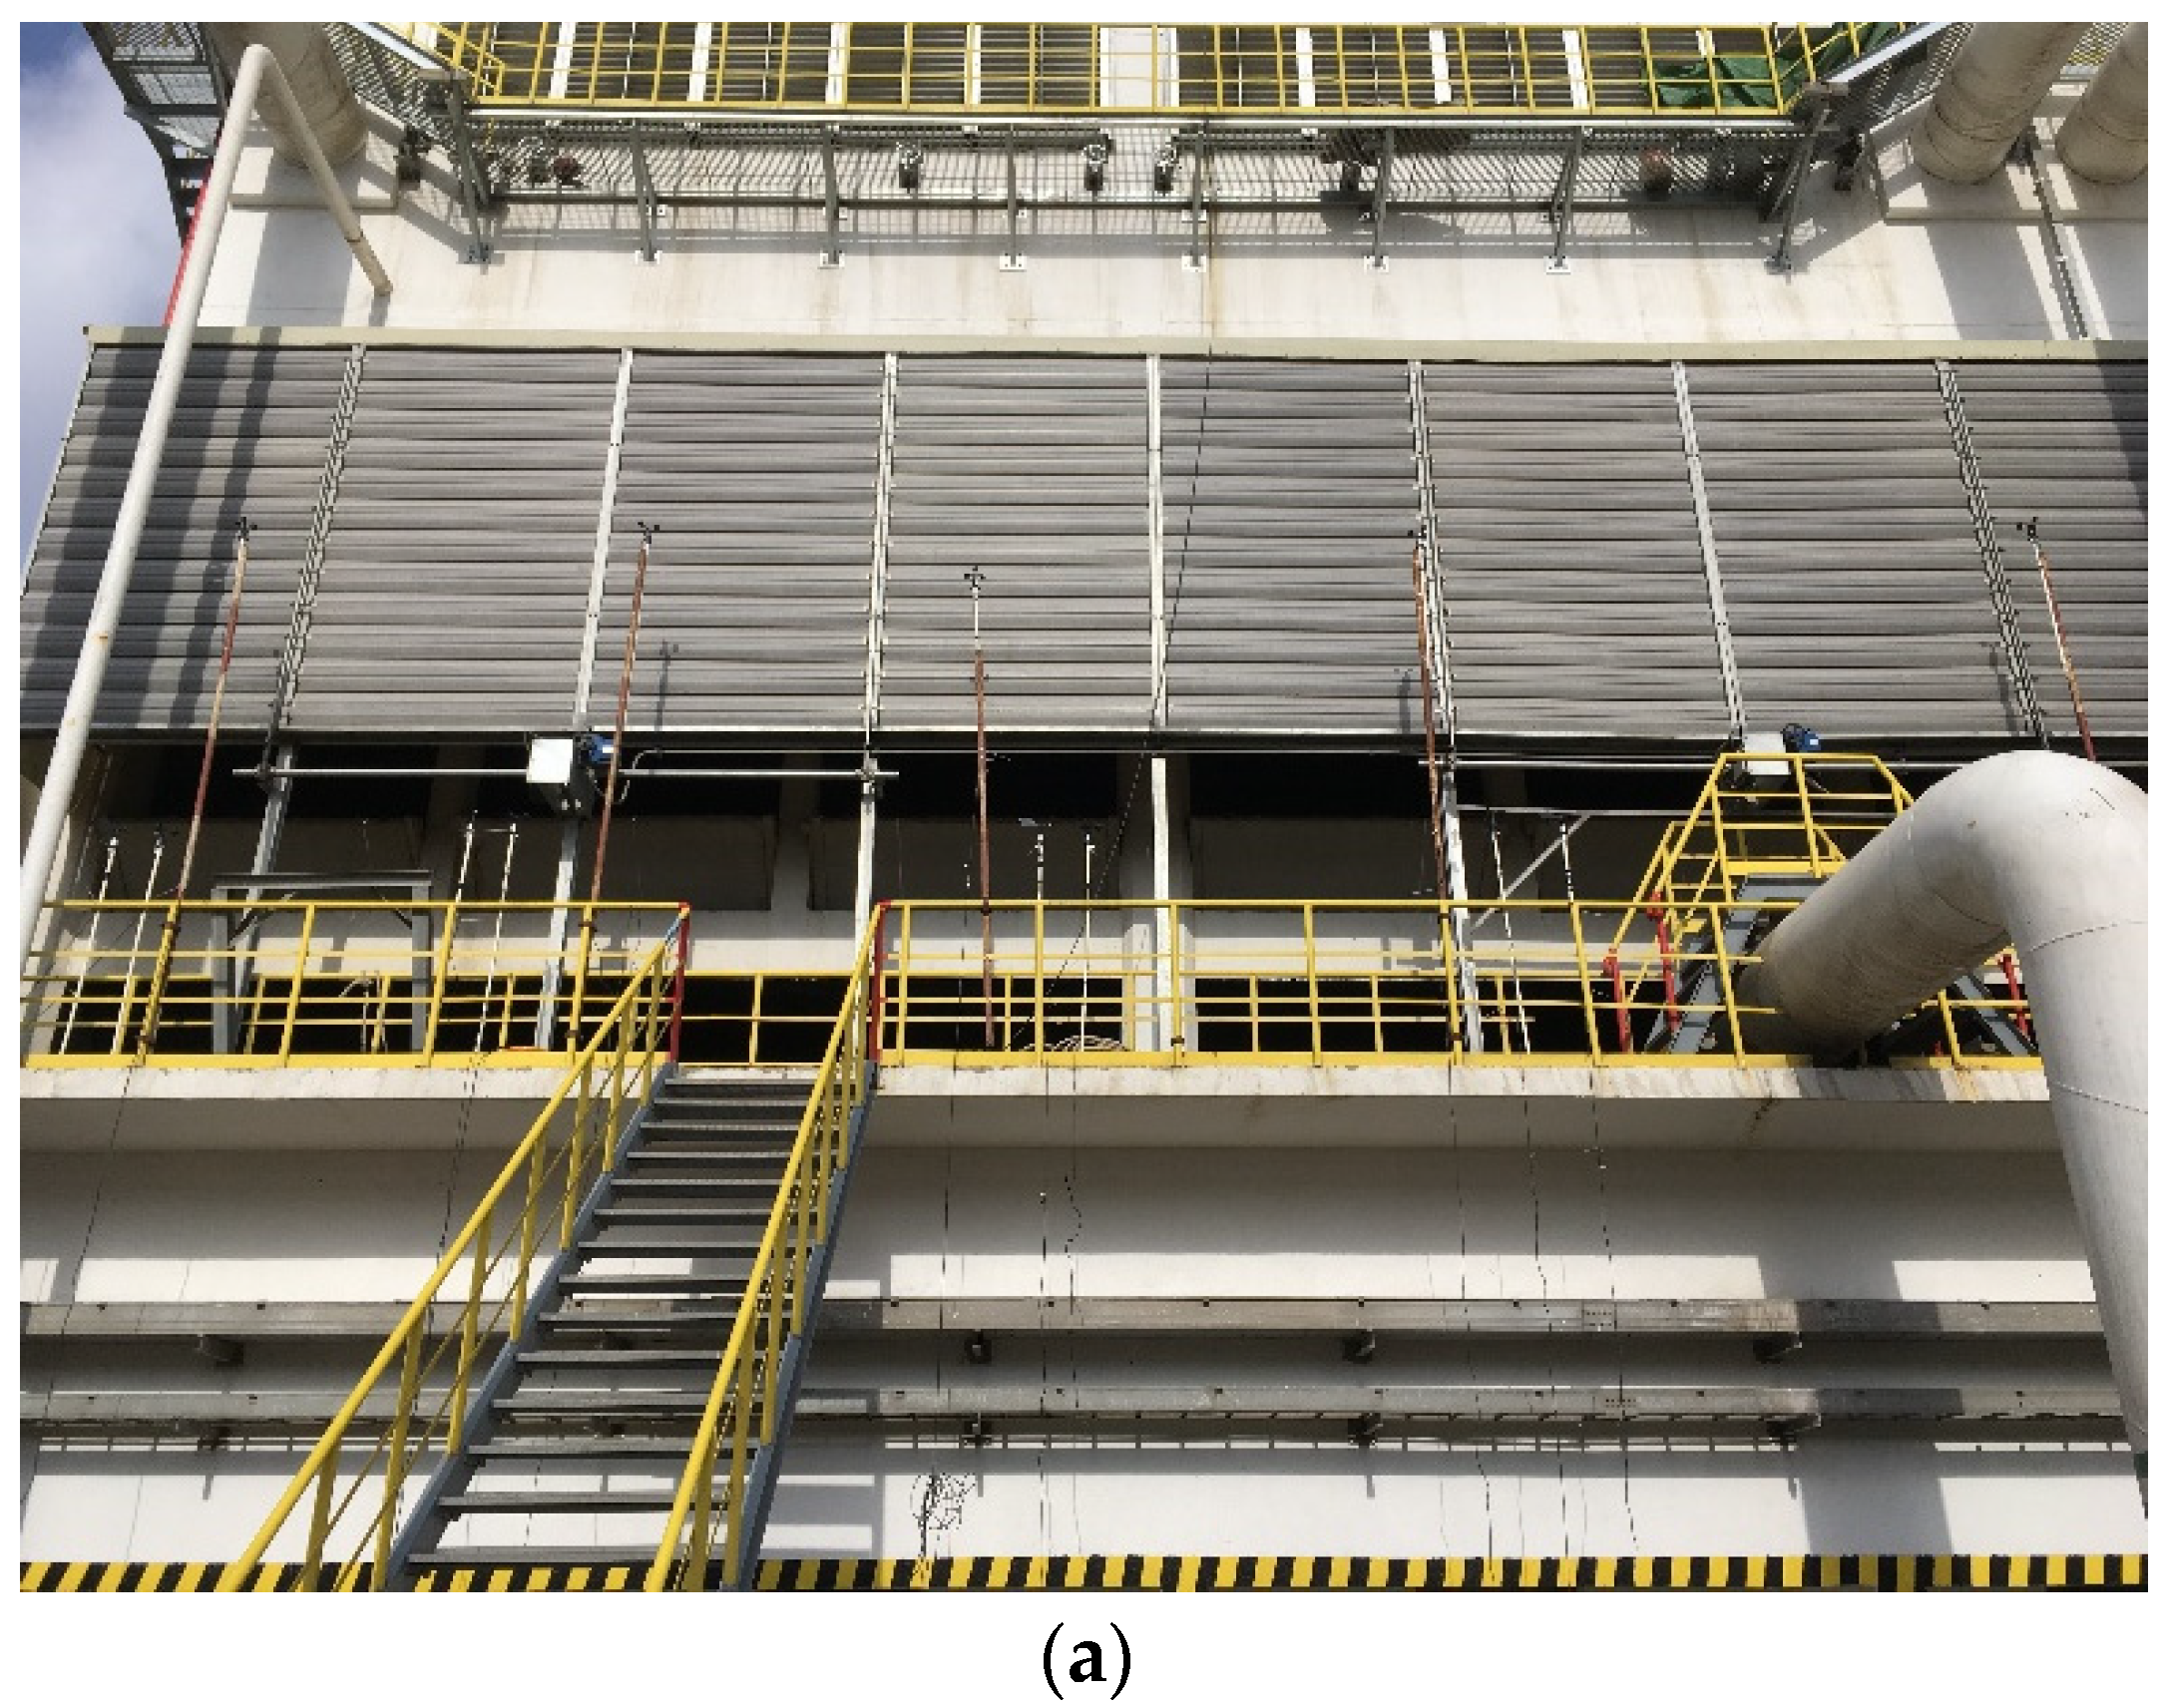
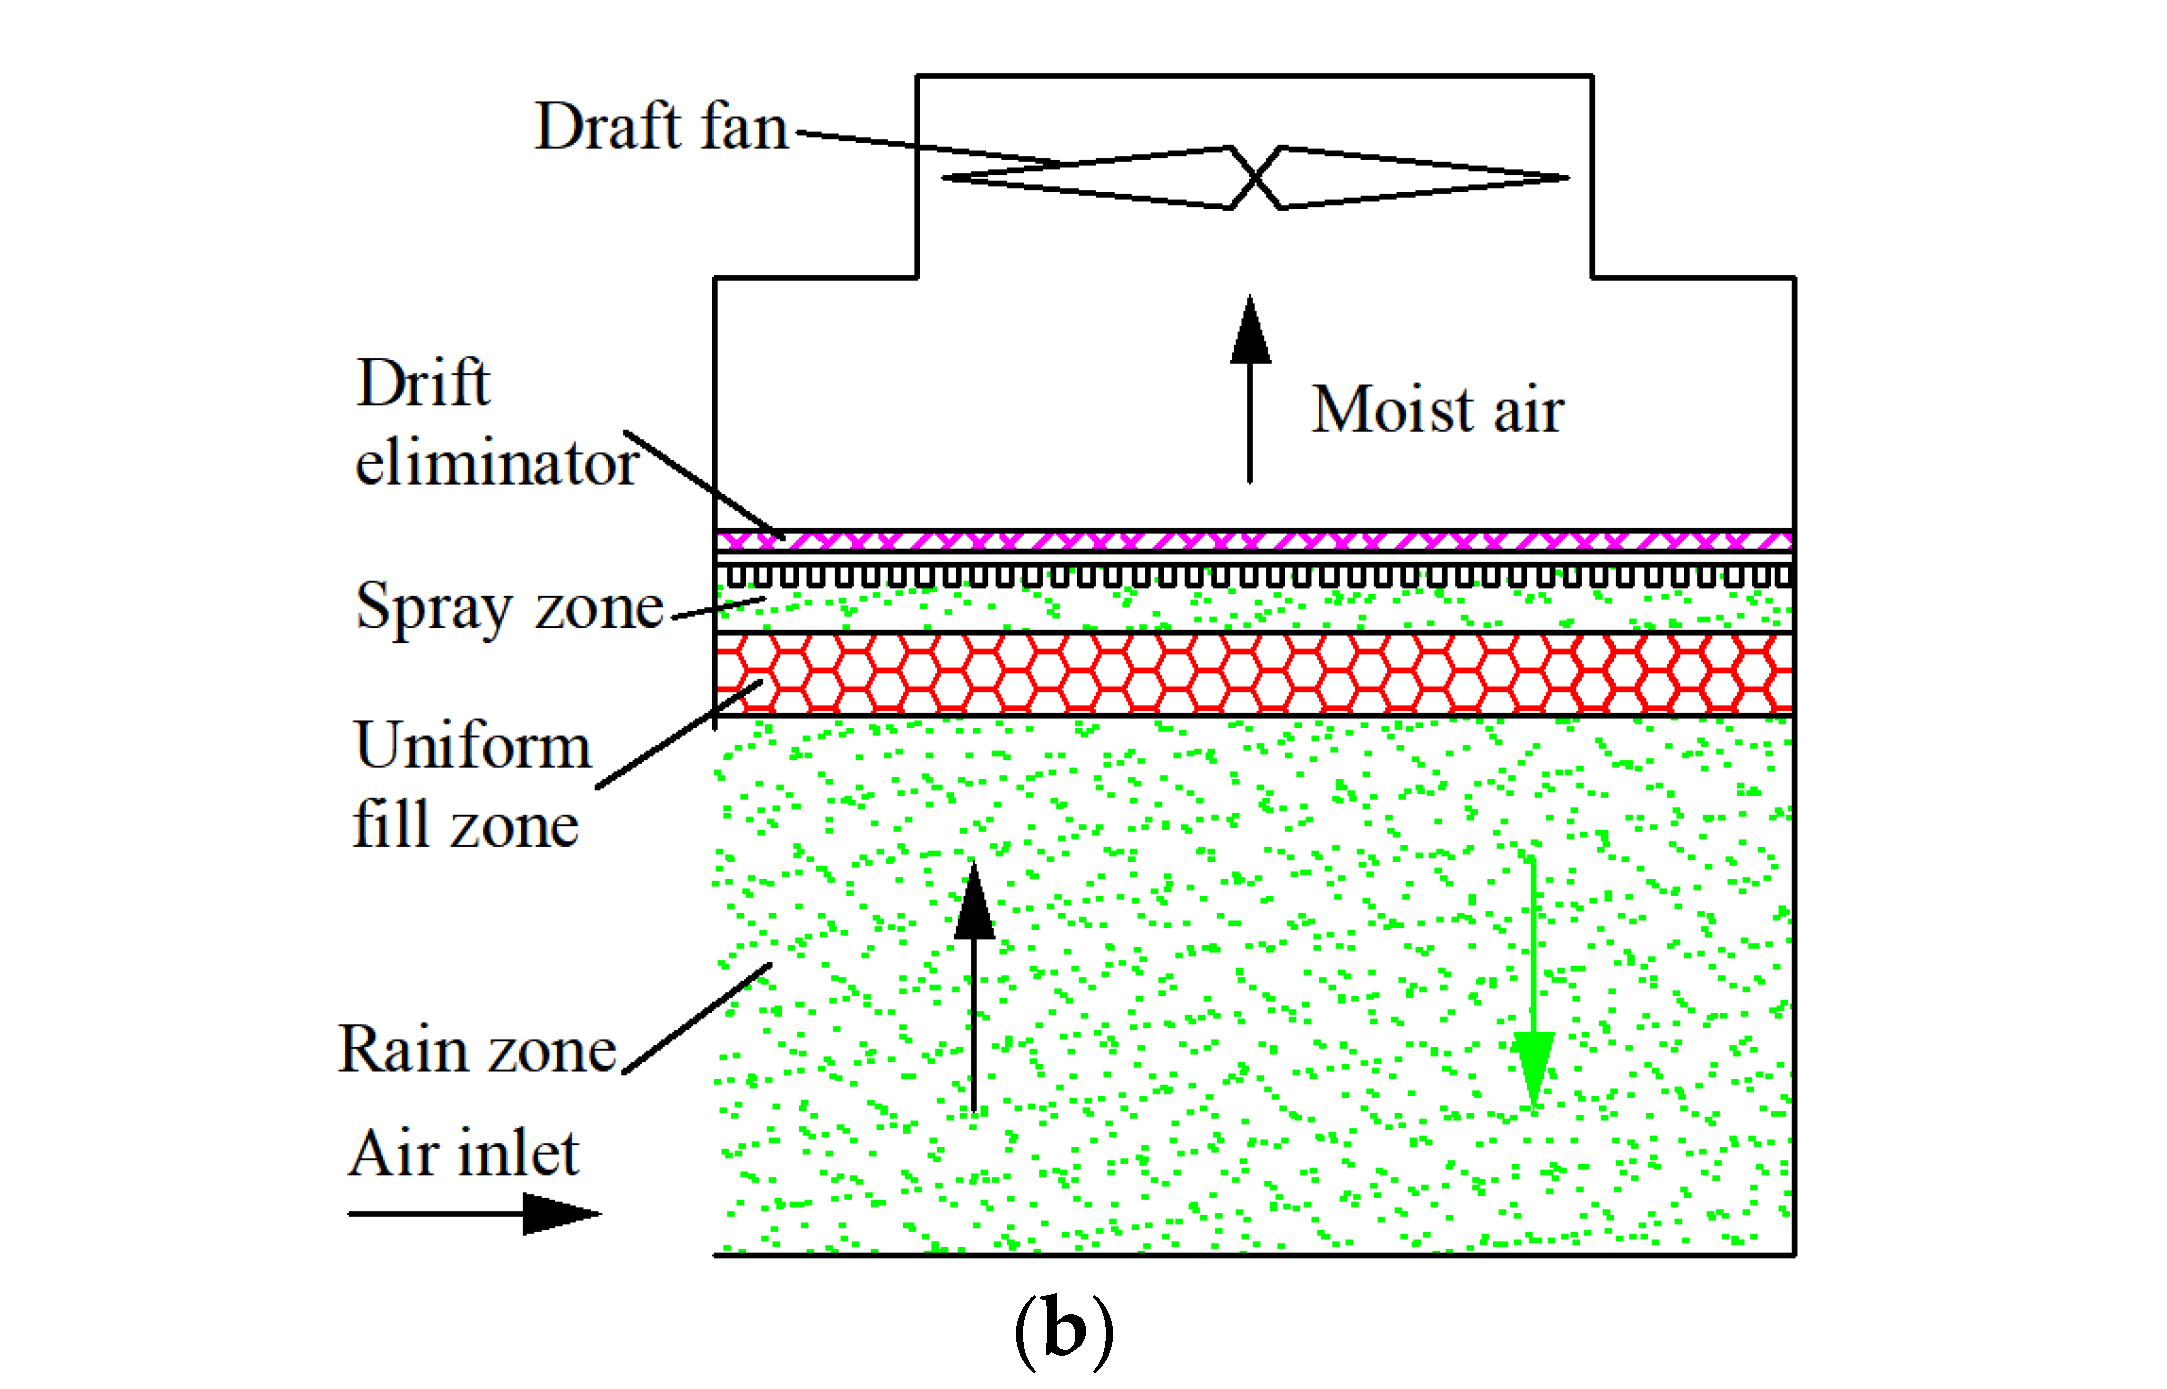
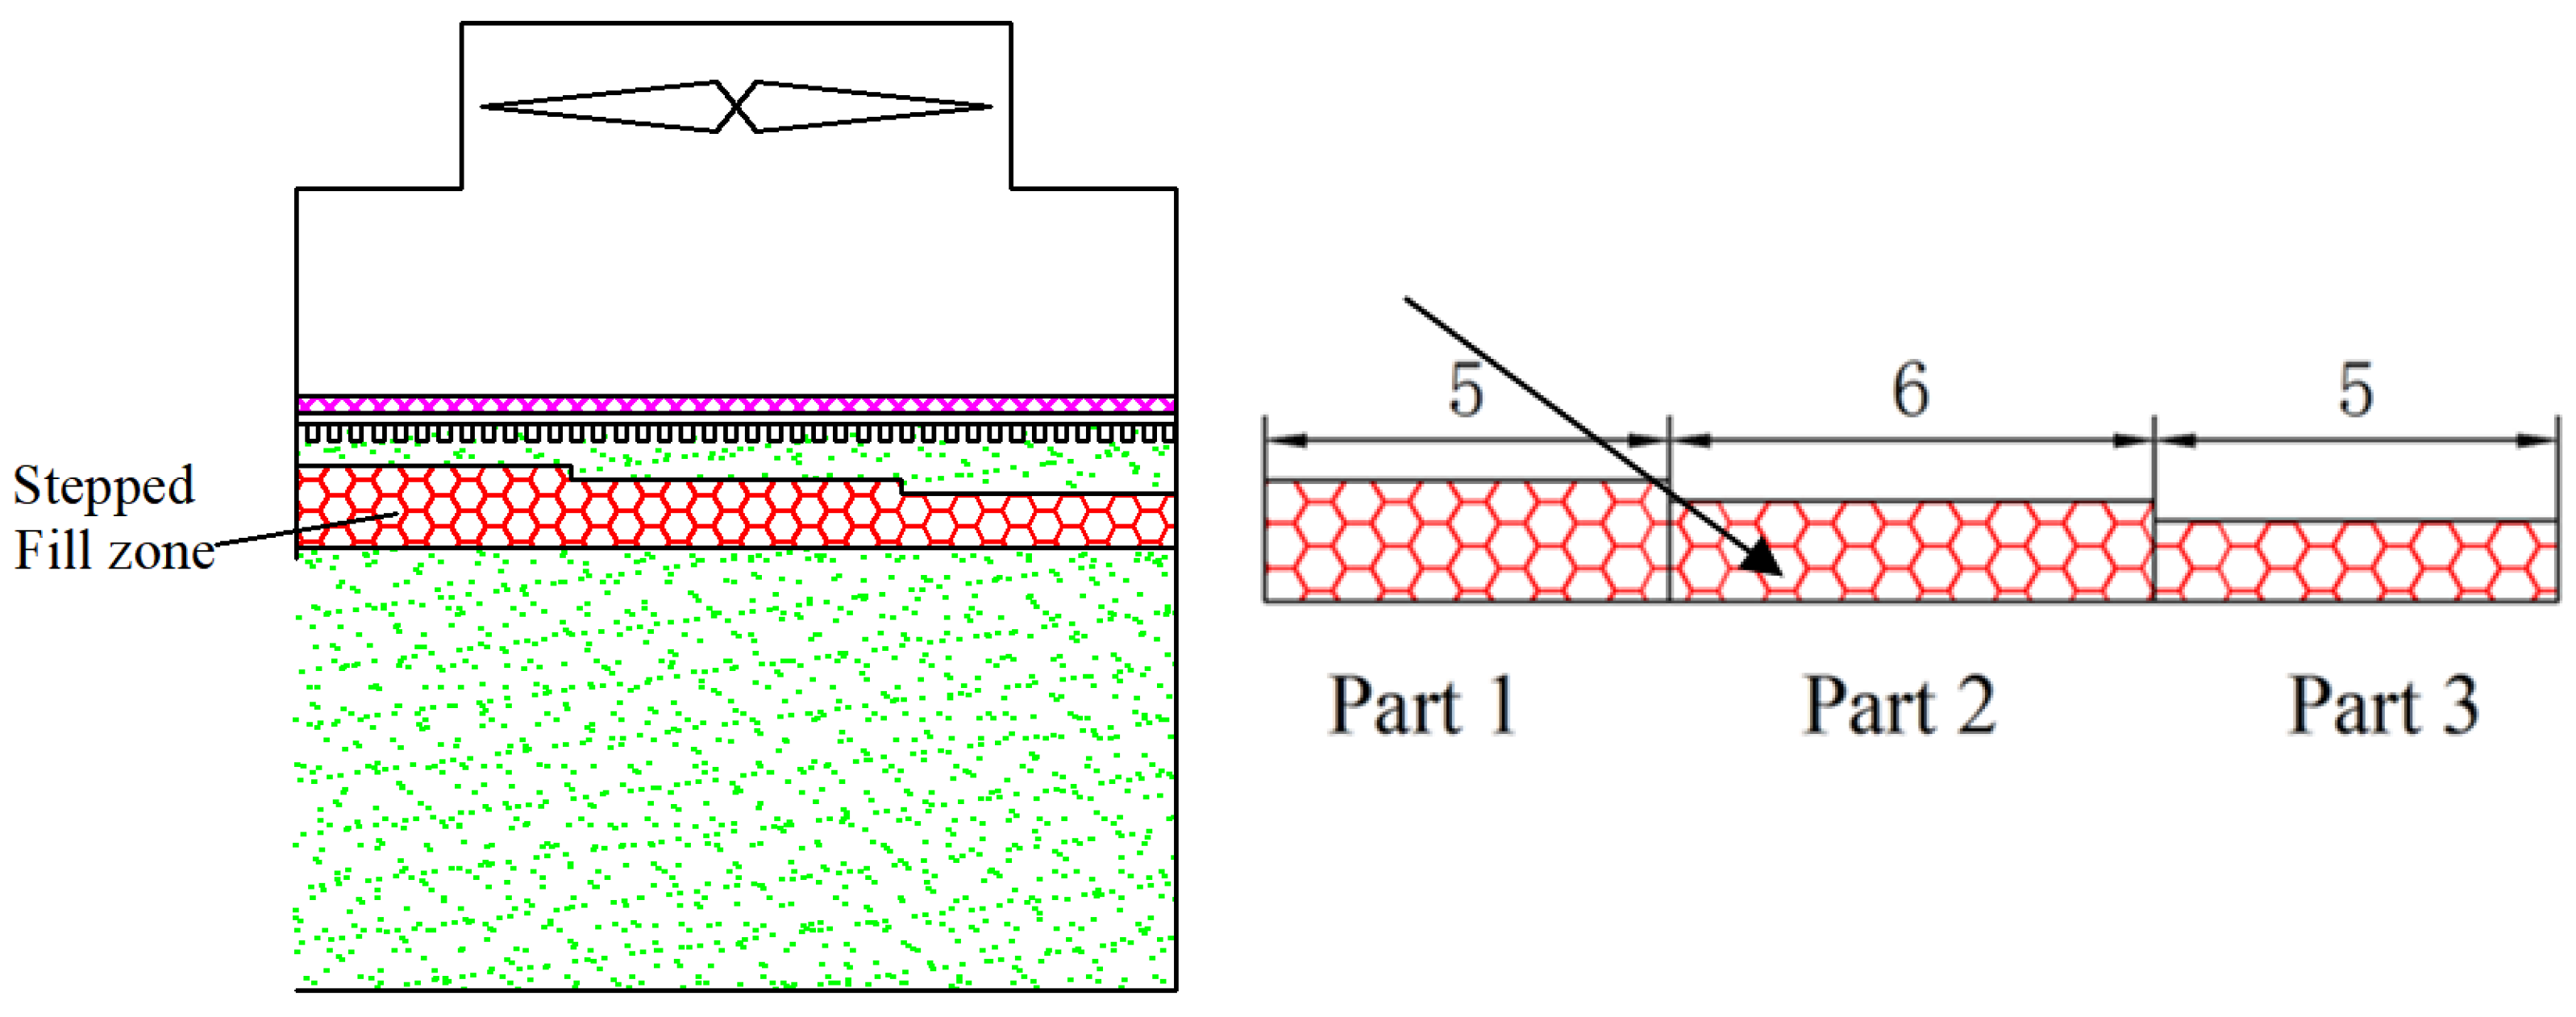
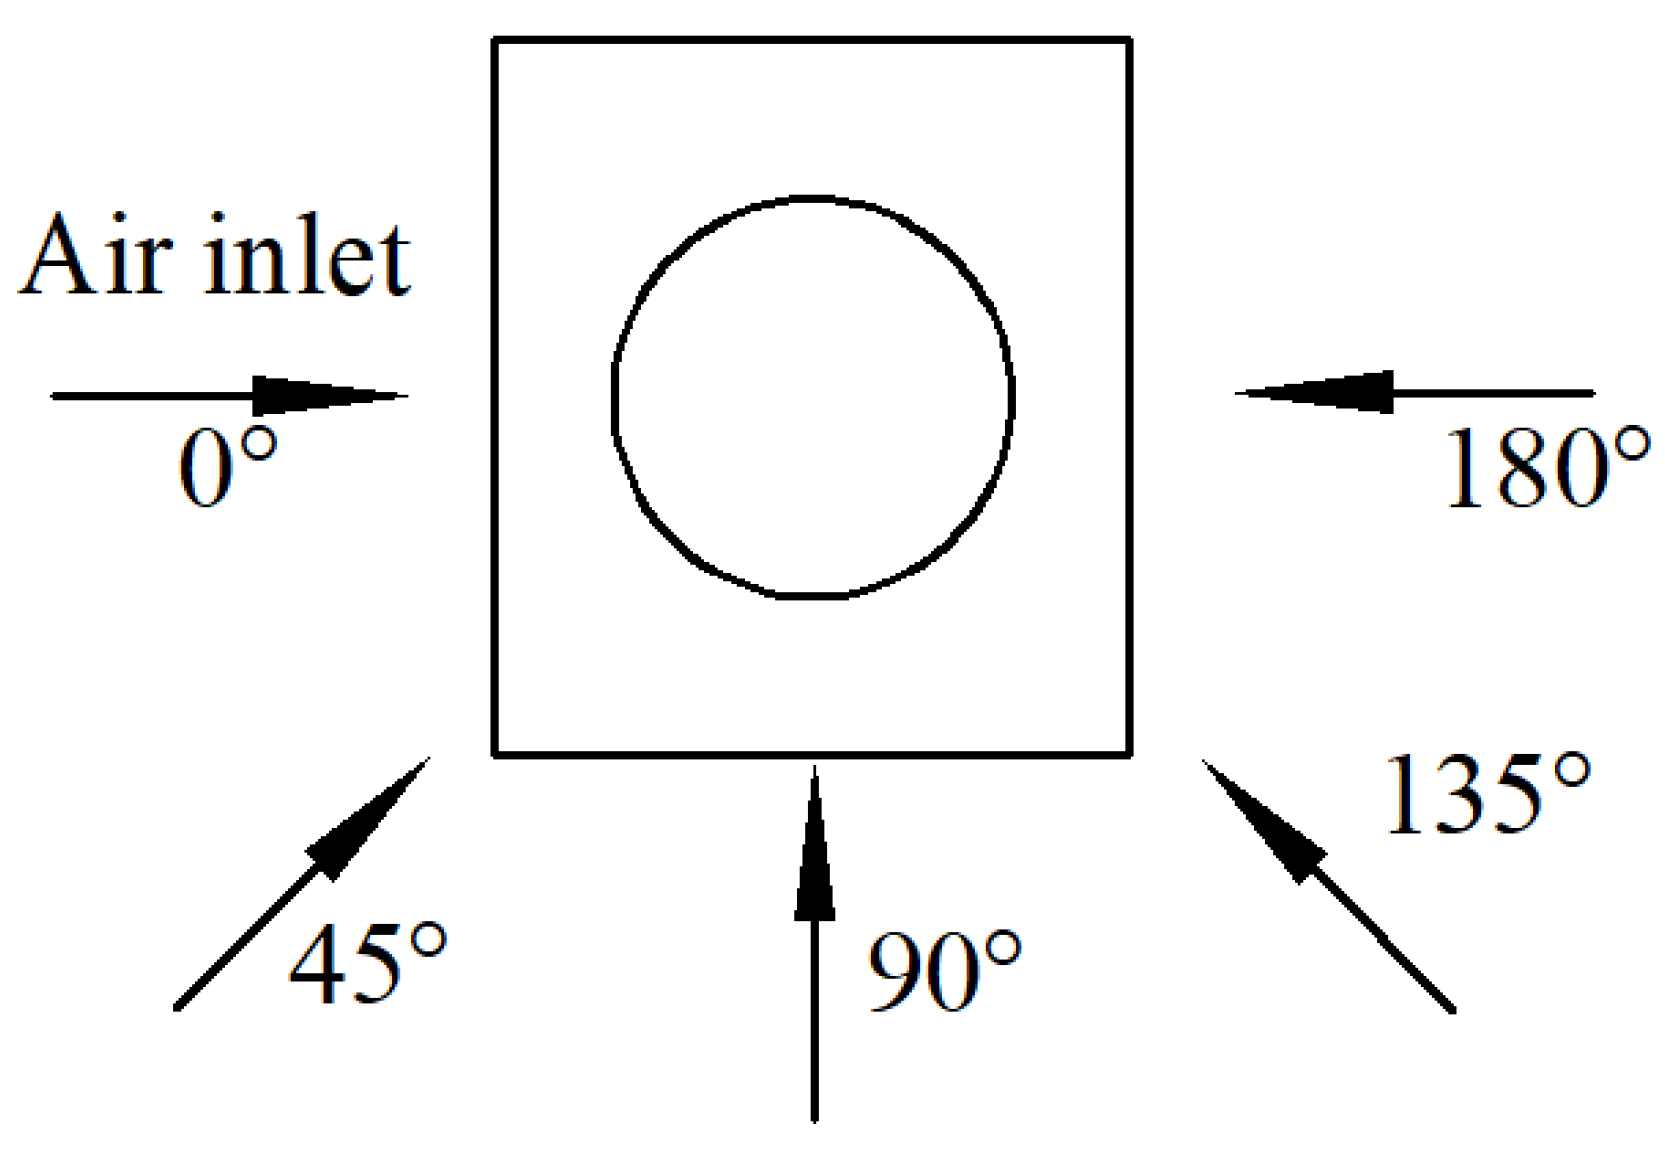
The structural sketch of the SIDCT is described in Figure 1. Figure 1a is a sketch of the measured SIDCT and Figure 1b is working principle of the SIDCT. The SIDCT has a width of 18 m, a depth of 16 m, a height of 17.5 m and an air inlet height of 7.8 m. A fan is installed at the tower outlet with a diameter of 10 m and a design total pressure of 150 Pa. The total water spray area is 288 m2 and the fill thickness is 1.5 m. The circulating water is distributed by a water distribution system, which flows into the spray zone, fill zone, and rain zone. The air is drafted into the tower from the air inlet, then it passes into the rain zone, fill zone, spray zone, and flows out from the tower outlet. The specific arrangement of the stepped fill is shown in Figure 2. It begins with an air inlet, and the fill is numbered as part 1, part 2, and part 3 sequentially. Part 1, part 2, and part 3 have the same width, but the height is 1.5 m, 1.25 m, and 1 m and the depth is 5 m, 6 m, and 5 m, respectively. The volume of the stepped fill and uniform fill is equal. According to the site operation conditions of the SIDCT, the circulating water flow rate and temperature are 4522 m3/h and 33 °C. The angles between wind direction and normal of the air inlet are 0°, 45°, 90°, 135°, and 180°, as shown in Figure 3. The ambition wind velocities are defined as 0 m/s, 2 m/s, 4 m/s, 6 m/s, 8 m/s, 10 m/s, and 12 m/s in this paper.

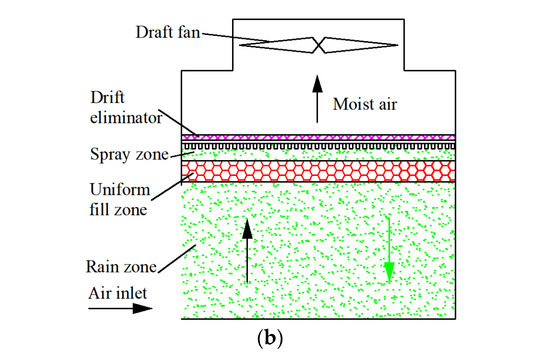
Figure 1.
Structural sketch of the SIDCT. (a) Sketch of the measured SIDCT; (b) Working principle of the SIDCT.
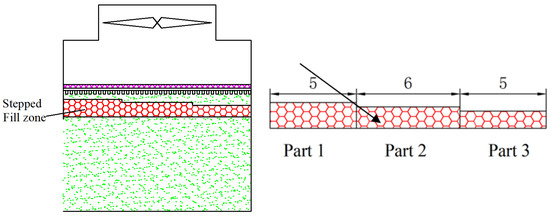
Figure 2.
Diagram of stepped fill.
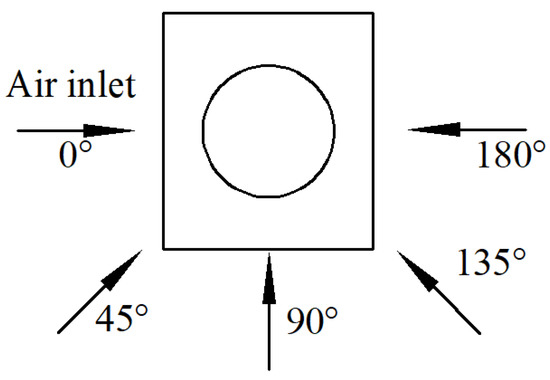
Figure 3.
Crosswind angles in this work.
2.2. Governing Equations
The ambient air around SIDCT can be taken as an incompressible gas with slight variation in pressure and temperature. Therefore, the steady-state Reynolds averaged Navier–Stokes equations are employed to describe airflow around the cooling tower, which can be closed by the standard κ-ε turbulence model.
2.2.1. Governing Equations for Air Flow
The mass conservation equation:
where is the air density, kg/m3; is the air velocity vector; is mass source term, W/m3.
The momentum conservation equation:
where represents the static pressure, Pa; and are laminar viscosity and turbulent viscosity coefficients of air, Pa·s; is gravitational body; is external body forces, N; stands for unit tensor.
The energy conservation equation:
where is the referent temperature, °C; stands for the sensible enthalpy of the species , J/kg; the and are the laminar and turbulence thermal conductivity coefficient, W/(m2·K). represents the diffusion flux of species ; indicates the energy source, W/m3.
The species transport equations:
where represents the mass fraction of the vapor; and stand for laminar and turbulence diffusion coefficient of moist air, m2/s.
The state equation of moist air:
where is air static pressure; is the universal gas constant; is the local air temperature; is the air molecular weight.
The stand κ-ε turbulence models:
Elaborating on , , , , , , and can be seen in Launder et al. [31].
2.2.2. Governing Equations for Circulating Water
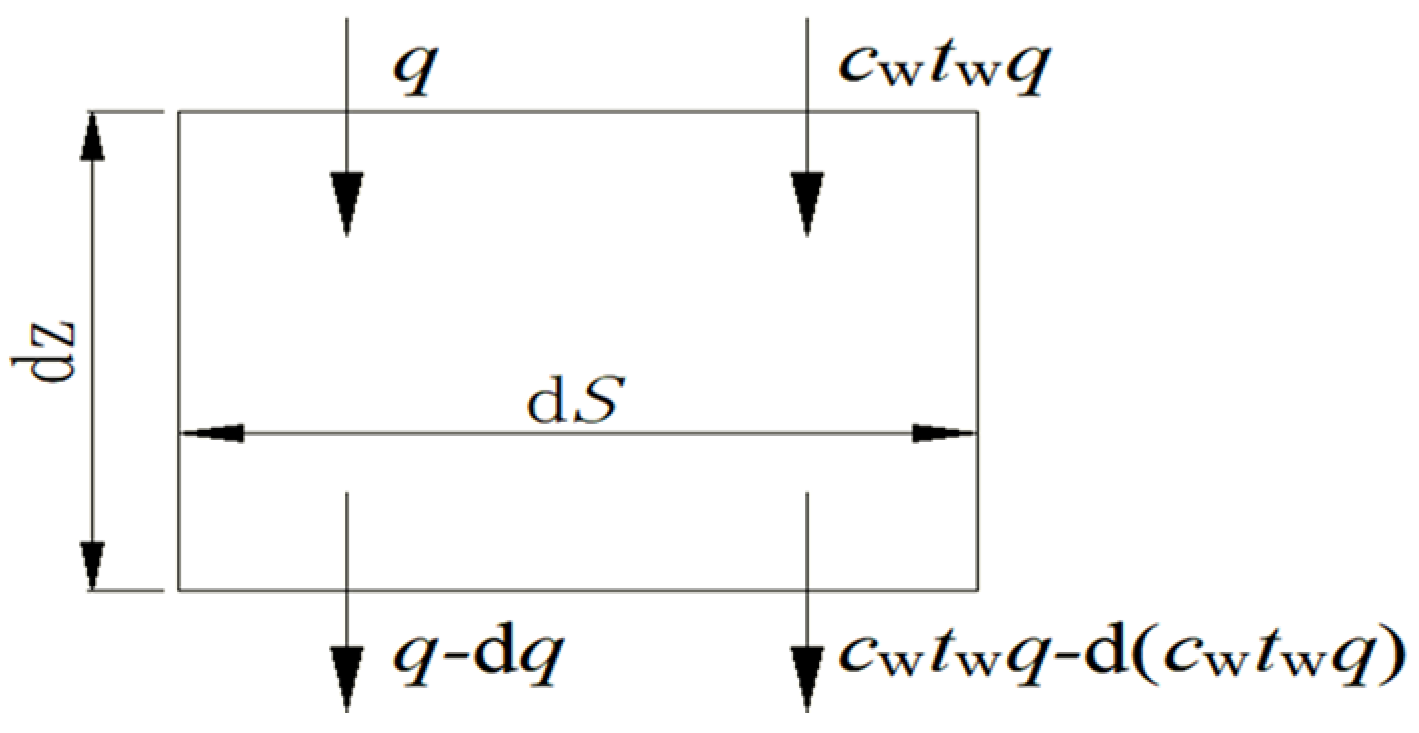
The inclination movement of circulating water is ignored into the cooling tower. The final control volume is revealed in Figure 4; the governing equations of circulating water are as follows.
where is circulating water mass flow rate, kg/(m3·s); is the water volume evaporation rate, kg/(m3·s); is the volume energy reduction rate of water.
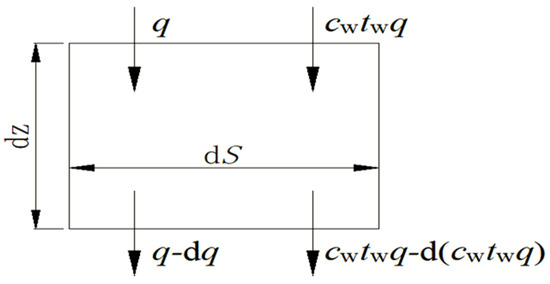
Figure 4.
Finite control volume for water flow.
The momentum conservation equation:
where is the dropping speed of water droplets, m/s; is the resistance force form the airflow, N.
2.2.3. Heat and Mass Transfer from Water to Air
Based on a previous report [32], the expressions of , , are defined as:
where is mass transfer coefficient, kg/(m3·K). is thermal conductivity, Kw/(m3·K). and represent the humidity ratio of the saturated air membrane at the vapor water interface and the humidity ratio of airflow, kg/kg, respectively. is the specific heat of water vapor, J/(kg °C); is latent heat of vaporization of circulating water, kJ/kg.
In the rain and spray zone, and can be written as follows:
where represents the number of water droplets per unit volume; stands for the surface area of one droplet, m2; the means the Schmidt number of moist air; represents the Prandtl number of moist air.
In the fill zone, according to fill experiment, and can be expressed as Equations (18) and (19).
where fill characteristics decide , and ; is air ventilation density of tower outlet surface, kg/m³; is the Lewis factor form Bosnjakovic formula [33].
For rain and spray zone, the water droplets are assumed to be perpendicular (z direction) due to less movement in x and y direction, and the air flow resistance is expressed as follows:
where is the coordinates x, y, z; represents water droplets speed, m/s; is Reynolds number; is resistance coefficient.
In the fill zone, the air flow resistance can be taken as Equation (21):
where represents the pressure drop of the air passing the fill, Pa. stands for the height of fill, m.
2.3. Boundary Conditions and Solution Method
To sufficiently show the effect of environmental conditions on the aerodynamic field and temperature field, the simulation domain is much larger than the studied SIDCT. The simulation domain is depicted in Figure 5. The simulation domain is a cuboid with a size of 140 m × 140 m × 100 m. Under windless conditions, for the simulation domain, the pressure inlet is selected as the inlet boundary condition, and the top boundary is set as pressure outlet. The bottom boundary and tower shell are set as no sliding wall with the standard wall functions in near-wall treatment used in Figure 5. Under crosswind condition, the windward boundary is set as velocity inlet and the leeward boundary is set as the pressure outlet.
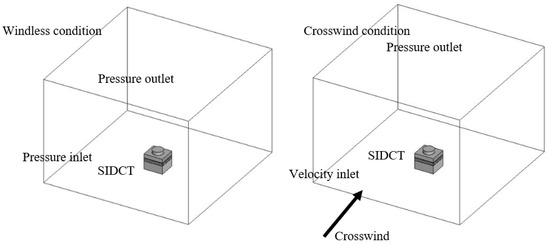
Figure 5.
Simulation domain and boundary conditions.
In this work, the spray zone, fill zone, and rain zone are taken as the heat and mass transfer zone with the reversing flow between air and water. In the water spray zone, the initial velocity of water droplet is 3.5 m/s with a diameter of 3 mm. Below the fill zone, the water droplet has an initial velocity of 0.4 m/s with the diameter of 5 mm [34,35].
The relationship between the crosswind velocity and the simulation domain height is shown in Equation (25) [36].
where stands for wind speed in the height of , m/s; represents reference speed in the reference height of , m/s.
Fluent software is used for air–water flowing calculation in this paper. The circulating water flow process is described by User Defined Function (UDF). The circulating water flow rate, water temperature, and water droplet speed of both the spray zone and rain zone are employed by User Defined Scalars (UDS). The coupling relationship between pressure–velocity adopts the SIMPLE method, and all fluxes are discretized by second-order upward scheme, except the pressure term which is discretized by the body force weighted scheme. The numerical calculation can be regarded as convergent when the calculation residual of energy equation is no more than 10−6 and the other less than 10−4, and the outlet water temperature varies less than 0.01 °C under 100 solver iterations.
2.4. Mesh Scheme
The hexahedron cell is adopted in this study. The simulation domain can be divided into four zones (i.e., mass and heat transfer zone, tower shell zone, fan zone, and outside the tower zone), which are merged in Fluent by the interface. To enhance calculation accuracy, the mesh of the mass and heat transfer zone is refined.
The outlet water temperature is the important symbol of the tower cooling capacity and is selected as an evaluating indicator of mesh independence. For elaborating uncorrelated values between mesh number and simulation result, the four groups mesh system that mesh numbers of 784,915, 1,196,816, 1,488,224, 1,804,915 are established in Table 1. The corresponding operating parameters are that the ambient dry-bulb temperature is 15.1 °C, ambient wet-bulb temperature is 10.1 °C, crosswind angle is 0°, crosswind velocity is 2.13 m·s−1, water flow rate is 4520 m3·h−1. Based on Table 1, the relative error is less than 3% when the mesh numbers exceed 1,488,224, and the calculation accuracy meets the requirement. Therefore, the mesh numbers of 1,488,224 are adopted in this work.

Table 1.
Mesh independence validation.
2.5. Validation
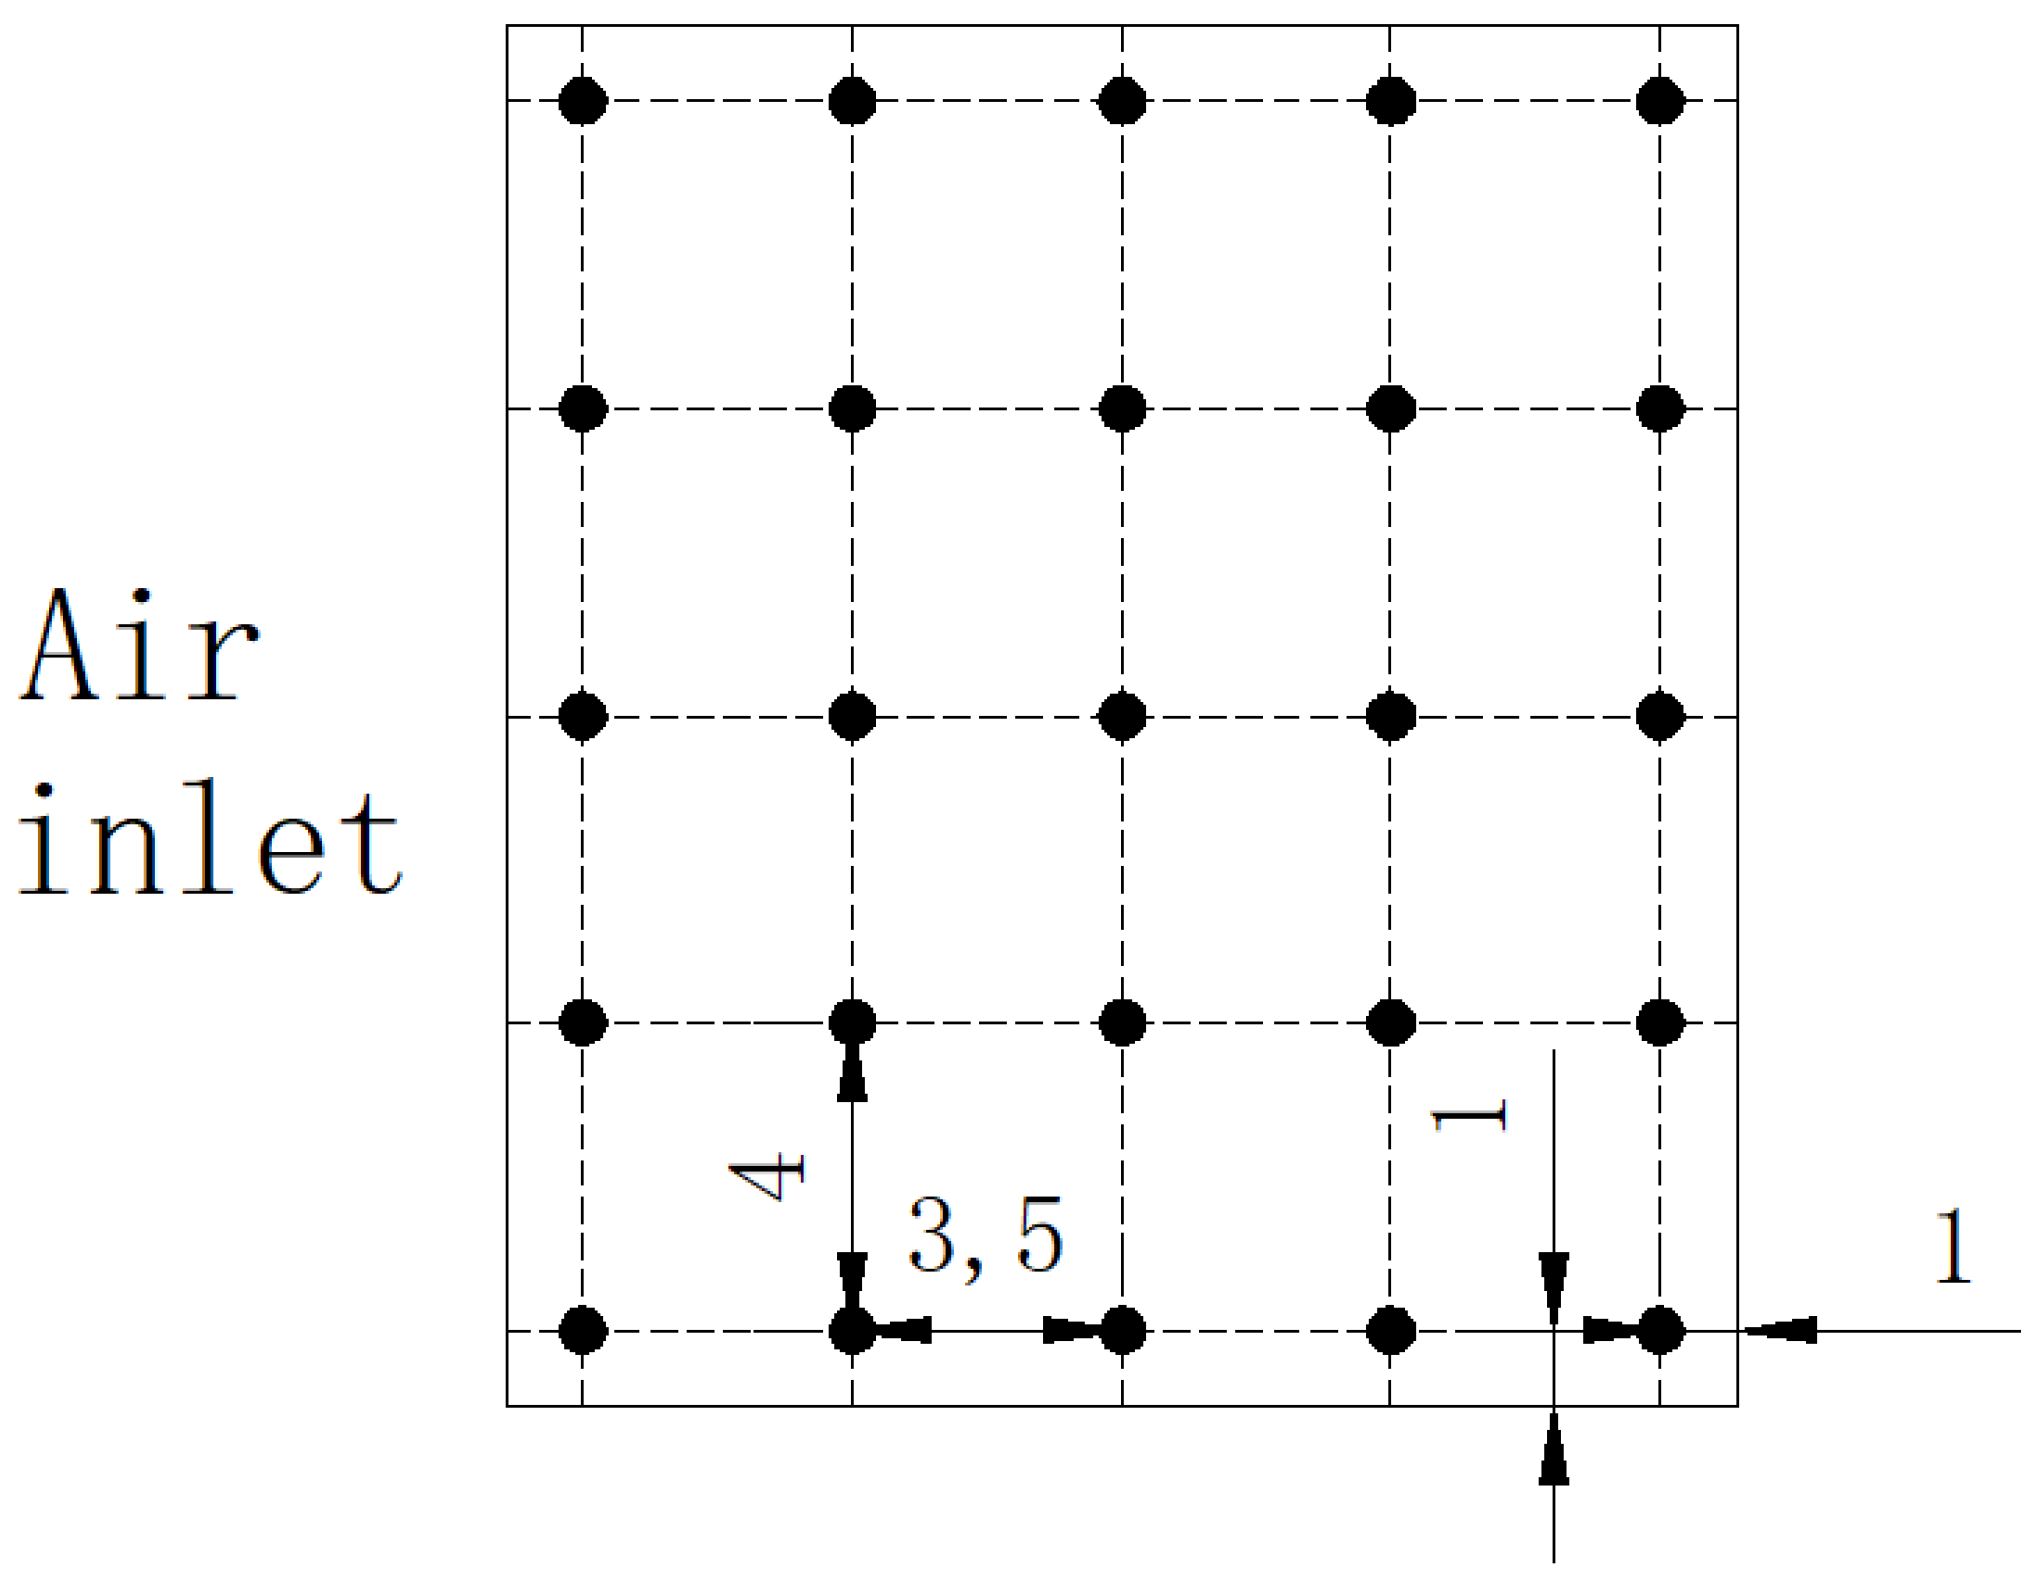
For proving the accuracy of the numerical model, five groups of outlet water temperature with different operating conditions are obtained (i.e., B1–B5, standing for five groups of measured conditions in the chemical enterprise in Shandong, China). Monitoring parameters and corresponding measuring instruments for the measurements are listed in Table 2. The ambient wind velocity, wind direction, ambient air dry–wet bulb temperature, and atmospheric pressure were measured at a height of 3 m from the ground and a distance of 40 m from the SIDCT. The measurement process under each working condition takes 15 min, during which the ambient conditions are measured every 20 s. A total of 25 measuring points are set on the water surface. The distribution of water surface temperature measuring points is shown in Figure 6. The water temperature is measured three times under each measured condition, and the arithmetic average of the three measurements is designated as the measured outlet water temperature.
Table 2.
Monitoring parameters and corresponding measuring instrument for the measurement.
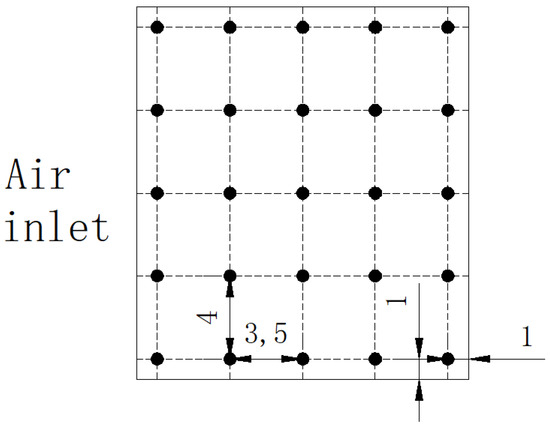
Figure 6.
Measuring points distribution at water surface of the water basin.
According to operating parameters, five groups of outlet water temperatures are calculated in Table 3. It can be seen that under different velocities and angles of crosswind, the relative errors of outlet water temperature between measurement values and calculated values are very small. The maximum relative error is less than 3%. Therefore, the numerical model of thermal performance of the SIDCT is accurate and credible in this paper.
Table 3.
Model validation according to measuring values.
3. Results and Discussion
3.1. Ventilation Rate
The SIDCT has only one air inlet and the aerodynamic field in the SIDCT is very uneven. According to Chen et al. [1], the worst heat transfer zone is the inner zone of the SIDCT. The larger ventilation rate occurs near the air inlet, while less occurs inside the tower, leading to weakening intensity of heat and mass transfer in the tower. In order to optimize the aerodynamics field and improve the ventilation rate in the tower, the thickness of the fill around the air inlet is increased and is reduced in the tower, which is called stepped fill. Due to large ventilation rate in the air inlet, the increasing thickness of fill can enhance the intensity of heat and mass transfer. The decreasing thickness of fill in the tower can increase ventilation and enhance the cooling capacity of the tower.
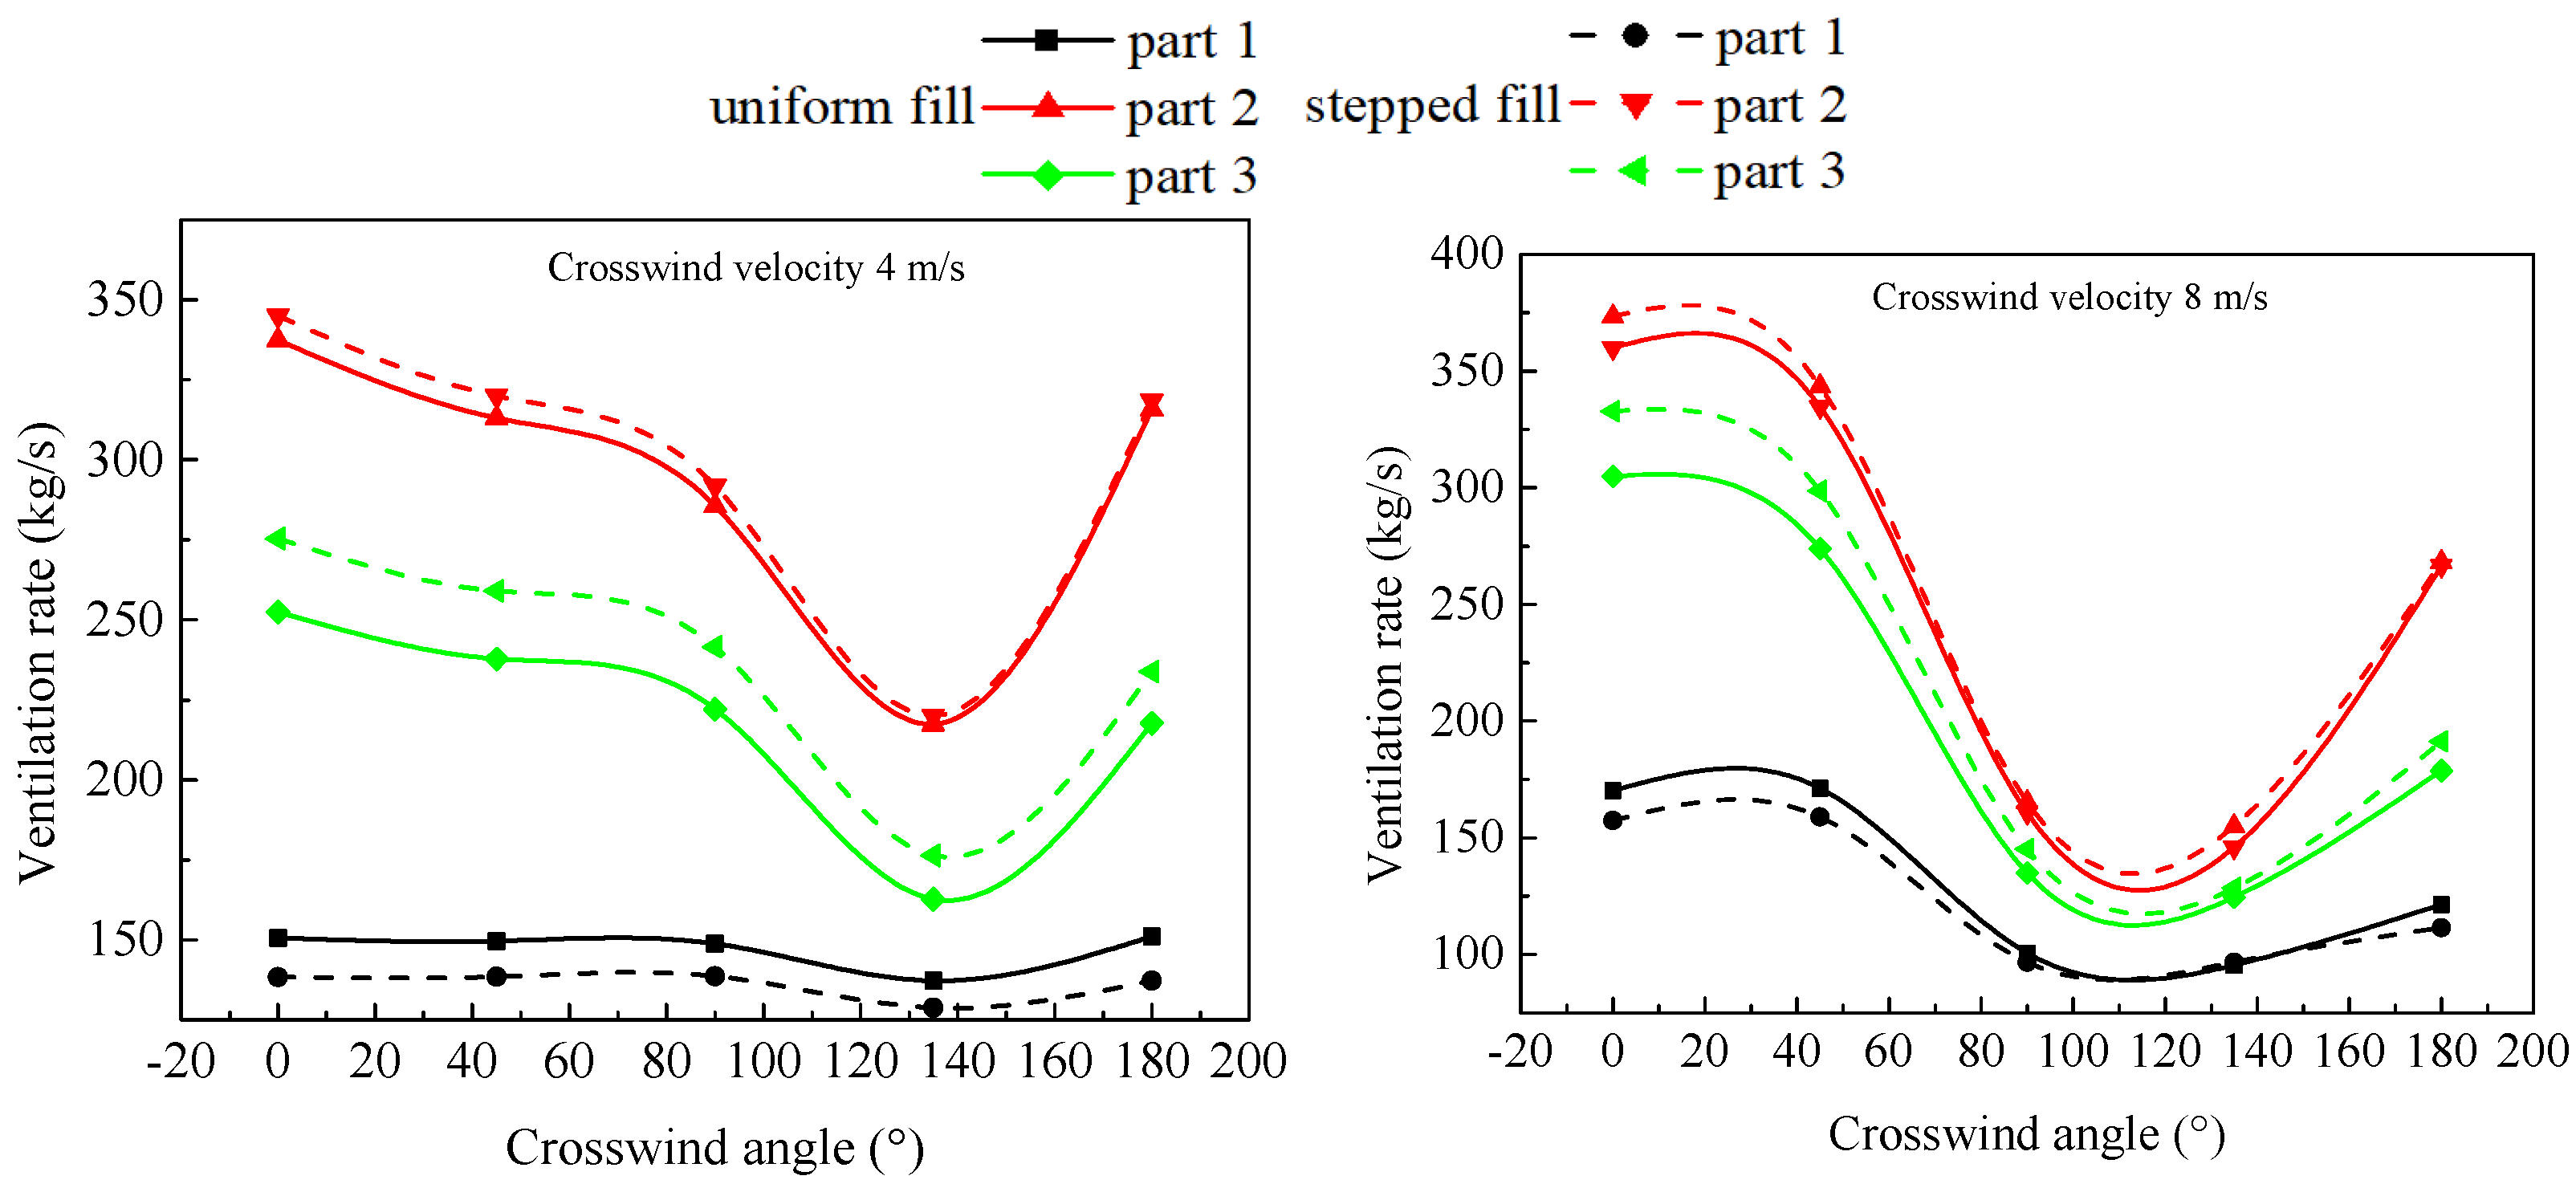
The three monitor surfaces, corresponding to part 1, part 2, and part 3 of the stepped fill, are established above the drift eliminator. The variation of ventilation rate at different monitor surfaces with the crosswind angle is shown in Figure 7. Compared with the uniform fill, regardless of the crosswind velocity of 4 m/s or 8 m/s, the ventilation rate of part 1 of stepped fill is always less than that of uniform fill. However, the ventilation rate of part 2 and 3 of stepped fill is greater than that of uniform fill. The fill thickness of part 1 is increased, leading to rising airflow resistance and decrease ventilation rate. However, the thickness of fill is reduced in part 3, resulting in an increasing ventilation rate. Due to the structure of stepped fill, the ventilation rate of part 2 is slightly increased. At low wind speed (4 m/s), the minimum ventilation rate occurs at the crosswind angle of 135°. However, at high wind speed (8 m/s), the crosswind angle corresponding to the minimum ventilation rate moves slightly forward compared to that of the low wind speed. In general, the stepped fill can increase the ventilation rate of the total tower and make the airflow distribution more uniform.
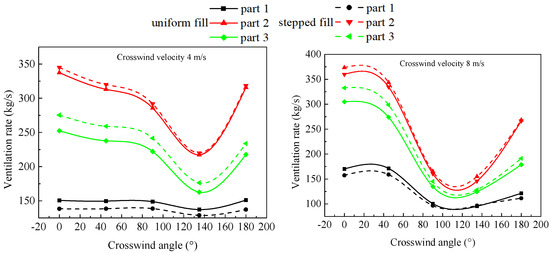
Figure 7.
The variation of ventilation rate in different parts.
Figure 8 indicates the air density difference at the eliminator top ( for the stepped fill, for the uniform fill). The pumping force of the SIDCT is mainly from the fan, and the proportion of the pumping force causing the density difference of moist air is very small. For part 1 of stepped fill, the thickness of fill increases, but the airflow resistance enhances. However, for the cooling capacity, the positive contribution by increased thickness of fill is greater than the adverse influence caused by airflow resistance. Although the airflow velocity decreases in part 1, but the total of heat and mass transfer increases, and the cooling capacity of the tower still rises. The capacity with heat and mass transfer of air per unit mass increases and air density reduces in the part 1. As the fill thickness decreases, the air resistance decreases in part 3. The capacity of the heat and mass transfer is enhanced with the ventilation rate increased. However, the capacity of the heat and mass transfer of unit air is weakened. The moist air density of the part 3 increases slightly. For the part 2, the thickness of fill is unchanged, but the ventilation rate is slightly increased. The capacity of the heat and mass transfer of air per unit mass changes very little and the air density is slightly reduced.
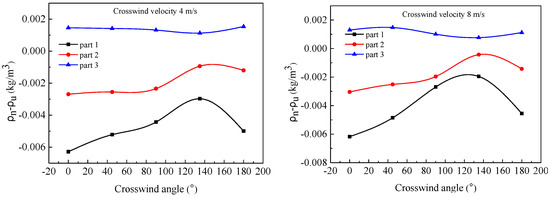
Figure 8.
Air density difference at the eliminator top with different fill layout patterns.
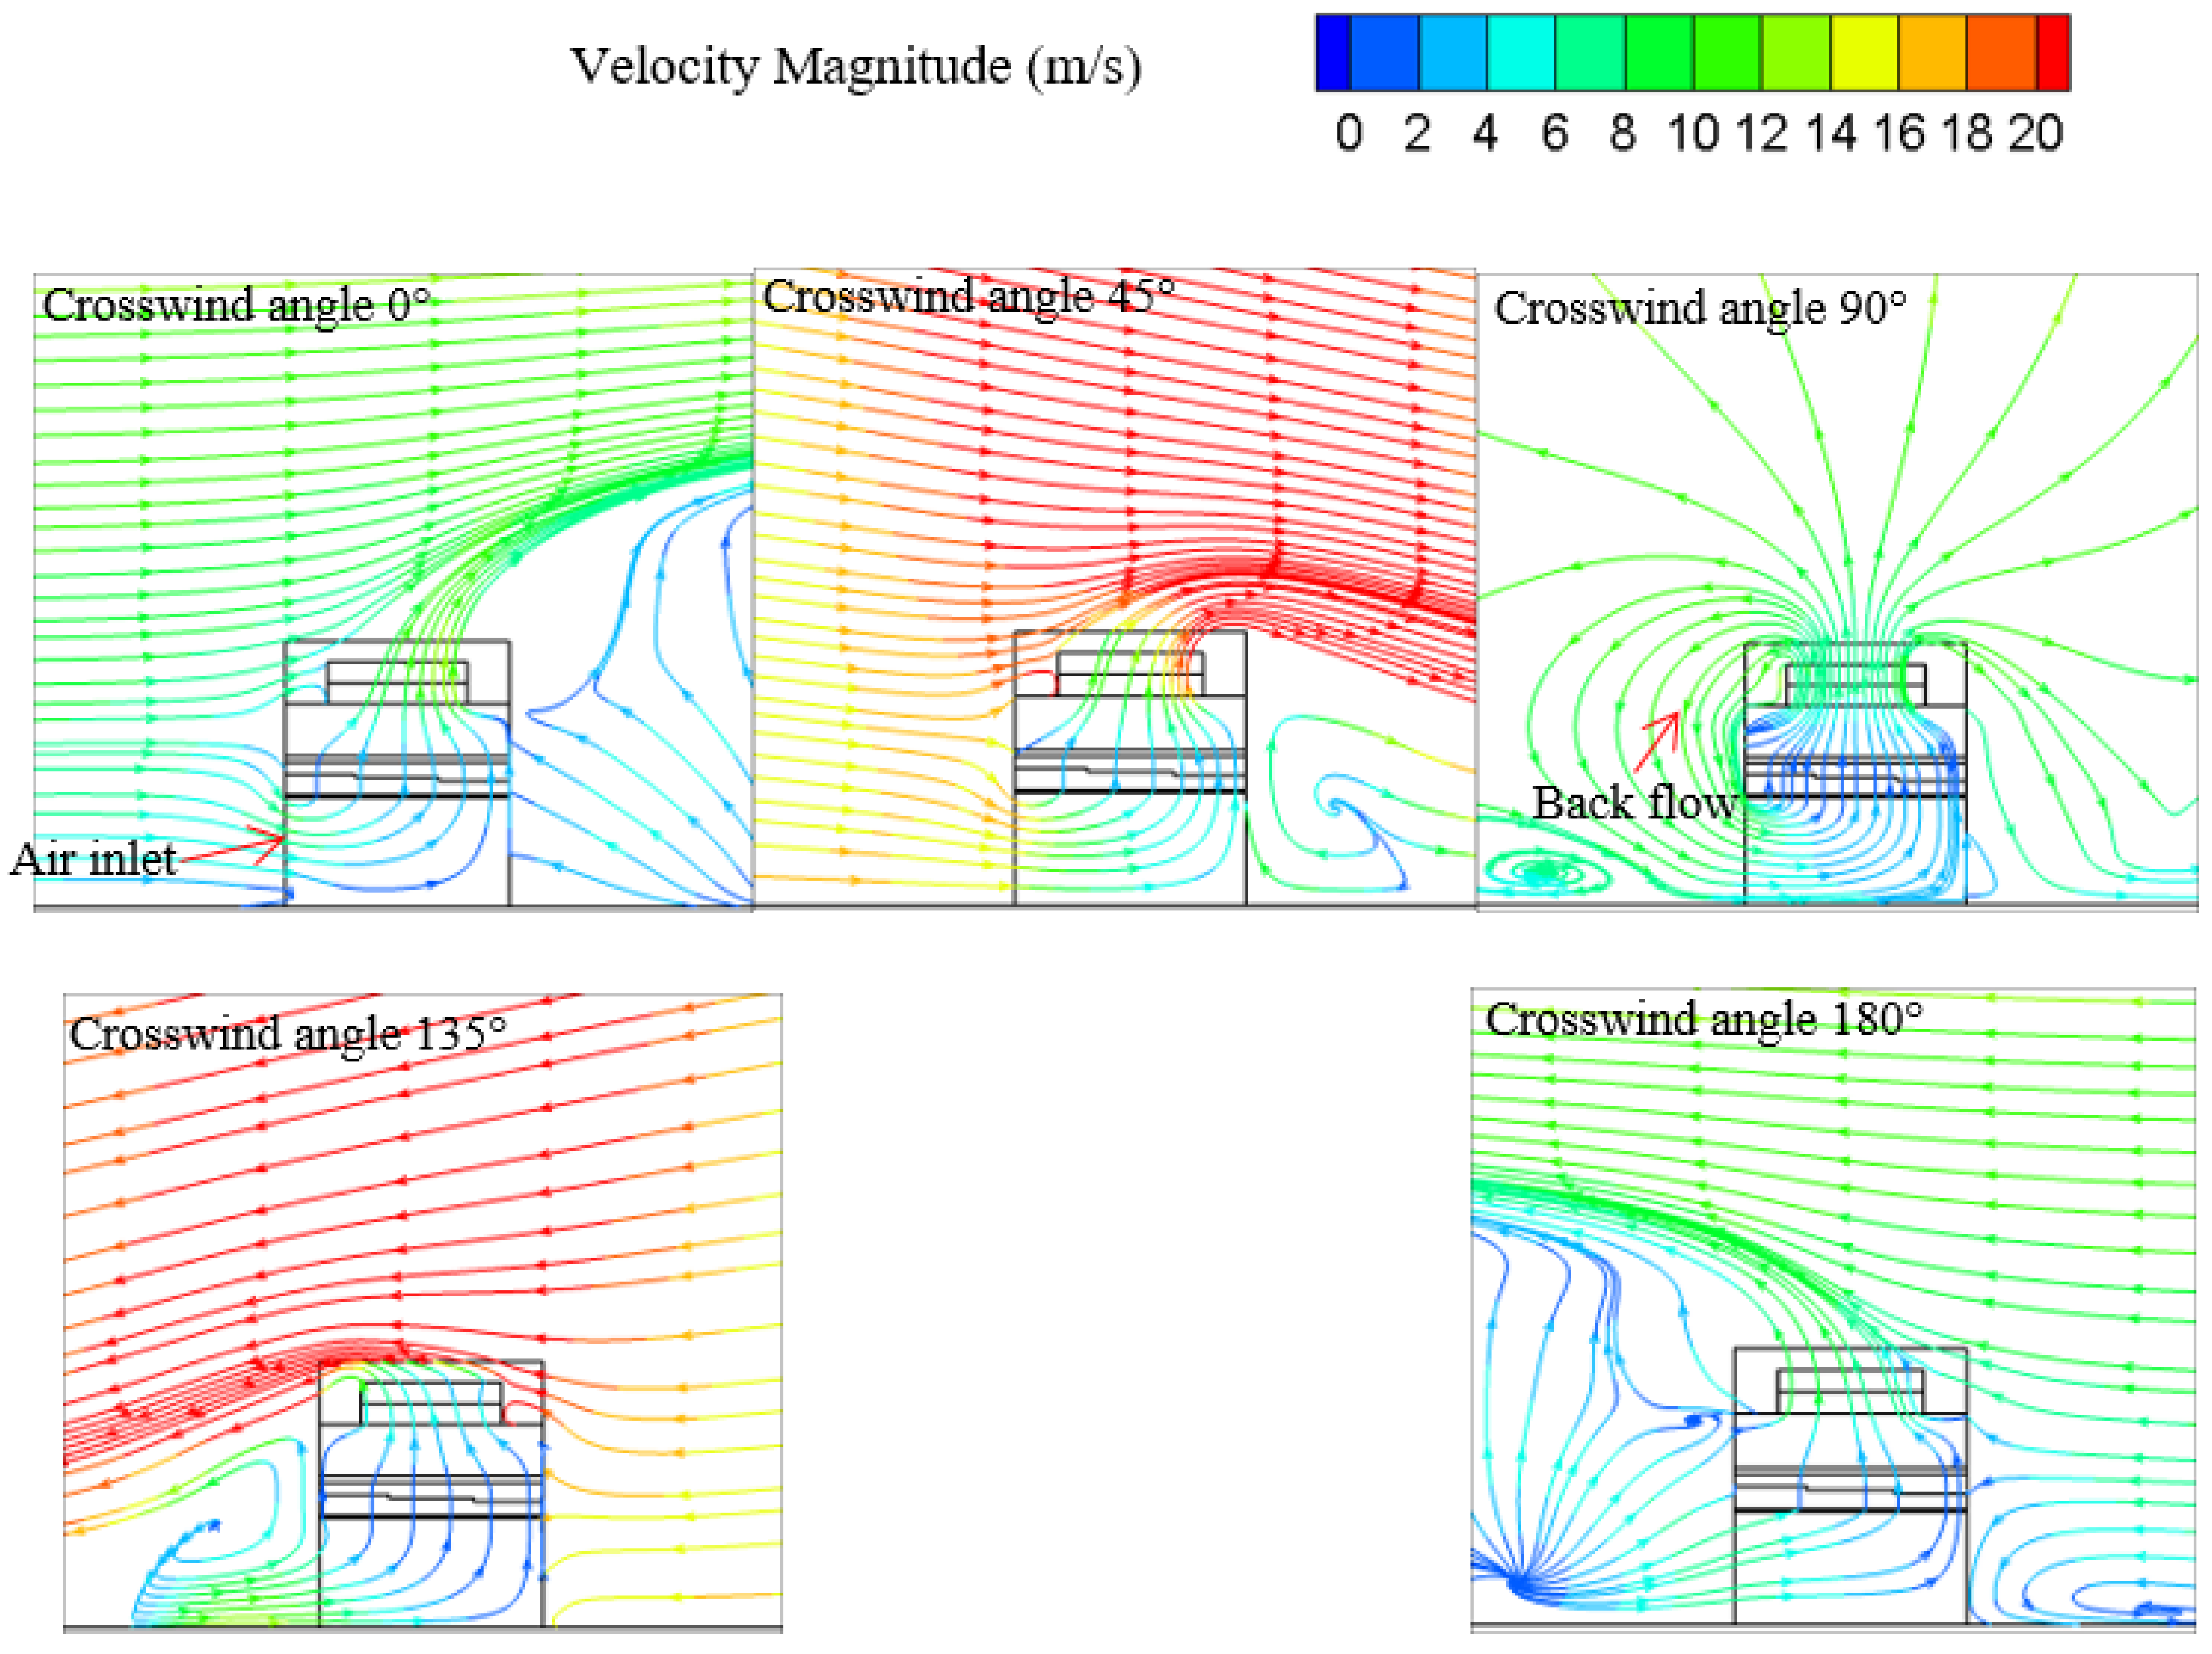
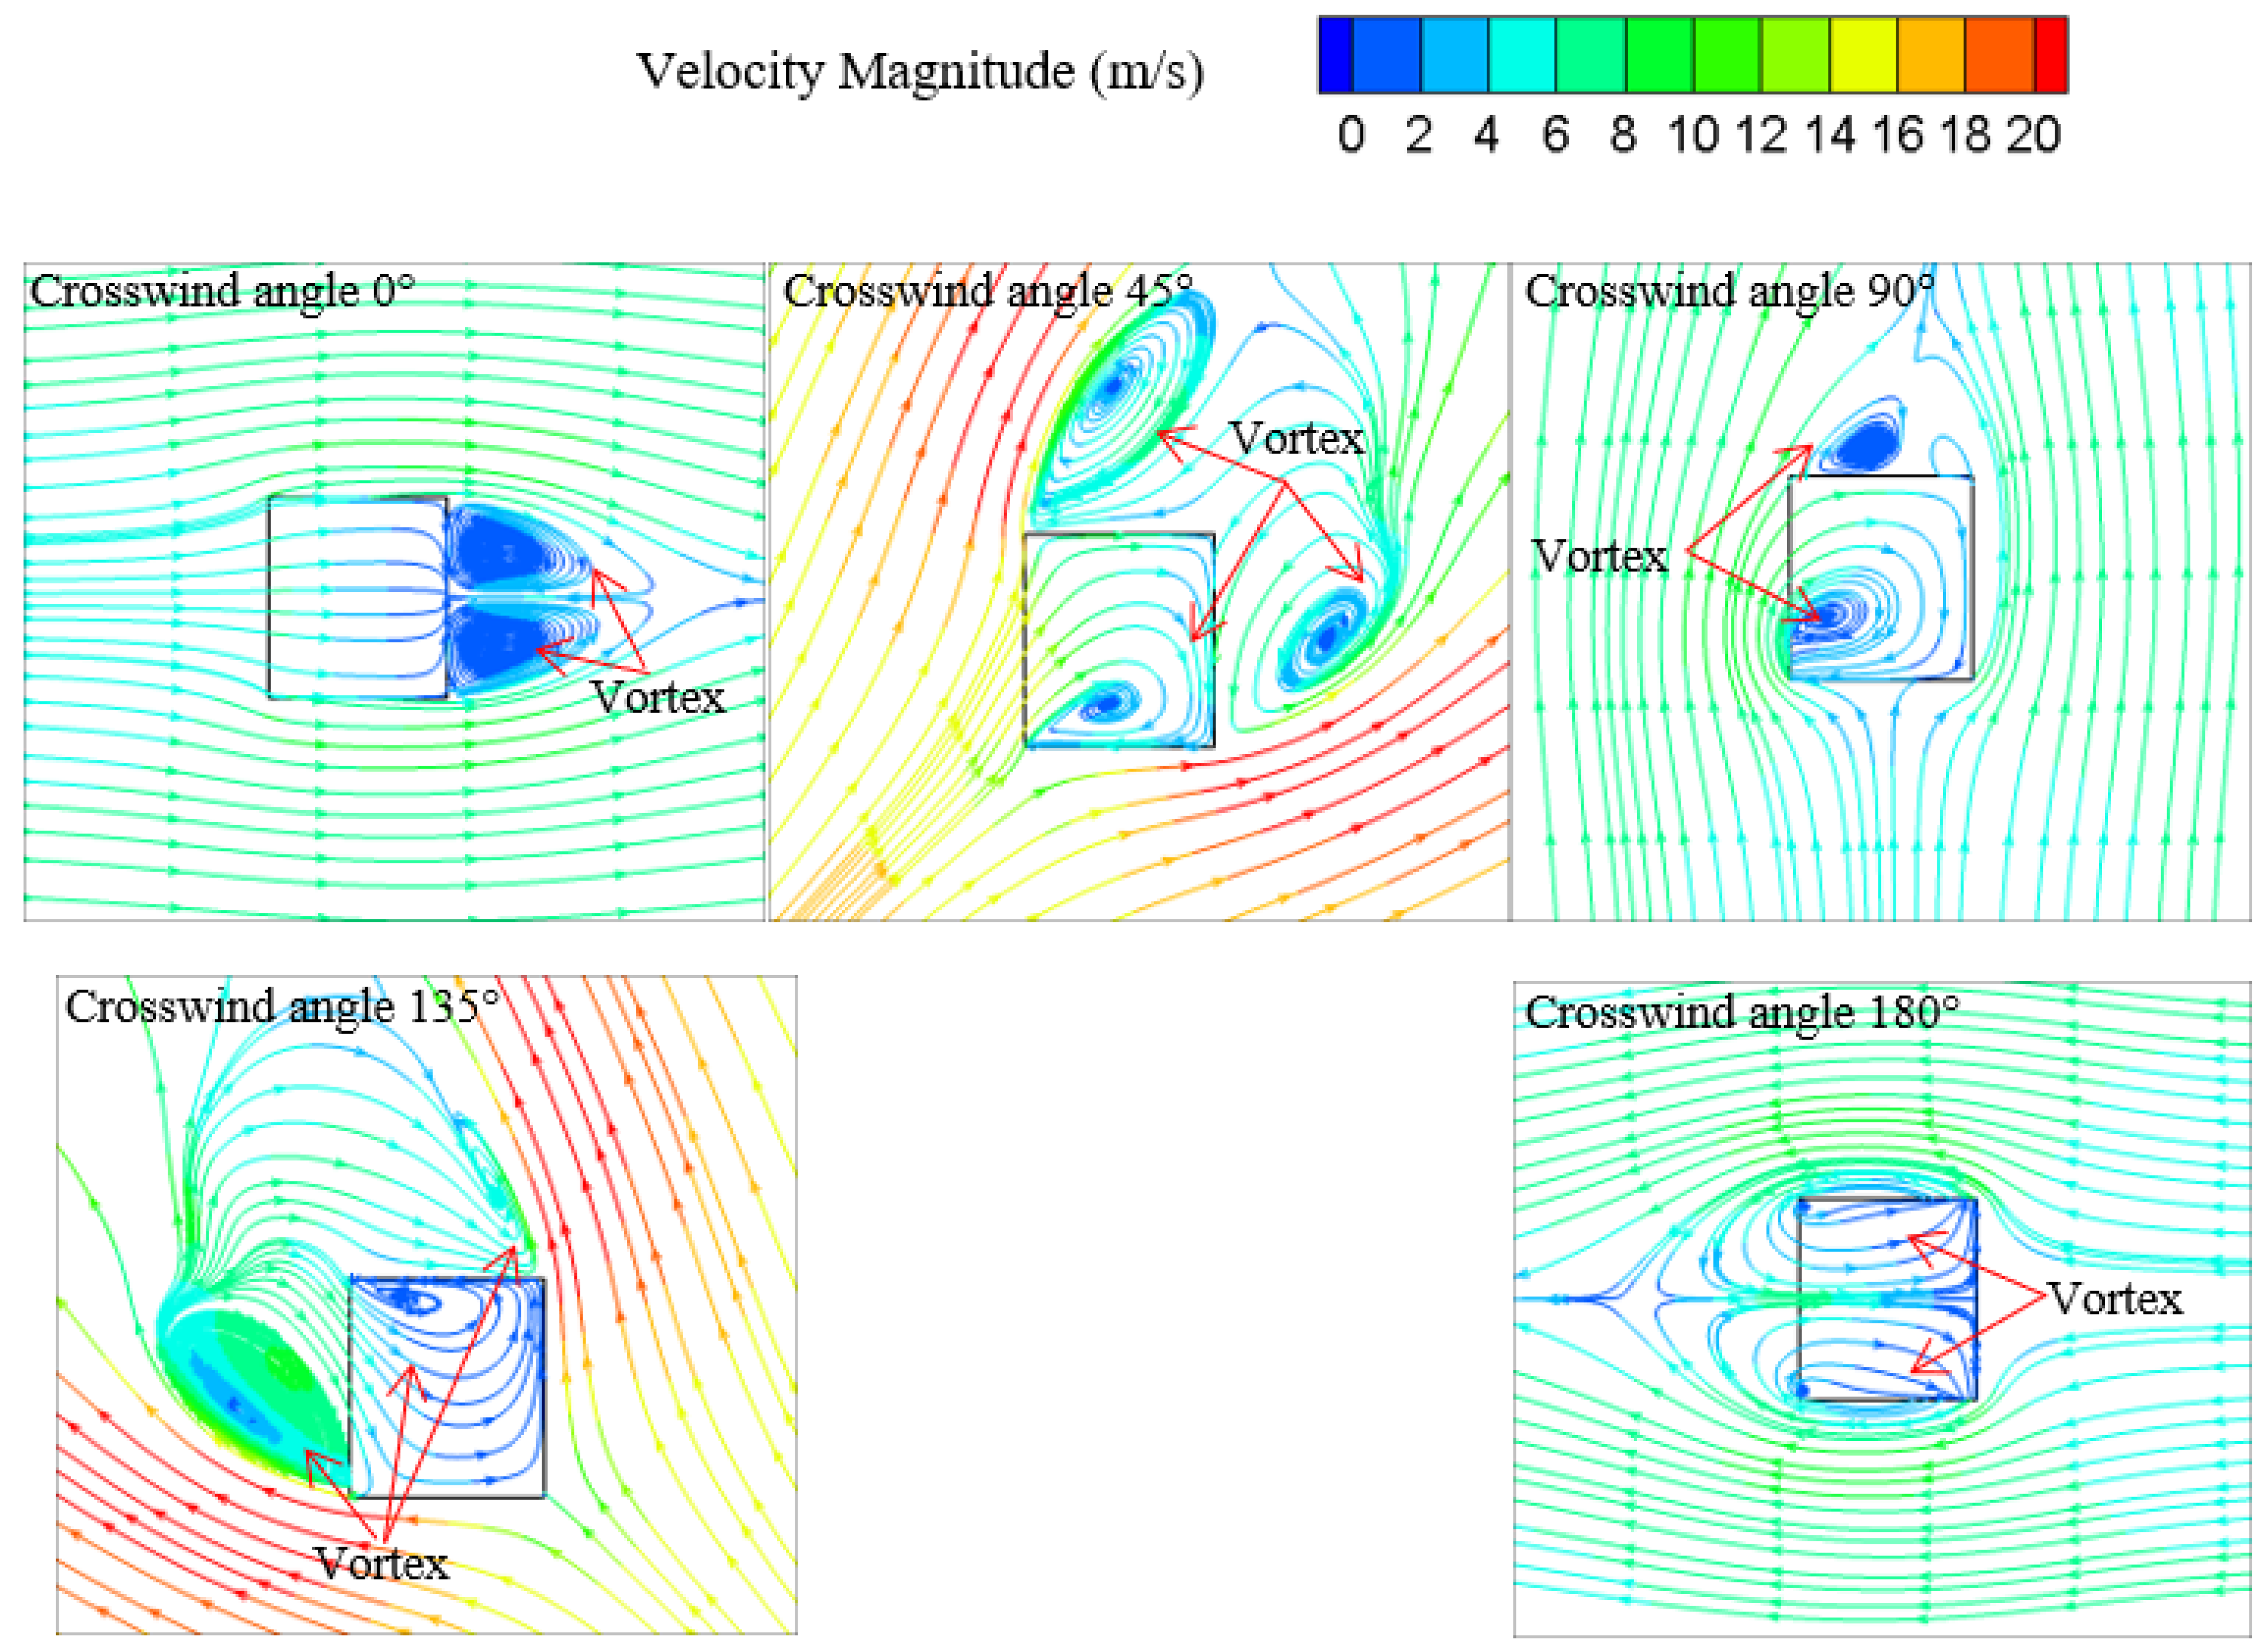
Figure 9 and Figure 10 show the streamlines at the plane of xz and z = 4 m with the crosswind velocity of 8 m/s. When the crosswind angle is 0°, the air velocity gradually decreases from the air inlet to the inner zone of the tower. There are two vortexes derived from low-pressure areas in the leeward side of the tower.

Figure 9.
The streamlines around the tower at the plane xz.

Figure 10.
The streamlines around the tower at the plane z = 4 m.
Under the crosswind angle of 45°, there are three vortexes around the tower. One of them occurs inside the tower and the others are outside the tower. The volume of the vortex inside the tower is larger, leading to increased airflow resistance and reduced ventilation volume of the tower.
As seen in Figure 9, the part of moist air leaving the tower flows into the tower again under the crosswind angle of 90°. The heat and mass transfer from water to air is weakened because of decreasing temperature differences and moisture content difference. The moist air can not only prevent cold air entering the tower, but also decrease evaporation heat transfer from water to air, and further reduce the cooling capacity of the tower.
Under the crosswind angle of 135°, at the plane xz, a big vortex occurs in front of the air inlet. As depicted at z = 4 m surface, there are three vortexes, one of them is inside the tower and the others are outside the tower. It can be seen that the big vortex prevents airflow entering the tower, and only partial air leaving from the vortex edge enters the cooling tower along a negative direction of crosswind with lower velocity. Meanwhile, another vortex appears in the leeward wall of the tower where air velocity is low.
Under the crosswind angle of 180°, two vortexes are formed inside the tower. The center of the vortex appears at the tower lateral wall. The place between two vortexes has larger air velocity.
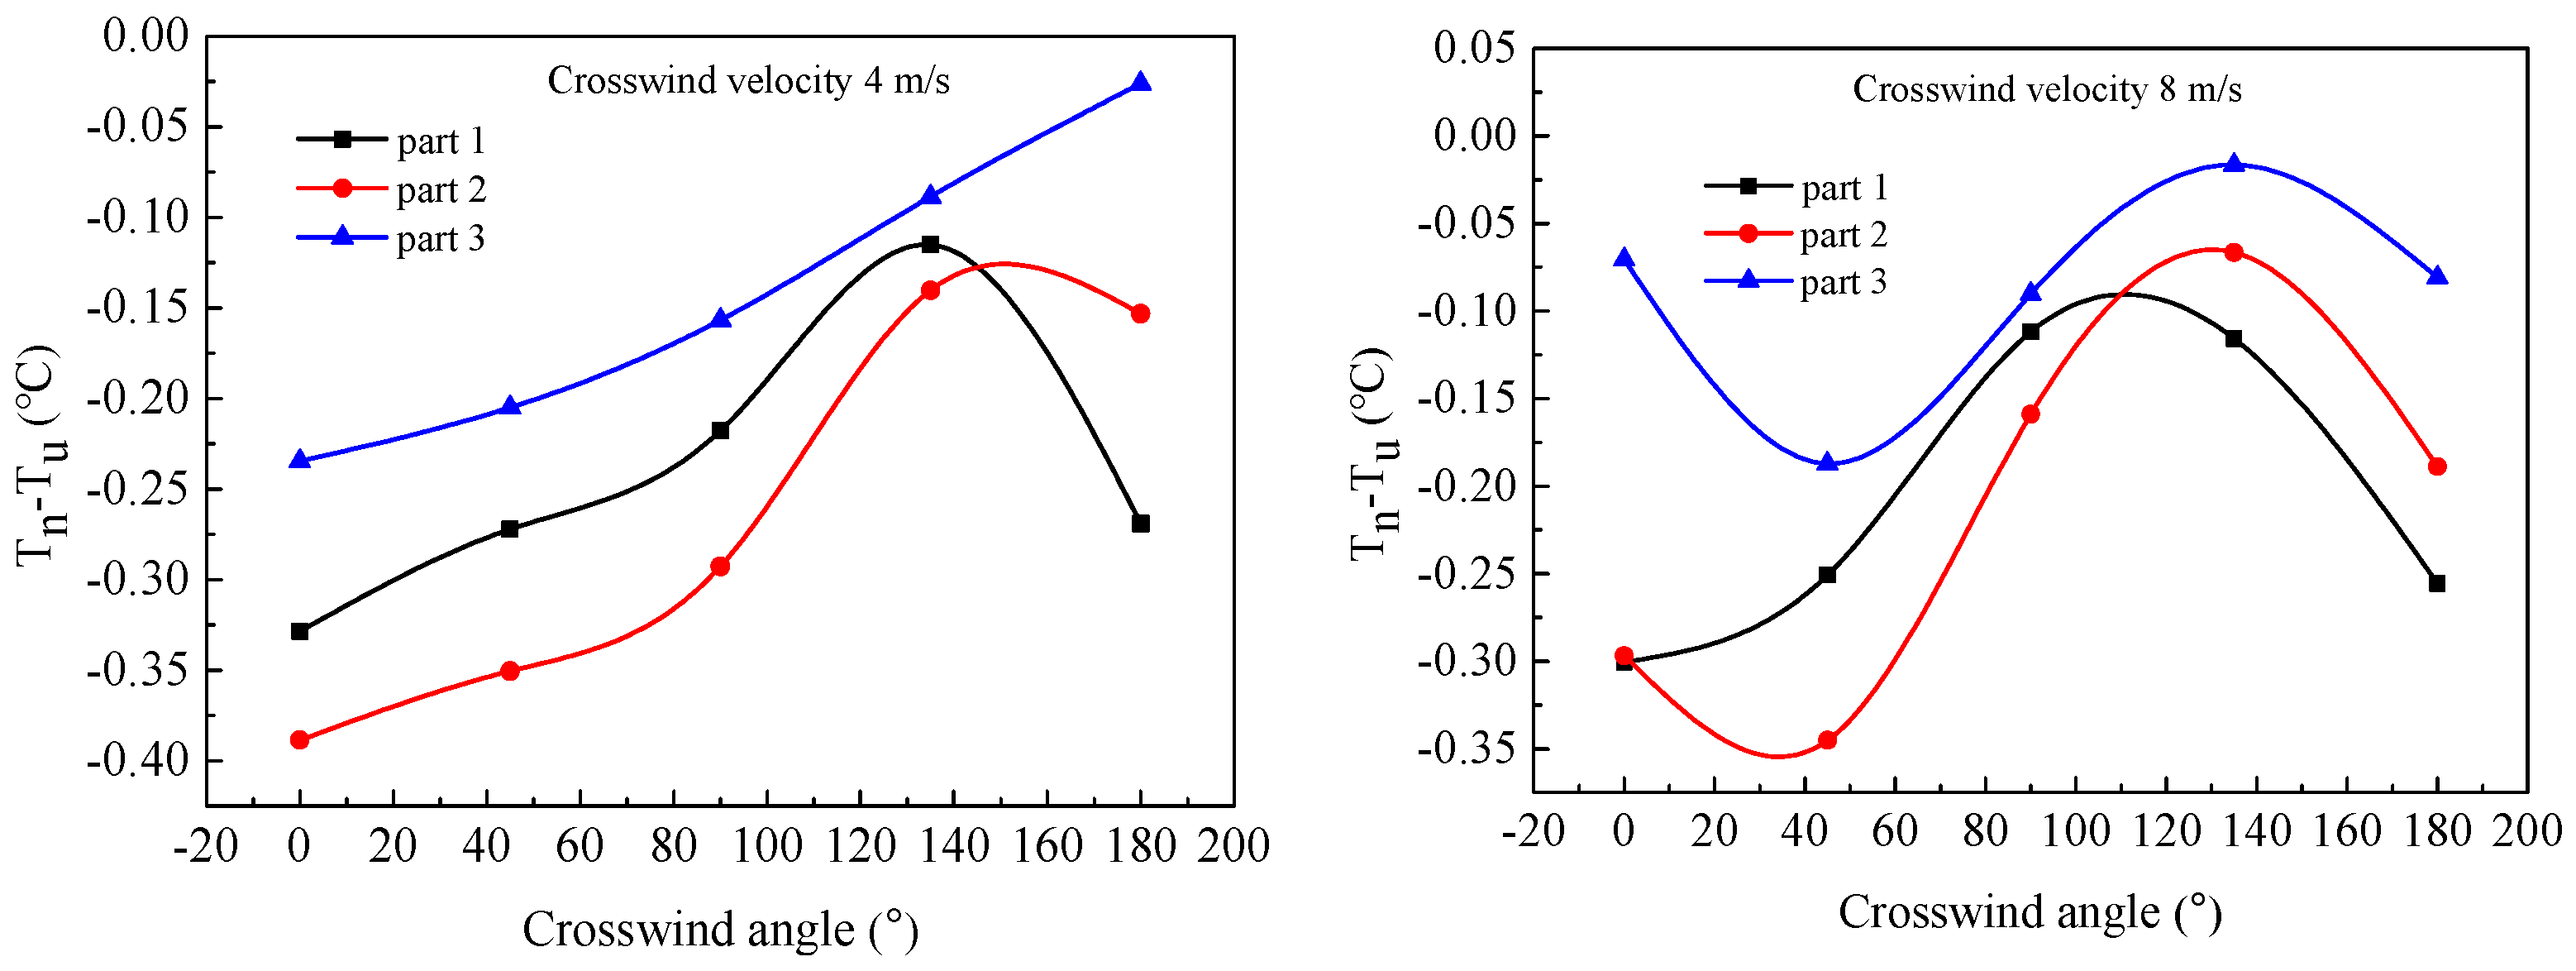
3.2. Cooling Capacity of SIDCT
Figure 11 shows the temperature differences of water outlet temperature with different fill patterns ( for the stepped fill, for the uniform fill). The water outlet temperature of the stepped fill tower is lower than that of uniform fill, regardless of the crosswind velocity of 4 and 8 m/s. The cooling capacity of fill in all three parts is increased. For part 1, the thickness of fill increases, leading to an increase of heat transfer area between the air and water, which causes the cooling capacity to be enhanced, although the ventilation rate is slightly reduced. For part 2 and 3, the ventilation rate increases, leading to increases in the ratio of air and water, and the cooling capacity is optimized.
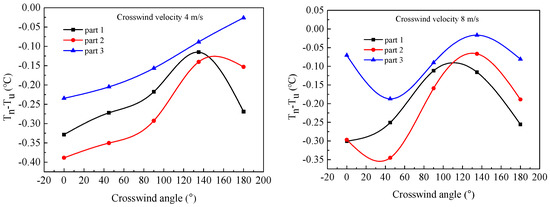
Figure 11.
Water outlet temperature differences with different fill patterns.
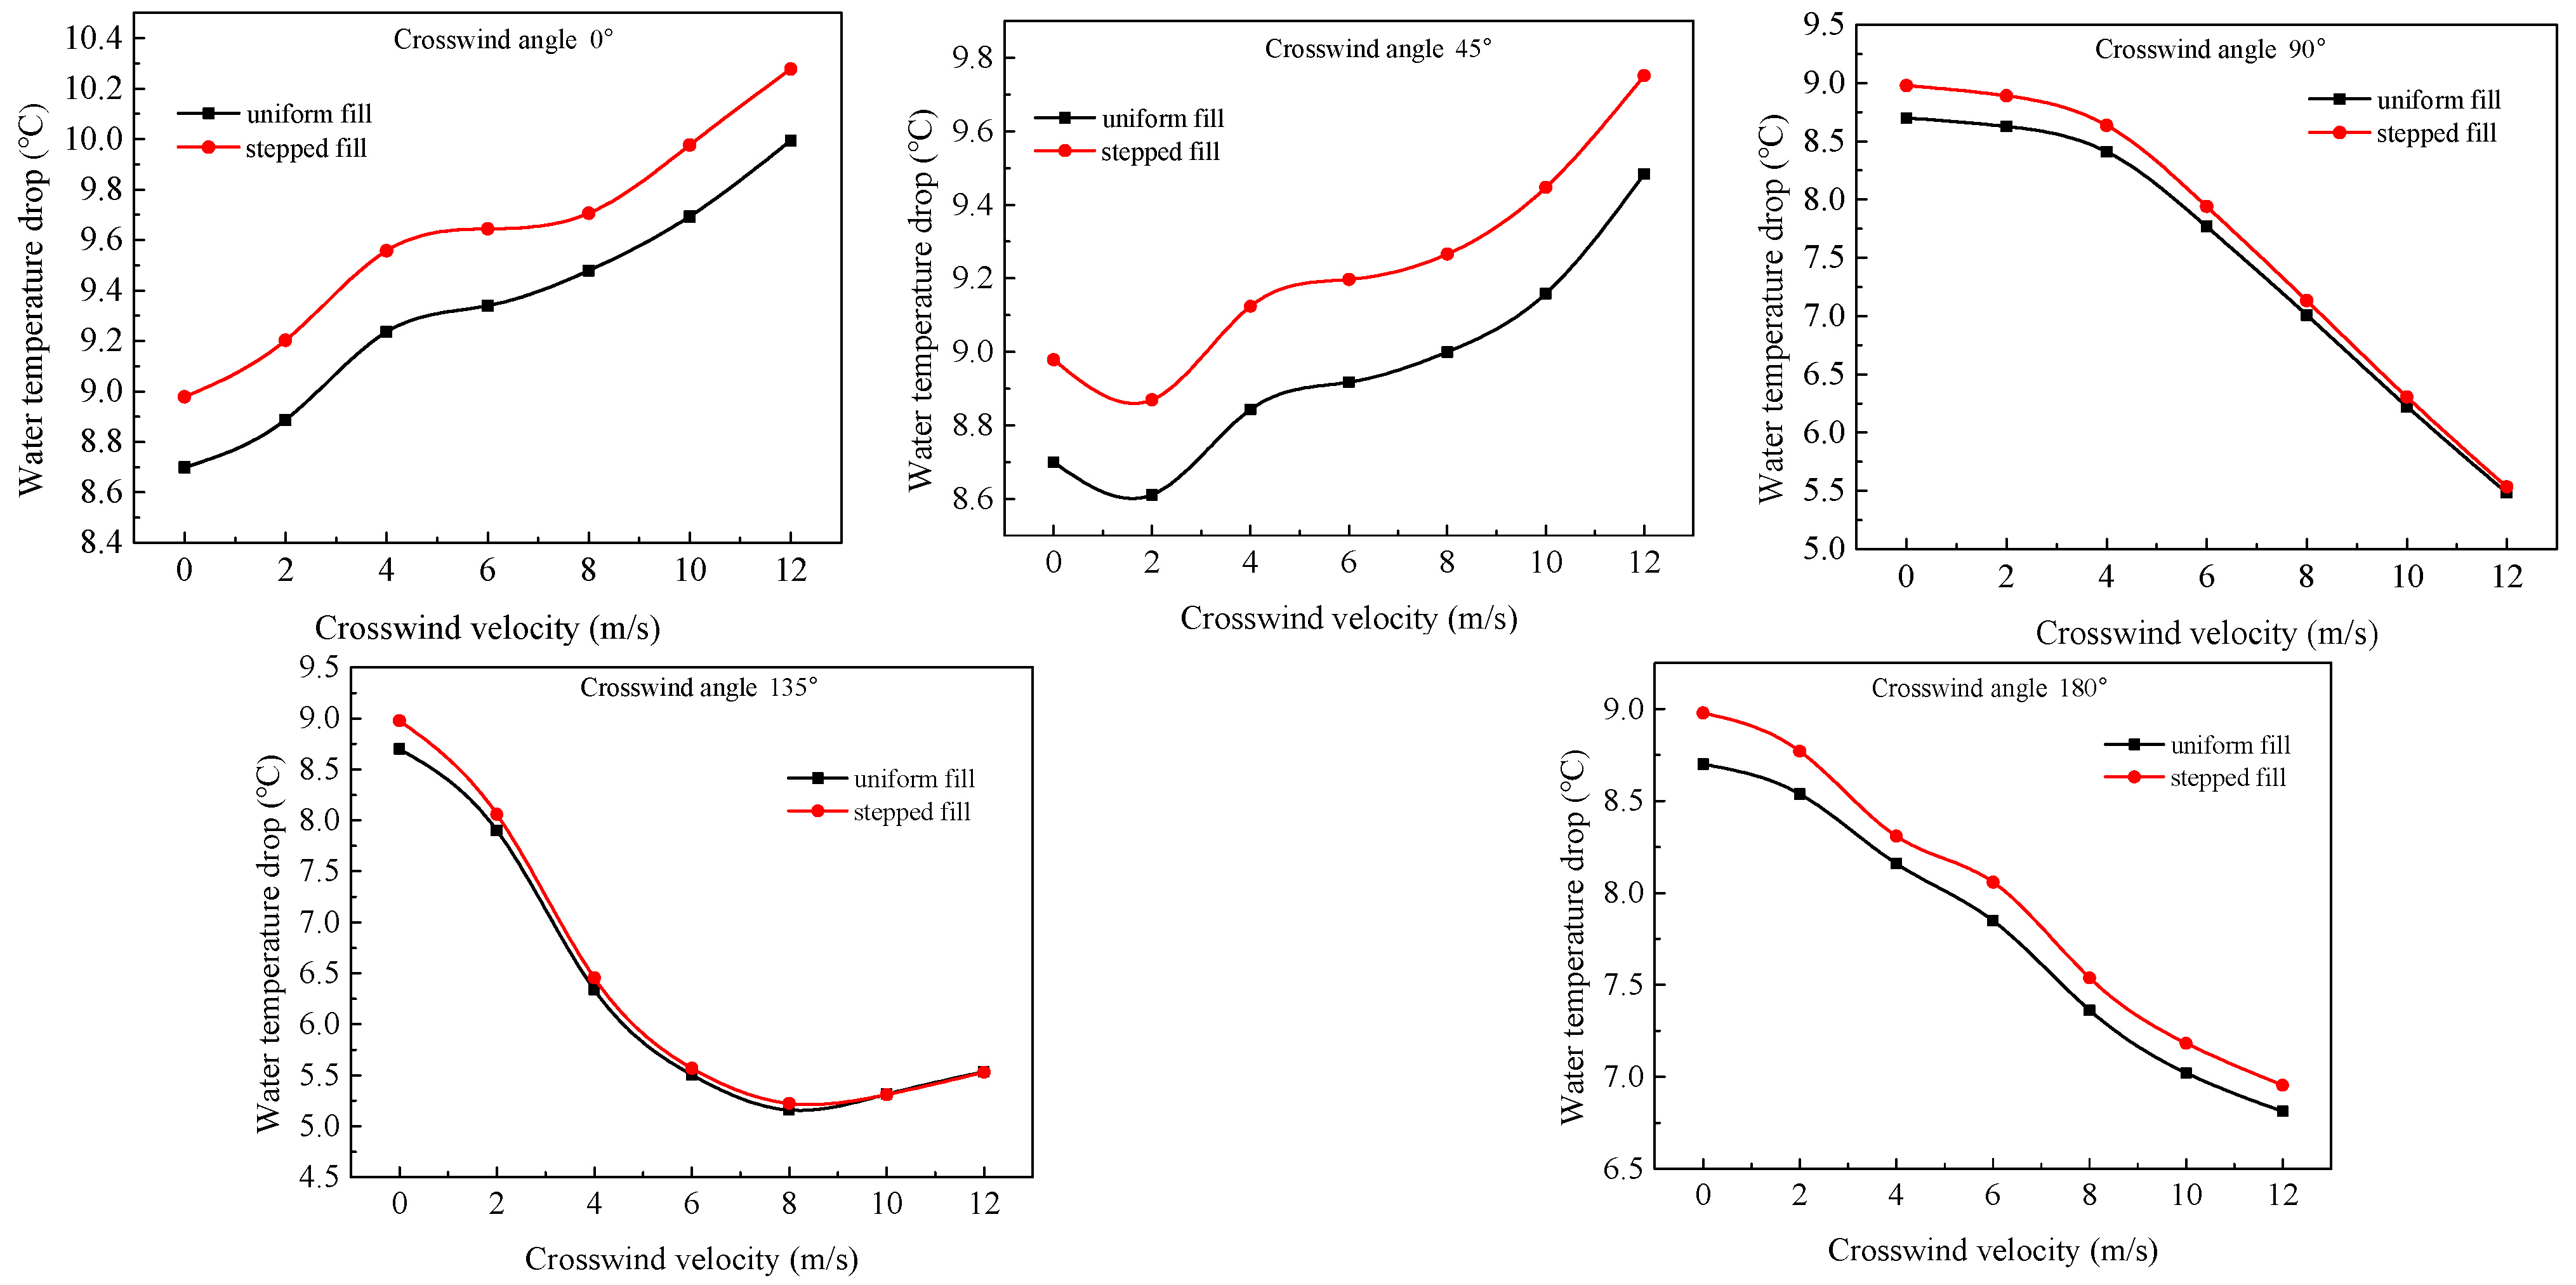
The changes of water surface temperature with various crosswind velocities and angles are depicted in Figure 12. The water temperature drop of the stepped fill tower is larger than that of the uniform fill, regardless of both the crosswind velocity and angle studied. The mean drop of outlet water temperature rises by 0.29 °C, 0.27 °C, 0.17 °C, 0.10 °C, and 0.19 °C, corresponding to the crosswind angles from 0° to 180°. When we adopt a stepped fill, the maximum value of water temperature drop appears at the crosswind angle of 0°, and the minimum value is at the crosswind angle of 135°. By analysis, for both types of tower, the circulating water temperature drop increases under the crosswind angles of 0° and 45° with the rising crosswind velocity. However, it always decreases under the crosswind angles of 90° and 180°, and decreases first and then rises slightly in the crosswind angle of 135°. For a common operating situation (wind velocity of 0 m/s–4 m/s), the average drop of water temperature is sequentially 0.31 °C, 0.27 °C, 0.26 °C, 0.18 °C, and 0.22 °C under the crosswind angles of from 0° to 180°. That is, there is much higher cooling performance with stepped fill under low crosswind velocity.
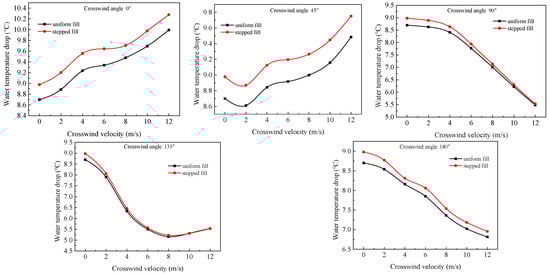
Figure 12.
The changes of water temperature drop with environment wind.
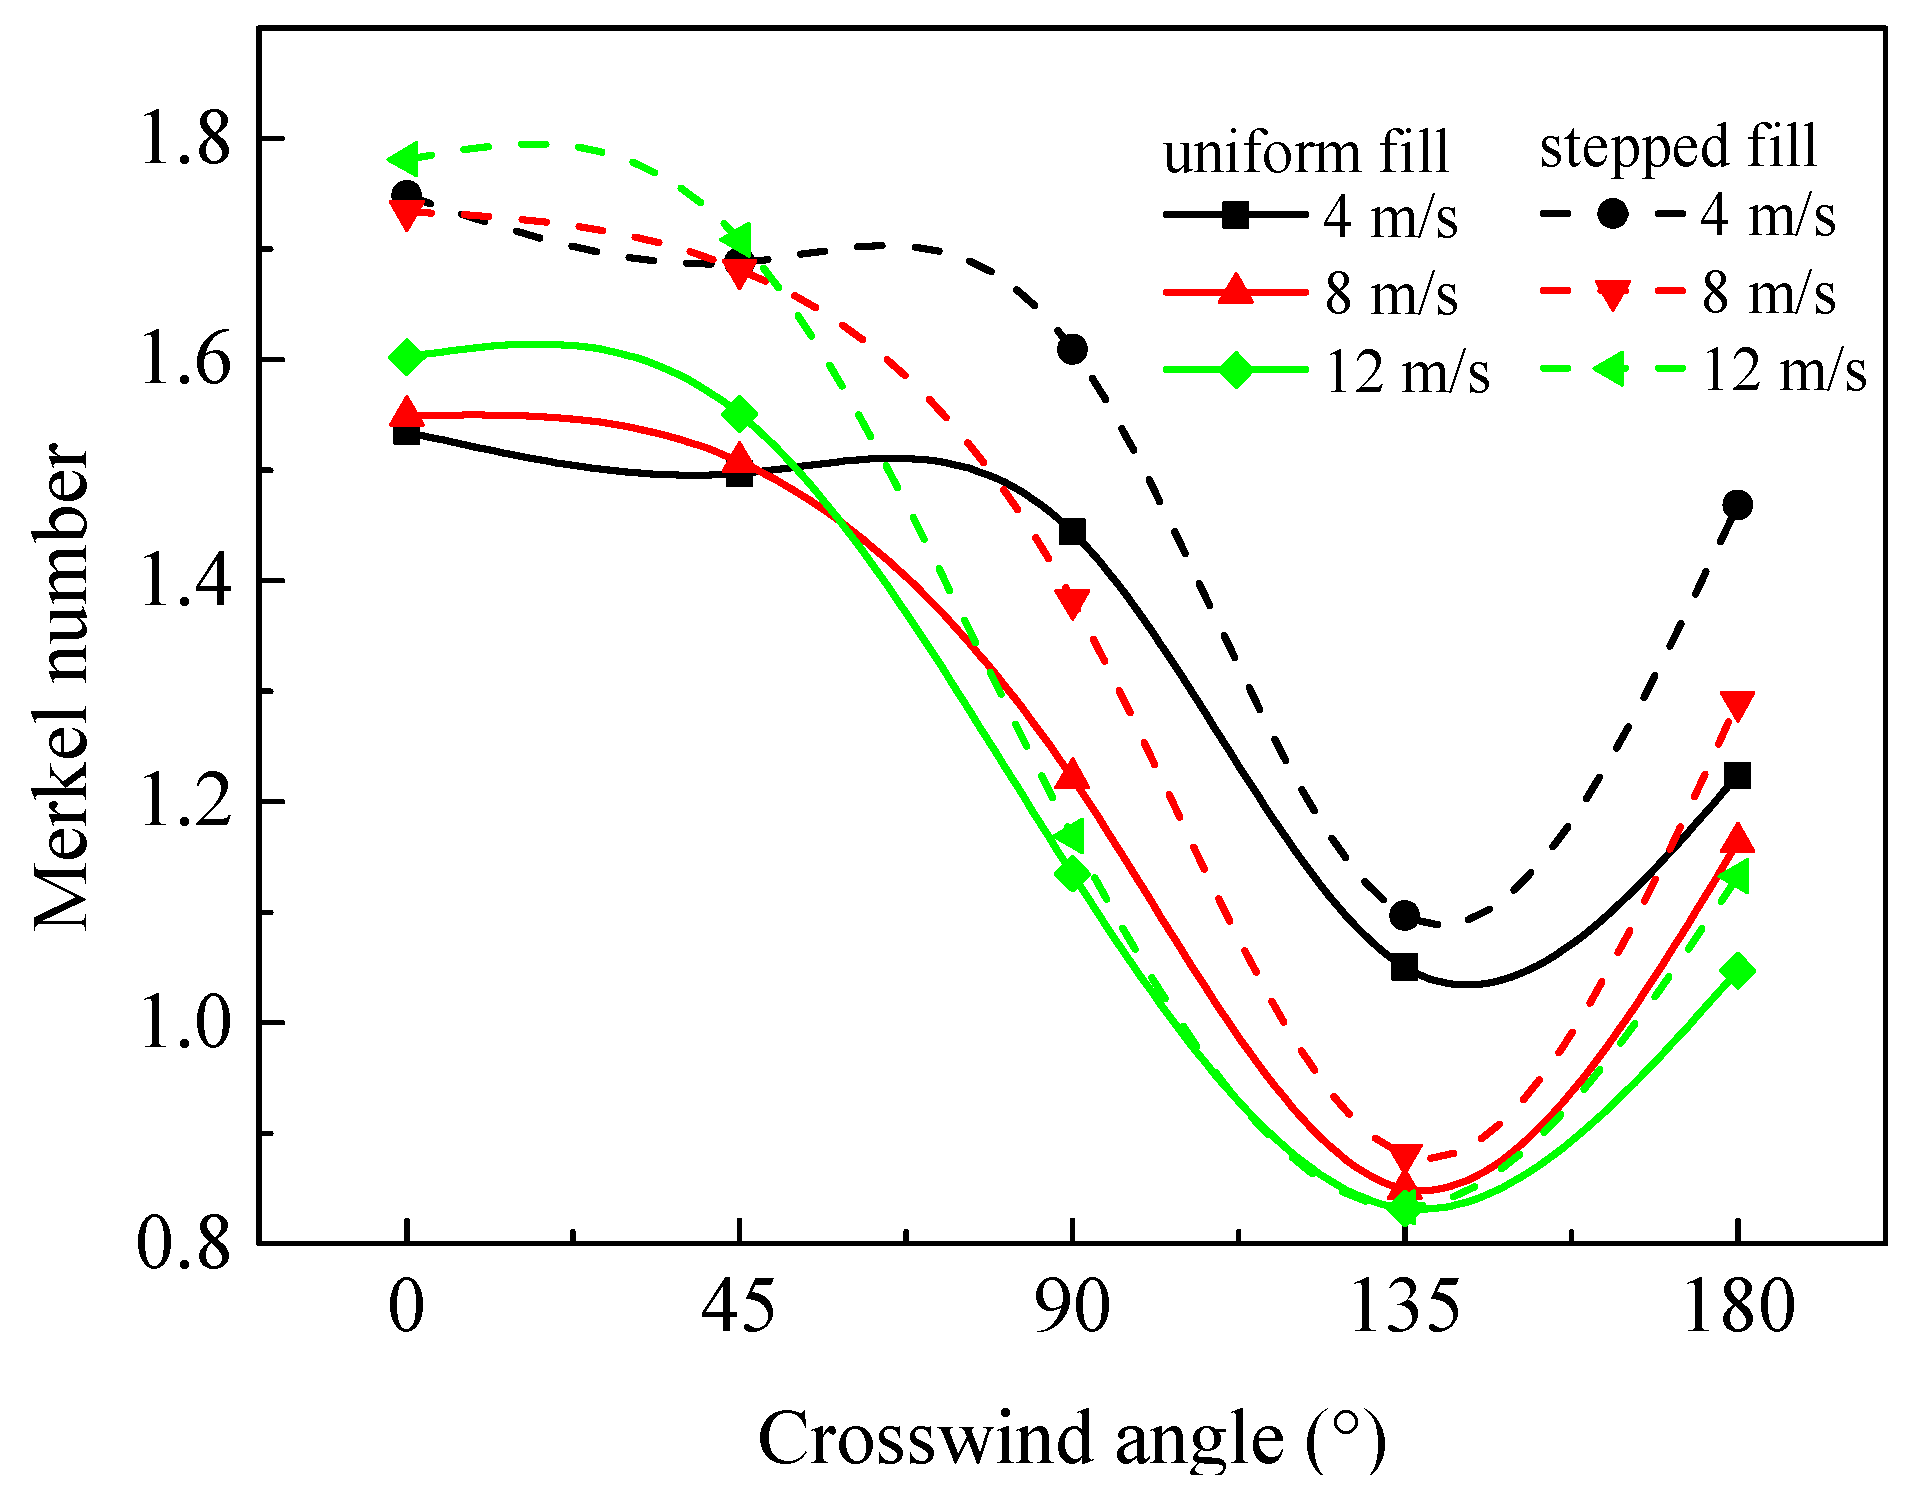
3.3. Merkel Number
For fully expressing the cooling capacity of tower, the Merkel number can be introduced, which has been widely applied in previous studies. The Merkel number is defined by Equation (26).
where the , , are saturated moist air enthalpy in the , , , respectively. The , , are moist air enthalpy in the inlet, outlet, and average, respectively. is the evaporation coefficient. is the specific heat of water. is temperature difference between circulating water inlet and outlet.
The changes of under the different crosswind angles are shown in Figure 13. From Figure 13, regardless of crosswind velocity of 4 m/s, 8 m/s, and 12 m/s, the of the stepped fill tower is larger than that of the uniform fill tower with the increasing crosswind angle. That is, the stepped fill can optimize the cooling capacity of the tower. For both types of tower, the decreases first, then increases, with the minimum value appearing under the crosswind angle of 135°. The crosswind angle effect on is significant under the crosswind conditions studied. After using stepped fill, the maximum increase value of is 0.65 under the crosswind velocity of 4 m/s and is 0.85 under 8 m/s, and is 0.95 under 12 m/s.
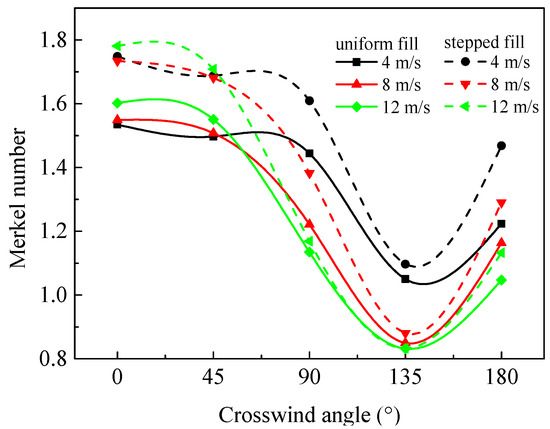
Figure 13.
The changes of Merkel number with different crosswind angles.
4. Conclusions
Under the studied crosswind velocities (0 m/s–12 m/s) and angles (0°–180°), this work mainly studies the optimization of cooling capacity of the single air inlet induced draft cooling tower (SIDCT) with stepped fill. The main conclusions are as follows.
- (1)
- The 3D numerical model for the tower with stepped fill is established and validated. The relative error between measured values and numerical values is no more than 3%.
- (2)
- Compared with uniform fill tower, the total ventilation rate of the stepped fill tower is increased. The stepped fill can increase the ventilation rate in the innermost part of the SIDCT and decrease it around air inlet, not changing in the central part.
- (3)
- After using stepped fill, the mean drop of outlet water temperature rises by 0.29 °C, 0.27 °C, 0.17 °C, 0.10 °C, and 0.19 °C, corresponding to crosswind angles from 0° to 180°. The maximum increased value of is 0.65 under the crosswind velocity of 4 m/s and is 0.85 under 8 m/s, and is 0.95 under 12 m/s.
- (4)
- For the stepped fill tower, the increment of cooling capacity is the maximum under the crosswind angles of 0° and 45°, and is the minimum under the crosswind angle of 90° and 135°.
In a follow-up study, the field test and numerical calculation will focus on high ambient temperature, high inlet water temperature, and variable spray density, etc., to further optimize the applicability of the stepped fill.
Author Contributions
Conceptualization, W.D. and F.S.; methodology, W.D.; software, W.D.; validation, W.D.; formal analysis, W.D.; investigation, W.D.; resources, W.D.; data curation, W.D.; writing—original draft preparation, F.S.; writing—review and editing, W.D.; visualization, W.D.; supervision, W.D.; project administration, W.D.; funding acquisition, W.D. Both authors have read and agreed to the published version of the manuscript.
Funding
This research received no external funding.
Institutional Review Board Statement
Not applicable.
Informed Consent Statement
Not applicable.
Data Availability Statement
Not applicable.
Conflicts of Interest
The authors declare no conflict of interest.
Nomenclature
| surface area of one droplet, m2 | |
| constant pressure specific heat, kJ/(kg·K) | |
| resistance coefficient | |
| diffusion coefficient | |
| resistance force, N | |
| gravitational body force | |
| gravity acceleration, m/s2 | |
| enthalpy, J/kg | |
| height, m | |
| merkel number | |
| number of water droplets per unit volume | |
| mass transfer coefficient, m2/s | |
| thermal conductivity, W/(m·K) | |
| thermal conductivity coefficient, W/(m2·K) | |
| lewis factor | |
| unit tensor | |
| molecular weight | |
| pressure, Pa | |
| Prandtl number | |
| spray density, kg/(m2·s) | |
| water mass flow rate, kg/h | |
| universal gas constant | |
| latent heat of vaporization, kJ/kg | |
| mass source term, kg/(m3·s) | |
| energy source term, W/m3 | |
| schmidt number | |
| mass fraction | |
| water temperature, ℃ | |
| environment air dry-bulb temperature, ℃ | |
| velocity, m/s | |
| reynolds number | |
| reynolds number of water droplets | |
| mechanical draft cooling tower | |
| forced draft cooling tower | |
| induced draft cooling tower | |
| single air inlet induced draft cooling tower | |
| Greek symbols | |
| density, kg/m3 | |
| viscosity, kg/s | |
| turbulent kinematic dissipation rate, m2/s3 | |
| moisture content of the air, kg/kg | |
| air relative humidity, % | |
| Subscripts | |
| 1 | inlet value |
| 2 | outlet value |
| air | |
| vapor | |
| reference value | |
| water | |
| mass | |
References
- Chen, X.; Sun, F.; Li, X.; Song, H.; Zheng, P.; Lyu, X.; Yan, L. Field measurement on the three-dimensional thermal characteristics of a single air inlet induced draft cooling tower. Appl. Therm. Eng. 2020, 172, 115167. [Google Scholar] [CrossRef]
- Rahmati, M.; Alavi, S.R.; Tavakoli, M.R. Investigation of heat transfer in mechanical draft wet cooling towers using infrared thermal images: An experimental study. Int. J. Refrig.-Rev. Int. Du Froid 2018, 88, 229–238. [Google Scholar] [CrossRef]
- Rahmati, M.; Alavi, S.R.; Tavakoli, M.R. Experimental investigation on performance enhancement of forced draft wet cooling towers with special emphasis on the role of stage numbers. Energy Convers. Manag. 2016, 126, 971–981. [Google Scholar] [CrossRef]
- Naik, B.K.; Muthukumar, P. A novel approach for performance assessment of mechanical draft wet cooling towers. Appl. Therm. Eng. 2017, 121, 14–26. [Google Scholar] [CrossRef]
- Lucas, M.; Martinez, P.J.; Viedma, A. Experimental study on the thermal performance of a mechanical cooling tower with different drift eliminators. Energy Convers. Manag. 2009, 50, 490–497. [Google Scholar] [CrossRef]
- Lucas, M.; Ruiz, J.; Martinez, P.J.; Kaiser, A.S.; Viedma, A.; Zamora, B. Experimental study on the performance of a mechanical cooling tower fitted with different types of water distribution systems and drift eliminators. Appl. Therm. Eng. 2013, 50, 282–292. [Google Scholar] [CrossRef] [Green Version]
- Singh, K.; Das, R. An experimental and multi-objective optimization study of a forced draft cooling tower with different fills. Energy Convers. Manag. 2016, 111, 417–430. [Google Scholar] [CrossRef]
- Singh, K.; Das, R. A feedback model to predict parameters for controlling the performance of a mechanical draft cooling tower. Appl. Therm. Eng. 2016, 105, 519–530. [Google Scholar] [CrossRef]
- Singh, K.; Das, R. Improved Quantification of Exergy Destruction in Mechanical Cooling Tower Considering All Tower Inlet Parameters. J. Heat Transf.-Trans. ASME 2018, 140, 052002. [Google Scholar] [CrossRef]
- Singla, R.K.; Singh, K.; Das, R. Tower characteristics correlation and parameter retrieval in wet-cooling tower with expanded wire mesh packing. Appl. Therm. Eng. 2016, 96, 240–249. [Google Scholar] [CrossRef]
- Muller, C.J.; Craig, I.K. Modelling of a dual circuit induced draft cooling water system for control and optimisation purposes. J. Process. Control. 2015, 25, 105–114. [Google Scholar] [CrossRef] [Green Version]
- Ruiz, J.; Cutillas, C.G.; Kaiser, A.S.; Ballesta, M.; Zamora, B.; Lucas, M. Experimental study of drift deposition from mechanical draft cooling towers in urban environments. Energy Build. 2016, 125, 181–195. [Google Scholar] [CrossRef]
- Viljoen, J.H.; Muller, C.J.; Craig, I.K. Dynamic modelling of induced draft cooling towers with parallel heat exchangers, pumps and cooling water network. J. Process. Control. 2018, 68, 34–51. [Google Scholar] [CrossRef] [Green Version]
- Guo, Y.; Wang, F.; Jia, M.; Zhang, S. Parallel hybrid model for mechanical draft counter flow wet-cooling tower. Appl. Therm. Eng. 2017, 125, 1379–1388. [Google Scholar] [CrossRef]
- Gao, M.; Zou, J.; He, S.; Sun, F. Thermal performance analysis for high level water collecting wet cooling tower under crosswind conditions. Appl. Therm. Eng. 2018, 136, 568–575. [Google Scholar] [CrossRef]
- Chen, X.; Sun, F.; Lyu, D. Field test study on water droplet diameter distribution in the rain zone of a natural draft wet cooling tower. Appl. Therm. Eng. 2019, 162, 114252. [Google Scholar] [CrossRef]
- Dang, Z.; Gao, M.; Long, G.; Zou, J.; He, S.; Sun, F. Crosswind influence on cooling capacity in different zones for high level water collecting wet cooling towers based on field test. J. Wind. Eng. Ind. Aerodyn. 2019, 190, 134–142. [Google Scholar] [CrossRef]
- Zou, J.; He, S.; Long, G.; Sun, F.; Gao, M. Field test on ventilation performance for high level water collecting wet cooling tower under crosswind conditions. Appl. Therm. Eng. 2018, 133, 439–445. [Google Scholar] [CrossRef]
- Zhang, Z.; Gao, M.; Wang, M.; Guan, H.; Dang, Z.; He, S.; Sun, F. Field test study on thermal and ventilation performance for natural draft wet cooling tower after structural improvement. Appl. Therm. Eng. 2019, 155, 305–312. [Google Scholar] [CrossRef]
- Zhang, Z.; Wang, M.; Liu, Y.; Gao, M.; He, S.; Shi, Y. An exploratory research on performance improvement of super-large natural draft wet cooling tower based on the reconstructed dry-wet hybrid rain zone, part 2: Crosswind effects. Int. J. Heat Mass Transf. 2020, 160, 120225. [Google Scholar] [CrossRef]
- Dang, Z.; Zhang, Z.; Gao, M.; He, S. Numerical simulation of thermal performance for super large-scale wet cooling tower equipped with an axial fan. Int. J. Heat Mass Transf. 2019, 135, 220–234. [Google Scholar] [CrossRef]
- Zhou, Y.; Gao, M.; Long, G.; Zhang, Z.; Dang, Z.; He, S.; Sun, F. Experimental study regarding the effects of forced ventilation on the thermal performance for super-large natural draft wet cooling towers. Appl. Therm. Eng. 2019, 155, 40–48. [Google Scholar] [CrossRef]
- Chen, X.; Sun, F.; Chen, Y.; Gao, M. New retrofit method to improve the thermal performance of natural draft wet cooling towers based on the reconstruction of the aerodynamic field. Int. J. Heat Mass Transf. 2019, 132, 671–680. [Google Scholar] [CrossRef]
- Chen, X.; Sun, F.; Chen, Y.; Gao, M. Novel method for improving the cooling performance of natural draft wet cooling towers. Appl. Therm. Eng. 2019, 147, 562–570. [Google Scholar] [CrossRef]
- Zhou, Y.; Wang, K.; Gao, M.; Dang, Z.; He, S.; Sun, F. Experimental study on the drag characteristic and non-uniform fillings for wet cooling towers under thermal performance of crosswind conditions. Appl. Therm. Eng. 2018, 140, 398–405. [Google Scholar] [CrossRef]
- Gao, M.; Guo, C.; Ma, C.; Shi, Y.; Sun, F. Thermal Performance for Wet Cooling Tower with Different Layout Patterns of Fillings under Typical Crosswind Conditions. Energies 2017, 10, 65. [Google Scholar] [CrossRef] [Green Version]
- Lyu, D.; Sun, F.; Zhao, Y. Impact mechanism of different fill layout patterns on the cooling performance of the wet cooling tower with water collecting devices. Appl. Therm. Eng. 2017, 110, 1389–1400. [Google Scholar] [CrossRef]
- Eldredge, T.V.; Benton, D.J.; Hodgson, J.W. An investigation of the effects of flue gas injection on natural draft cooling tower performance. J. Eng. Gas Turbines Power-Trans. ASME 1997, 119, 478–484. [Google Scholar] [CrossRef]
- Han, Q.; Liu, D.Y.; Chen, F.S.; Yang, Z. The energy-saving benefit and economic evaluation analysis of cooling tower with flue gas injection. In Proceedings of the 2009 International Conference on Sustainable Power Generation and Supply, Nanjing, China, 6–7 April 2009; p. 2249. [Google Scholar]
- Harte, R.; Kratzig, W.B. Large-scale cooling towers as part of an efficient and cleaner energy generating technology. Thin-Walled Struct. 2002, 40, 651–664. [Google Scholar] [CrossRef]
- Launder, B.E.; Spalding, D.B. Lectures in Mathematical Models of Turbulence; Academic Press: Cambridge, MA, USA, 1972; pp. 157–162. Available online: https://agris.fao.org/agris-search/search.do?recordID=US201300492578 (accessed on 28 September 2021).
- Williamson, N.; Armfield, S.; Behnia, M. Numerical simulation of flow in a natural draft wet cooling tower The effect of radial thermofluid fields. Appl. Therm. Eng. 2008, 28, 178–189. [Google Scholar] [CrossRef]
- Hall, N.A. Technical thermodynamics: Fran Bonjakovi, Holt, Rinehart and Winston, New York, 1965, 524 pp. Pergamon 1966, 9, 993. Available online: https://www.webofscience.com/wos/alldb/full-record/INSPEC:481758 (accessed on 28 September 2021).
- Zhang, Z.; Gao, M.; Dang, Z.; He, S.; Sun, F. An exploratory research on performance improvement of super-large natural draft wet cooling tower based on the reconstructed dry-wet hybrid rain zone. Int. J. Heat Mass Transf. 2019, 142, 118465. [Google Scholar] [CrossRef]
- Dong, H.; Wan, D.; Liu, M.; Chen, T.; Gao, S.; Zhao, Y. Evaluation of the Hot Air Recirculation Effect and Relevant Empirical Formulae Applicability for Mechanical Draft Wet Cooling Towers. Energies 2020, 13, 3347. [Google Scholar] [CrossRef]
- Zhao, Z. Cooling Tower; Chinese Water and Electricity Press: Beijing, China, 1994. (In Chinese) [Google Scholar]


Publisher’s Note: MDPI stays neutral with regard to jurisdictional claims in published maps and institutional affiliations. |
© 2021 by the authors. Licensee MDPI, Basel, Switzerland. This article is an open access article distributed under the terms and conditions of the Creative Commons Attribution (CC BY) license (https://creativecommons.org/licenses/by/4.0/).