1. Introduction
Aircraft with advanced electric drives represent a green solution that can reduce fuel consumption and greenhouse gas emissions, thanks to lower weight, low maintenance, and higher conversion efficiency than mechanical, hydraulic, and pneumatic systems. This transition is possible thanks to reliable and high-efficiency power converters, which allow power loss reduction, leading to higher power density, lower weight, and lower volumes. Compliance with existing international standards guarantees the adoption of power converters with acceptable values of total harmonic distortion (THD), power factor (PF), and DC output ripple, leading to increasingly reliable systems. High-harmonic components in currents and voltages and a high ripple rate in DC output voltages may result in resonances overvoltages and other problems of electromagnetic compatibility inside the onboard electrical systems [
1].
The application of a CTU as an AC–DC converter represents the most used solution, even if it may not always meet the quality standard requirements in terms of input current THD and output voltage ripple [
2]. Lower current harmonic content and higher power factor are achieved by using interphase transformers and impedance-matching inductors, which, in contrast, result in increased complexity, volume, weight, and cost [
3]. Moreover, these components may suffer from detuning [
3,
4,
5,
6,
7,
8,
9]. To improve the quality standards and reduce the overall size, AC–DC converters having a higher pulse number have been proposed [
1,
2,
3]. Recently, several authors have investigated solutions based on the use of autotransformers, indicating their possible advantages and suggesting these solutions as alternatives to the use of CTUs [
10,
11,
12,
13,
14]. In the proposed autotransformer-based solution, the windings are interconnected such that the apparent power transmitted by the actual magnetic coupling is only a portion of the total apparent power [
14]. The reduced apparent power rating makes the autotransformer-based solution smaller and less costly and lets it operate at a higher efficiency than the conventional transformer-based solution [
15]. This reduces the system weight and volume and seems to increase the overall reliability, capability, and maintainability; finally, it seems to provide higher durability for aircraft operations [
16,
17].
In this paper, an 800 Hz/2 kW 12-pulse ATU is investigated and designed, and its performance is compared with that of a CTU of the same frequency and power rate. The CTU solution is based on a Δ–ΔY transformer and two diode bridges connected in series. The ATU solution has two diode bridges in parallel.
The standards of reference used in the regulation of aircraft power supplies are CEN-EN 2282 [
18], ISO 1540 [
19], IEEE-1531-2020 [
20], and RTCA DO-160 [
21]. In this paper, the RTCA DO-160 standard has been considered, since it is the most referenced standard.
The IEEE-1531 standard recommends a limit of 8% on the THD of AC current and 5% on the THD of voltage at input AC mains [
20]. The RTCA DO-160 standard indicates different maximum THD rates, depending on the device category [
21].
The two configurations examined in the paper are designed for the typical avionic 115 RMS AC input voltage and 270 V output voltage. The design is made via a coupled FEM-circuital analysis. The resulting nominal parameters of the designed solutions, including their size and weight, are obtained and indicated.
As indicated by RTCA DO-160, several tests are simulated on both the CTU and the ATU to assess their compliance with this standard. In particular, four tests are simulated: (1) AC input current distortion test, (2) AC power factor test, (3) DC output voltage ripple test, and (4) phase unbalance test.
In addition to compliance with the standards, an accurate analysis of AC–DC conversion efficiency and power losses is carried out. Finally, a comparison of the CTU and ATU in terms of size, weight, and converter performance is illustrated.
The paper is organized as follows. In
Section 2, the architecture and design of the CTU and ATU 12-pulse rectifier solutions are presented and discussed, including the FEM-circuital approach. In
Section 3, the main features of the RTCA DO-160 standard are described. The AC current distortion, power factor, DC output voltage, and phase unbalance are evaluated through the simulation of the tests indicated by the standard in
Section 4,
Section 5,
Section 6 and
Section 7, respectively. Starting from the obtained results, a comparison between the two topologies is discussed in
Section 8. Finally, some concluding remarks are provided in
Section 9.
2. Twelve-Pulse AC/DC Configurations
2.1. Conventional 12-Pulse Unit Design
As shown in
Figure 1a, the CTU was fed from a three-phase transformer with a Δ-connected primary winding and two secondary windings (one is Δ connected, and the other is Y connected). The magnetic core with the primary and secondary winding arrangement is shown in
Figure 1b. Each secondary winding was connected to a three-phase, six-pulse diode bridge. The two bridges were connected in series to form a 12-pulse rectifier. The output voltage was usually connected to a DC load, such as batteries or a supercapacitor, which allowed increasing the power density, reducing weight [
22]. As shown in
Figure 1c, this configuration produced a 30° phase shift between the voltage phasors of the two bridges, and this resulted in a 12-pulse per cycle output voltage [
23].
The 12-pulse AC–DC converter must be suitable to operate with the design constraints shown in
Table 1.
It was designed according to the following steps:
- (1)
Design of the number of turns of the windings to achieve the desired secondary no-load voltages
- (2)
Definition of the magnetic core cross section according to the maximum value of the working magnetic induction allowed
- (3)
Estimation of the maximum value of the currents in the windings
- (4)
Definition of the wire sections of the conductors
- (5)
Calculation of the resistances and the self and mutual inductances of the windings
- (6)
Definition of the size of the windings and the magnetic core
The design procedure was recursively run, considering at that stage a linear behavior of the magnetic material.
This first stage resulted in the output characteristics shown in
Table 2.
The magnetic core material used in the design was a stacking iron-based Metglas
® amorphous alloy [
24]. To check the previous approximated computation of the magnetic induction and that of the magnetic inductances in the magnetic coupling coefficients between the windings, a finite element analysis (FEA) was performed by using a code developed by the authors [
25,
26,
27,
28]. In particular, a 2D analysis was performed by assuming a linear behavior of the material (constant value of the magnetic permittivity, equal to the value measured at the working magnetic induction) and a current-driven formulation of the problem. A full three-phase current system was used for the excitations, and the coupling coefficient was computed by considering the effective winding geometry. The aim of this simulation was to compute both the coupling coefficient and the maximum value of the magnetic induction in real operating conditions. The mesh discretization of the magnetic core and a close-up of the air gap region are shown in
Figure 2. To compute the coupling coefficient, a postprocessing of the FEA solution was performed by evaluating the linked flux in different parts of the section surrounded by the windings. The coupling coefficient estimated was about
k = 0.98, while the maximum value of magnetic induction (RMS value) was about
BRMS = 0.85 T. The field vectors are shown in
Figure 3 at the maximum value of magnetic induction.
2.2. Autotransformer 12-Pulse Unit Design
Figure 4a shows the ATU electrical circuit. It consists of a Δ-connected autotransformer with secondary windings connected to two three-phase diode bridge rectifiers; these two bridges were connected in parallel with the load. The winding representation and the voltage phasor diagram of the proposed Δ-type autotransformer are shown in
Figure 4b,c, respectively.
The transformer phase-shifting angle was equal to 30°, the winding configuration of the ATU resulted in the lowest apparent power rating [
3], and the size of the magnetic component reduced [
10] under this condition. As described in [
12,
29], the proposed autotransformer achieved the simplest winding configuration when the angle was 30° (±15°). To produce a 30° phase shift between the two sets of secondary windings, the winding turn ratio should be
The phasors of the voltages produced by the autotransformer
VA1,
VB1, and
VC1 were at +15° with respect to the supply voltages
VR,
VS, and
VT, while the other set of the phasors of the voltages
VA2,
VB2, and
VC2 were at −15° with respect to supply voltages, resulting in a 12-pulse rectification [
9,
30,
31]. The magnitudes of the secondary line voltages (
VA1,
VB1, and
VC1 and (
VA2,
VB2, and
VC2) should be equal to each other to result in a symmetrical system and to reduce the ripple in output DC voltage [
11,
12,
13,
14,
15,
16,
17,
18,
19,
20,
21,
22,
23,
24,
25,
26,
27,
28,
29,
30,
31,
32].
A two-step design of the ATU, requiring the same procedure described in the previous section for the CTU, was carried out. The final parameters of the designed ATU device are reported in
Table 3.
According to the previous FEA, a coupling coefficient of kps = 0.98 between the primary and the secondary and a coupling coefficient kss = 0.96 between the two secondaries were estimated.
An additional filter constituted by Δ-connected capacitors was added to the system to reduce the input current THD. The IEEE 1531-2003 standard [
20] was used to size the capacitors. To determine the value of each capacitor, the required reactive power for the system
Q was first determined through the simulation and then the capacitance was calculated according to [
33]
where
f is the fundamental frequency of the current,
Vi is the RMS value of the line voltage, and
Q is the required reactive power. By using the power measurements Matlab’s block, a reactive power
Q of about 1700 VAR was estimated, leading to a filtering capacitor
Cf = 13 µF. To reduce the THD, three filtering capacitors Δ-connected with a value C
f =25 µF were finally chosen.
3. Application of RTCA DO-160G Standard Tests
From RTCA DO-160G, the equipment intended for use on aircraft electrical systems where the primary power is supplied through an AC system with a frequency in the range of 360–800 Hz was designated as A(WF). Regarding the DC side, if the output was 270 V, the systems were designated with the letter D. Therefore, the systems studied in this paper were classified as A(WF)-D. This information is required to properly select tests that must be performed on the rectifiers to check the required compliance of the system. In addition to the tests required from RTCA DO-160G, an accurate evaluation of the conversion efficiency of the system was carried out, properly analyzing the power losses.
During the analysis, a line inductance Ls = 0.1 mH was assumed to be connected in series to the three-phase voltage sources to take into account the electrical power supply system upstream of the device.
The same diode was used in the CTU and ATU rectifiers, with a forward voltage
VF = 0.6 V and a conduction resistance
rON = 0.1 Ω. The performance of each rectifier was evaluated for three different load resistances,
RL1 = 37 Ω,
RL2 = 74 Ω, and
RL3 = 148 Ω, called here heavy load, intermediate load, and light load resistances, respectively, which represent, approximatively, a working condition at 100%, 50%, and 20% of the nominal power, respectively. These working conditions are summarized in
Table 4.
As requested from the RTCA DO-160G standard, the following parameters must be evaluated.
The output voltage ripple Δ
Vo was evaluated under the three different operating conditions and calculated as
The total harmonic distortion (THD) of the input current was calculated as
where
I1 is the amplitude of the fundamental current harmonic and
I2,
I3, …,
IN are the amplitudes of the second, third, …,
N-th current harmonic, respectively.
The power factor (PF) was also evaluated by using
where
φ1 is the displacement angle between the fundamental components of the input current and voltage.
Another parameter of primary importance is the AC–DC conversion efficiency. As known, it can be calculated as η = Po/Pi with Po = Vo∙Io and Pi = Po + Ploss.
The power losses can be assumed to be constituted by two main contributions as
where
PD is the loss due to the rectifier and it is strictly related to the characteristics of the diodes. It can be calculated as
where
ID,RMS and
ID,AVG are the RSM and average current flowing through the diode, respectively. The average and RMS value of the current were calculated on Simulink, measuring the current flowing through each diode and then computing the power loss using Equation (7).
PTRF is the transformer power loss and can be divided into two contributions
where
PCu is the ohmic loss due to the copper windings and is calculated as
while
PCore is the magnetic core loss given by
From the datasheet of the Metglas
® alloy 2605SA1, the values of the parameters for this material were
α = 1.51,
β = 1.74, and
Cm = 6.5 [
25].
4. AC Current Distortion Test
In this section, the AC current distortion for both the CTU and the ATU are evaluated by using the procedure provided by the RTCA DO-160 standard.
This test must be performed for AC equipment with a maximum power consumption larger than 35 VA. The first 40th harmonics are required to satisfy the individual current harmonic limits, as shown in
Table 5.
From the RTCA DO-160G standard, the current distortion must be evaluated under two operating conditions:
When the circuit is supplied with a voltage waveform with THD
V < 1.25%. In this case, the equipment will not demand harmonic current components above the limits shown in
Table 5.
When the circuit is supplied with a distorted voltage waveform THD
V > 1.25%. The equipment will not demand a harmonic current greater than 1.25% above the limits already specified in
Table 5 for every 1% of distortion in the corresponding individual voltage harmonic.
The two waveforms used to perform test A and test B are shown in
Figure 5a,b, respectively. In particular, test A was simulated assuming a three-phase voltage with THD
V = 0%, while test B was simulated assuming THD
V = 10% with equal RMS values of the third, fifth, and seventh harmonics.
Next are summarized the results obtained for the simulated tests on both the CTU and the ATU.
4.1. CTU Current Distortion Evaluation
The input currents
ia when the system was supplied with the voltage shown in
Figure 5a,b are shown in
Figure 6a,b, respectively.
The CTU harmonic current components under tests A and B are summarized in
Table 6. The amplitude of the primary harmonic (order
H1 in the table) at
f = 800 Hz was
IH1 = 8.4 A. Each harmonic value was expressed as a percentage of the amplitude of the primary harmonic.
As can be seen from
Table 6, the simulation indicated that the limits of the standards were respected for both tests A and B.
Therefore, it was indicated by the simulation results that the designed CTU complies with the current harmonic limits.
4.2. ATU Current Distortion Evaluation
The ATU harmonic current components under tests A and B are summarized in
Table 7. The amplitude of the primary harmonic (order
H1) at
f = 800 Hz was
IH1 = 9.6 A. Each higher-order harmonic was expressed as a percentage of the amplitude of the primary harmonic.
As can be seen from
Table 6, the simulations that indicated the limits of the standards were respected for both tests A and B.
The input currents
ia when the system was supplied with the voltage shown in
Figure 5a,b are shown in
Figure 7a,b, respectively.
In addition, for the ATU, the test simulations indicated that the input current harmonic content allows satisfying the standard limits.
5. AC Power Factor Test
Another test required by RTCA DO-160G is the AC power factor test. The power factor, defined as in Equation (5), will be equal to or higher than the values listed in
Table 8.
Since the proposed 12-pulse rectifiers were characterized by a 2 kW nominal load power and they were seen as ohmic-inductive loads by the source, a lagging power factor PF > 0.8 was required to comply with the standard requirement.
5.1. CTU Power Factor Test Results
The THD of the line currents and the PF computed under different load conditions are summarized in
Table 9.
The simulations indicated that the PF was always higher than the limit defined by the standard PF > 0.8 for all the load conditions examined. The presence of resistive-inductive loads seemed to not affect the converter behavior.
5.2. ATU Power Factor Test Results
The THD of the input line current and the PF values, calculated in analogy with the case of the CTU, are summarized in
Table 10.
In addition, for the ATU case, the PF computed was always higher than the limits specified by the standard, and it can be concluded that both AC–DC converters comply with the standard requirements.
6. DC Current Ripple Test
The output voltage of a 12-pulse rectifier is characterized by a DC component plus a fundamental AC component with a frequency 12 times higher than that of the AC line, plus higher-order harmonics. The RTCA DO-160G standard establishes amplitude limits for different frequency contents. Thus, the harmonic content of the output voltage was analyzed to evaluate whether the two converters meet the standard limits.
6.1. CTU Output Voltage Ripple Results
The waveforms of the output voltage computed under nominal conditions are shown in
Figure 8.
To evaluate whether the standard limits are respected, the first 20 voltage harmonics (fundamental frequency
f0 = 800 Hz) were evaluated at different load levels, as shown in
Table 11.
The average output voltage
Voavg and the ripple
Voripple are indicated in
Table 12. Simulated results indicated that the voltage amplitudes values were only marginally affected by the load, even when it was ohmic-inductive.
6.2. ATU Output Voltage Ripple Results
In
Figure 9, the output voltages for different loads are shown; the average output voltage
Voavg and the ripple
Voripple are summarized in
Table 13.
The first 20 harmonics of the output voltage are reported in
Table 14.
The output voltage harmonic contents computed for the CTU and ATU are shown in
Figure 10. Both solutions maintained the harmonic content inside the allowable standard limits.
7. Phase Unbalance Test
The RTCA DO-160G standard requires the evaluation of the effects of phase unbalances. The unbalance includes unequal voltage magnitudes at the fundamental system frequency, fundamental phase angle deviation, and unequal levels of harmonic distortion between the phases. A major cause of voltage unbalance is the asymmetry of the loads, if the loads are not uniformly shared among the three phases. The input voltage waveforms shown in
Figure 11 has been used to reproduce the unbalanced operating condition.
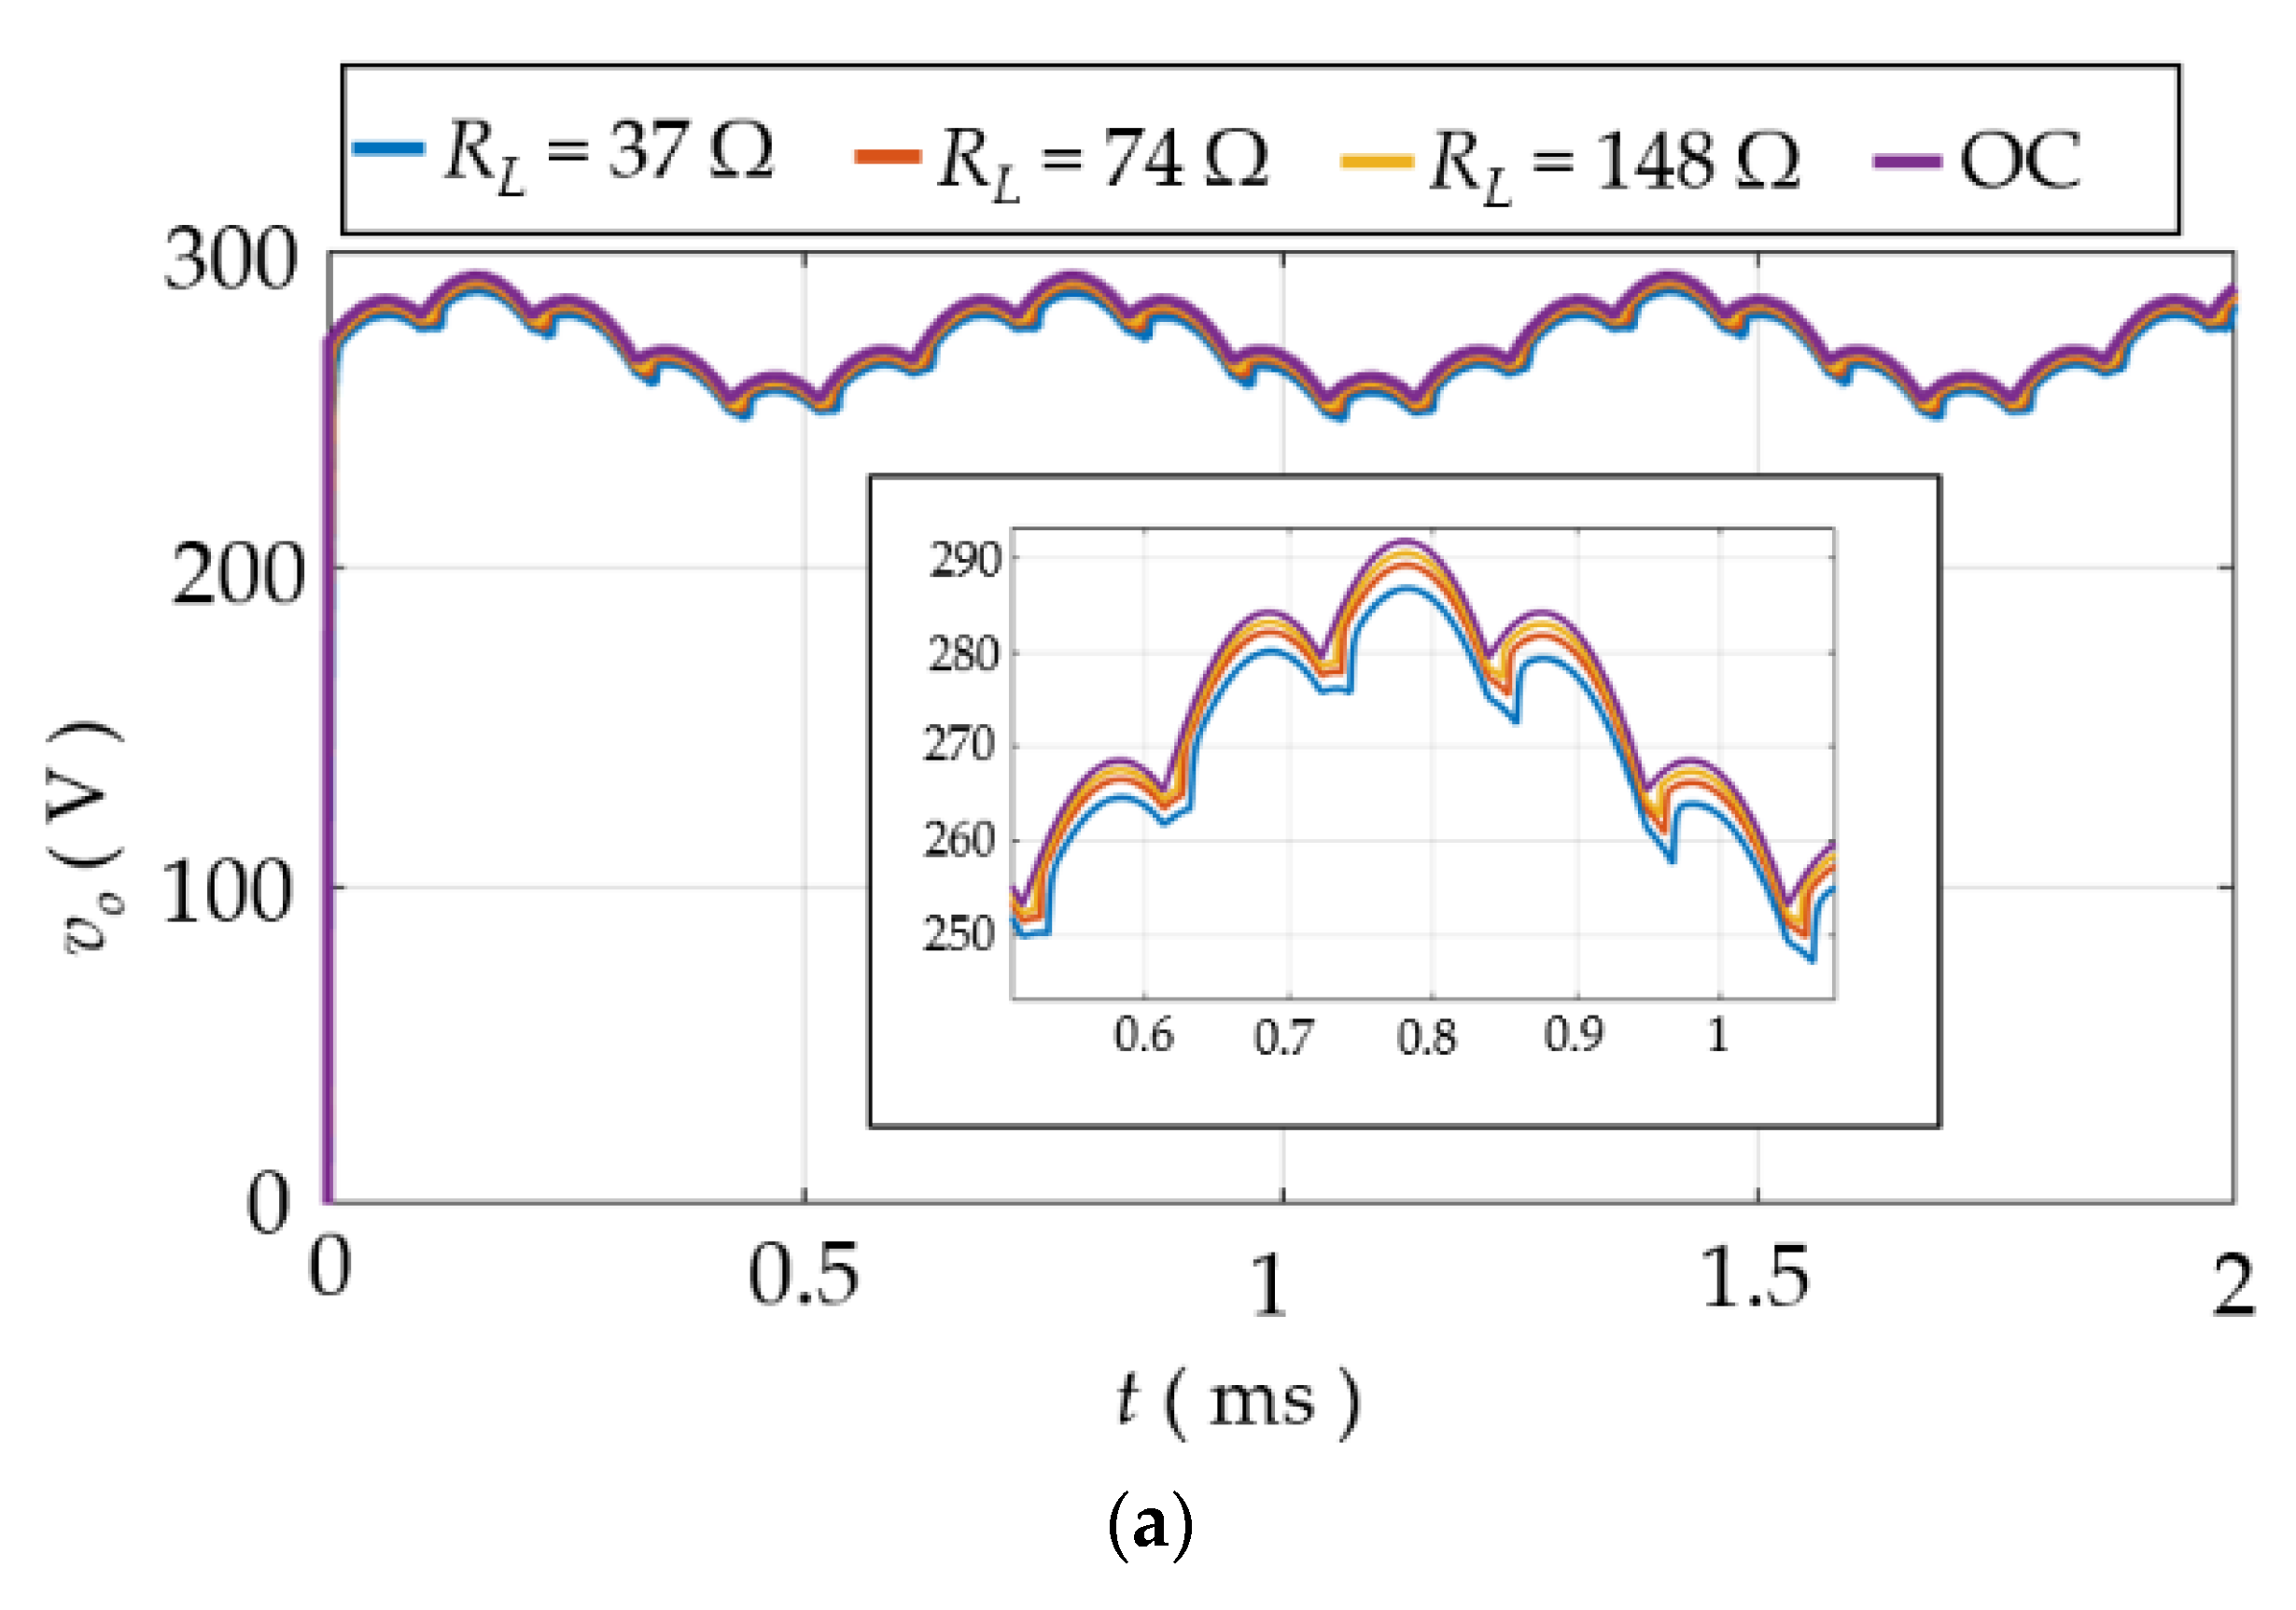
7.1. CTU under Unbalanced Input Voltage
In
Figure 12a, the output voltages
vo computed under unbalanced voltage conditions for different loads are shown. The related output voltage ripples are indicated in
Table 15.
The input current computed is shown in
Figure 12b. The THD of the line currents and the PF for different loads are indicated in
Table 16.
Simulations indicated that there is an inversely proportional relationship between the THD of the input line current and the output load power, while the power factor changed from 0.86% at 10% of the load to 0.65 at full load. Finally,
Figure 12c shows that independent from the load conditions, the magnetic flux density
B(t) was sinusoidal, as expected, with an RMS value
BRMS = 0.58 T.
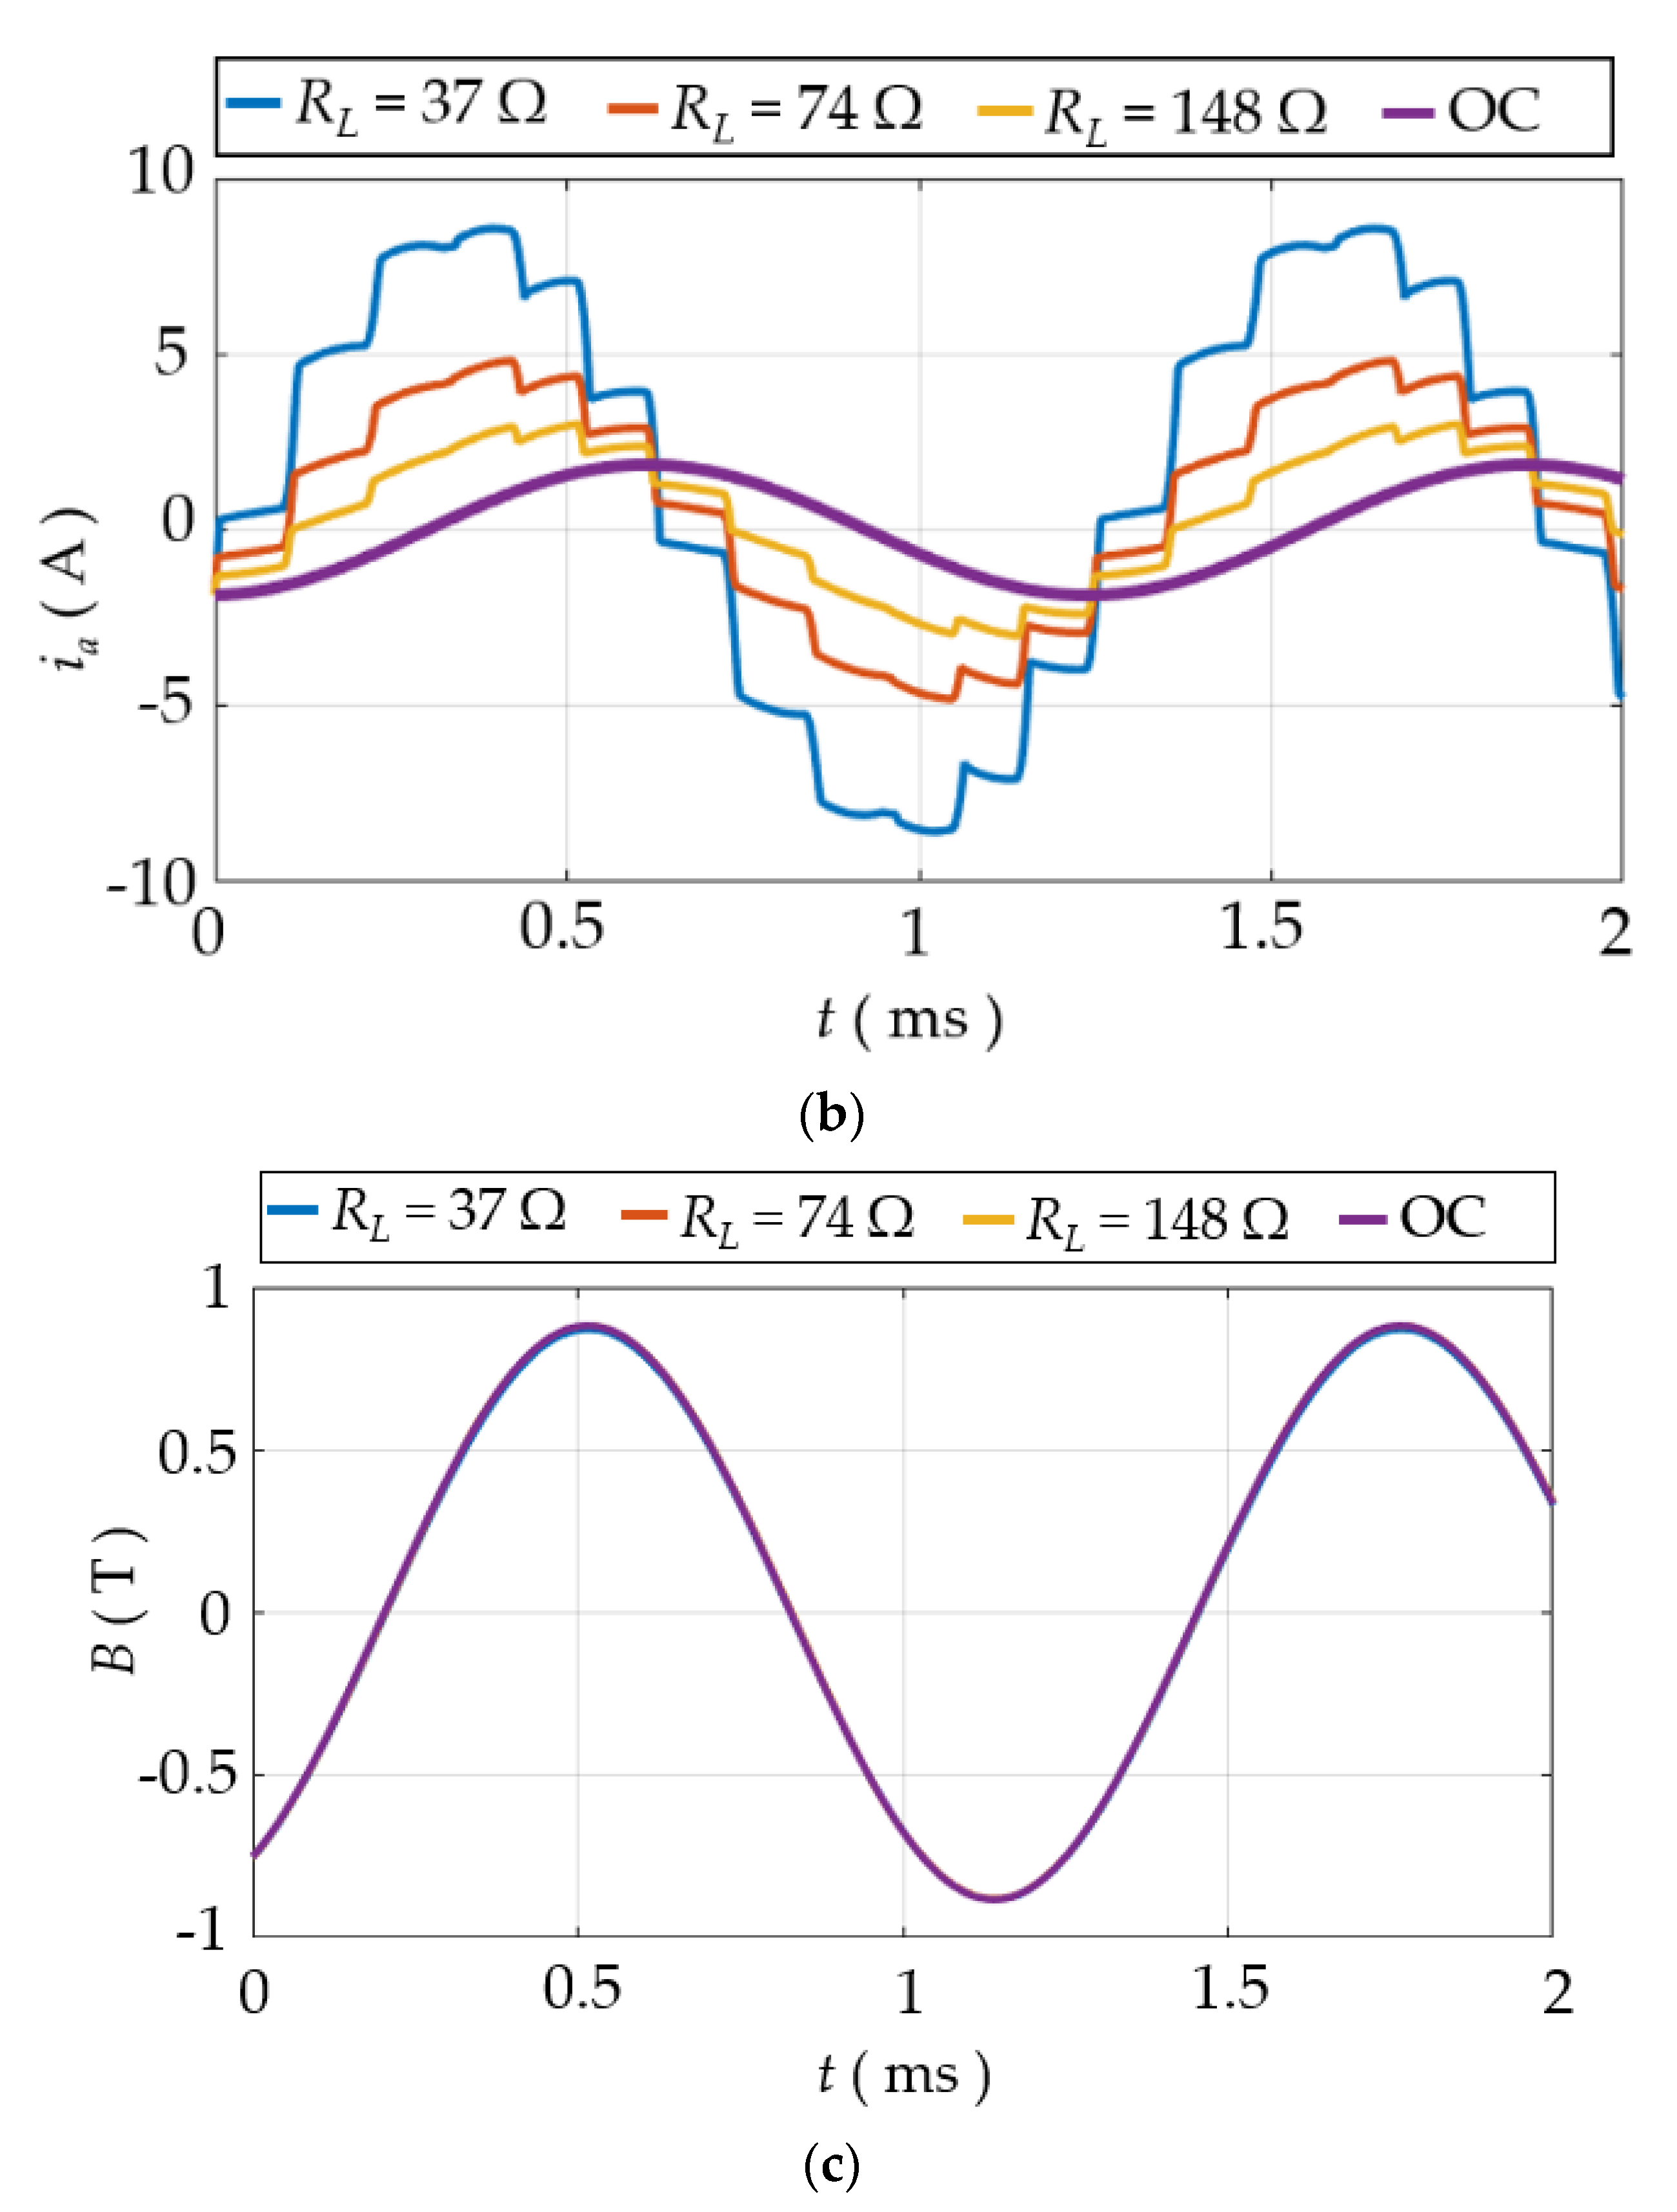
7.2. ATU under Unbalanced Input Voltage
Figure 13a shows the output voltages
vo of the ATU computed for different loads. The average output voltage
Voavg and the ripple
Voripple are summarized in
Table 17.
The input current is plotted in
Figure 13b. The THD of the line currents and the PF for different loads are indicated in
Table 18.
As in the case of the CTU,
Figure 13c indicates that independent from the load conditions, the magnetic flux density
B(
t) was sinusoidal, as expected, with an RMS value
BRMS = 0.58 T.
8. Final CTU and ATU Comparison
Figure 14 shows the comparison between the estimated CTU and ATU conversion efficiency under different load conditions. The AC–DC conversion efficiency evaluated as in
Section 3 was always higher than 95% under all the considered operating conditions and for both the analyzed solutions. Simulations indicated that the ATU has higher efficiency than the CTU under heavy load conditions (i.e.,
RL = 37 Ω and
RL =74 Ω), while the ATU efficiency is comparable with the CTU’s under lighter load conditions (
RL3 = 148 Ω).
The power loss contributions at different loads were analyzed for each converter, and results are summarized in
Figure 15. The copper losses
PCu, the core loss P
Core, and the diode rectifier losses
PD were separately computed. The three power loss contributions for the CTU are shown in
Figure 15a. The core loss was the higher contribution, independent from the operating conditions. As expected, the diode loss and the winding loss decreased under a lighter load condition. The copper loss always represents the lowest contribution.
In
Figure 15b, in analogy, the different ATU-related power loss contributions are shown. In this case, the simulations indicated that the diode losses were higher than in the case of the CTU, independent from the load condition, as expected, in consideration that the two diode bridges were in series for the ATU and in parallel for the CTU. The diode losses and winding losses decreased according to the load current. The core losses, as expected, were almost constant and independent from the different load conditions.
In
Figure 16, the comparison of the input current THDs predicted by the simulations by using the CTU and ATU is shown. Both the CTU and the ATU allowed meeting the standard requirements under the whole operating conditions, ensuring a THD lower than the threshold value THD
max = 8%. Thanks to the input capacitive filter, the THD of the ATU was always lower than in the case of the CTU and <2%.
The obtained results for the two topologies are summarized in
Table 19.
9. Conclusions
This paper describes the design and modeling of two different AC–DC 12-pulse rectifiers, here named CTU and ATU. These devices are suitable for both terrestrial and aircraft applications. The parameters considered for the comparison of the performance of the CTU and the ATU are the conversion efficiency, output voltage, and input current THD in view of the RTCA DO-160 standard requirements. The comparison was performed by suitable numerical simulations made by a coupled FEM-circuital approach and considering variable load conditions up to the nominal power. Both pure resistive and inductive-resistive loads were considered.
Based on the simulation results, either the CTU or the ATU solutions comply with the standard requirements and limits and have a high conversion efficiency (more than 96%).
Results of the simulations indicate also that the ATU solution allows for a significant reduction in weight (more than 50% in the case study) and for an appreciable increase in efficiency (2% at nominal current) with respect to the CTU solution. However, the ATU solution needs an additional input capacitive filter, which, anyway, does not change substantially the gain in weight and size obtained and, in addition, greatly reduces the THD with respect to the case of the CTU solution and is under 2%.
Another important difference between the two topologies is that the CTU, differently from the ATU solution, allows for galvanic isolation between primary and secondary.
As future development, other 12-pulse topologies will be compared with ATU and CTU systems. The effect of the non-linearities on the magnetic core will be analyzed and techniques able to reduce copper and diode losses will be studied. Experimental validation of the obtained results will be performed.
Author Contributions
Conceptualization, E.C. and F.C.; methodology, E.C., F.C., and A.L.; software, F.C. and A.H.S.; validation, F.C., A.H.S., and A.L.; formal analysis, E.C., A.L., and F.C.; investigation, E.C., F.C., and A.L.; data curation, A.H.S.; writing—original draft preparation, F.C. and A.H.S.; writing—review and editing, F.C. and A.H.S.; supervision, E.C. and A.L. All authors have read and agreed to the published version of the manuscript.
Funding
This research received no external funding.
Conflicts of Interest
The authors declare no conflict of interest.
References
- Khan, S.; Zhang, X.; Saad, M.; Ali, H.; Khan, B.M.; Zaman, H. Comparative analysis of 18-pulse autotransformer rectifier unit topologies with intrinsic harmonic current cancellation. Energies 2018, 11, 1347. [Google Scholar] [CrossRef] [Green Version]
- Singh, B.; Gairola, S.; Chandra, A.; Al-Haddad, K. Power quality improvements in isolated twelve-pulse AC-DC converters using delta/double-polygon transformer. In Proceedings of the 2007 IEEE Power Electronics Specialists Conference, Orlando, FL, USA, 17–21 June 2007; pp. 2848–2853. [Google Scholar]
- Singh, B.; Bhuvaneswari, G.; Garg, V. Harmonic mitigation using 12-pulse AC-DC converter in vector-controlled induction motor drives. IEEE Trans. Power Deliv. 2006, 21, 1483–1492. [Google Scholar] [CrossRef]
- Luchetta, A.; Manetti, S.; Piccirilli, M.C.; Reatti, A.; Corti, F.; Catelani, M.; Ciani, L.; Kazimierczuk, M.K. MLMVNNN for Parameter Fault Detection in PWM DC–DC Converters and Its Applications for Buck and Boost DC–DC Converters. IEEE Trans. Instrum. Meas. 2019, 68, 439–449. [Google Scholar] [CrossRef]
- Ayachit, A.; Reatti, A.; Kazimierczuk, M.K. Magnetising inductance of multiple-output flyback dc–dc convertor for discontinuous-conduction mode. IET Power Electron. 2017, 10, 451–461. [Google Scholar] [CrossRef] [Green Version]
- Saini, D.K.; Ayachit, A.; Reatti, A.; Kazimierczuk, M.K. Analysis and Design of Choke Inductors for Switched-Mode Power. Inverters IEEE Trans. Ind. Electron. 2017, 65, 2234–2244. [Google Scholar] [CrossRef] [Green Version]
- Faba, A.; Rimal, H.P. Robust Lightning Indirect Effect Protection in Avionic Diagnostics: Combining Inductive Blocking Devices with Metal Oxide Varistors. IEEE Trans. Ind. Electron. 2018, 65, 6457–6467. [Google Scholar] [CrossRef]
- Faba, A.; Gaiotto, S.; Lozito, G.M. A novel technique for online monitoring of photovoltaic devices degradation. Sol. Energy 2017, 158, 520–527. [Google Scholar] [CrossRef]
- Mussolin, L.; Bertucci, B.; Faba, A.; Ambrosi, G.; Scolieri, G.; Tissi, F.; Gaggiotti, M.; Morelli, G.; Zhang, Z.; Koutsenko, V. Overview of the mechanical, thermal vacuum and EMI/EMC tests performed for the AMS-02 UTTPS space qualification campaign. In Proceedings of the 20th IEEE Mediterranean Electrotechnical Conference, MELECON 2020-Proceedings, Palermo, Italy, 16–18 June 2020; pp. 130–135. [Google Scholar]
- Meng, F.; Gao, L.; Yang, S.; Yang, W. Effect of phase-shift angle on a delta-connected autotransformer applied to a 12-pulse rectifier. IEEE Trans. Ind. Electron. 2015, 62, 4678–4690. [Google Scholar] [CrossRef]
- Lian, Y.; Yang, S.; Ben, H.; Yang, W. A 36-pulse diode rectifier with an unconventional interphase reactor. Energies 2019, 12, 820. [Google Scholar] [CrossRef] [Green Version]
- Meng, F.; Yang, W.; Yang, S. Effect of voltage transformation ratio on the kilovoltampere rating of delta-connected autotransformer for 12-pulse rectifier system. IEEE Trans. Ind. Electron. 2012, 60, 3579–3588. [Google Scholar] [CrossRef]
- Choi, S.; Lee, B.S.; Enjeti, P. New 24-pulse diode rectifier systems for utility interface of high-power AC motor drives. IEEE Trans. Ind. Appl. 1997, 33, 531–541. [Google Scholar] [CrossRef]
- Choi, S.; Enjeti, P.N.; Pitel, I.J. Polyphase transformer arrangements with reduced kVA capacities for harmonic current reduction in rectifier-type utility interface. IEEE Trans. Power Electron. 1996, 11, 680–690. [Google Scholar] [CrossRef]
- Yang, T.; Bozhko, S.; Wheeler, P.; Wang, S.; Wu, S. Generic functional modelling of multi-pulse auto-transformer rectifier units for more-electric aircraft applications. Chin. J. Aeronaut. 2018, 31, 883–891. [Google Scholar] [CrossRef]
- Uan-Zo-li, A.; Burgos, R.; Wang, F.; Boroyevich, D.; Lacaux, F.; Tardy, A. Comparison of prospective topologies for aircraft autotransformer-rectifier units. In Proceedings of the IECON’03. 29th Annual Conference of the IEEE Industrial Electronics Society (IEEE Cat. No. 03CH37468), Roanoke, VA, USA, 2–6 November 2003; Volume 2, pp. 1122–1127. [Google Scholar]
- Catelani, M.; Ciani, L.; Reatti, A. Critical components test and reliability issues for photovoltaic inverter. In Proceedings of the 20th IMEKO TC4 Symposium on Measurements of Electrical Quantities: Research on Electrical and Electronic Measurement for the Economic Upturn Together with 18th TC4 International Workshop on ADC and DCA Modeling and Testing IWADC 2014, Benevento, Italy, 15–17 September 2014; pp. 592–596. [Google Scholar]
- CEN EN 2282:1992. Aerospace Series–Characteristics of Aircraft Electrical Supplies. Ed: European Committee for Standardization. 1992. Available online: http://store.uni.com/catalogo/en-2282-1992 (accessed on 1 October 2021).
- International Organization for Standardization. Aerospace—Characteristics of Aircraft Electrical Systems (ISO Standard No. 1540:2006). Available online: https://www.iso.org/standard/42067.html (accessed on 1 October 2021).
- IEEE Guide for Application and Specification of Harmonic Filters. In IEEE Std. 1531-2020, November; IEEE Power Engineering Society, Transmission & Distribution Committee; Available online: https://standards.ieee.org/standard/1531-2020.html (accessed on 1 October 2021).
- RTCA-D0160D. Environmental Conditions and Test Procedures for Airborne Equipment. Ed: International Electrotechnical Commission. 2010. Available online: https://do160.org/rtca-do-160g/ (accessed on 1 October 2021).
- Yedluri, A.K.; Anitha, T.; Kim, H.-J. Fabrication of Hierarchical NiMoO4/NiMoO4 Nanoflowers on Highly Conductive Flexible Nickel Foam Substrate as a Capacitive Electrode Material for Supercapacitors with Enhanced Electrochemical Performance. Energies 2019, 12, 1143. [Google Scholar] [CrossRef] [Green Version]
- Abdollahi, R. Pulse doubling in zigzag–connected autotransformer–based 12–pulse ac–dc converter for power quality improvement. J. Electr. Eng. 2012, 63, 357–364. [Google Scholar] [CrossRef] [Green Version]
- Technical bulletin for the Metglas amorphous Alloy 2605SA1. 2005. Available online: https://metglas.com (accessed on 1 October 2021).
- Cardelli, E.; Faba, A.; Laudani, A.; Antonio, S.Q.; Fulginei, F.R.; Salvini, A. Computer Modeling of Nickel–Iron Alloy in Power Electronics Applications. IEEE Trans. Ind. Electron. 2017, 64, 2494–2501. [Google Scholar] [CrossRef]
- Cardelli, E.; Faba, A.; Laudani, A.; Lozito, G.M.; Antonio, S.Q.; Fulginei, F.R.; Salvini, A. Implementation of the Single Hysteron Model in a Finite-Element Scheme. IEEE Trans. Magn. 2017, 53, 1–4. [Google Scholar] [CrossRef]
- Cardelli, E.; Faba, A.; Laudani, A.; Lozito, G.M.; Fulginei, F.R.; Salvinib, A. Two-dimensional magnetic modeling of ferromagnetic materials by using a neural network based hybrid approach. Phys. B Condens. Matter 2016, 486, 106–110. [Google Scholar] [CrossRef]
- Carcangiu, S.; Cardelli, E.; Faba, A.; Fanni, A.; Montisci, A.; Quondam, S. Moving vector hysteron model identification based on neural network inversion. In Proceedings of the 2016 IEEE 2nd International Forum on Research and Technologies for Society and Industry Leveraging a Better Tomorrow, RTSI, Bologna, Italy, 7–9 September 2016. [Google Scholar]
- Farrugia, D.; Apap, M.; Micallef, A.; Staines, C.S. Analysis of Polygon Connected ATRU for the More-Electric Aircraft. In Proceedings of the 2020 IEEE 20th Mediterranean Electrotechnical Conference (MELECON), Palermo, Italy, 16–18 June 2020; pp. 136–140. [Google Scholar]
- Garg, V.; Singh, B.; Bhuvaneswari, G. 24-pulse ac–dc converter for harmonic mitigation. IET Power Electron. 2009, 2, 364–374. [Google Scholar] [CrossRef]
- Singh, B.; Bhuvaneswari, G.; Garg, V.; Gairola, S. Pulse multiplication in AC-DC converters for harmonic mitigation in vector-controlled induction motor drives. IEEE Trans. Energy Convers. 2006, 21, 342–352. [Google Scholar] [CrossRef]
- Chen, J.; Chen, J. On reducing the shaft torque ripple of small-to-medium-scale wind energy conversion systems using multi-pulse autotransformer rectifier. Energies 2018, 11, 379. [Google Scholar] [CrossRef] [Green Version]
- Das, J.C. Passive filters-potentialities and limitations. IEEE Trans. Ind. Appl. 2019, 40, 232–241. [Google Scholar] [CrossRef]
Figure 1.
Schematic of CTU 12-pulse rectifier. (a) Electrical circuit. (b) Magnetic structure representation. (c) Phasor diagram representation.
Figure 1.
Schematic of CTU 12-pulse rectifier. (a) Electrical circuit. (b) Magnetic structure representation. (c) Phasor diagram representation.
Figure 2.
Mesh of the half section of the magnetic core used in finite element analysis.
Figure 2.
Mesh of the half section of the magnetic core used in finite element analysis.
Figure 3.
Magnetic induction field vector distribution computed by FEA in the air gap region.
Figure 3.
Magnetic induction field vector distribution computed by FEA in the air gap region.
Figure 4.
Schematic of an ATU. (a) Electrical circuit. (b) Structure representation. (c) Voltage phasor representation.
Figure 4.
Schematic of an ATU. (a) Electrical circuit. (b) Structure representation. (c) Voltage phasor representation.
Figure 5.
Input voltage waveforms for the simulated tests. (a) Phase voltage without distortion. (b) Distorted input voltage.
Figure 5.
Input voltage waveforms for the simulated tests. (a) Phase voltage without distortion. (b) Distorted input voltage.
Figure 6.
CTU input current waveforms. (a) Nominal condition. (b) Distorted input voltage.
Figure 6.
CTU input current waveforms. (a) Nominal condition. (b) Distorted input voltage.
Figure 7.
ATU input current waveforms. (a) Nominal condition. (b) Distorted input voltage.
Figure 7.
ATU input current waveforms. (a) Nominal condition. (b) Distorted input voltage.
Figure 8.
CTU output voltage waveforms.
Figure 8.
CTU output voltage waveforms.
Figure 9.
ATU output voltage waveforms.
Figure 9.
ATU output voltage waveforms.
Figure 10.
ATU input current amplitude.
Figure 10.
ATU input current amplitude.
Figure 11.
Typical input voltage waveforms under unbalanced operating conditions.
Figure 11.
Typical input voltage waveforms under unbalanced operating conditions.
Figure 12.
CTU Simulink/FEM simulation of a conventional 12-pulse rectifier. (a) Output voltage. (b) Input current. (c) Magnetic flux density.
Figure 12.
CTU Simulink/FEM simulation of a conventional 12-pulse rectifier. (a) Output voltage. (b) Input current. (c) Magnetic flux density.
Figure 13.
ATU Simulink/FEM simulation of a conventional 12-pulse rectifier. (a) Output voltage. (b) Input current. (c) Magnetic flux density.
Figure 13.
ATU Simulink/FEM simulation of a conventional 12-pulse rectifier. (a) Output voltage. (b) Input current. (c) Magnetic flux density.
Figure 14.
Comparison of AC–DC conversion efficiency computed under different load conditions.
Figure 14.
Comparison of AC–DC conversion efficiency computed under different load conditions.
Figure 15.
Power losses at different loads: The blue line is the winding loss, the red line is the core loss, and the green line is the diode rectifier loss. (a) CTU. (b) ATU.
Figure 15.
Power losses at different loads: The blue line is the winding loss, the red line is the core loss, and the green line is the diode rectifier loss. (a) CTU. (b) ATU.
Figure 16.
Comparison of input current THD at different loads.
Figure 16.
Comparison of input current THD at different loads.
Table 1.
Converter operating conditions.
Table 1.
Converter operating conditions.
| Parameter | Value |
|---|
| RMS phase-to-ground input sinusoidal voltage Vi | 115 V |
| Frequency f | 800 Hz |
| DC output voltage Vo | 270 V |
| Nominal output power Po | 2 kW |
Table 2.
Conventional 12-pulse unit parameters.
Table 2.
Conventional 12-pulse unit parameters.
| Parameter | Value |
|---|
| Primary delta turn copper wire diameter ØND1 | 1.12 mm |
| Secondary delta turn copper wire diameter ØND2 | 1.4 mm |
| Secondary star turn copper wire diameter ØNY2 | 1 mm |
| Number of primary delta turns ND1 | 125 |
| Primary delta turn resistance RD1 | 337 mΩ |
| Number of secondary delta turns ND2 | 64 |
| Secondary delta turn resistance RD2 | 256 mΩ |
| Number of secondary star turns NY2 | 37 |
| Secondary star turn resistance RY2 | 77 mΩ |
| Reluctance (air gap) | 298,040 H−1 |
| Primary delta inductances LD1, LD1a, LD1b, LD1c | 52.4 mH |
| Secondary delta inductances LD2, LD2a, LD2b, LD2c | 13.7 mH |
| Secondary star inductances LY2, LY2a, LY2b, LY2c | 4.6 mH |
| Winding weight MCu | 0.85 kg |
| Core weight MCore | 2.65 kg |
| Cross-sectional core area S | 20 × 30 mm2 |
| Core-filling factor | 0.98 |
Table 3.
Autotransformer 12-pulse rectifier parameters.
Table 3.
Autotransformer 12-pulse rectifier parameters.
| Parameter | Value |
|---|
| Primary turn copper wire diameter ØNp | 0.85 mm |
| Secondary turn copper wire diameter ØNs | 1.25 mm |
| Number of primary turns Np | 110 |
| Primary turn resistance Rp | 504 mΩ |
| Number of secondary turns Ns | 17 |
| Secondary turn resistance Rs | 41.87 mΩ |
| Cross-sectional core area S | 20 × 20 mm2 |
| Winding weight MCu | 0.5 kg |
| Core weight MCore | 1.065 kg |
| Series inductance Lc | 0.5 mH |
| Reluctance (air gap) | 397,890 H−1 |
| Primary inductance Lp | 304 mH |
| Secondary inductance Ls | 72.6 mH |
Table 4.
Converters’ operating conditions.
Table 4.
Converters’ operating conditions.
| Parameter | Value |
|---|
| Diode forward voltage VF | 0.6 V |
| Diode conduction resistance rON | 0.1 Ω |
| Heavy load resistance RL1 | 37 Ω |
| Intermediate load resistance RL2 | 74 Ω |
| Light load resistance RL3 | 148 Ω |
Table 5.
Harmonic limits according to RTCA DO-160.
Table 5.
Harmonic limits according to RTCA DO-160.
| Harmonic Order | Limits |
|---|
| 3, 5, 7 | I3 = I5 = I7 = 0.02·I1 * |
| Odd triplen—9,15,21,27,33,39 | Ih = 0.1·I1/h |
| 11 | I11 = 0.1·I1 |
| 13 | I13 = 0.08·I1 |
| Odd non-triplen—17 and 19 | I17 = I19 = 0.04·I1 |
| Odd non-triplen—23 and 25 | I23 = I25 = 0.03·I1 |
| Odd non-triplen—29, 31, 35, 37 | Ih = 0.3·I1/h |
| Even—2 and 4 | Ih = 0.01·I1/h |
| Even > 4 (6, 8, 10, 12, …, 40) | Ih = 0.0025·I1 |
Table 6.
CTU total harmonic distortion.
Table 6.
CTU total harmonic distortion.
| | | Test A (THDV = 0%) | | Test B (THDV = 10%) |
|---|
| Harmonic | Limit | RL = 37 Ω | RL = 74 Ω | RL = 148 Ω | Limit | RL = 37 Ω | RL = 74 Ω | RL = 148 Ω |
|---|
| H1 | 100% | 100% | 100% | 100% | 100% | 100% | 100% | 100% |
| H2 | 0.5% | 0.46% | 0.31% | 0.18% | 0.5% | 0.43% | 0.29% | 0.17% |
| H3 | 2% | 0.49% | 0.32% | 0.19% | 6.16% | 0.52% | 0.35% | 0.2% |
| H4 | 0.25% | 0.44% | 0.30% | 0.18% | 0.25% | 0.38% | 0.25% | 0.14% |
| H5 | 2% | 0.41% | 0.29% | 0.17% | 6.16% | 3.52% | 2.53% | 1.09% |
| H6 | 0.25% | 0.40% | 0.28% | 0.17% | 0.25% | 0.37% | 0.25% | 0.14% |
| H7 | 2% | 0.36% | 0.27% | 0.17% | 6.16% | 4.39% | 3.42% | 2.03% |
| H8 | 0.25% | 0.38% | 0.28% | 0.17% | 0.25% | 0.22% | 0.16% | 0.1% |
| H9 | 1.1% | 0.35% | 0.28% | 0.17% | 1.1% | 0.35% | 0.26% | 0.16% |
| H10 | 0.25% | 0.37% | 0.29% | 0.18% | 0.25% | 0.37% | 0.26% | 0.16% |
| H11 | 10% | 6.72% | 7.44% | 6.5% | 10% | 7.04% | 7.17% | 6.27% |
| H12 | 0.25% | 0.34% | 0.28% | 0.18% | 0.25% | 0.4% | 0.31% | 0.19% |
| H13 | 8% | 3.5% | 4.35% | 4.18% | 8% | 4.01% | 4.4% | 4.05% |
| H14 | 0.25% | 0.28% | 0.25% | 0.17% | 0.25% | 0.23% | 0.23% | 0.14% |
| H15 | 0.66% | 0.26% | 0.24% | 0.16% | 0.66% | 0.34% | 0.27% | 0.17% |
| H16 | 0.25% | 0.21% | 0.21% | 0.15% | 0.25% | 0.22% | 0.21% | 0.13% |
| H17 | 4% | 0.17% | 0.19% | 0.14% | 4% | 3.99% | 3.37% | 2.36% |
| H18 | 0.25% | 0.15% | 0.18% | 0.14% | 0.25% | 0.2% | 0.16% | 0.11% |
| H19 | 4% | 0.1% | 0.15% | 0.13% | 4% | 2.84% | 2.49% | 1.78% |
| H20 | 0.25% | 0.09% | 0.15% | 0.13% | 0.25% | 0.05% | 0.03% | 0.03% |
| H21 | 0.47% | 0.06% | 0.13% | 0.12% | 0.47% | 0.06% | 0.06% | 0.07% |
| H22 | 0.25% | 0.03% | 0.13% | 0.13% | 0.25% | 0.04% | 0.09% | 0.08% |
| H23 | 3% | 1.17% | 1.82% | 2.2% | 3% | 1.1% | 1.43% | 1.69% |
| H24 | 0.25% | 0.01% | 0.11% | 0.12% | 0.25% | 0.03% | 0.09% | 0.1% |
| H25 | 3% | 0.71% | 1.18% | 1.55% | 3% | 0.81% | 0.91% | 1.16% |
| H26 | 0.25% | 0.03% | 0.09% | 0.11% | 0.25% | 0.07% | 0.09% | 0.08% |
| H27 | 0.37% | 0.04% | 0.09% | 0.11% | 0.37% | 0.1% | 0.13% | 0.11% |
| H28 | 0.25% | 0.05% | 0.07% | 0.1% | 0.25% | 0.15% | 0.13% | 0.1% |
| H29 | 1.03% | 0.06% | 0.06% | 0.1% | 1.03% | 2.16% | 2.22% | 1.77% |
| H30 | 0.25% | 0.06% | 0.05% | 0.08% | 0.25% | 0.17% | 0.13% | 0.08% |
| H31 | 0.96% | 0.07% | 0.03% | 0.07% | 0.96% | 0.87% | 1.72% | 1.45% |
| H32 | 0.25% | 0.08% | 0.02% | 0.07% | 0.25% | 0.14% | 0.09% | 0.04% |
| H33 | 0.3% | 0.08% | 0.02% | 0.06% | 0.3% | 0.18% | 0.11% | 0.04% |
| H34 | 0.25% | 0.09% | 0.01% | 0.06% | 0.25% | 0.15% | 0.07% | 0.0% |
| H35 | 0.85% | 0.5% | 0.68% | 0.87% | 0.85% | 1.32% | 0.98% | 0.61% |
| H36 | 0.25% | 0.09% | 0.02% | 0.05% | 0.25% | 0.14% | 0.06% | 0.01% |
| H37 | 0.81% | 0.34% | 0.4% | 0.6% | 0.81% | 0.78% | 0.87% | 0.53% |
| H38 | 0.25% | 0.08% | 0.03% | 0.05% | 0.25% | 0.07% | 0.04% | 0.03% |
| H39 | 0.26% | 0.08% | 0.03% | 0.04% | 0.26% | 0.06% | 0.01% | 0.04% |
| H40 | 0.31% | 0.08% | 0.04% | 0.04% | 0.31% | 0.02% | 0.06% | 0.06% |
Table 7.
ATU total harmonic distortion.
Table 7.
ATU total harmonic distortion.
| | | Test A (THDV = 0%) | | Test B (THDV = 10%) |
|---|
| Harmonic | Limit | RL = 37 Ω | RL = 74 Ω | RL = 148 Ω | Limit | RL = 37 Ω | RL = 74 Ω | RL = 148 Ω |
|---|
| H1 | 100% | 100% | 100% | 100% | 100% | 100% | 100% | 100% |
| H2 | 0.5% | 0.02% | 0.0% | 0.0% | 0.5% | 0.23% | 0.13% | 0.01% |
| H3 | 2% | 0.66% | 0.35% | 0.18% | 6.16% | 1.52% | 2.11% | 2.38% |
| H4 | 0.25% | 0.02% | 0.0% | 0.0% | 0.25% | 0.28% | 0.03% | 0.01% |
| H5 | 2% | 3.65% | 2% | 1.03% | 6.16 % | 4.95% | 3.77% | 1.35% |
| H6 | 0.25% | 0.02% | 0.0% | 0.0% | 0.25% | 0.22% | 0.07% | 0.01% |
| H7 | 2% | 1.09% | 0.72% | 0.43% | 6.16 % | 2.9% | 2.65% | 1.78% |
| H8 | 0.25% | 0.02% | 0.0% | 0.0% | 0.25% | 0.09% | 0.04% | 0.01% |
| H9 | 1.1% | 0.11% | 0.08% | 0.05% | 1.1% | 0.12% | 0.04% | 0.01% |
| H10 | 0.25% | 0.02% | 0% | 0% | 0.25% | 0.19% | 0.04% | 0.01% |
| H11 | 10% | 0.64% | 0.51% | 0.34% | 10% | 1.58% | 1.19% | 0.94% |
| H12 | 0.25% | 0.01% | 0% | 0% | 0.25% | 0.05% | 0.04% | 0.01% |
| H13 | 8% | 0.36% | 0.27% | 0.19% | 8% | 0.63% | 0.51% | 0.38% |
| H14 | 0.25% | 0.01% | 0% | 0% | 0.25% | 0.04% | 0.03% | 0.01% |
| H15 | 0.66% | 0.11% | 0.03% | 0.02% | 0.66% | 0.05% | 0.03% | 0.01% |
| H16 | 0.25% | 0.01% | 0% | 0% | 0.25% | 0.05% | 0.04% | 0.01% |
| H17 | 4% | 0.28% | 0.19% | 0.15% | 4% | 1.02% | 0.5% | 0.28% |
| H18 | 0.25% | 0.01% | 0% | 0% | 0.25% | 0.06% | 0.02% | 0.01% |
| H19 | 4% | 0.15% | 0.13% | 0.1% | 4% | 0.42% | 0.15% | 0.16% |
| H20 | 0.25% | 0.0% | 0% | 0% | 0.25% | 0.05% | 0.02% | 0.0% |
| H21 | 0.47% | 0.17% | 0.03% | 0.01% | 0.47% | 0.08% | 0.03% | 0% |
| H22 | 0.25% | 0% | 0% | 0% | 0.25% | 0.09% | 0.02% | 0% |
| H23 | 3% | 0.12% | 0.1% | 0.07% | 3% | 0.39% | 0.39% | 0.18% |
| H24 | 0.25% | 0% | 0% | 0% | 0.25% | 0.07% | 0.01% | 0% |
| H25 | 3% | 0.09% | 0.06% | 0.05% | 3% | 0.22% | 0.09% | 0.07% |
| H26 | 0.25% | 0% | 0% | 0% | 0.25% | 0.06% | 0.02% | 0% |
| H27 | 0.37% | 0.13% | 0.06% | 0.01% | 0.37% | 0.08% | 0.02% | 0% |
| H28 | 0.25% | 0.0% | 0% | 0% | 0.25% | 0.08% | 0.01% | 0% |
| H29 | 1.03% | 0.04% | 0.05% | 0.04% | 1.03% | 0.21% | 0.25% | 0.17% |
| H30 | 0.25% | 0% | 0% | 0% | 0.25% | 0.06% | 0.01% | 0% |
| H31 | 0.96% | 0.06% | 0.04% | 0.03% | 0.96% | 0.09% | 0.1% | 0.03% |
| H32 | 0.25% | 0% | 0% | 0% | 0.25% | 0.05% | 0.01% | 0% |
| H33 | 0.3% | 0.06% | 0.06% | 0.01% | 0.3% | 0.06% | 0.01% | 0% |
| H34 | 0.25% | 0% | 0% | 0% | 0.25% | 0.04% | 0.01% | 0% |
| H35 | 0.85% | 0.05% | 0.03% | 0.03% | 0.85% | 0.2% | 0.12% | 0.13% |
| H36 | 0.25% | 0% | 0% | 0% | 0.25% | 0.05% | 0.01% | 0% |
| H37 | 0.81% | 0.02% | 0.03% | 0.02% | 0.81% | 0.13% | 0.07% | 0.03% |
| H38 | 0.25% | 0% | 0% | 0% | 0.25% | 0.05% | 0.01% | 0% |
| H39 | 0.26% | 0.04% | 0.04% | 0.02% | 0.26% | 0.05% | 0.01% | 0% |
| H40 | 0.31% | 0.0% | 0.0% | 0.0% | 0.31% | 0.05% | 0.01% | 0% |
Table 8.
ATU total harmonic distortion and power factor limits.
Table 8.
ATU total harmonic distortion and power factor limits.
| Load (kVA) | Power Factor—Leading | Power Factor—Lagging |
|---|
| <0.02 | 0.200 | 0.200 |
| 0.03 | 0.355 | 0.321 |
| 0.04 | 0.464 | 0.406 |
| 0.06 | 0.619 | 0.527 |
| 0.08 | 0.728 | 0.613 |
| 0.1 | 0.813 | 0.679 |
| 0.15 | 0.968 | 0.800 |
| ≥0.15 | 0.968 | 0.800 |
Table 9.
CTU total harmonic distortion and power factor.
Table 9.
CTU total harmonic distortion and power factor.
| Load | THD (%) | PF—Lagging |
|---|
| RL1 = 37 Ω | 5.5 | 0.88 |
| RL2 = 74 Ω | 7.4 | 0.83 |
| RL3 = 148 Ω | 7.1 | 0.81 |
| RL1 = 37 Ω, LL1 = 1.5 mH | 5.5 | 0.88 |
| RL2 = 74 Ω, LL2 = 1.5 mH | 7.4 | 0.83 |
| RL3 = 148 Ω, LL3 = 1.5 mH | 7.1 | 0.81 |
Table 10.
ATU total harmonic distortion and power factor.
Table 10.
ATU total harmonic distortion and power factor.
| Load | THD (%) | PF—Lagging |
|---|
| RL1 = 37 Ω | 1.89 | 0.82 |
| RL2 = 74 Ω | 1.25 | 0.81 |
| RL3 = 148 Ω | 0.74 | 0.80 |
| RL1 = 37 Ω, LL1 = 1.5 mH | 1.78 | 0.82 |
| RL2 = 74 Ω, LL2 = 1.5 mH | 1.25 | 0.81 |
| RL3 = 148 Ω, LL3 = 1.5 mH | 0.73 | 0.80 |
Table 11.
The harmonic content of CTU output voltage.
Table 11.
The harmonic content of CTU output voltage.
| | DC Ripple | Test A (THDV = 0%) |
|---|
| Harmonic | Limit | RL = 37 Ω | RL = 74 Ω | RL = 148 Ω |
|---|
| H1 | 6.4 V | 1.37 V | 0.67 V | 0.12 V |
| H2 | 16 V | 1.08 V | 0.54 V | 0.10 V |
| H3 | 16 V | 1.27 V | 0.62 V | 0.12 V |
| H4 | 16 V | 1.22 V | 0.59 V | 0.11 V |
| H5 | 16 V | 1.24 V | 0.62 V | 0.12 V |
| H6 | 16 V | 1.35 V | 0.67 V | 0.13 V |
| H7 | 16 V | 1.27 V | 0.65 V | 0.12 V |
| H8 | 16 V | 1.32 V | 0.70 V | 0.13 V |
| H9 | 16 V | 1.27 V | 0.68 V | 0.12 V |
| H10 | 16 V | 1.27 V | 0.70 V | 0.13 V |
| H11 | 16 V | 1.27 V | 0.70 V | 0.13 V |
| H12 | 16 V | 4.10 V | 5.75 V | 2.09 V |
| H13 | 16 V | 1.19 V | 0.68 V | 0.13 V |
| H14 | 16 V | 1.13 V | 0.68 V | 0.13 V |
| H15 | 16 V | 1.08 V | 0.67 V | 0.13 V |
| H16 | 16 V | 1.02 V | 0.67 V | 0.13 V |
| H17 | 16 V | 0.97 V | 0.64 V | 0.13 V |
| H18 | 16 V | 0.91 V | 0.64 V | 0.13 V |
| H19 | 16 V | 0.89 V | 0.63 V | 0.13 V |
| H20 | 2.4 V | 0.83 V | 0.62 V | 0.13 V |
Table 12.
CTU output voltage simulation results.
Table 12.
CTU output voltage simulation results.
| Load | Vomax
(V) | Vomin
(V) | Voavg
(V) | Voripple
(%) |
|---|
| RL1 = 37 Ω | 255.9 | 244.0 | 251.7 | 4.7 |
| RL2 = 74 Ω | 264.6 | 251.7 | 259.8 | 4.9 |
| RL3 = 148 Ω | 269.2 | 256.1 | 262.8 | 4.9 |
| RL1 = 37 Ω, LL1 = 1.5 mH | 257.9 | 239.4 | 252.5 | 7.3 |
| RL2 = 74 Ω, LL2 = 1.5 mH | 264.2 | 250.5 | 259.1 | 5.2 |
| RL3 = 148 Ω, LL3 = 1.5 mH | 268.2 | 255.7 | 262.8 | 4.7 |
Table 13.
ATU with input capacitor filter—simulation results.
Table 13.
ATU with input capacitor filter—simulation results.
| Load | Vmax
(V) | Vmin
(V) | Vavg
(V) | Vripple
(%) |
|---|
| RL1 = 37 Ω | 283.7 | 249.8 | 272.3 | 12 |
| RL2 = 74 Ω | 310.5 | 261.2 | 289.9 | 17 |
| RL3 = 148 Ω | 324.4 | 270.2 | 299.6 | 18 |
| No load | 323.9 | 280.4 | 309.1 | 14 |
| RL1 = 37 Ω, LL1 = 1.5 mH | 286.1 | 248.3 | 272.4 | 13.8 |
| RL2 = 74 Ω, LL2 = 1.5 mH | 309 | 260 | 289.3 | 17 |
| RL3 = 74 Ω, LL3 = 1.5 mH | 324.4 | 270.2 | 299.6 | 18 |
Table 14.
Ripple voltage for ATU total harmonic distortion.
Table 14.
Ripple voltage for ATU total harmonic distortion.
| Harmonic | DC Ripple | Test A (THDV = 0%) |
|---|
| Limit | RL = 37 Ω | RL = 74 Ω | RL = 148 Ω |
|---|
| H1 | 6.4 V | 2.24 V | 1.26 V | 0.62 V |
| H2 | 16 V | 16.85 V | 16.14 V | 15.76 V |
| H3 | 16 V | 2.16 V | 1.24 V | 0.62 V |
| H4 | 16 V | 3.69 V | 3.92 V | 3.69 V |
| H5 | 16 V | 2.02 V | 1.24 V | 0.62 V |
| H6 | 16 V | 17.25 V | 19.00 V | 18.38 V |
| H7 | 16 V | 1.84 V | 1.21 V | 0.62 V |
| H8 | 16 V | 1.13 V | 2.24 V | 2.59 V |
| H9 | 16 V | 1.65 V | 1.18 V | 0.62 V |
| H10 | 16 V | 1.94 V | 2.62 V | 2.43 V |
| H11 | 16 V | 1.46 V | 1.13 V | 0.62 V |
| H12 | 16 V | 1.02 V | 2.72 V | 4.61 V |
| H13 | 16 V | 1.29 V | 1.10 V | 0.62 V |
| H14 | 16 V | 1.29 V | 1.67 V | 1.80 V |
| H15 | 16 V | 1.18 V | 1.05 V | 0.59 V |
| H16 | 16 V | 2.47 V | 1.02 V | 0.37 V |
| H17 | 16 V | 1.11 V | 0.99 V | 0.59 V |
| H18 | 16 V | 3.13 V | 1.27 V | 1.21 V |
| H19 | 16 V | 1.02 V | 0.94 V | 0.59 V |
| H20 | 2.4 V | 2.10 V | 0.99 V | 0.40 V |
Table 15.
CTU output voltage simulation results under unbalanced input voltage.
Table 15.
CTU output voltage simulation results under unbalanced input voltage.
| Load | Vomax
(V) | Vomin
(V) | Voavg
(V) |
|---|
| RL1 = 37 Ω | 287.6 | 247 | 267.9 |
| RL2 = 74 Ω | 289.7 | 249.7 | 270.1 |
| RL3 = 148 Ω | 290.8 | 251.1 | 271.8 |
Table 16.
CTU total harmonic distortion and power factor under unbalanced input voltage.
Table 16.
CTU total harmonic distortion and power factor under unbalanced input voltage.
| Load | THD (%) | PF |
|---|
| RL1 = 37 Ω | 12.7 | 0.9 |
| RL2 = 74 Ω | 12.4 | 0.86 |
| RL3 = 148 Ω | 10.4 | 0.7 |
Table 17.
ATU output voltage simulation results under unbalanced input voltage.
Table 17.
ATU output voltage simulation results under unbalanced input voltage.
| Load | Vomax
(V) | Vomin
(V) | Voavg
(V) |
|---|
| RL1 = 37 Ω | 297.7 | 235.1 | 269.9 |
| RL2 = 74 Ω | 321.8 | 248.4 | 285.5 |
| RL3 = 148 Ω | 337.4 | 260.2 | 292.1 |
Table 18.
ATU total harmonic distortion and power factor under unbalanced input voltage.
Table 18.
ATU total harmonic distortion and power factor under unbalanced input voltage.
| Load | THD (%) | PF |
|---|
| RL1 = 37 Ω | 7.51 | 0.75 |
| RL2 = 74 Ω | 5 | 0.69 |
| RL3 = 148 Ω | 2.94 | 0.56 |
Table 19.
Summary of CTU and ATU characteristics.
Table 19.
Summary of CTU and ATU characteristics.
| Characteristic | CTU | ATU |
|---|
| Higher AC–DC conversion efficiency | | X |
| Galvanic isolation | X | |
| Lower input current THD | | X |
| Lower output voltage ripple | X | |
| Good performance without additional input capacitive filter | X | |
| Good performance without additional series inductors | X | |
| Lower size and weight | | X |
| Publisher’s Note: MDPI stays neutral with regard to jurisdictional claims in published maps and institutional affiliations. |
© 2021 by the authors. Licensee MDPI, Basel, Switzerland. This article is an open access article distributed under the terms and conditions of the Creative Commons Attribution (CC BY) license (https://creativecommons.org/licenses/by/4.0/).


