Article

Comparative Analysis of Strength and Modal Characteristics of a Full Tubular Pump and an Axial Flow Pump Impellers Based on Fluid-Structure Interaction

1
College of Hydraulic Science and Engineering, Yangzhou University, Yangzhou 225000, China
2
Hydrodynamic Engineering Laboratory of Jiangsu Province, Yangzhou 225009, China
3
Huai’an Institute of Hydraulic Survey and Design, Ltd., Huai’an 223001, China
4
International Center for Small Hydro Power, Hangzhou 310002, China
*
Author to whom correspondence should be addressed.
Energies 2021, 14(19), 6395; https://doi.org/10.3390/en14196395
Submission received: 25 August 2021 / Revised: 29 September 2021 / Accepted: 2 October 2021 / Published: 6 October 2021
(This article belongs to the Special Issue Advances in Pumped Storage Hydraulic System)

Abstract

:
Fluid-structure interaction (FSI) was used to determine the structural mechanical characteristics of full tubular and axial-flow pumps. The results showed that as the flow rate increases, the total deformation and equivalent stress are significantly reduced. The max total deformation (MTD) and the max equivalent stress (MES) of the full tubular pump impeller occur on the outer edge of the blade. There are two stress concentrations in the full tubular pump impeller, one of which is located in the outlet area of the rim, and the other is located in the outlet area of the hub. However, the MES of the axial-flow pump appears in the center of the blade hub. The performance difference between the full tubular pump and the axial-flow pump is mainly caused by the clearance backflow. The natural frequency of the full tubular pump is lower than that of the axial-flow pump on the basis of the modal results. The MES of the full tubular pump is mainly concentrated at the junction of the blade and the motor rotor, and the max thickness of the rim is 6mm, which can be more prone to cracks and seriously affect the safety and stability of the pump.

1. Introduction

The full tubular pump is a new type of mechatronics product, whose blades are connected with the motor rotor [1]. Compared with the axial-flow pump, the full tubular pump eliminates the transmission equipment, so its structural advantage is very obvious. However, the efficiency of the full tubular pump impeller is generally lower than that of the axial-flow pump. Shi et al. [2,3,4] combined numerical simulation and model tests to evaluate the hydraulic performance of axial-flow and full tubular pumps. After analyzing the characteristics of energy performance and pressure pulsation they concluded that the clearance backflow had a greater impact on the hydraulic performance of the full tubular pump. At the same time, for the definition of clearance backflow, they explained that there was a certain size of clearance between the motor rotor and the stator, under the influence of the pressure difference between the high pressure of the impeller outlet and the low inlet pressure, the reverse clearance flow was formed from the impeller outlet area to the impeller inlet area.
As the core component of the pump, the structural stress of the impeller is caused by periodic water pressure [5,6]. Long-term operation will cause cracks or fatigue damage on the blade surface, which seriously threatens the safe and stable operation of the pump [7,8,9,10]. Therefore, the structural mechanical properties of impellers have attracted more and more attention. In recent years, with the development of computational fluid dynamics (CFD) technology, the fluid-structure interaction (FSI) analysis method has become an effective method to analyze the structural stress and deformation. Fu et al. [11] verified the speed of the turbine through model tests, and found that the numerical simulation results had high credibility. Li et al. [12] accurately captured the double convex airfoil vortex and separation zone through unsteady numerical simulation. Kan et al. [13,14] applied the bidirectional FSI method to analyze the dynamic stress distribution of the blade. He found that the joint between the blade and the hub was the main stress concentration area and proposed measures to effectively relieve the stress concentration. Schneider et al. [15] studied the influence of impeller structure design parameters on the structural characteristics of multistage centrifugal pumps. Pei et al. [16] quantitatively analyzed the blade deformation and stress distribution of the bidirectional axial-flow pump device under different flow conditions, and found that the maximum deformation and stress existed at the blade edge and the hub respectively. Zhang et al. [17] discovered that the stress concentration on the blade hub was caused by the cantilever structure of the rotating blade. Li et al. [18,19] conducted bidirectional FSI and modal analyses on the mixed-flow pump, and the results shown that fatigue failure was more likely to occur at the hub and the natural frequency of vibration was not affected by the flow rate. Li et al. [20] explored that the vibration frequency of the bidirectional shaft extension pump device under zero head condition was very close to the first or second mode natural frequencies of the pump.
Deng et al. [21] compared the unidirectional and bidirectional FSI of tidal turbines, and found that the predicted power values of the two analysis methods were basically the same. The bidirectional FSI had a great advantage in predicting the influence of tip vortices. Benra et al. [22] compared the unidirectional and bidirectional FSI solution results of the single vane pump, and pointed out that the bidirectional FSI simulation result shown the good agreement with the experiment. Zhu et al. [23] found that the main distribution trend of wind turbine blade stress remained unchanged whether the unidirectional or bidirectional FSI method was adopted. In view of the unidirectional or bidirectional FSI prediction results, Javanmardi et al. [24] found that both methods could better predict the hydrodynamic characteristics of the propeller. Wijesooriya et al. [25] proposed a non-coupled unidirectional FSI analysis method for super-tall structures, and verified its feasibility and calculation accuracy.
The above research conclusions found that the MES of the impeller is mainly concentrated at the hub of the blade. However, for the special full tubular pump type, the research conclusions on the stress and deformation of the structure are not yet known. Hence, this paper adopts the unidirectional FSI method to compare the hydraulic and structural mechanical characteristics of axial-flow and full tubular pump impellers under different flow conditions. The purpose of this research is to explore the structural characteristics of the full tubular pump and provide certain guidance for the structural design of the full tubular pump.

2. Numerical Method

2.1. Object

The full tubular pump device studied in this paper is composed of the inlet pipe, the impeller, the rotor, the guide vane and the outlet pipe, as shown in Figure 1a. The axial-flow pump does not contain the motor rotor, and the rest of the hydraulic components are consistent with the full tubular pump, as shown in Figure 1b. The main design parameters of the pump model are shown in Table 1.

2.2. Boundary Conditions and Turbulence Model

The internal flow of the pump is a three-dimensional incompressible flow, and the control equation adopts the RANS Reynolds average equation [26]. The simulation reported in this paper uses the finite volume method to discrete the control equations and introduces the shear stress transport (SST) k-ω turbulence model to simulate the three-dimensional turbulent flow. Since the clearance backflow and structure in the full tubular pump increase the complexity of the pump inlet flow field, it is very necessary to select a suitable turbulence model to capture the details of these flow fields. As we all know, the SST k-ω turbulence model has a high predictability in the internal flow and the external energy characteristics, which gives highly accurate predictions of flow separation under adverse pressure gradients [27,28]. In this simulation, the turbulent energy k equation and turbulent eddy frequency ω equation can be written as follows [29]:
ρ k t + x j ρ U j k = x j ( μ + μ t σ k 1 ) k x j β ρ k ω + P k ρ ω t + x j ρ U j ω = x j μ + μ t σ ω 1 ω x j + α 1 ω k P k β 1 ρ ω 2
The transformed k-ε equation is used to predict the free-stream flow away from the boundary layer:
ρ k t + x j ρ U j k = x j ( μ + μ t σ k 2 ) k x j β k ω + P k ρ ω t + x j ρ U j ω = x j μ + μ t σ ω 2 ω x j + 2 1 F 1 ρ 1 σ ω 2 ω k x j ω x j + α 2 ω k P k β 2 ρ ω 2
The turbulent viscosity μt is shown as follows:
μ t = α 1 k ρ max α 1 ω ; S F 2
The blending function F1 and F2 are based on the flow variables and the distance to the boundary layer. The formulas are as follows:
F 1 = tanh arg 1 4 F 2 = tanh arg 2 2 arg 1 = min max k β ω y ; 500 ν y 2 ω ; 4 ρ k C D k ω σ ω 2 y 2 arg 2 = max 2 k β ω y ; 500 ν y 2 ω C D k ω = max 2 ρ 1 σ ω 2 ω k x j ω x j ; 1.0 × 10 10
where S is an invariant measure of the strain rate, y is the distance to the nearest wall, μ is the dynamic viscosity, μt is the turbulent viscosity, Pk is the turbulence produced by viscous force, ν is the dynamic viscosity and the constant parameters in above equations are: β′ = 0.09, α1 = 5/9, σk1 = 1.176, σk2 = 1, σω1 = 2, σω2 = 1.1682, β1 = 0.075, β2 = 0.828.
Multiple reference coordinate systems are used to calculate the fluid domain. The impeller as a rotating component adopts a rotating coordinate system, and the rest of the components adopt a stationary coordinate system. In the steady-state calculation, the “Stage” model is used to process the data transfer of the interface between the rotating domain and the stationary domain. The interface characteristic is to ignore the nonuniformity of the flow in the circumferential direction. The solid wall of the computational fluid domain is set to a no slip wall. The inlet boundary condition is set to total pressure which value is 1 atm and the turbulence intensity is set to 5%. The outlet boundary condition is set to mass flow rate.

2.3. Grid

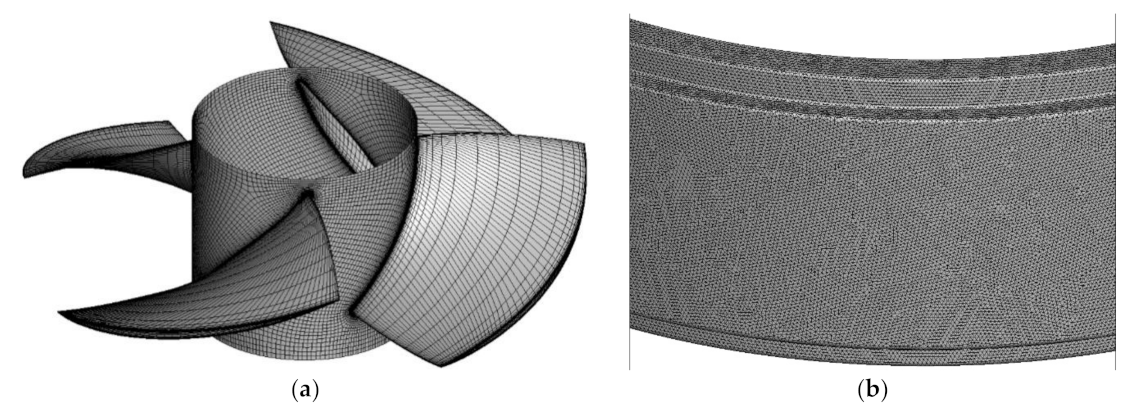
The computational domains of the whole flow passage are dispersed as structured grids except for the application of unstructured grids to the motor rotor. The grid acts as the main carrier of numerical simulation calculation, in which the quality and first dimensionless y+ value directly affect the accuracy of computational results. The impeller is the rotating part of the entire computational domain, and the number of its grids has a greater influence on the computational accuracy. According to the grid independence verification of the reference [4], when the single passage impeller grid reaches 140,000, the number of grids has little effect on the computational results. And the analysis of grid independence has been reported in the reference [4]. Therefore, the final single passage impeller grid number reaches 140,000 approximately. The mean y+ value at the blade, hub, and rim are around 45.5, 26.3, and 48.8, which meets the requirements of the turbulence model in this paper(30 < y+ < 100). Figure 2 presents the gird generated for the impeller and motor rotor.

2.4. FSI Setting

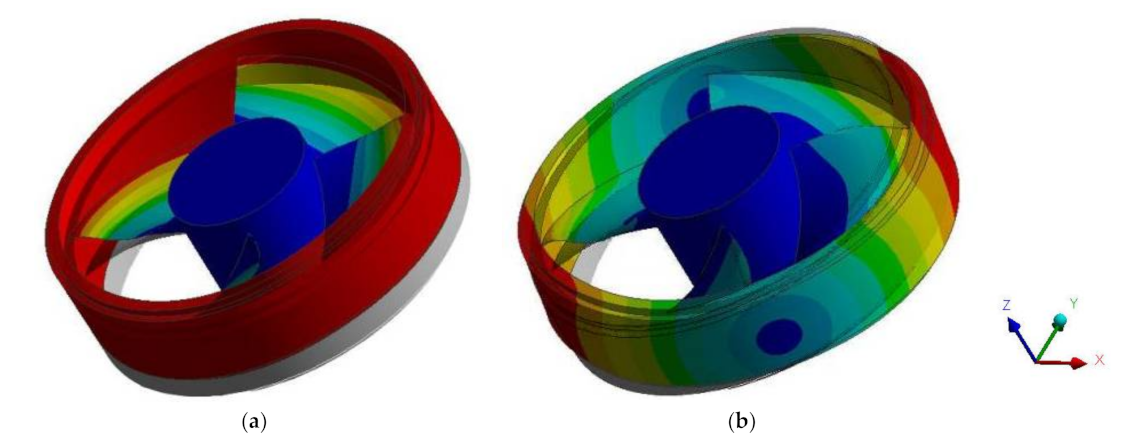
The structural analysis in this paper adopts the unidirectional FSI method, and the structural calculation uses the finite element method to analyze the structural characteristics of the blade. The structural model only takes into account the impeller, as shown in Figure 3. The material properties of the impeller are stainless steel, and the characteristic parameters of the stainless steel are shown in Table 2. Figure 4 shows the grid of the impeller structure. The impeller structure is divided into tetrahedral grids, in which the full tubular pump impeller grid number is 941,001 and the axial-flow pump impeller grid number is 728,706. The dynamic equation for structural calculations is defined as follows [30].
M x ¨ + C x ˙ + K x = { F } ,
where [M] is the structural mass matrix, [C] is the structural damping matrix, [K] is the structural stiffness matrix, (x) is the structural displacement, x ˙ is the structural velocity, x ¨ is the structural acceleration, and {F} represents the flow field force of the structure under the FSI.
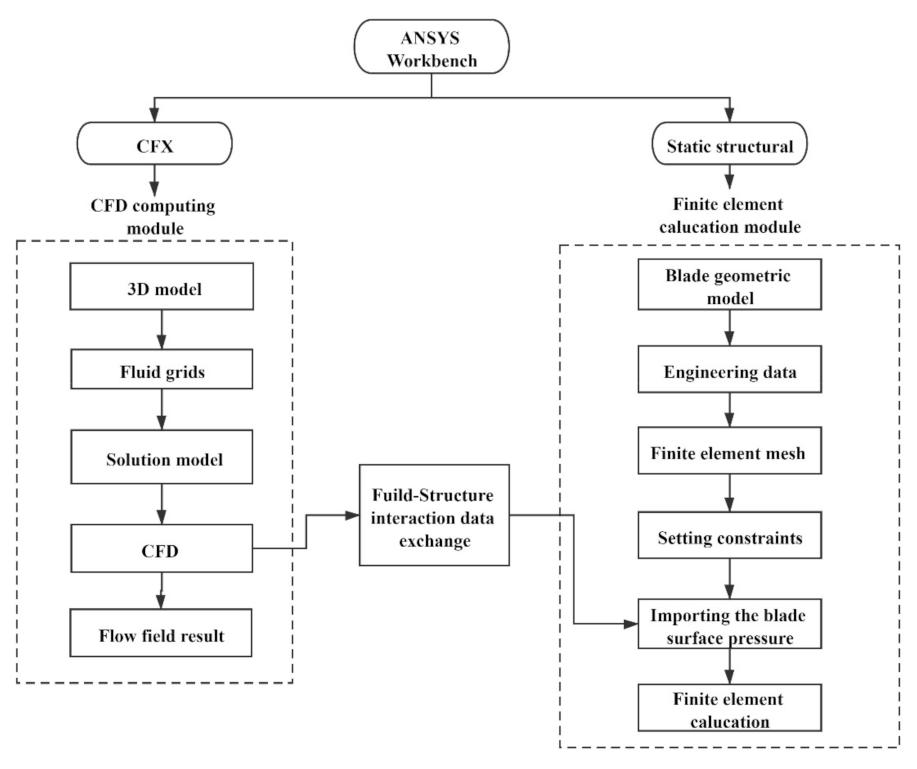
Finite element calculations need to consider the boundary conditions of the blade model, mainly including structural constraints and pressure loads. In order to prevent the structure generating rigid body displacement, a fixed constraint is adopted on the hub surface. The load conditions for the structure calculation are transmitted through the surface pressures of the blade, hub, rim, and rotor calculated by CFD. In addition, taking into account the centrifugal force caused by the rotation of the impeller and the influence of gravity, the blade rotation speed (n) is set to 950 r/min and the gravitational acceleration (g) is set to 9.81 m/s2. The FSI calculation process is shown in Figure 5.

2.5. Model Experiment Verification

The model experiments include the axial-flow pump and the full tubular pump. The impeller diameter D is 350 mm, the blade rotation speed n is 950 r/min, the hub ratio is 0.4, the number of blades is 4, the number of guide vanes is 7. The pump test bench is shown in Figure 6.
The pump device model experiment is carried out on the high-precision hydraulic machinery test bench, which is a vertical closed circulation system. The energy performance test of the pump device is carried out in accordance with SL140-2006 code requirement. The comprehensive error of the efficiency is ±0.39%.
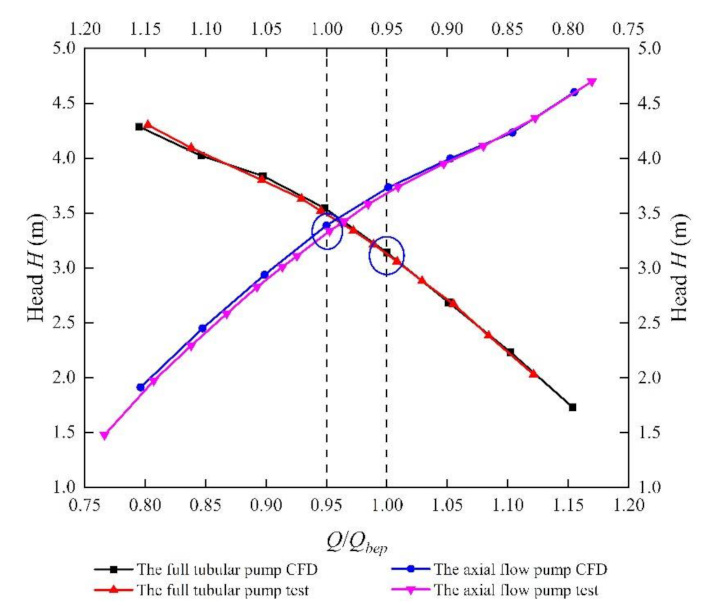
Figure 7 shows the comparison between the numerical simulation and model test results of the axial-flow pump and the full tubular pump. The variation trend of Q-H curve predicted by numerical simulation is basically consistent with that of model experiment.
The Q-H curve of the full tubular pump is significantly lower than that of the axial-flow pump. Under the design condition Qbep, the test operation head of the full tubular pump is 3.13 m, and the test operation head of the axial-flow pump is 3.31 m. The head is increased by 5% compared with that of the full tubular pump. The main reason for this difference is caused by the clearance backflow [2,3,4]. Within the flow range of 0.8 Qbep–1.2 Qbep, the relative error is within 3% between the experiment head and numerical simulation. Therefore, the numerical simulation results have high credibility.

3. Results

3.1. Flow Field Analysis

In the structural analysis, the pressure distribution on the blade surface is loaded on the structure as boundary condition for finite element calculation. Therefore, the research on the surface pressure distribution establishes the foundation for the FSI analysis.
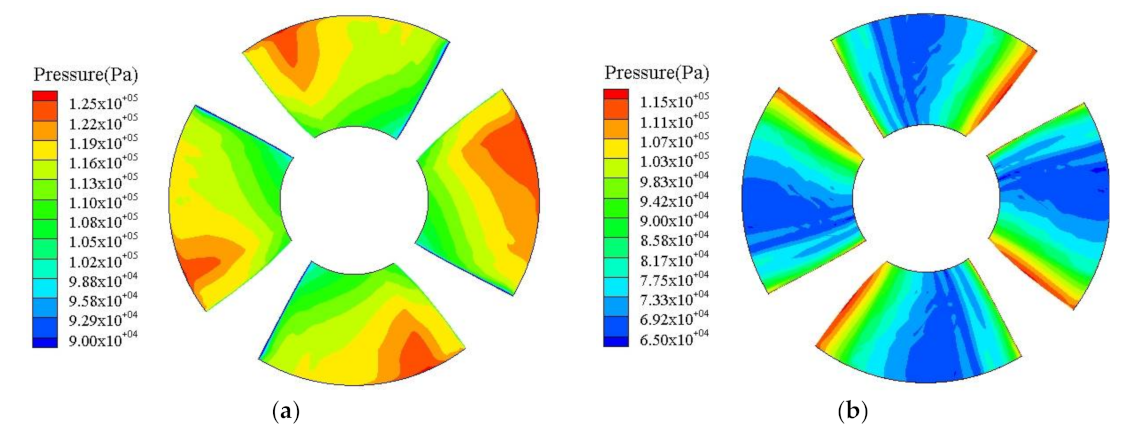
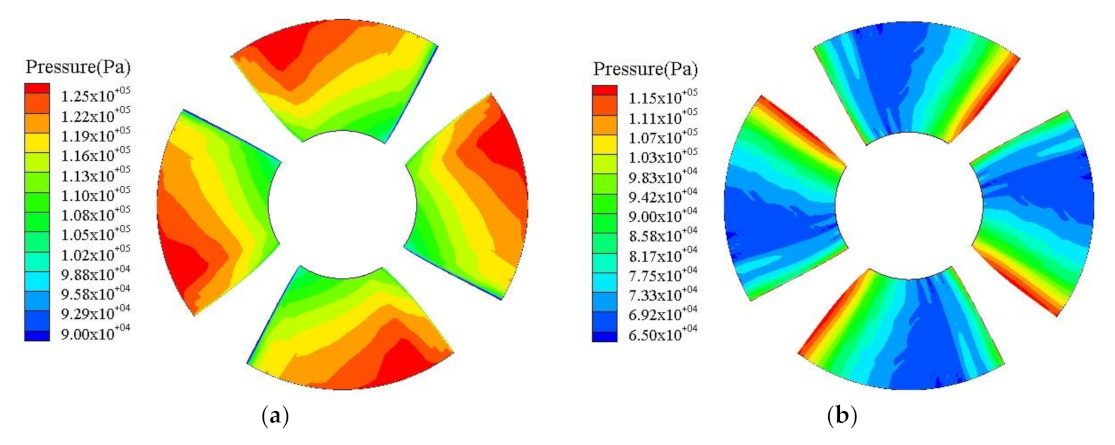
Figure 8 and Figure 9 are the pressure distribution on blade surface of the full tubular pump and axial-flow pump under the flow Qbep, respectively. The pressure distribution trends of blade surface on the full tubular pump and axial-flow pump are basically the same. The pressure of the blade pressure surface (PS) gradually increases from the hub to the rim, and the high-pressure area is concentrated at the blade rim. The pressure of the blade suction surface (SS) decreases first and then increases from blade inlet to outlet, and the low-pressure area is concentrated near the leading edge (LE) of the blade.

3.2. Structural Deformation Analysis

In order to accurately obtain the deformation and stress distributions of the full tubular pump and the axial-flow pump, the fluid calculation result needs to be transmitted to the corresponding position in the structure calculation. The pressure load of the full tubular pump includes the blade, hub, rim and rotor surface, and the axial-flow pump includes the blade and hub surface. According to the results of pressure transfer, 100% of mechanical nodes in the structure analysis were mapped to the CFD surface.
Figure 10 demonstrates the total deformation of the blade PS under the flow conditions of 0.8 Qbep, Qbep and 1.1 Qbep, respectively. It can be seen that the blade deformation gradually increases from the hub to the rim, and the maximum deformation occurs at the blade rim. The MTD of the axial-flow pump is mainly located at the inlet of the blade rim, while the MTD of the full tubular pump is located at the outlet of the blade rim. As the flow rate increases, due to the pump head and the axial force on the blade decreases, the total deformation of the blade gradually decreases. When the flow condition Q = 0.8 Qbep, the MTD of the full tubular pump is 0.052 mm, and the MTD of the axial-flow pump is 0.12 mm, which is 2.3 times that of the full tubular pump. When Q = 1.0 Qbep, the MTD of the full tubular pump is 0.04 mm, while the MTD of the axial-flow pump is 0.065 mm, which is 1.63 times that of the full tubular pump. When Q = 1.1 Qbep, the MTD of the full tubular pump is 0.032 mm, while the MTD of the axial-flow pump is 0.043 mm, which is 1.34 times that of the full tubular pump. The MTD of the full tubular pump under all flow conditions is smaller than that of the axial-flow pump, so the pump blade deformation can be reduced when the blade of the full tubular pump is fixed with the rotor.

3.3. Structural Stress Analysis

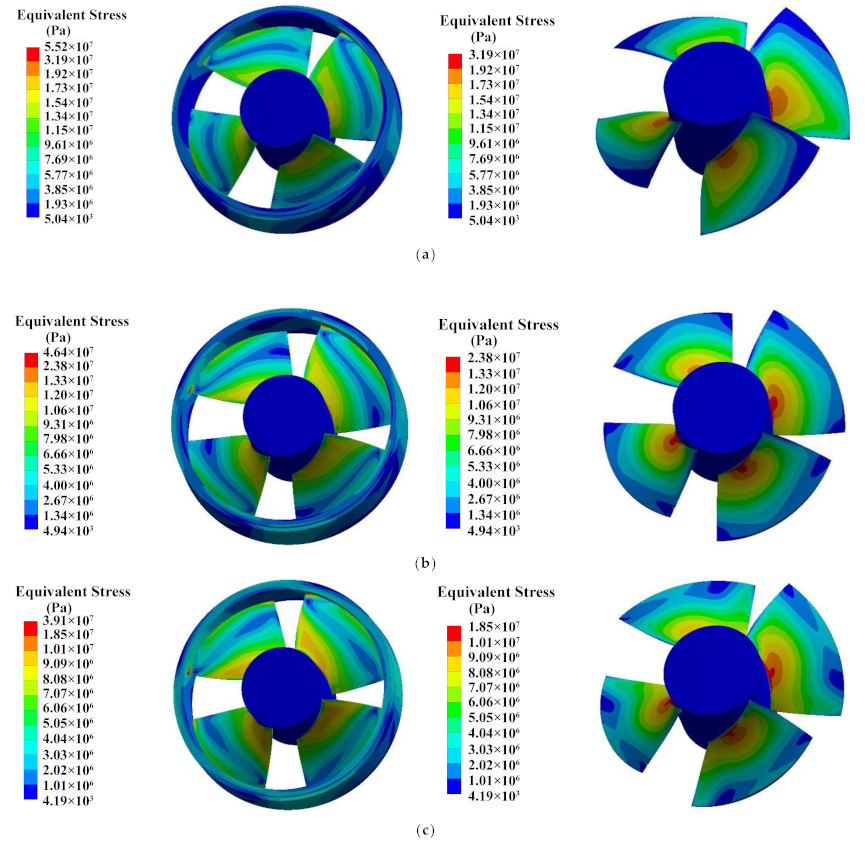
Figure 11 reveals the equivalent stress distribution of the blade PS between the full tubular pump and the axial-flow pump. The equivalent stress of the full tubular pump decreases first and then increases from the hub to the rim. At the same time, the MES appears at the rim of the impeller trailing edge (TE), and there is also an obvious stress concentration area on the outlet side of the hub. However, the equivalent stress of the axial-flow pump decreases from the hub to the rim, and the equivalent stress is the smallest at the trailing edge of the rim. The MES of the axial-flow pump occurs in the middle of the hub. The distribution trend of the equivalent stress under different flow conditions is basically the same, and the MES value decreases with the increase of the flow. The MES of the full tubular pump is higher than that of the axial-flow pump at the same flow condition. Under Q = 0.8 Qbep, the MES of the full tubular pump reaches 55 MPa, and that of the axial-flow pump reaches 31.9 MPa. Under Q = Qbep, the MES of the full tubular pump is 46.4 MPa, and that of the axial-flow pump is 23.8 MPa. Under Q = 1.1 Qbep, the MES of the full tubular pump is 39.1 MPa, and that of the axial-flow pump is 18.5 MPa. However, the MES of the axial-flow pump and the full tubular pump is both lower than the allowable stress of the material (190 MPa).
According to the above mentioned distribution characteristic of the total deformation and equivalent stress, the reasons of the difference in the distribution trend are analyzed in the next section. The axial-flow pump impeller can be simplified as a cantilever beam structure fixed at one end, and the pressure difference between the PS and SS acting on the blade can be regarded as the distributed load q, as shown in Figure 12a.
The blade rim is the main part of the work. The thickness of the blade rim is relatively thin and the maximum airfoil thickness of 6 mm. The maximum thickness of the hub airfoil is 12 mm, which is likely to cause insufficient rigidity of the blade rim. As a result, the MTD occurs at the blade rim, and the MES occurs at the blade hub. The full tubular pump can be simplified to a structure with one end fixed and one end hinged, as shown in Figure 12b. Since both ends of the blade are constrained, the structural deformation can be restricted to a certain extent. However, under the action of the lateral force f, the internal interaction force of the blade structure is enhanced. Because of the small structural deformation, the blade cannot release the stress through the deformation. Therefore, there are two stress concentrations, one of which is located in the outlet of the blade rim and the other is located in the outlet of the hub. The MES and MTD are located at the junction of the blade rim and the rotor, where the maximum thickness is relatively thin. The maximum thickness of the rim airfoil is 6 mm in pump model, which is prone to fracture. In summary, the structure of the full tubular pump should attach great importance to the processing method at the junction of the blade rim and the rotor to avoid cracks because of the deformation and stress.
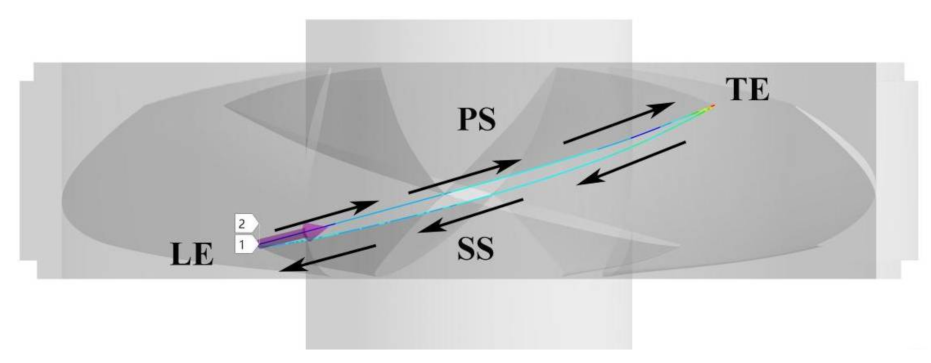
From the above comparison, it is found that the equivalent stress at the blade rim of the full tubular pump has a large variation. Therefore, in order to analyze the distribution trend of the equivalent stress at this place in detail, a wire frame path is arranged around this place to summarize the equivalent stress distribution regularity from the PS to the SS. Figure 13 shows the rim wire frame path of the full tubular pump.
Figure 14 presents the equivalent stress distribution trend at the blade rim under different flow conditions. The equivalent stress of the full tubular pump is obviously higher than that of the axial-flow pump. And it presents the distribution trend that the largest in the middle and the smallest on both sides. There are large stress fluctuations at the TE. However, the equivalent stress of the axial-flow pump presents a distribution trend that the smallest in the middle and the largest on both sides.
Especially the stress at the TE of the full tubular pump is significantly higher than that of the axial-flow pump. The MES of the full tubular pump reaches 28.6 MPa under Q = 0.8 Qbep, the MES of the full tubular pump is 24.1 MPa under Q = Qbep, and the MES of the full tubular pump is 20.7 MPa under Q = 1.1 Qbep. The distribution trend of equivalent stress along the blade rim is basically the same under different flow conditions. Under small flow conditions, the equivalent stress of the axial-flow pump fluctuates greatly on the SS. Because of the reduction of the relative flow angle near the LE, the flow separation on the SS is enhanced, resulting in low pressure around the LE.
In summary, the total deformation and equivalent stress of the full tubular pump are quite different from those of the axial-flow pump. The reasons for the differences are preliminarily summarized into the following two categories: the one is clearance backflow and the other is geometric structure. It can be seen from the structural form that the full tubular pump is reduced to a fixed-supported end and a hinged-supported end structure. At the rotor, the lateral force f is composed of water pressure and friction caused by the clearance backflow. Therefore, we know that the unloaded or load force f has an impact on the structure of the full tubular pump. In order to further explore the reasons for the difference, the effect of clearance backflow on its structural characteristics will be discussed in the next section as shown in the Figure 15. The structural models of unloaded rotor surface pressure (ULP) and loaded rotor surface pressure (LP) are compared with the axial-flow pump to study the difference of structural performance under different flow conditions.
It can be seen from the Figure 15 that the clearance backflow has a greater impact on the structural performance of the full tubular pump under different flow conditions. Under different flow conditions, the clearance backflow changes the force acting on the rotor, resulting in the varies of stress and deformation. On the one hand, the clearance backflow causes the increase in the deformation. Especially under small flow conditions, the MTD of the LP increases by 20% compared to that of the ULP. On the other hand, the MES of the LP caused by the clearance backflow are smaller than that of the ULP. Compared with the ULP, the MTD of LP increases by approximately 16% under various flow conditions.
Compared with the axial-flow pump, it can find that the shape of the geometric structure has a greater impact on the structural performance of the tubular pump. The MTD of the ULP is much smaller than that of the axial-flow pump, accounting for 42.1%, 61.6% and 74.4% of the axial-flow pump under various flow conditions. The MES of the ULP is much higher than that of the axial-flow pump, which is 1.9 times, 2.25 times and 2.47 times that of the axial-flow pump under different flow conditions. Based on the above analysis, it can be seen that the clearance backflow and geometric structure have a greater impact on the structural performance of the full tubular pump.

3.4. Modal Analysis

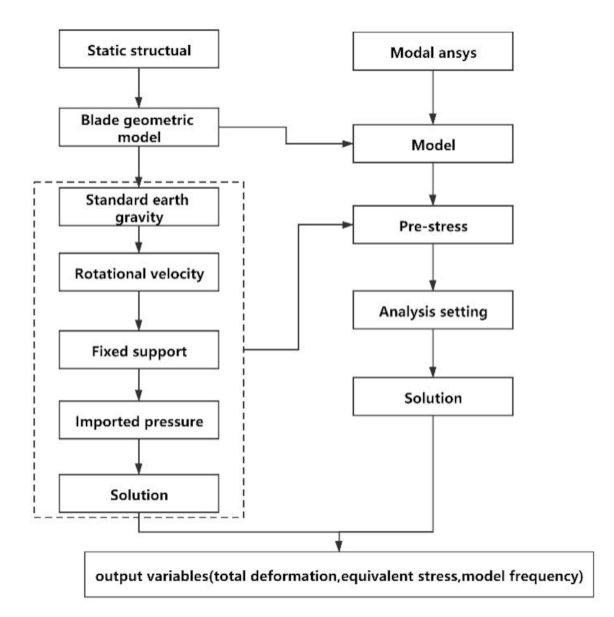
The modal analysis in this study is based on the unidirectional FSI method. The Block Lancos method is used to perform modal analysis on the impeller under pre-stress. The pre-stress of the impeller contains the impeller’s own gravity, rotation speed and the water pressure of wall surfaces acting on the impeller. The modal analysis flowchart is shown in Figure 16.
The mode is the natural vibration characteristic of the structural system, and each mode has a specific natural frequency and vibration shape [31,32,33]. The impeller is the main excitation source of hydraulic excitation. The impeller rotation speed n is 950 r/min, and the BPF (blade passing frequency) is 63.3 Hz. If the hydraulic excitation frequency is close to the BPF and its frequency multipliers, the impeller will resonate. This article will analyze the pre-stress modal of the full tubular pump and the axial-flow pump in the air medium. The first 6 natural frequencies of the impeller and the corresponding vibration of each order mode are analyzed.
Table 3 shows the natural frequency of the tubular pump and the axial-flow pump in each mode. The natural frequency of the full tubular pump in each mode is lower than that of the axial-flow pump affected by the rotor on the blade rim. The first-order vibration frequency of the full tubular pump is 279.9 Hz, which is 4.4 times the blade passing frequency, while the first-order vibration frequency of the axial-flow pump reaches 868.7 Hz, which is 13.7 times the blade passing frequency.
Table 4 lists the modal participation factors of the main deformation directions in each mode. The modal participation coefficient is based on the assumed unit displacement of each translational and rotational direction in the Cartesian coordinate system to solve the motion mass in each direction. The larger the absolute value is, the more the main vibration mode in that direction is represented. The red dotted line on the table denotes the participation coefficient with the largest absolute value of each party.
The formulas of the modal participation factor are as follows:
φ i T M φ i = 1
γ i = φ i T F
where γi is the participation factor for the ith mode, ϕi is the eigenvector representing the mode shape of the ith natural frequency, and F is the input force vector.
Figure 17 shows the vibration shape of the full tubular pump in each mode. The vibration shape can be divided into deformation along the X-axis, Y-axis, Z-axis and torsional direction according to the Cartesian coordinate system. It can be seen from the vibration shape diagram that the vibration shape of the impeller can be divided into bending vibration, torsional vibration and compound vibration. The vibration mode shapes of each order modal are compared combining the participation factors of each mode in Table 4 and Figure 17. In the first-order mode, the absolute value of the participation factor in the z-axis direction is the largest, which represented that the vibration frequency is mainly the up and down swing along the Z-axis direction, as shown in Figure 17a. The vibration frequency of the second-order mode is equal to the third-order mode, whose values reach 0.39. Their participation factors indicate that the vibration shape mainly swings along the Y-axis and the X-axis respectively, as shown in Figure 17b,c. In the fourth, fifth and sixth orders, the vibration shapes are primarily in the Z-axis direction. However, the vibration shapes of the fourth-order and sixth-order modals primarily present the ‘‘U’’ type bending deformation along the Z-axis. Therefore, the modal participation factor has certain reference significance for the analysis of vibration modes. It is worth noting that the main vibration modes exhibited by each vibration frequency swing along the Z-axis. This direction exactly reflects the axial direction. When the pump resonates, it is very likely to vibrate in the axial direction. It also requires us to pay attention to the vibration direction in the engineering practice.

4. Conclusions

In this paper, the FSI method is used to compare the structural strength and modal characteristics of the blades between the full tubular and the axial-flow pumps. The major conclusions can be summarized as follows:
  • The distribution trend of the blade deformation and equivalent stress of the full tubular pump is basically the same under various flow conditions, but its value gradually decreases with the increase of the flow. The deformation of the blade shows a trend of gradually increasing from the hub to the rim, and the deformation is larger at the outlet of the rim, while the MTD of the axial-flow pump is at the inlet of the blade. The MTD of the full tubular pump is less than that of the axial-flow pump.
  • The equivalent stress of the full tubular pump shows a trend of first decreasing and then increasing from the hub to the rim. There are two stress concentration areas primarily distributed in the outlet of the blade rim and the area of the hub. While the equivalent stress of the axial-flow pump is decreased from the hub to the rim, there is only one stress concentration area distributed in the center of the hub. The MES of the axial-flow pump is smaller than that of the full tubular pump under different flow conditions.
  • The MES and MTD of the full tubular pump are located at the junction of the blade rim and the rotor. Clearance backflow and geometric shape are the main reasons for the difference in structural performance between the tubular flow pump and the axial-flow pump. It is very essential to pay attention to the rigidity of the full tubular pump rim.
  • The natural frequency of each order modal for the full tubular pump is less than that of the axial-flow pump. The natural frequency of the first-order mode for the full tubular pump is 279.9 Hz. And the modal participation factor in the Z-axis is 3.0, which the absolute value is max in the Z-axis direction and represents the up and down swing along the Z-axis direction. The modal participation factor has certain reference significance for analyzing the vibration mode shape. The main vibration modes exhibited by each vibration frequency swings along the Z-axis and this direction exactly reflects the axial direction.

Author Contributions

Conceptualization, L.S. and J.Z.; methodology, L.W. and S.C.; software, L.S. and J.Z.; validation, F.T. and Y.J.; formal analysis, F.T. and Y.J.; resources, L.S. and F.T.; data curation, L.S. and S.C.; writing—original draft preparation, J.Z. and L.W.; writing—review and editing, L.S. and F.T.; visualization, J.Z.; supervision, L.S. and L.W.; project administration, L.S.; funding acquisition, L.S. and F.T. All authors have read and agreed to the published version of the manuscript.

Funding

This work was supported by the National Natural Science Foundation of China (grant number 51376155); the Natural Science Foundation of Jiangsu Province of China (grant number BK20190914); China Postdoctoral Science Foundation Project (2019M661946); the Natural Science Foundation of Jiangsu Higher Education Institutions of China (grant number 19KJB570002); Jiangsu Water Conservancy Science and Technology project (grant number 2021012); the Priority Academic Program Development of Jiangsu Higher Education Institutions (grant number PAPD).

Institutional Review Board Statement

Not applicable.

Informed Consent Statement

Not applicable.

Data Availability Statement

All the data in this paper are obtained by physical experiment and numerical simulation respectively, and the data used to support the findings of this study are available from the corresponding author upon request.

Conflicts of Interest

The authors declare no conflict of interest.

Nomenclature

Dimpeller diameter, mm
Qflow, L/s
ρthe density, kg/m3
glocal acceleration of gravity, m/s2
Hhead, m
ηefficiency, %
nrotation speed, r/min
bepbest efficiency point
FSIfluid-structure interaction
MTDthe maximum total deformation, m
MESthe maximum equivalent stress, Pa
PSthe pressure surface of blade
SSthe suction surface of blade
TEthe trailing edge of blade
LEthe leading edge of blade
ULPthe unloaded rotor surface pressure
LPthe loaded rotor surface pressure
BPFthe blade passing frequency, Hz
γithe participation factor for the ith mode
ϕieigenvector representing the mode shape of the ith natural frequency
Finput force vector
[M]the structural mass matrix
[C]the structural damping matrix
[K]the structural stiffness matrix
x ˙ the structural velocity
(x)the structural displacement
x ¨ the structural acceleration
{F}the flow field force of the structure under the FSI
EYoung modulus, MPa
ΦPoisson ratio
σsYield strength, MPa
San invariant measure of the strain rate
ythe distance to the nearest wall
νthe kinematic viscosity
kturbulent energy, m2/s2
Ωturbulent eddy frequency, s−1
i, jthe stands for the x, y, z direction
ujstands for the velocity in different coordinate directions, m/s
xjstands for the coordinate component, m
μthe dynamic viscosity, Pa·s
μtthe turbulent viscosity, m2/s
Pkthe turbulence produced by viscous force
εthe dissipation rate of turbulent kinetic energy
F1, F2blending or auxiliary fuctions in turbulence model
β′, β1, β2the constant parameters
α1, σk1, σk2, σω1, σω2the constant parameters

References

  1. Liu, C. Researches and Developments of Axial-flow Pump System. Trans. Chin. Soc. Agric. Mach. 2015, 46, 49–59. [Google Scholar]
  2. Shi, L.J.; Jiao, H.F.; Gou, J.L.; Yuan, Y.; Tang, F.P.; Yang, F. Influence of backflow gap size on hydraulic performance of full-flow pump. Trans. Chin. Soc. Agric. Mach. 2020, 51, 139–146. [Google Scholar]
  3. Shi, L.J.; Yuan, Y.; Jiao, H.F.; Tang, F.P.; Cheng, L.; Yang, F.; Jin, Y.; Zhu, J. Numerical investigation and experiment on pressure pulsation characteristics in a full tubular pump. Renew. Energy 2021, 163, 987–1000. [Google Scholar] [CrossRef]
  4. Shi, L.J.; Zhang, W.P.; Jiao, H.F.; Tang, F.P.; Wang, L.; Sun, D.D.; Shi, W. Numerical simulation and experimental study on the comparison of the hydraulic characteristics of an axial-flow pump and a full tubular pump. Renew. Energy 2020, 153, 1455–1464. [Google Scholar] [CrossRef]
  5. Li, D.Y.; Yu, L.; Yan, X.Y.; Wang, H.J.; Shi, Q.; Wei, X.Z. Runner cone optimization to reduce vortex rope-induced pressure fluctuations in a Francis turbine. Sci. China Technol. Sci. 2021, 64, 1953–1970. [Google Scholar] [CrossRef]
  6. Li, D.Y.; Ren, Z.P.; Li, Y.; Miao, B.X.; Gong, R.Z.; Wang, H.J. Thermodynamic effects on pressure fluctuations of a liquid oxygen turbopump. J. Fluids Eng. Trans. ASME 2021, 143, 111401. [Google Scholar] [CrossRef]
  7. Chirag, T.; Michel, J.C. Fluid-structure interactions in Francis turbines: A perspective review. Renew. Sustain. Energy Rev. 2017, 68 Pt 1, 87–101. [Google Scholar]
  8. Dorji, U.; Ghomashchi, R. Hydro turbine failure mechanisms: An overview. Eng. Fail. Anal. 2014, 44, 136–147. [Google Scholar] [CrossRef]
  9. Zhou, L.J.; Wang, Z.W.; Xiao, R.F.; Luo, Y.Y. Analysis of dynamic stresses in Kaplan turbine blades. Eng. Comput. 2007, 24, 753–762. [Google Scholar] [CrossRef]
  10. Wu, G.K.; Luo, X.Q.; Feng, J.J.; Li, W.F. Cracking reason for Francis turbine blades based on transient fluid structure interaction. Trans. Chin. Soc. Agric. Mach. 2015, 31, 92–98. [Google Scholar]
  11. Fu, X.L.; Zuo, Z.G.; Chang, H.; Li, D.Y.; Wang, H.J.; Wei, X.Z. Mechanism of low frequency high amplitude pressure fluctuation in a pump-turbine during the load rejection process. J. Hydraul. Res. 2021, 59, 280–297. [Google Scholar] [CrossRef]
  12. Li, D.Y.; Chang, H.; Zuo, Z.G.; Wang, H.J.; Liu, S.H. Aerodynamic characteristics and mechanisms for bionic airfoils with different spacings. Phys. Fluids 2021, 33, 64101. [Google Scholar] [CrossRef]
  13. Kan, K.; Zheng, Y.; Fu, S.F.; Yang, C.X.; Zhang, X. Dynamic stress of impeller blade of shaft extension tubular pump device based on bidirectional fluid-structure interaction. J. Mech. Sci. Technol. 2017, 31, 1561–1568. [Google Scholar] [CrossRef]
  14. Kan, K.; Zheng, Y.; Chen, H.X. Study into the Improvement of Dynamic Stress Characteristics and Prototype Test of an Impeller Blade of an Axial-Flow Pump Based on Bidirectional Fluid–Structure Interaction. Appl. Sci. 2019, 9, 3601. [Google Scholar] [CrossRef] [Green Version]
  15. Schneider, A.; Will, B.; Böhle, M. Numerical Evaluation of Deformation and Stress in Impellers of Multistage Pumps by Means of Fluid Structure Interaction. In Proceedings of the ASME 2013 Fluids Engineering Division Summer Meeting, Incline Village, NV, USA, 7–11 July 2013; pp. 1–10. [Google Scholar]
  16. Pei, J.; Meng, F.; Li, Y.J.; Yuan, S.Q.; Chen, J. Fluid–structure coupling analysis of deformation and stress in impeller of an axial-flow pump with two-way passage. Adv. Mech. Eng. 2016, 8, 1–11. [Google Scholar] [CrossRef] [Green Version]
  17. Zhang, L.J.; Wang, S.; Yin, G.J.; Guan, C.N. Fluid–structure interaction analysis of fluid pressure pulsation and structural vibration features in a vertical axial pump. Adv. Mech. Eng. 2019, 11, 1687814019828585. [Google Scholar] [CrossRef] [Green Version]
  18. Li, W.; Yang, Y.F.; Shi, W.D.; Ji, L.L.; Jiang, X.P. Mechanical Properties of Mixed-flow Pump Impeller Based on Bidirectional Fluid-structure Interaction. Trans. Chin. Soc. Agric. Mach. 2015, 46, 82–88. [Google Scholar]
  19. Li, W.; Ji, L.L.; Shi, W.D.; Jiang, X.P.; Zhang, Y. Vibration characteristics of the impeller at multi-conditions in mixed-flow pump under the action of fluid-structure interaction. J. Vibroeng. 2016, 18, 3213–3224. [Google Scholar] [CrossRef]
  20. Li, C.Y.; Zheng, Y.; Zhang, Y.Q.; Kan, K.; Xue, X.Y.; Rodriguez, E.F. Stability Optimization and Analysis of a Bi-Directional Shaft Extension Pump. J. Fluids Eng. 2020, 142, 071203. [Google Scholar] [CrossRef]
  21. Deng, Z.P.; Hu, Q.H.; Dong, Y.F.; Li, Y. Comparison between one-way and two-way fluid-structure interaction simulations of a horizontal tidal current turbine. In Proceedings of the Second Conference of Global Chinese Scholars on Hydrodynamics, Wuxi, China, 11–14 November 2016; pp. 222–228. [Google Scholar]
  22. Benra, F.K.; Dohmen, H.J.; Pei, J.; Schuster, S.; Wan, B. A Comparison of One-Way and Two-Way Coupling Methods for Numerical Analysis of Fluid-Structure Interactions. J. Appl. Math. 2011, 2011, 853560. [Google Scholar] [CrossRef]
  23. Zhu, R.; Chen, D.D.; Wu, S.W. Unsteady Flow and Vibration Analysis of the Horizontal-Axis Wind Turbine Blade under the Fluid-Structure Interaction. Shock. Vib. 2019, 2019, 3050694. [Google Scholar] [CrossRef]
  24. Javanmardi, N.; Ghadimi, P. Hydroelastic analysis of surface-piercing propeller through one-way and two-way coupling approaches. Proc. Inst. Mech. Eng. Part M J. Eng. Marit. Environ. 2019, 233, 844–856. [Google Scholar] [CrossRef]
  25. Wijesooriya, K.; Mohotti, D.; Amin, A.; Chauhan, K. Comparison between an uncoupled one-way and two-way fluid structure interaction simulation on a super-tall slender structure. Eng. Struct. 2021, 229, 111636. [Google Scholar] [CrossRef]
  26. Shi, L.J.; Zhu, J.; Yuan, Y.; Tang, F.P.; Huang, P.L.; Zhang, W.P.; Liu, H.Y.; Zhang, X.W. Numerical Simulation and Experiment of the Effects of Blade Angle Deviation on the Hydraulic Characteristics and Pressure Pulsation of an Axial-Flow Pump. Shock. Vib. 2021, 2021, 6673002. [Google Scholar]
  27. Menter, F.R. Two-equation eddy-viscosity turbulence models for engineering applications. AIAA-J. 1994, 32, 1598–1605. [Google Scholar] [CrossRef] [Green Version]
  28. Li, D.E.; Song, Y.C.; Lin, S.; Wang, H.J.; Qin, Y.L.; Wei, X.Z. Effect mechanism of cavitation on the hump characteristic of a pump-turbine. Renew. Energy 2021, 167, 369–383. [Google Scholar] [CrossRef]
  29. Ji, L.L.; Li, W.; Shi, W.D.; Tian, F.; Agarwal, R. Diagnosis of internal energy characteristics of mixed-flow pump within stall region based on entropy production analysis model. Int. Commun. Heat Mass Transf. 2020, 117, 104784. [Google Scholar] [CrossRef]
  30. Shi, L.J.; Zhu, J.; Tang, F.P.; Wang, C. Multi-Disciplinary Optimization Design of Axial-Flow Pump Impellers Based on the Approximation Model. Energies 2020, 13, 779. [Google Scholar] [CrossRef] [Green Version]
  31. Kang, C.; Zhu, Y.; Li, Q. Effects of hydraulic loads and structure on operational stability of the rotor of a molten-salt pump. Eng. Fail. Anal. 2020, 117, 104821. [Google Scholar] [CrossRef]
  32. Peng, G.J.; Zhang, Z.R.; Bai, L. Wet Modal Analyses of Various Length Coaxial Sump Pump Rotors with Acoustic-Solid Coupling. Shock. Vib. 2021, 2021, 8823150. [Google Scholar]
  33. Qi, Y. Stress and Modal Analysis of Bi-Directional Pump Blades. Master’s Thesis, Yangzhou University, Yangzhou, China, 2015. [Google Scholar]
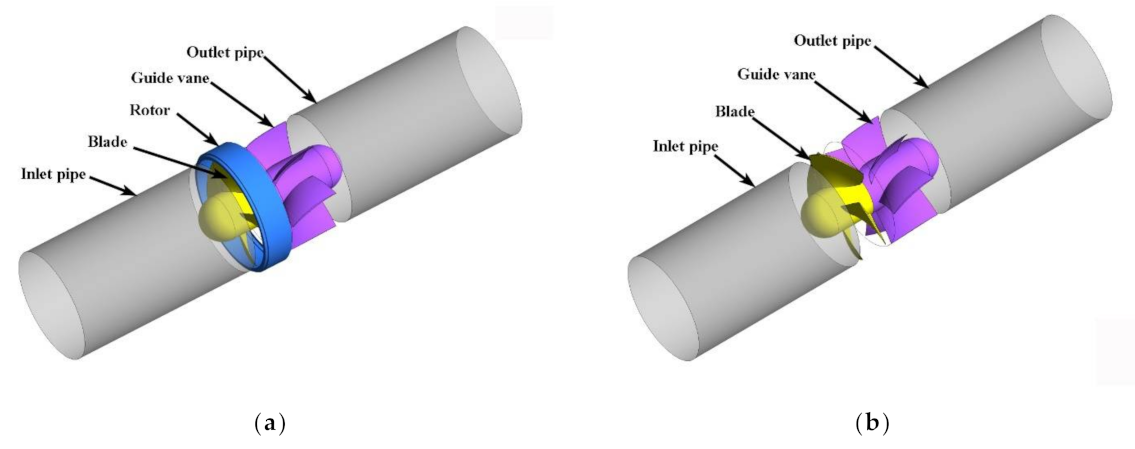
Figure 1. The pump model type: (a) the full tubular pump, (b) the axial-flow pump.
Energies 14 06395 g001
Figure 2. The generated gird of the impeller and rotor: (a) the grid of blade, (b) the grid of rotor.
Energies 14 06395 g002
Figure 3. Impeller structure model: (a) the full tubular pump impeller, (b) the axial-flow pump impeller.
Energies 14 06395 g003
Figure 4. The grid of the impeller structure: (a) the full tubular pump impeller grid, (b) the axial-flow pump impeller grid.
Energies 14 06395 g004
Figure 5. Flowchart of the FSI simulation.
Energies 14 06395 g005
Figure 6. The model test bench for the pump device.
Energies 14 06395 g006
Figure 7. Performance curve verification.
Energies 14 06395 g007
Figure 8. Pressure distribution on the blade surface of the full tubular pump under the flow Qbep: (a) the pressure distribution of the blade PS, (b) the pressure distribution of the blade SS.
Energies 14 06395 g008
Figure 9. Pressure distribution on the blade surface of the axial-flow pump under the flow Qbep: (a) the pressure distribution of the blade PS, (b) the pressure distribution of the blade SS.
Energies 14 06395 g009
Figure 10. Deformation distribution of the blade PS between the full tubular pump and axial-flow pump: (a) the total deformation under 0.8 Qbep, (b) the total deformation under Qbep, (c) the total deformation under 1.1 Qbep.
Energies 14 06395 g010
Figure 11. Equivalent Stress distribution of the blade PS between the full tubular pump and axial-flow pump: (a) the equivalent stress under 0.8 Qbep, (b) the equivalent stress under Qbep, (c) the equivalent stress under 1.1 Qbep.
Energies 14 06395 g011
Figure 12. Simplified figures of impeller structural mechanics: (a) the axial-flow pump, (b) the full tubular pump.
Energies 14 06395 g012
Figure 13. The wire frame path at the blade rim.
Energies 14 06395 g013
Figure 14. The stress distribution of the blade rim: (a) 0.8 Qbep, (b) Qbep, (c) 1.1 Qbep.
Energies 14 06395 g014
Figure 15. Comparison of MTD and MES between ULP and LP.
Energies 14 06395 g015
Figure 16. The flowchart of the modal analysis.
Energies 14 06395 g016
Figure 17. Vibration mode shape in each order modal of the full tubular pump: (a) First-order mode, (b) Second-order mode, (c) Third-order mode, (d) Fourth-order mode, (e) Fifth-order mode, (f) Sixth-order mode.
Energies 14 06395 g017aEnergies 14 06395 g017b
Table 1. The main design parameters of the pump device.
ParameterImpeller Diameter D (mm)Rotation Speed n (r/min)Design Flow Qbep (L/s)Design Head H (m)Blade NumberGuide Vane Number
Value3509503903.247
Table 2. The material properties of the impeller.
ParameterDensity ρ/(kg·m−3)Young Modulus E/MPaPoisson Ratio ΦYield Strength σs/MPa
Value77802030.29550
Table 3. Modal natural frequency.
ModeFirst-Order Frequency/HzSecond-Order Frequency/HzThird-Order Frequency/HzFourth-Order Frequency/HzFifth-Order Frequency/HzSixth-Order Frequency/Hz
Full tubular pump279.9580.6580.7881.1884.4984.4
Axial-flow pump868.7869.8869.8870.11655.81655.9
Table 4. Modal participation factor of the full tubular pump in each mode.
ModeFrequency/HzParticipation Factor
XYZROT.XROT.YROT.Z
1279.90.18 × 10−40.92 × 10−43.0−0.15 × 10−40.23 × 10−4−0.47
2580.6−0.0580.39−0.14 × 10⁻³−0.340.380.39 × 10−4
3580.7−0.39−0.0580.25 × 10−4−0.38−0.34−0.16 × 10⁻⁴
4881.10.23 × 10−30.41 × 10⁻³−0.28 × 10−20.35 × 10−4−0.63 × 10⁻⁴−0.54 × 10⁻³
5884.40.42 × 10−40.72 × 10⁻⁴−2.47−0.19 × 10−50.17 × 10−4−0.55
6984.40.20 × 10−30.18 × 10−30.16 × 10−30.23 × 10⁻⁴−0.29 × 10−40.25 × 10−4
Publisher’s Note: MDPI stays neutral with regard to jurisdictional claims in published maps and institutional affiliations.