Article

Investigations on Pressure Fluctuations in the S-Shaped Region of a Pump–Turbine

1
State Key Laboratory of Hydro-Power Equipment, Harbin 150040, China
2
Harbin Electric Machinery Company Limited, Harbin 150001, China
3
Harbin Institute of Large Electrical Machinery, Harbin 150040, China
4
School of Energy Science and Engineering, Harbin Institute of Technology, Harbin 150001, China
*
Authors to whom correspondence should be addressed.
Energies 2021, 14(20), 6683; https://doi.org/10.3390/en14206683
Submission received: 24 August 2021 / Revised: 4 October 2021 / Accepted: 10 October 2021 / Published: 15 October 2021
(This article belongs to the Special Issue Advances in Pumped Storage Hydraulic System)

Abstract

:
Hydraulic pumped storage is a special power generation and electricity shortage technology, which is usually operated with thermal power and nuclear power units, and plays a key role in ultra-high voltage and smart grid. Pressure fluctuations are the main reasons for the instability of the S-shaped region of pump–turbines, which seriously affects their lifespan and operation stability. To reveal the mechanism and propagation law of pressure fluctuations in the S-shaped region as well as numerical simulations at the turbine, the braking and the reverse pump operating conditions of a pump–turbine were carried out. Numerical results were validated using the performance experiments, and the generation mechanism and propagation law of pressure fluctuation were analyzed in detail. The analyses show that high-amplitude pressure fluctuations mainly occur in the braking and reverse pump operating conditions. Under the braking condition, a 0.49-fn low-frequency pressure fluctuation was captured, which is caused by the rotation of the backflow in the vanes. Under the reverse pump condition, a 0.19-fn low-frequency pressure fluctuation was confirmed, which is caused by the periodic rotation of the vortex between the vaneless space. This study has important guiding significance for practical engineering application.

1. Introduction

In the past decade, the demand for renewable energy has been increasing, and solar power plants and river hydropower stations have been constructed on a large scale, contributing to the protection of water resources and ecosystems [1]. In 2020, Portuguese scholar Simao conducted a multi-standard assessment based on hydraulic, solar, and wind energy to explore the best method for flexibility, reliability, and sustainability of electricity storage [2]. Among various methods, pumped storage is a technology with a better economy and high maturity, and its proportion is continuously increasing [3]. Pumped storage power stations play a key role to realize the peak, frequency and phase regulation tasks of the power grid in different periods through power regulation [4,5]. As the main part of pumped storage unit, a pump–turbine has two working states in pump and turbine modes, which need to be constantly switched during operation, resulting in more complex operating conditions. Therefore, it is necessary to ensure the operation stability of a pump–turbine momentarily in practical engineering [6,7].
Under turbine operating conditions, the units may enter the S-shaped region of the pump–turbine, which would produce serious vibrations and noise, and even lead to the failure of grid connection [8]. Under different guide vane openings, the unit characteristic curve is S-shaped [9], and the same rotational speed corresponds to multiple discharges, which makes the operating point fluctuate between the turbine condition, the braking, and the reverse pump operating condition. This is the main reason why the power fluctuations occurred in the transient process, and why the grids cannot be connected [10]. When pump–turbines are in the reverse pump operating condition, the rotational speed of the runner continuously increases, which may eventually lead to the failure of the unit [11]. Scholars believe that the incorrect rotational speed directly causes dangerous operating conditions of the pump–turbine, but they seldom fundamentally reveal the deeper causes and propagation laws of the pressure fluctuation in each domain. In order to obtain a more accurate S-shaped characteristic curve, Casartelli et al. [12] uses explicit algebraic Reynolds stress model with stable boundary conditions in unstable regions, which is better than the two-equation linear turbulence model. Hasmatuchi et al. [13] used high-speed photographing technology to visualize the flow patterns in vaneless space, and observed that there were correlations between the rotational stall phenomenon and the formation of the S-shaped characteristic when the pump–turbine operated under off-design conditions. However, their study only referred to the correlation between the rotating stall in vaneless region and the unstable operating conditions of the pump–turbine, without elaborating the specific degree of action and influence law. Based on the above research, Sun et al. [14] carried out numerical simulations with misaligned guide vanes. Frequency spectral analysis found that the S-shaped characteristic curve was affected by the angle between the guide vanes and the blades in the low-discharge operating region, and that the vortex formed in the vaneless space was the main reason for the S-shaped characteristic. Rezghi et al. [15] simulated the runaway condition of the transition process of two pump–turbines. The sensitivity analysis found that the inertia moment of the runner had a great influence on the torque of the runner, and that the increase in the inertia moment could delay the peak value of the rotational speed and pressure. In 2012, Olimstad et al. [16] used a throttle valve to increase friction loss in experiments under the turbine operating condition, and to accurately measure the full characteristics of the S-shaped region. To further alleviate the hydraulic instability in the S-shape region, Houdeline et al. [17] took the high-head pump–turbine as an example and adopted the optimization design method of synchronous guide vanes. The experimental verification and numerical simulation results demonstrated that this method could increase the stable operation range of the units under the high-head condition. In view of the S-shaped characteristic, numerous studies gave the fundamental mechanism through advanced experimental techniques. Based on the analysis of discharge and vortex structure, this paper further expounds the causes and propagation law of pressure fluctuations by transverse comparison of a time domain and a frequency domain of pressure fluctuations in each domain.
To trace the origin of unstable factors in the S-shaped region, numerous studies were conducted from the perspective of blade structure and internal flow. Early in 20th century, Japanese researcher Yamabe [18] tried to modify the geometric shape of the runner outlet and obtained the performance characteristics of the modified pump–turbine. The experimental data proved that increasing the swept angle of the blade could inhibit or eliminate the hysteresis effect, and the results were applied to the Francis pump–turbine and the operation stability was improved. Compared with the experimental data with simulations, Rodriguez et al. [19] found that the runner shape had a significant impact on the stability of a pump–turbine. They believed that the rotor–stator interaction in vaneless space led to the main pressure fluctuations and then proposed a qualitative determination method. From a hydraulic point of view, Jean-Bernard et al. [20] analyzed that, under the condition of small guide vane opening, by modifying the geometric profile of blades or guide vanes, the operation stability of the pump–turbine can be improved and the lifespan of pump–turbines can be increased. Subsequently, Nielsen et al. [21] built the reversible pump–turbine model and found that when guide vanes were pre-opened, the runner force was asymmetric due to the pump–turbine increase discharge, which caused severe pressure fluctuations. In the study of internal flow characteristics, Gentner et al. [22] observed the flow pattern and found that there was a main vortex in the flow channel. The vortex not only extends to vaneless space, but also caused the secondary flow in the runner. It is considered that the formation of the vortex is closely related to the shape of the runner blade. Widmer et al. [23] found that the flow blockage caused by static vortex and stall vortex existed in the turbine braking operating condition, which was attributed to the operation instability. According to momentum conservation, it was deduced that the rotating stall propagated at 60% of the rotational speed of the pump–turbine.
Due to the pressure fluctuations widespread existing in pump–turbines, the flow stability is seriously affected by high amplitude pressure fluctuations, which threatens the safe operation of the units, especially in the S-shaped region. Hence, it is necessary to study the generation mechanism and propagation law of pressure fluctuations under different operating conditions in the S-shape region. In this study, the turbine, braking, and reverse pump operating conditions in the S-shaped region were selected to perform unsteady numerical simulations. The generation mechanism and propagation law of high amplitude pressure fluctuation were analyzed in detail.

2. Research Object and Numerical Methods

2.1. Research Object Analysis

In the field of the pump–turbine design, the unit speed (n11), the unit torque (T11), and the unit discharge (Q11) are critical design parameters which directly represent the performance of the unit (expressed as n 11 = n D 2 / H , T 11 = T / n 2 D 2 5 , Q 11 = Q / D 2 2 H , respectively). With the increase in the unit speed n11, the inlet velocity of the pump–turbine in the direction of the turbine decreases rapidly, making the intersection angle between the opening line and the runaway line very small. The pump–turbine may enter the braking operating condition after reaching the runaway speed. The water inside is driven by its own inertia and then flows into the braking region. Due to its blocking effect on the runner, the speed decreases with the discharge variations. Hence, the opening line begins to bend in the direction of the lower n11 until the runner centrifugal force pushes the water backward, and the unit enters the reverse pump region. The speed will gradually increase, and the iso-open line will bend in the direction of the higher n11.
To explore the change in energy in different operating conditions, the study analyzed the hydraulic loss of the turbine, the braking, the runaway, and the reverse pump operating conditions, and determined the main flow components that affect the S-shaped region of a pump–turbine. The pressure difference in the spiral casing, the stay/guide vanes, the runner, and the draft tube were calculated. The ratio of the value to its total head was used to measure the loss of each component. The pressure loss of each part under the typical operating conditions are shown in Table 1. It is found that the hydraulic loss of the stay/guide vanes and the runner are prominent. Under the reverse pump operating condition, the loss of stay/guide vanes reaches 51.2% of the total loss. The runner has the largest hydraulic loss under the other three operating conditions, and the pressure difference loss reaches the maximum (79.3%) under the runaway operating condition. Based on the above analysis, the study will focus on the stay/guide vanes, runner, and draft tube of the pump–turbine.

2.2. Numerical Simulation Strategy

The present study refers to a pump–turbine in a pumped storage power station through UG NX to establish a three-dimensional model of the entire domain (Figure 1). The specific parameters are listed in Table 2.
In the numerical studies, a turbulence model consistent with the actual flow is important [24,25,26,27]. In order to intuitively reproduce the internal flow conditions at each operating point in the S-shaped region, and comprehensively consider the accuracy of simulation results and the feasibility of calculation resources, the Reynolds averaged Naiver–Stokes (RANS) method was adopted in this study [24]. The common k-ε turbulence model is a two-equation model based on turbulent kinetic energy and turbulent dissipation rate, which is suitable for a high Reynolds number unseparated flow [25]. The k-ω model takes into account the compressibility of the flow and predict the propagation rate of the free shear flow, which is commonly used in the near-wall flow [26,27,28]. In this study, the SST k-ω model provided by commercial software CFX was selected. The k-ω model was used in the near wall position and the k-ε model was used in fully turbulent region, so the calculation accuracy and reliability were well guaranteed. At the designed operating point, the viscous effect is confined to a very thin boundary layer near the blade and can be regarded as an ideal flow outside the boundary layer. Due to the small compressibility of liquid, liquid is usually regarded as incompressible fluid. Since this study only considered the dynamic characteristics of the fluid and did not study the temperature change, the studied fluid was approximately regarded as isothermal incompressible, and the kinematic viscosity ν and dynamic viscosity μ were evenly distributed. The turbine condition of the pump–turbine was selected for the calculation. To obtain high-precision convergence results in a short time, the spiral casing inlet was selected to be on the flow inlet of the vertical surface in the inflow direction, and the outlet of draft tube was selected as the pressure boundary condition. For stationary domains such as spiral casing and stay vanes, a stationary interface was set. As for the non-stationary interface involved in the runner domain, the frozen condition was selected in steady-state simulation, and the periodic rotation one in the unsteady-state simulation. The medium studied is a normal temperature fluid, which was given 25 °C in the simulation. Based on actual experimental conditions, the inlet flow rate was 117.15 kg/s, and the outlet pressure was 1 atmospheric pressure.
In this study, the entire passage of the pump–turbine with a 25-mm guide vanes opening was divided into structured grids. To reduce the difficulty of grids division and improve the quality of grids to obtain more accurate simulation results, the entire flow passage was divided into four parts: spiral casing, stay/guide vanes, runner, and draft tube (Figure 2). The wall of the latter three parts were refined to ensure that the y+ is about 1. The number of nodes and quality of each set of grids are listed in Table 3.
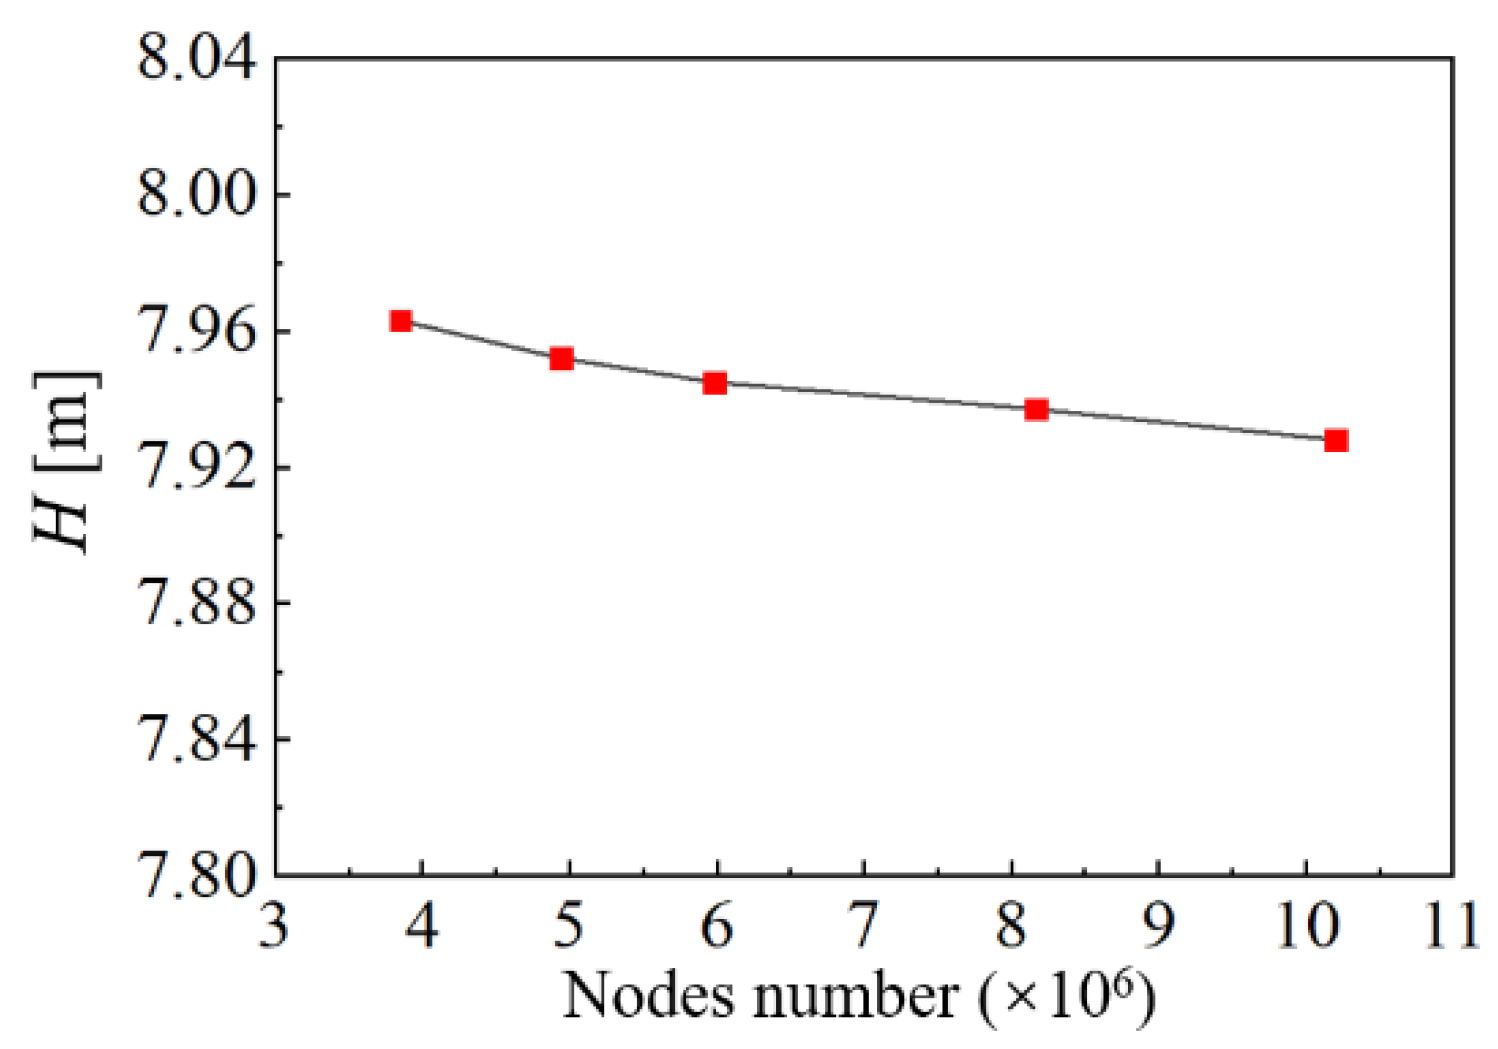
The grid density is also closely related to the simulation accuracy. Under the same conditions, the simulation accuracy is positively related to the grid density, but node distribution that is too dense increases the operation cycle, and the calculation configuration requirements are also improved. The calculated head value H was selected as the criterion for grid independence study. Figure 3 shows that the variation of H is 0.15% when the number of grid nodes increases from 5.98 × 10⁶ to 8.17 × 10⁶. If it continues to increase to 10.2 × 10⁶, the change in H is less than 0.1%, and the systematic error caused by computer floating points is much higher than that caused by the grid density. Considering the time cost and accuracy of calculation, the number of grid nodes in the entire domain 8.17 × 10⁶ was chosen to conduct all numerical simulations.
In this study, steady numerical simulations were conducted to verify the numerical accuracy in the S-shaped region. At a 25-mm guide vane opening, ten operating points were selected, as shown in Figure 4, among which S01 to S04 are in turbine operating condition, S05 is in runaway operating condition, S06 and S07 are in the braking operating condition, and S08 to S10 are in the reverse pump operating condition. The calculated values of speed, discharge, and torque are converted into unit parameters. The curves are drawn as Figure 4.
By comparing and analyzing the experiment and simulations, the flow of the pump–turbine under the high-discharge turbine operating condition is stable and the relative error between the experiments and simulation is lower than 1%, while the error is about 3% under the braking operating condition, and reaches the maximum under the runaway operating condition. Due to the lack of experimental data in the reverse pump operating condition, it can be reasonably predicted by the model experiment. The simulation error of n11 is lower than 7%, and the error of Q11 is not more than 6.8%. The actual leakage of the pump–turbine model cannot be considered in simulations, and the influence of a factor, such as fluid compressibility, is not considered. Therefore, the above error is within an acceptable range, and the numerical simulation could reflect the flow characteristics at each operating condition.

2.3. Distribution of Monitoring Points

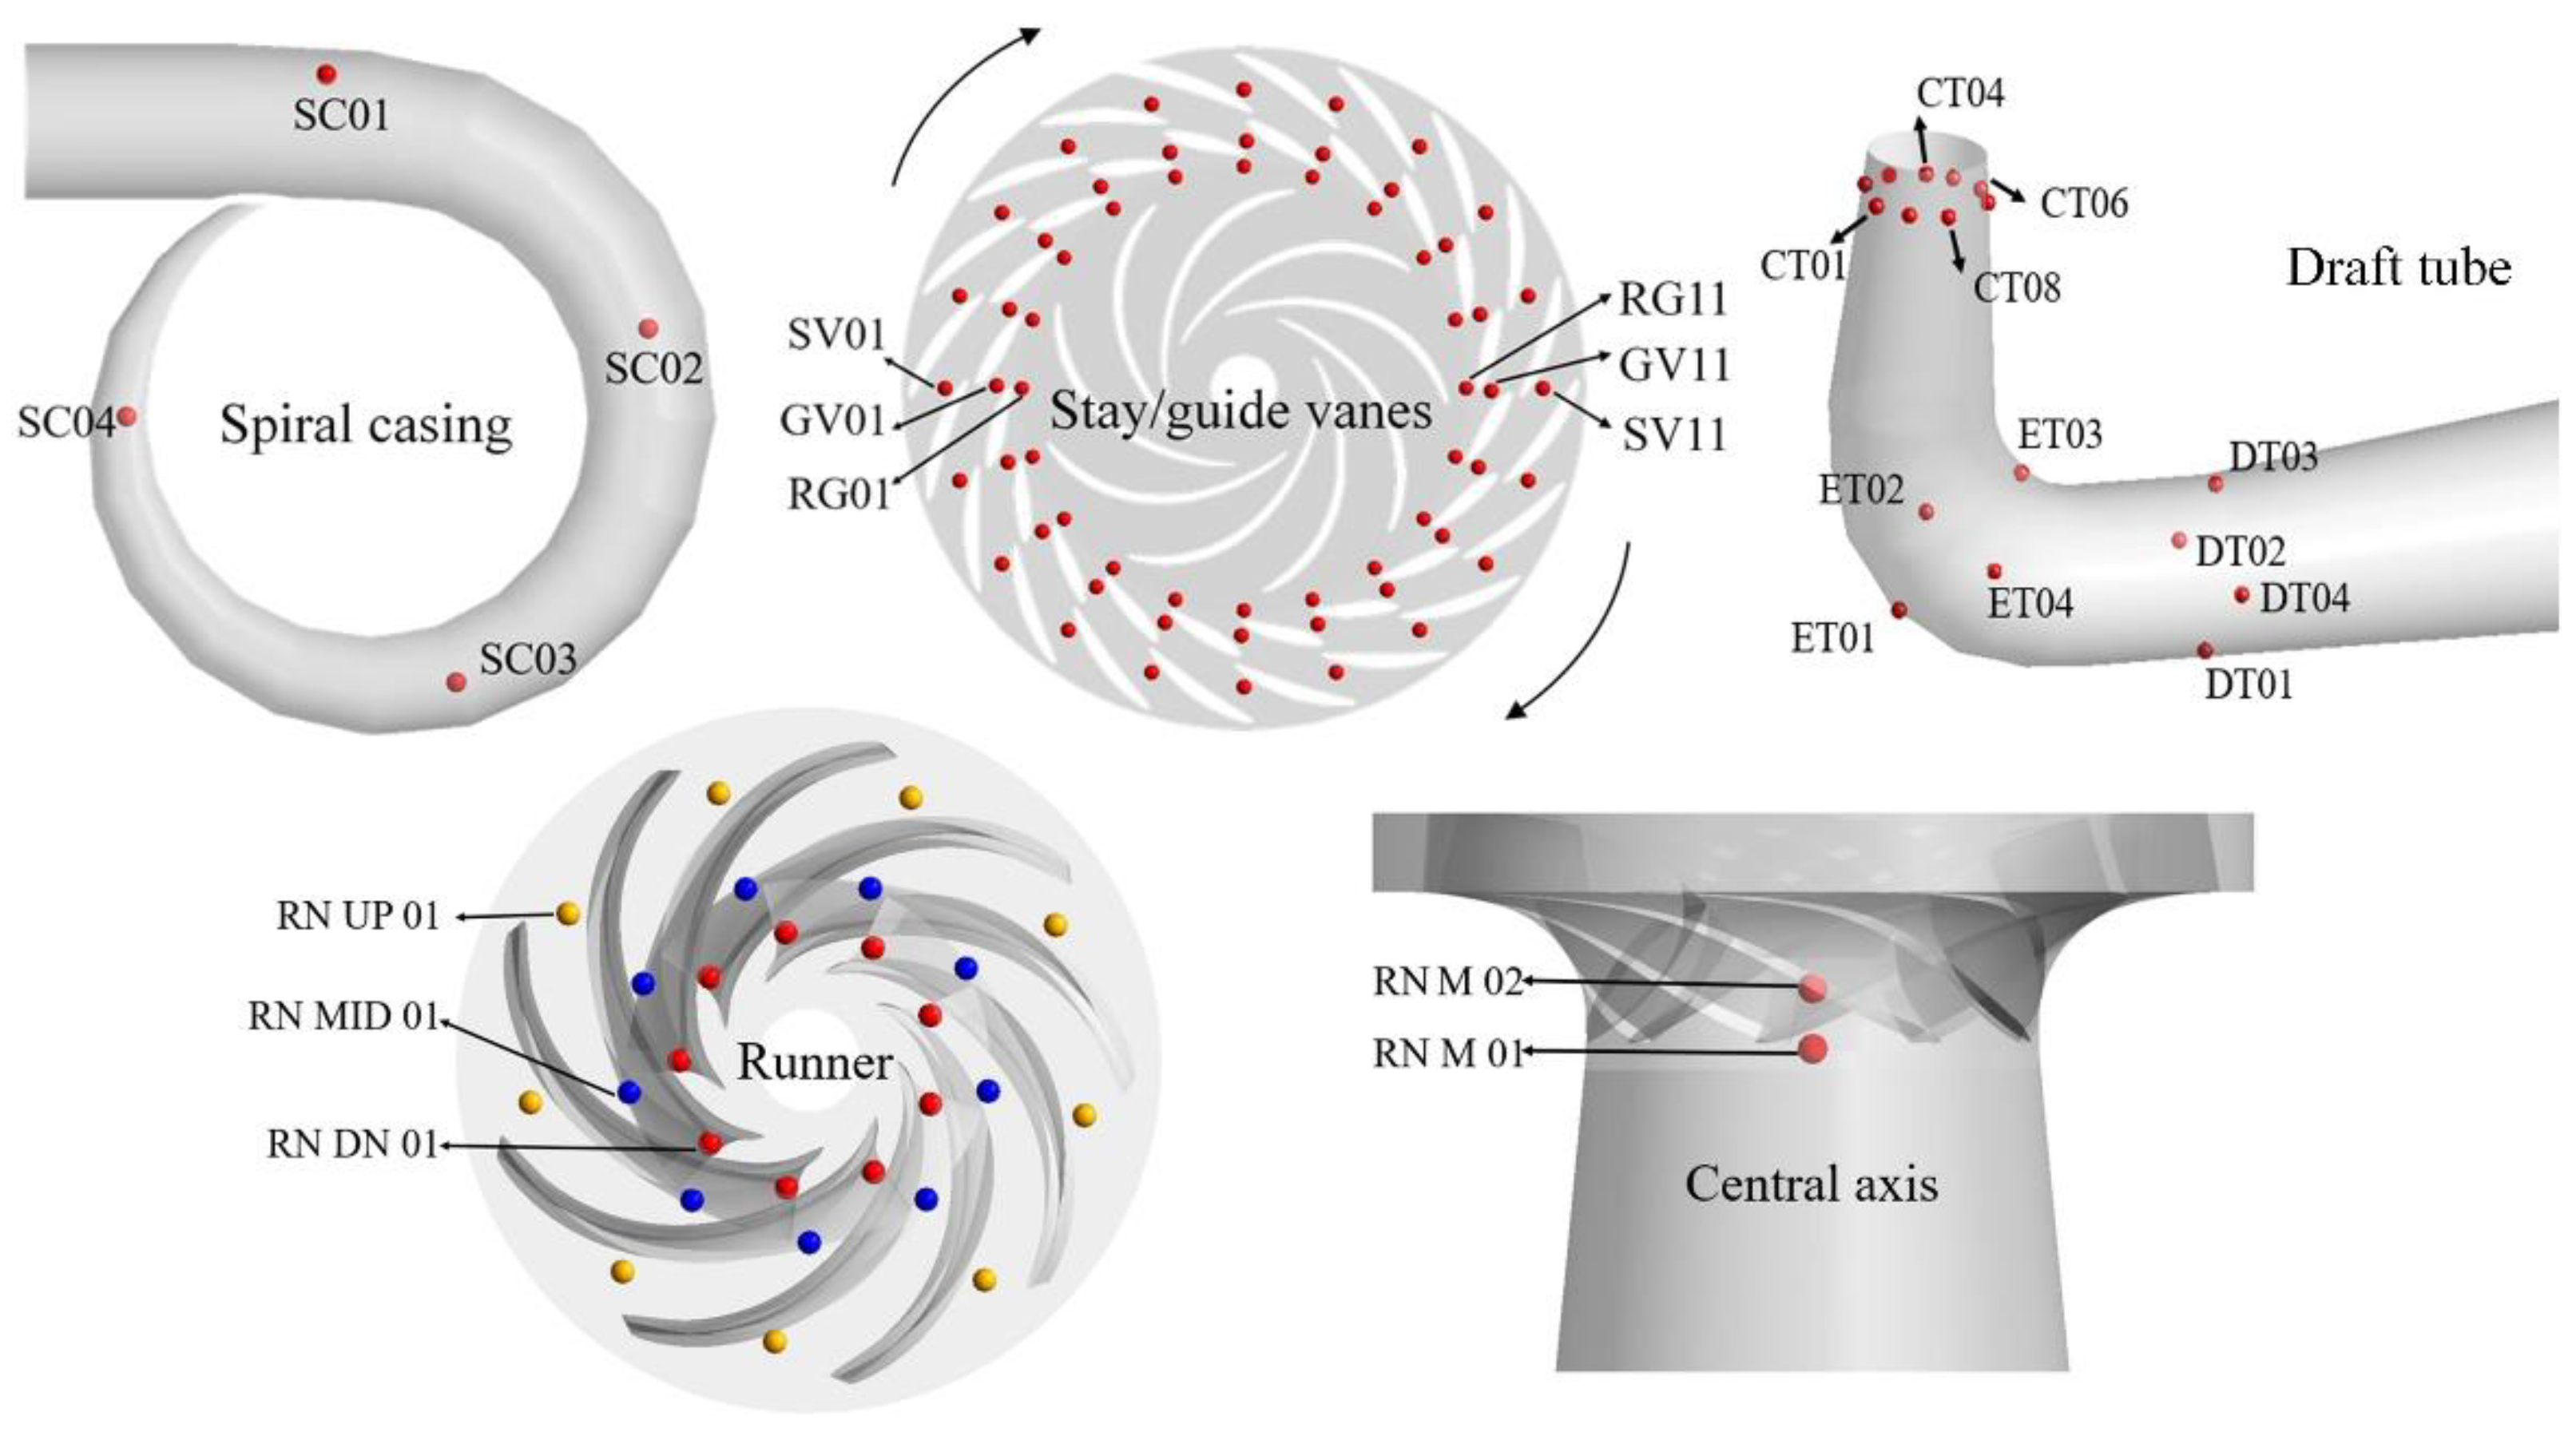
The pressure data extracted by calculation are non-dimensionalized. The dimensionless coefficient is introduced and the monitoring points are set at different positions of the flow channel. The monitoring point at the inlet of spiral casing is SC01, and then the monitoring points SC02-SC04 are set along the flow direction. The interactions between the vortices in each channel of guide vanes and the flow are extremely different under low-discharge conditions in the S-shaped region. Twenty monitoring points are set around stay vanes, namely SV01-SV20, and located in the middle of the upper wall and the lower wall. The monitoring points of guide vanes and vaneless space are the same as those of the stay vanes. The monitoring points of the guide vane domain are GV01-GV20, and the ones in the vaneless space are RG01-RG20, as shown in Figure 5.
The monitoring points of straight cone, elbow, and diffusion section of draft tube were also selected. Considering the high amplitude pressure fluctuations, nine monitoring points were set in its circumferential direction, named CT01-CT09, and four monitoring points were set in the elbow and diffusion sections, named ET01-ET04 and DT01-DT04. Because the runner has a great influence on the entire domain, three measuring points were set in each channel and monitoring points RN M 01 and RN M 02 were set on the central axis, as shown in Figure 5.

3. Results and Discussions

3.1. Pressure Fluctuation Analysis of Turbine Operating Condition

The time and frequency domain diagrams of pressure fluctuation at monitoring point RN UP 01 are shown in Figure 6. The simulated values in the time domain are stable, and the amplitude changes in a stable way. The frequency domain diagram shows that 1 fn is formed due to the rotation of the runner, and that 20 fn is caused by the guide vanes passing periodically. It can be seen that there is are no low-frequency characteristics. The flow status of the turbine condition at monitoring point RN UP 01 is relatively stable.
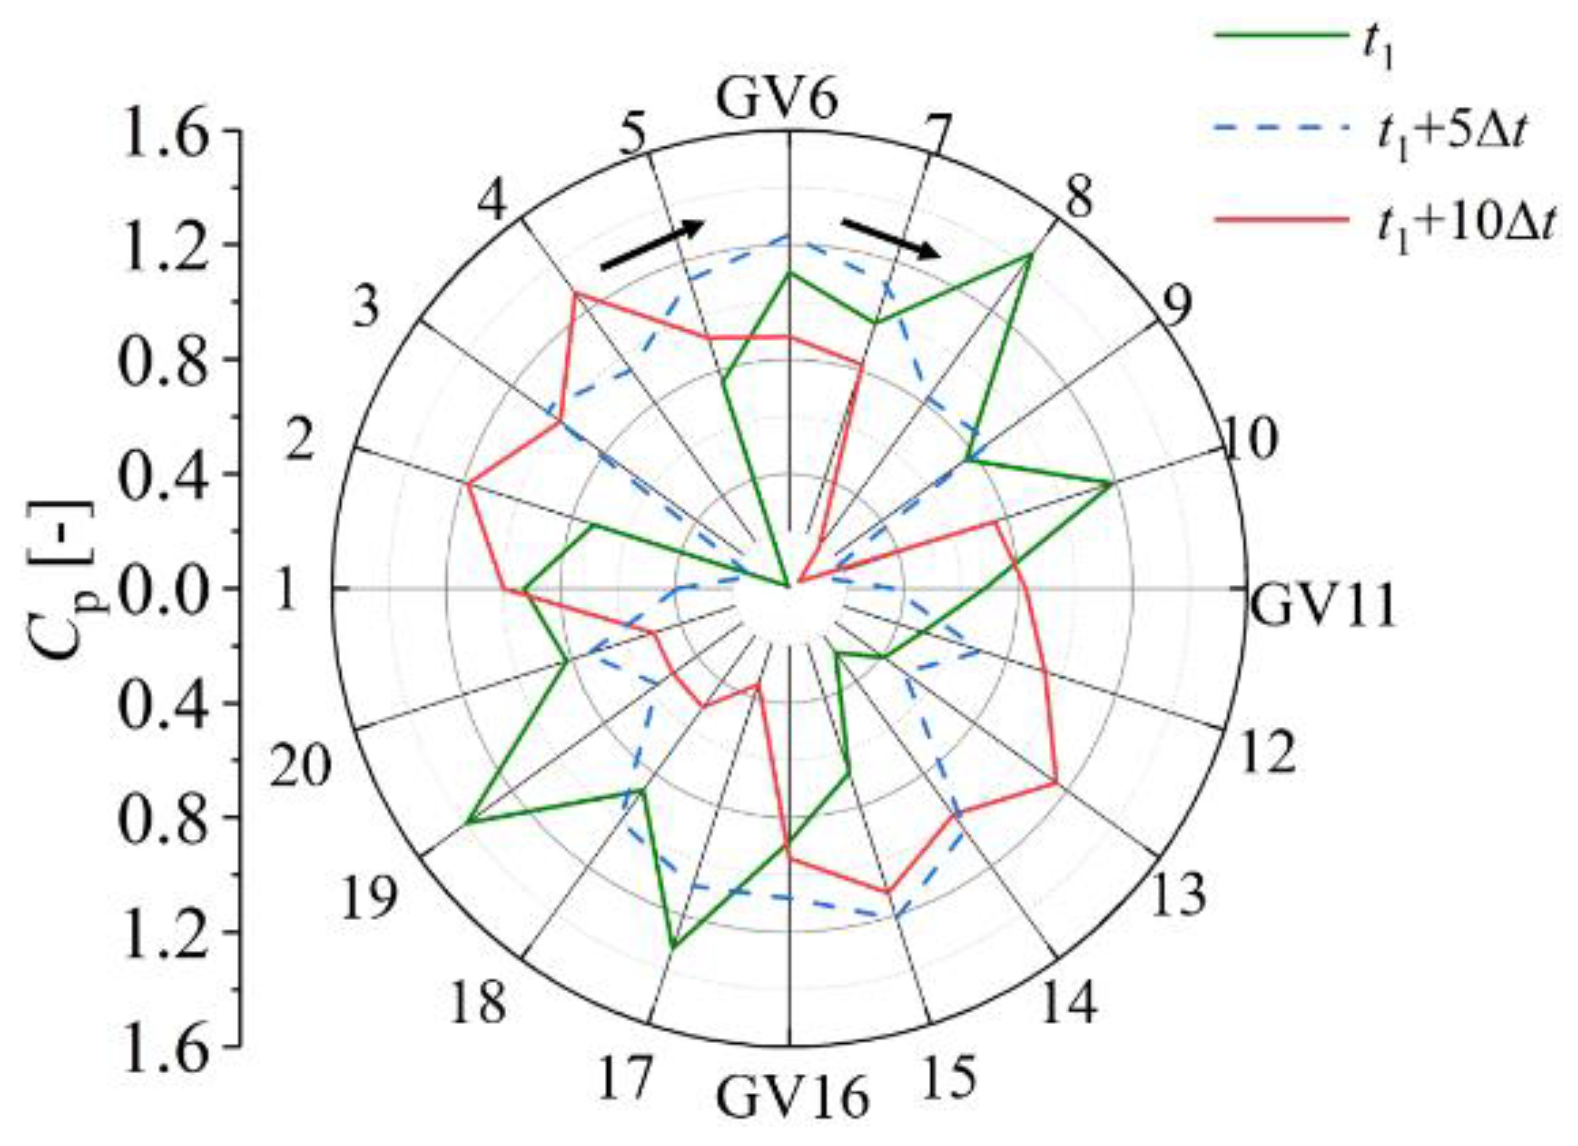
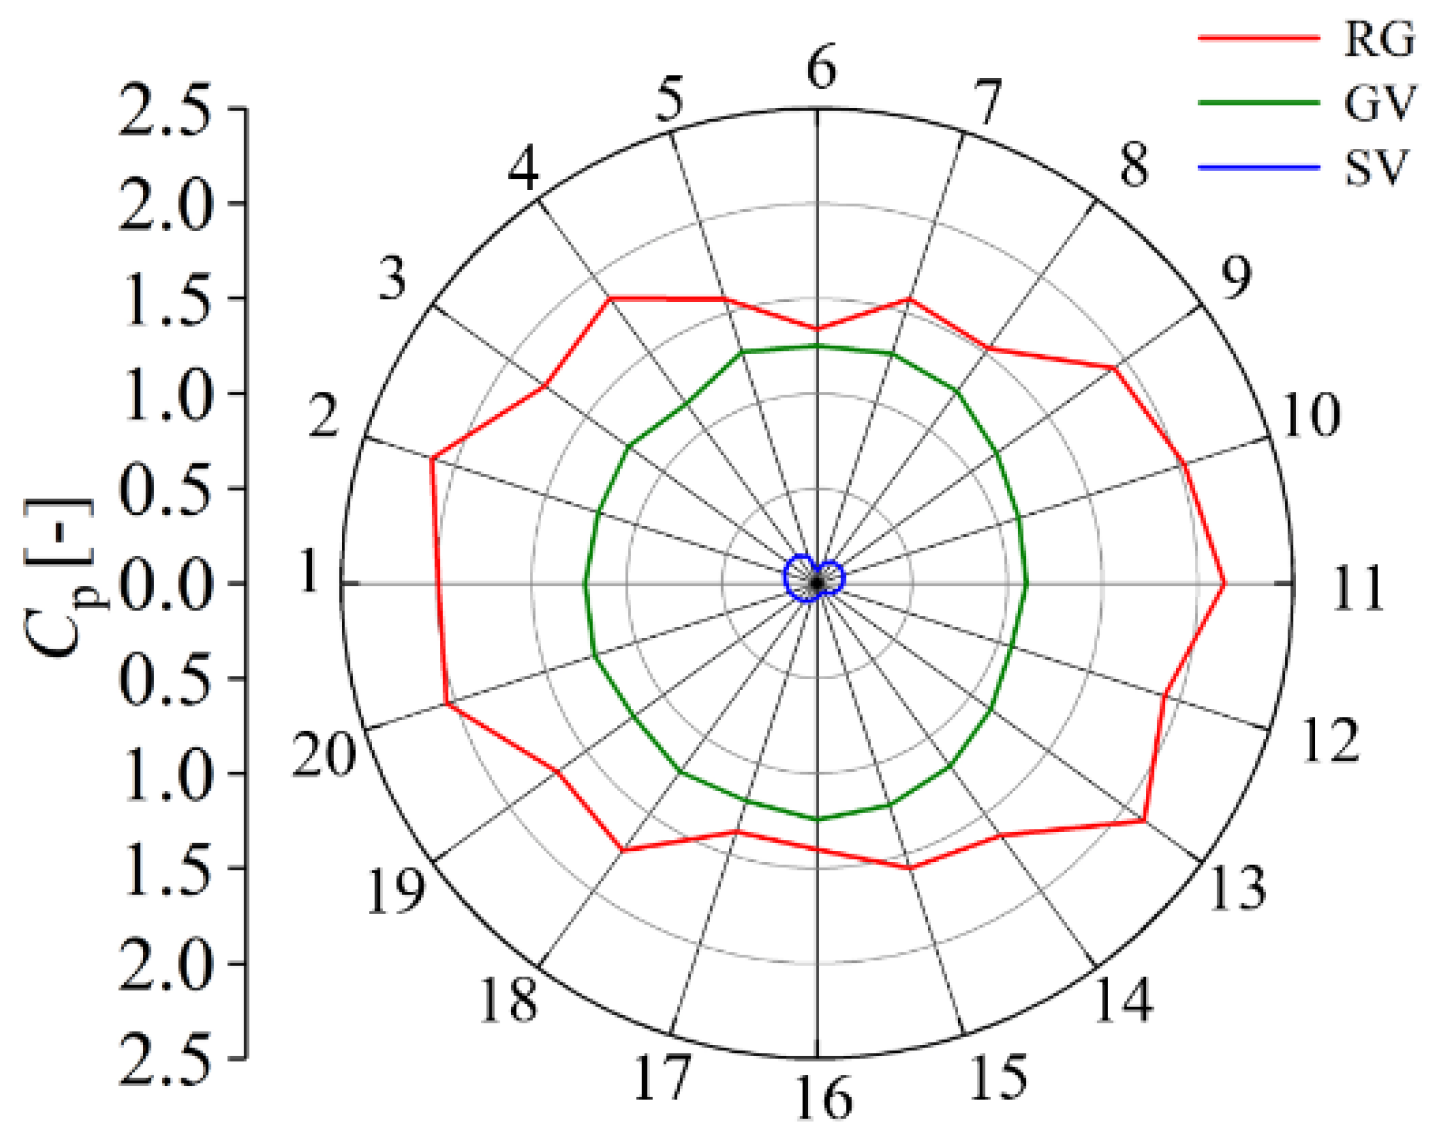
Figure 7 shows the pressure fluctuations of the guide vane monitoring points at t1 = 0.917 s. Moreover, the Cp of each monitoring point are significantly different, but the values of the monitoring points with a phase difference of π are similar. A high value of Cp rotates clockwise with the rotation of the runner when the intercept time changes, and the pressure fluctuation which originates from the rotor–stator interaction between the guide vanes and the runner can be judged. Figure 8 demonstrates high-frequency pressure fluctuation amplitude of different monitoring points after FFT transformation. It can be seen that the pressure fluctuation amplitude of monitoring points in the vaneless space are more intense at the interface between runner and guide vanes. The stay vanes are far from the interface, so its amplitude is lower. Since the flow is very stable under turbine operating condition, the pressure fluctuation amplitudes at the same monitoring point group are close. The monitoring points in stay vanes have small amplitude asymmetry due to the different positions of the outlet at spiral casing, but have little influence on the flow.
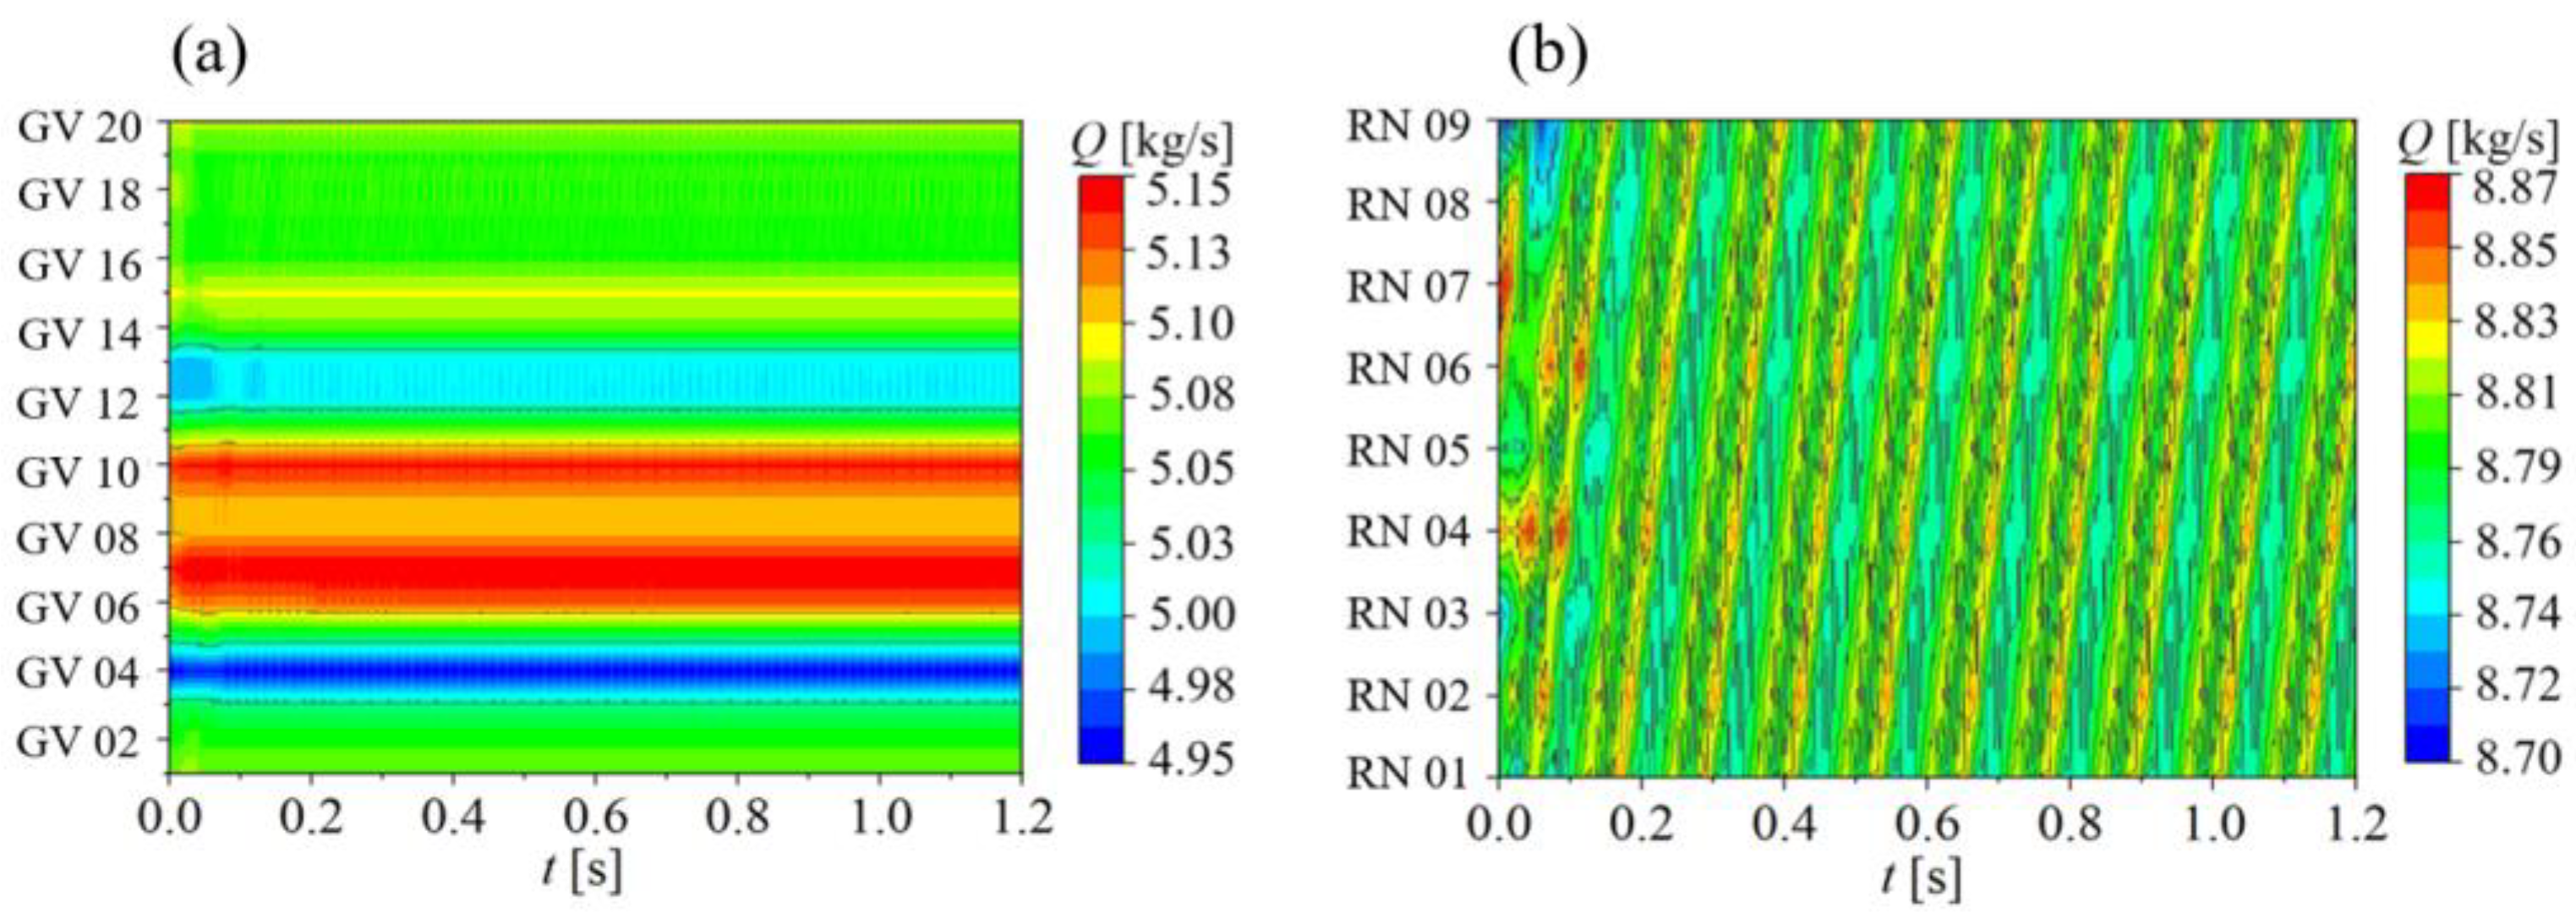
The discharge distributions in the guide vane and runner flow channel are shown in Figure 9. It can be seen that the discharge in the guide vanes has little influence, and that the flow in each channel is relatively stable without obvious change. In the runner flow field, the rotation causes a small and uniform change in the discharge. The above analysis demonstrates that the variation law of discharge can reflect the stability and symmetry of the internal flow in the pump–turbine.

3.2. Pressure Fluctuation Analysis of Braking Operating Condition

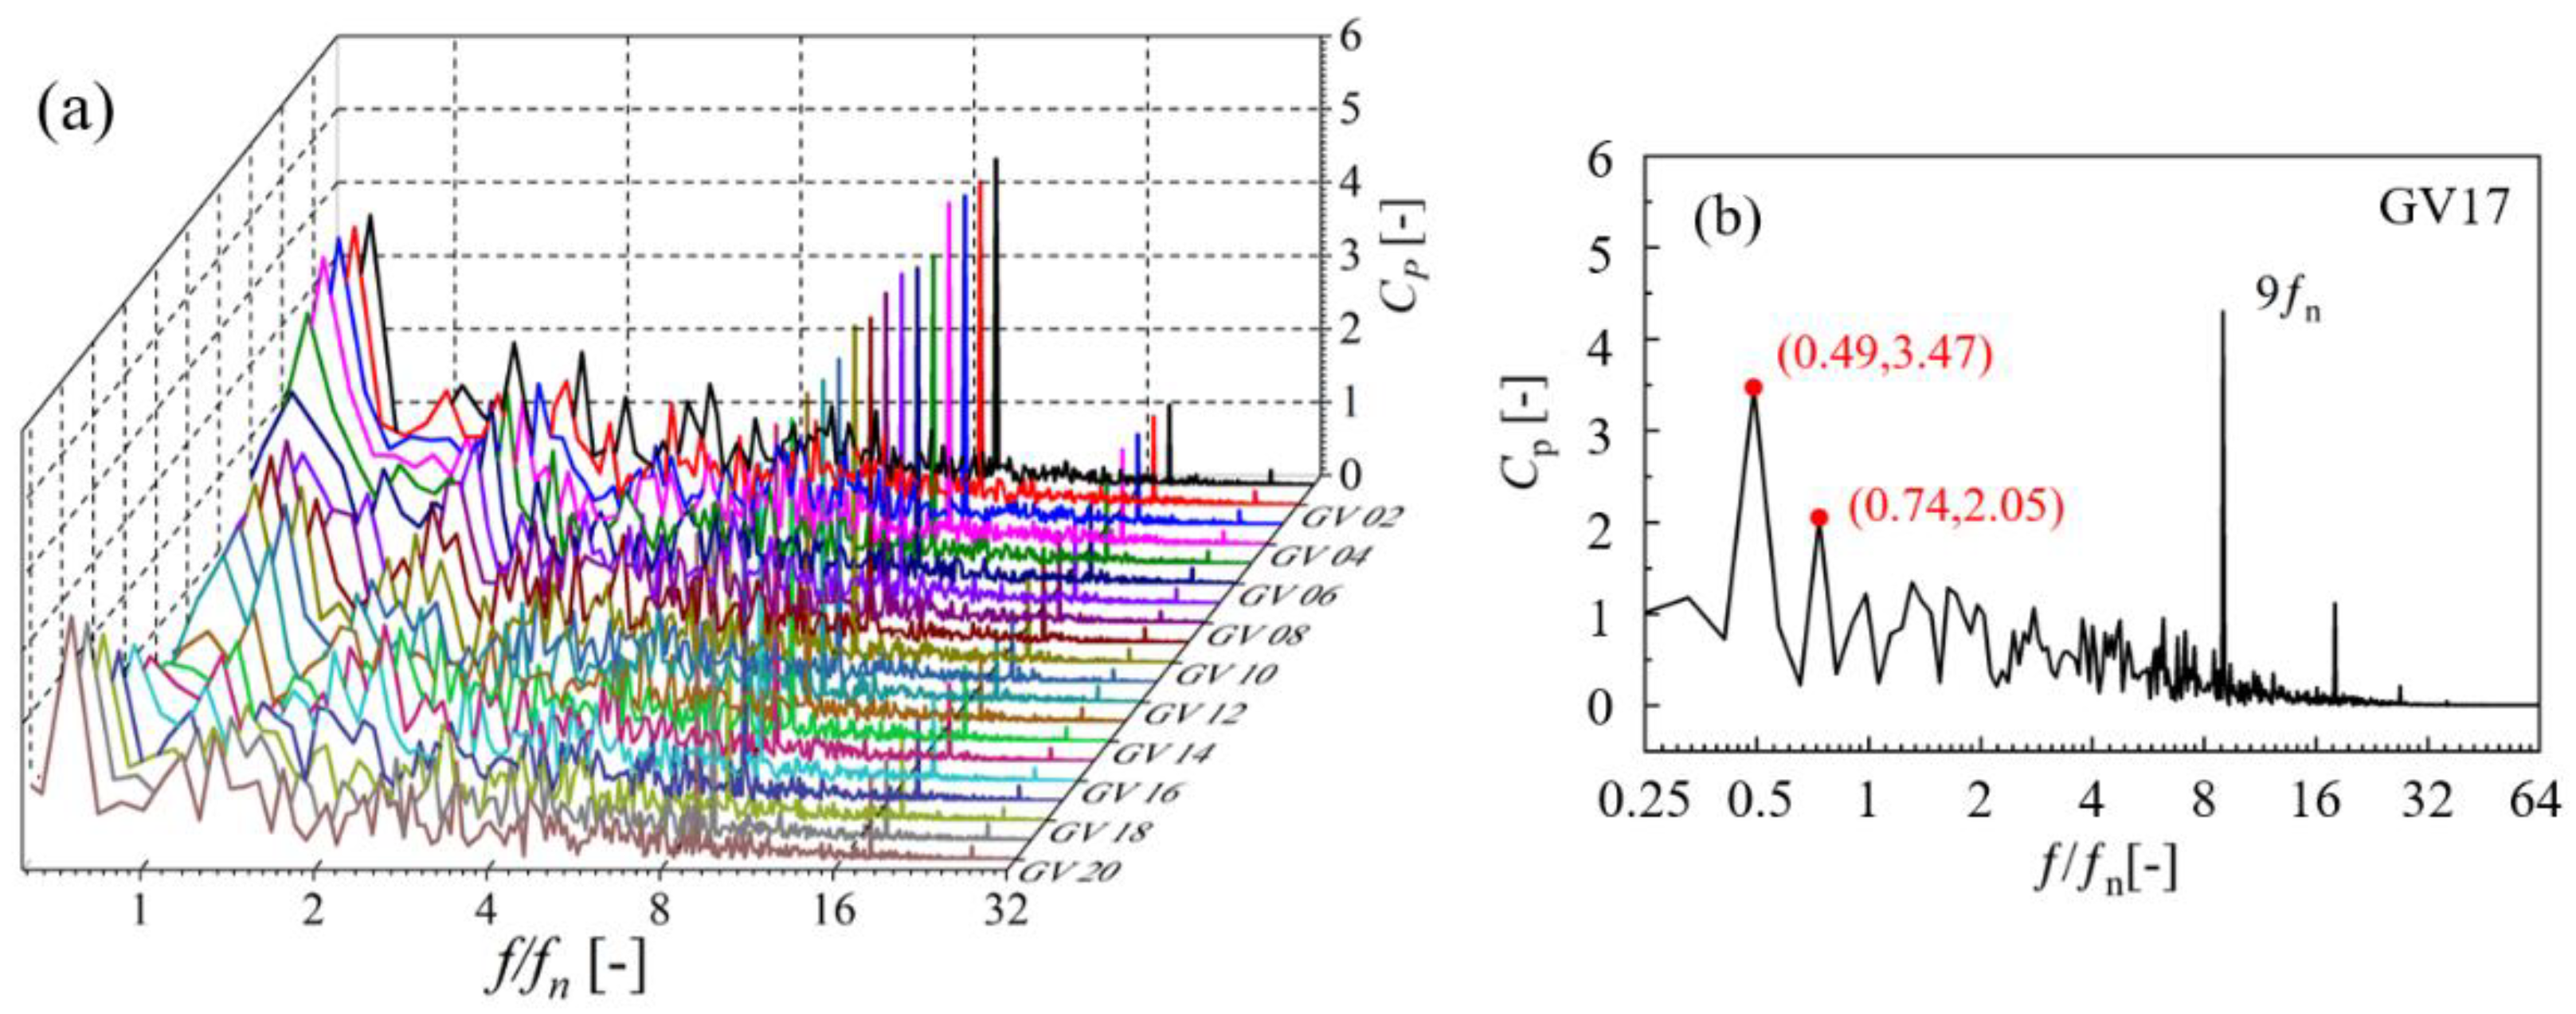
The instability of the guide vane passage has a great influence on the downstream flow characteristics. Figure 10a shows pressure fluctuations of the guide vane monitoring points. The pressure fluctuations under the braking operating condition are more disordered than that of the turbine operating condition, and there are low characteristic frequencies, such as 0.49 fn and 0.74 fn, in the guide vane passage. At monitoring point GV17, the pressure fluctuation amplitudes of 0.49 fn reaches a maximum value of 3.47. In addition, there are also harmonic frequencies of 9 fn and 18 fn generated by the rotor–stator interaction in the flow field, as shown in Figure 10b.
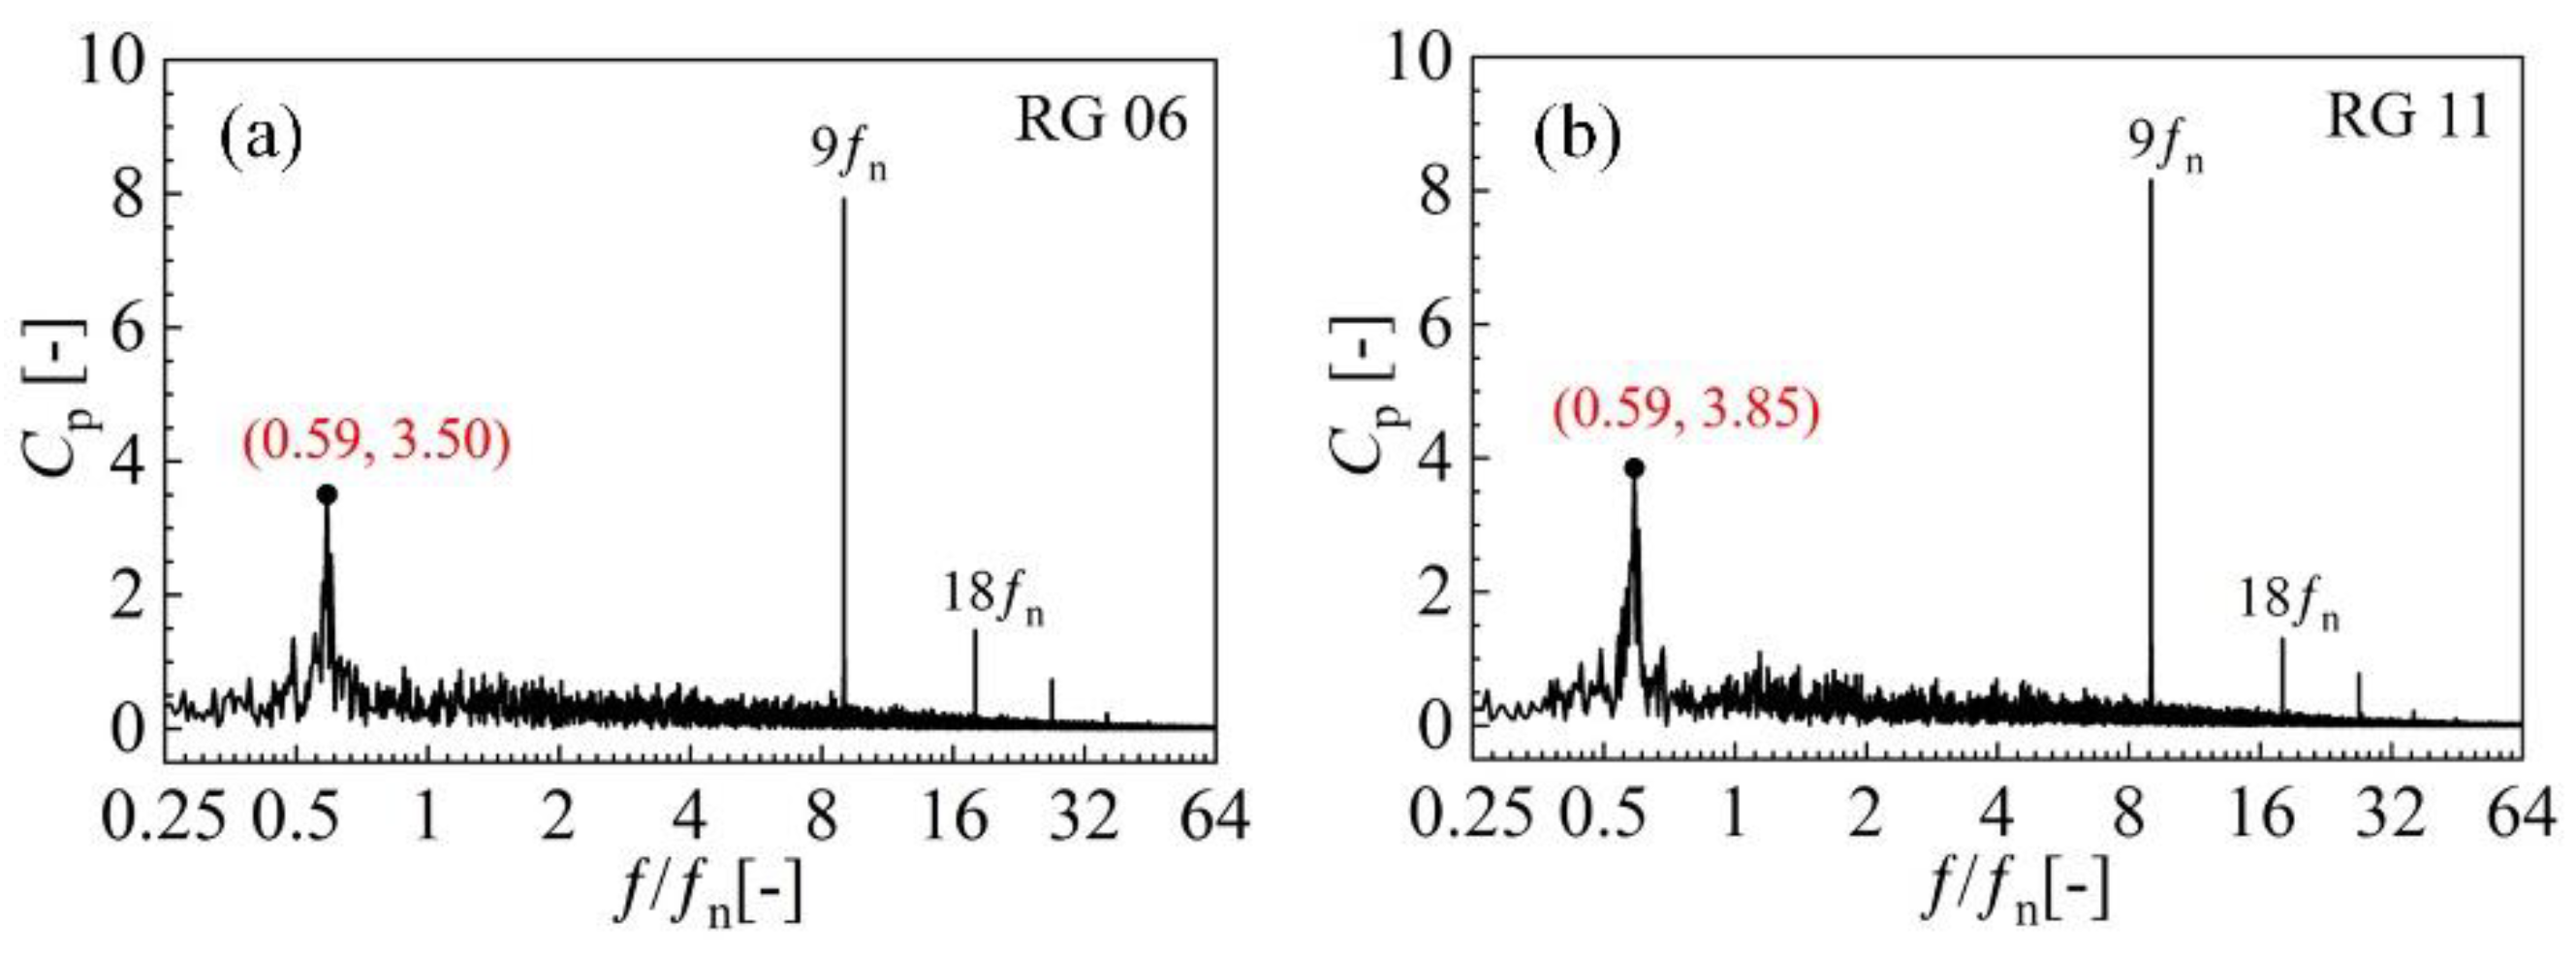
The pressure fluctuations data of the x- and y-direction monitoring points in the vaneless space are shown in Figure 11. It can be seen that both points have an obvious low-frequency characteristic frequency of 0.59 fn. In addition, the corresponding amplitude of the x-direction monitoring point RG 11 is 3.85, which is slightly higher than that of the y-direction monitoring point RG 06. Both of them have harmonic frequencies, such as 9 fn and 18 fn. Pressure fluctuation amplitudes of the braking operating condition is significantly higher than that of the turbine operating condition, and the flow state is relatively disordered.
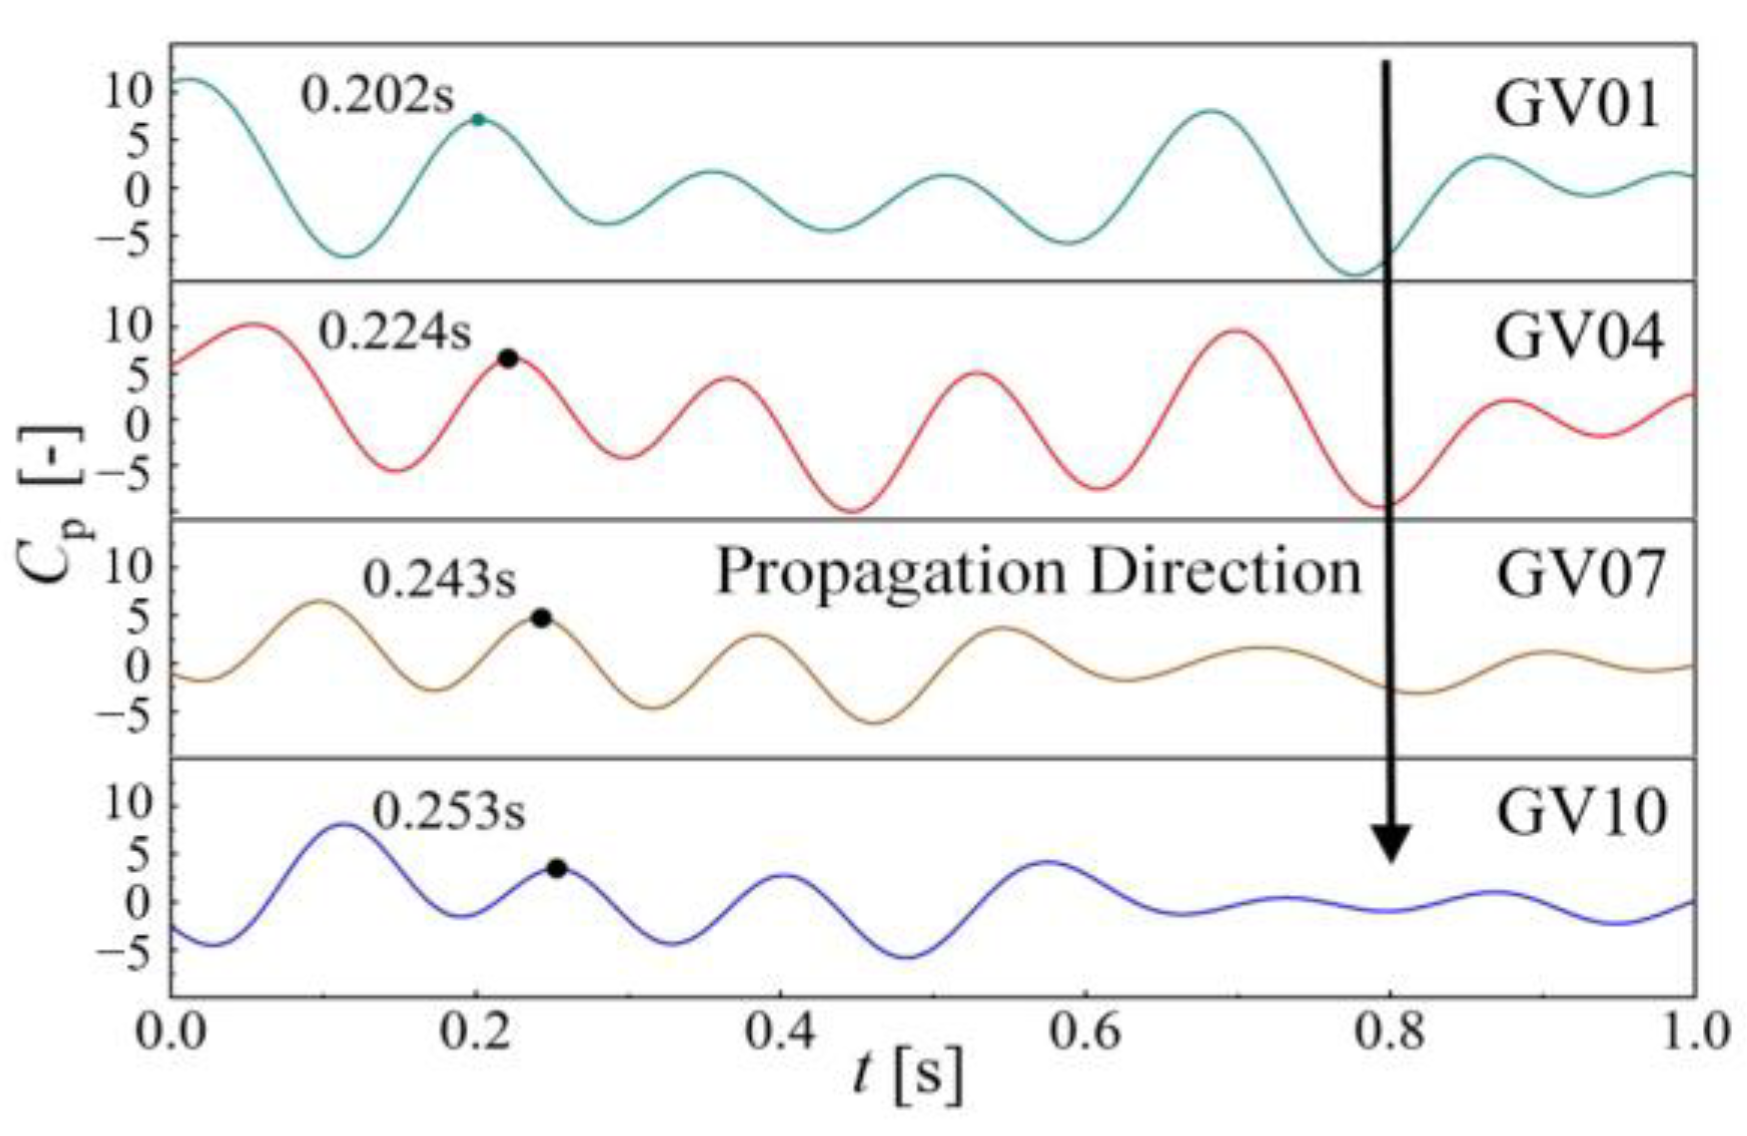
The pressure signals of each circumferential monitoring point of the guide vanes are obtained after low-pass filtering, and then plotted in Figure 12. By analyzing the propagation process of circumferential pressure fluctuations, it can be seen that the low-frequency peaks of GV 01, GV 04, GV 07, and GV 10 appear successively, and propagate clockwise in the circumferential direction. Compared with the vaneless space, the low-frequency amplitude of pressure fluctuations in the flow field of stay vanes are lower. Nevertheless, the generation mechanism of pressure fluctuation needs to be analyzed, combining with the internal flow.
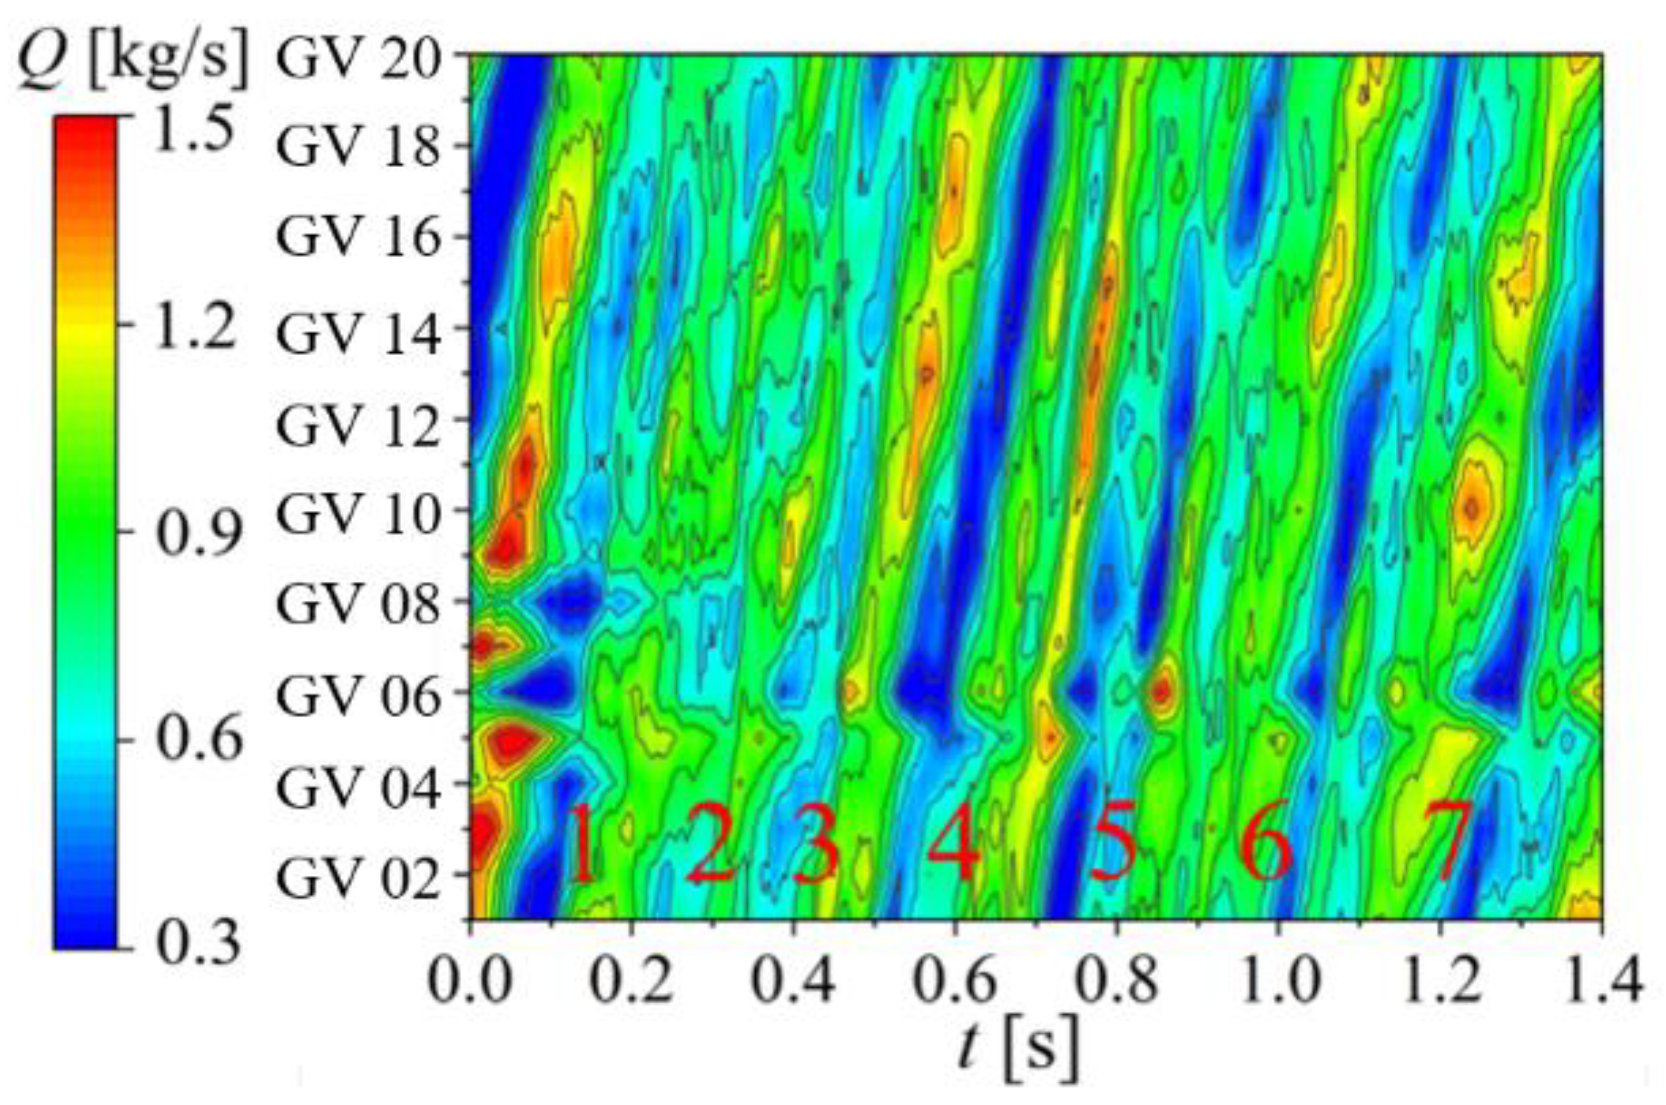
To analyze the flow state of the guide vane channels, the flow data are processed and the flow contour map is shown in Figure 13. A backflow area appears and moves circumferentially with the rotation of the runner. Analyzed by selecting the same rotating period. At the moment t1, the rotating stall phenomenon occurs in the SV01 and SV02 channels of guide vanes. The flow velocity in vaneless space is higher when the backflow area appears. The high-speed fluid hinders the outflow of water in the guide vanes, and then forms the backflow area, as shown in Figure 14. When the backflow area rotates to channel SV05 to SV07 with the motion of runner at t2, a large vortex appears between guide vanes and stay vanes, and there is a separation vortex in the vaneless space. At the following moments, the backflow area continues to propagate circumferentially along the clockwise direction. At the moment t6, it moves to the flow channel from SV18 to SV20, and completes a periodic rotation. A blue discharge contour in the distribution diagram represents a cycle of the circumrotating movement of the backflow area. In the 12-circle simulations, the blue flow contour appears seven times, with an average of 0.583 circles once, which is close to 0.59 fn, indicating that the generation of low frequency is related to the rotating stall between guide vanes.
The vortex structure distribution at the moment t6 is shown in Figure 15. It can be seen that there are numerous vortex structures in the vaneless space. In the region without backflow, only a small amount of vortices are generated. The turbulent kinetic energy intensity is used to represent the turbulent development. It can be seen that the turbulent intensity is higher at the position with more vortex structures, which is due to the blockage of the guide vane flow channels, resulting in the flow disorder at guide vanes outlet. The phenomenon appears periodically along with the movement of the runner at the outlet of each channel, which then lead to the backflow area and low-frequency pressure fluctuations.
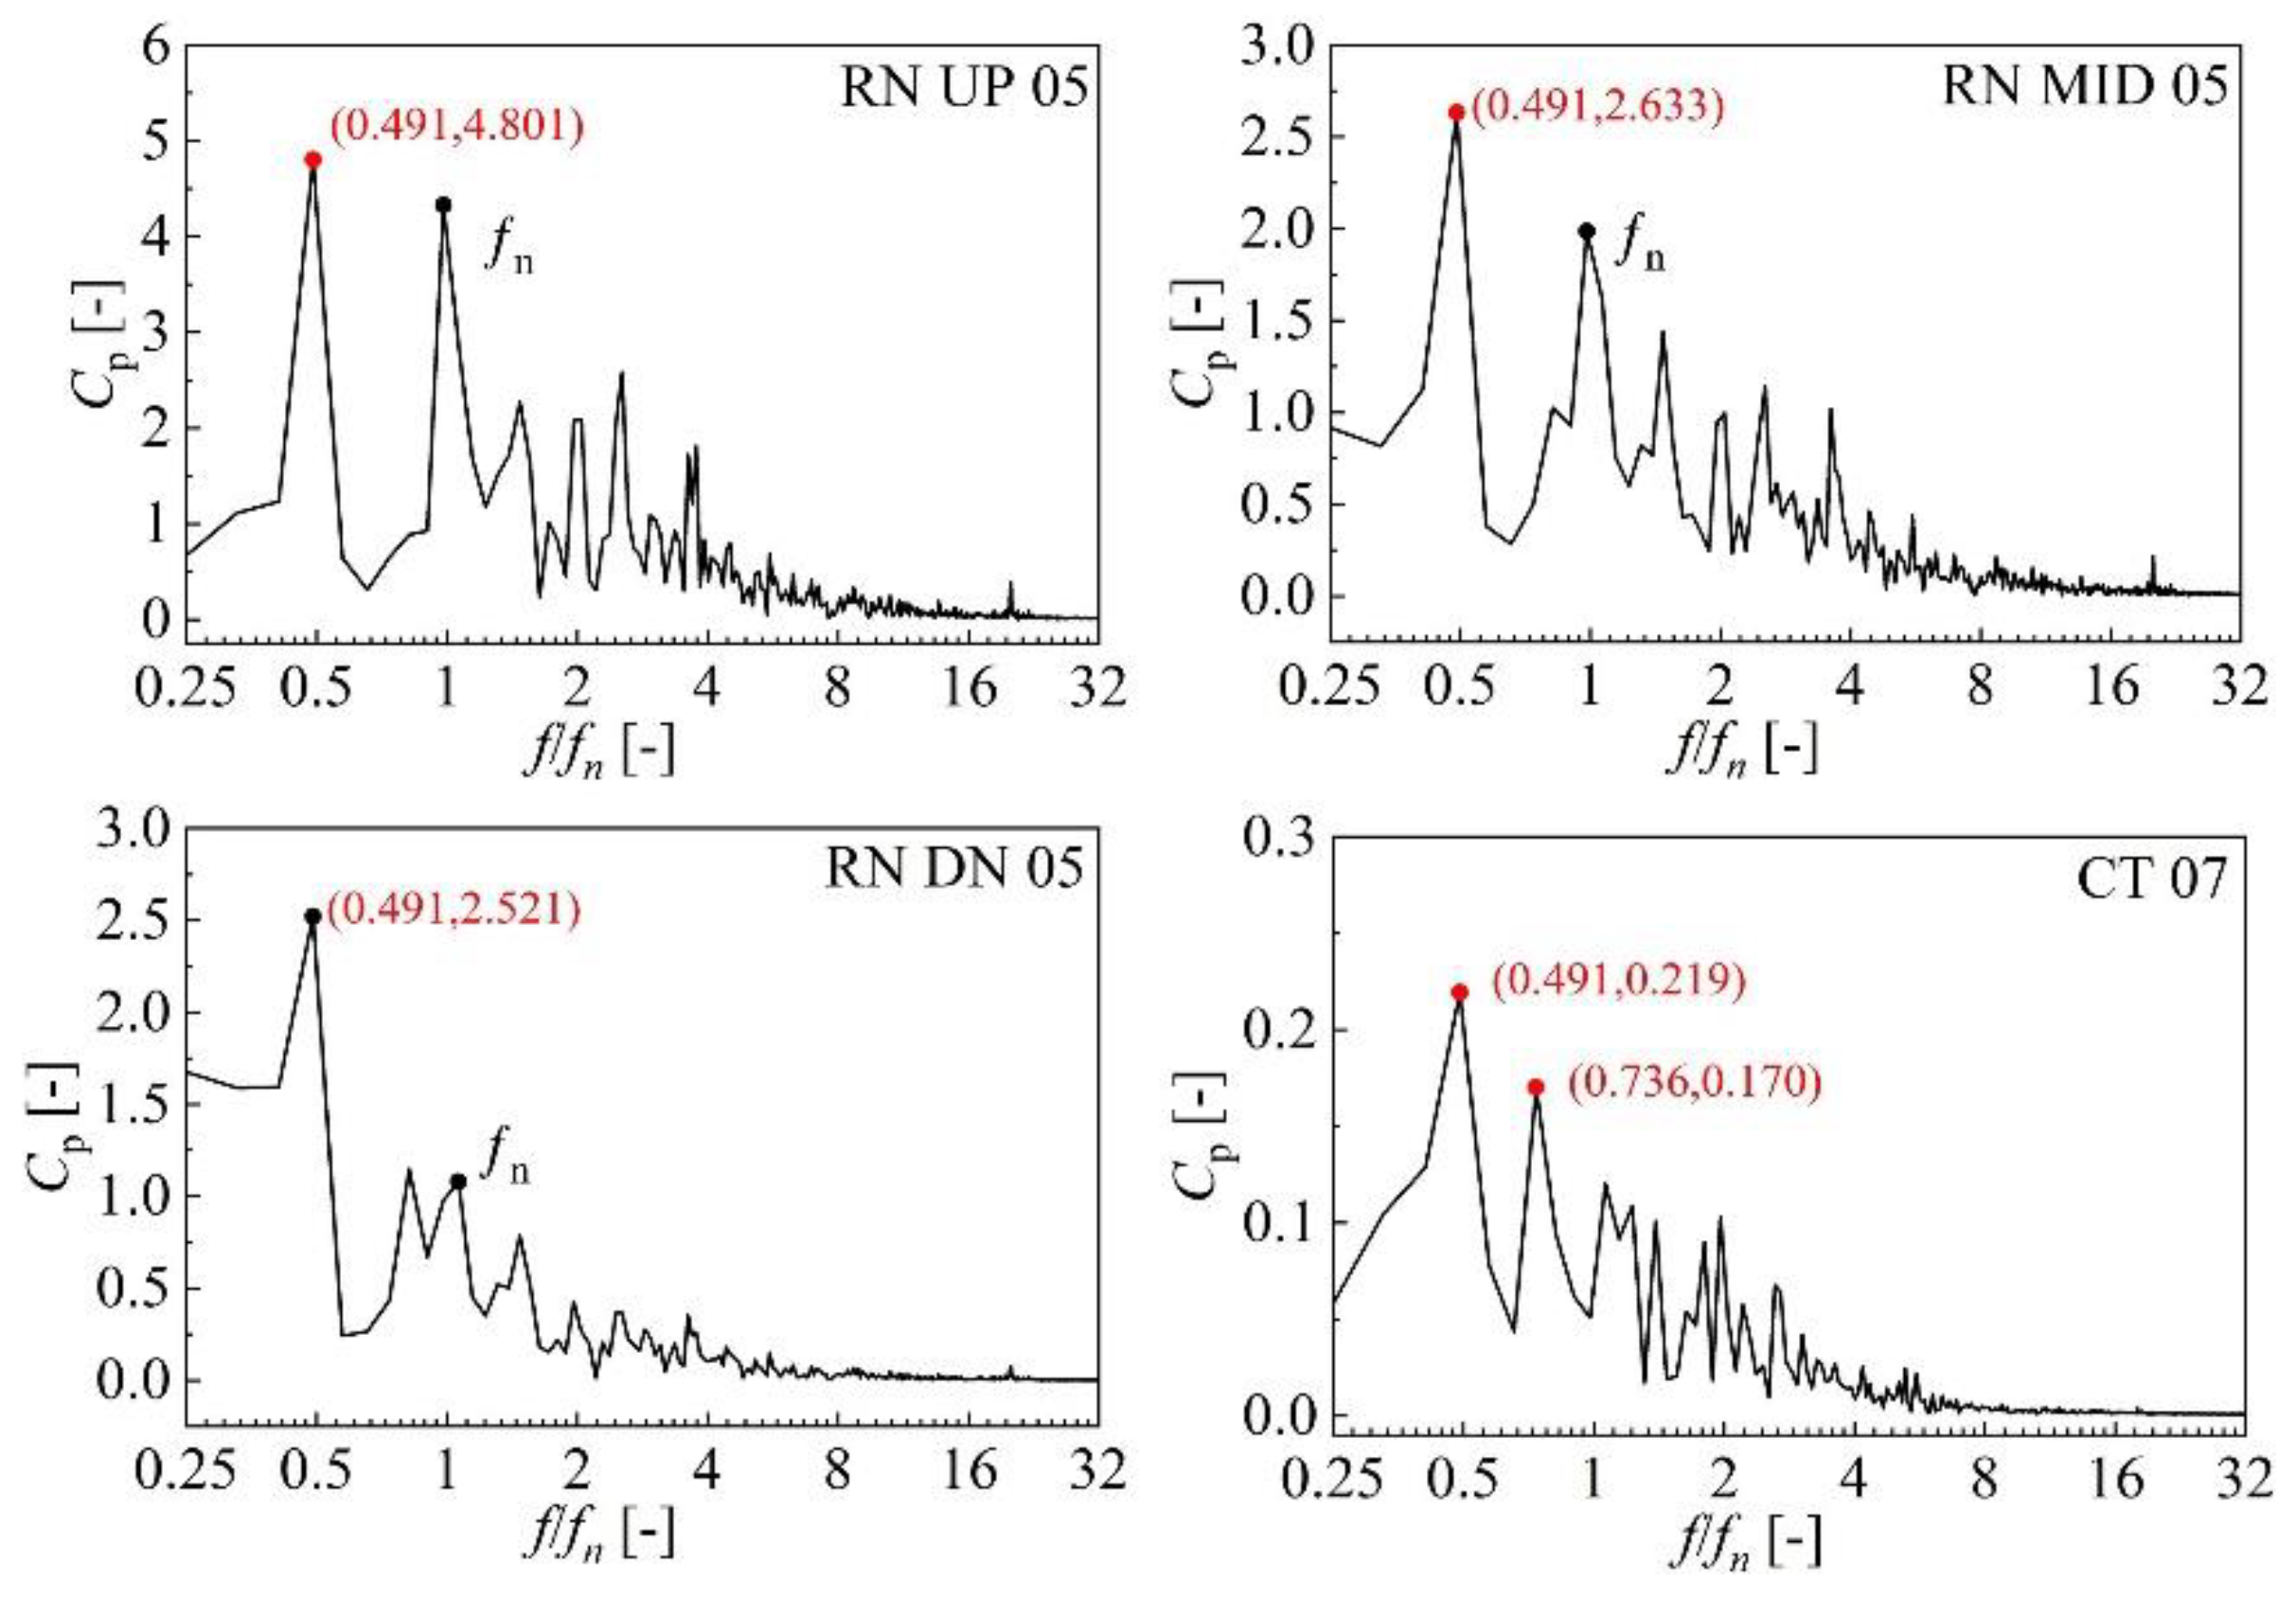
In order to explore the internal flow characteristics and pressure fluctuation propagation law under the braking operating condition, the frequency domain diagram of pressure fluctuations at RN MID and CT are drawn in Figure 16. It can be seen that the variation law of each monitoring point in different runner channels are extremely similar, and the above 0.49 fn appears in each channel. Among them, the low-frequency pressure fluctuation amplitude of RN05 is the highest, which is selected for the present study. Simultaneously, 0.49 fn and 0.74 fn appear in the simulation of the draft tube, and the amplitude of 0.49 fn is the largest (monitoring point CT07).
Figure 17 shows the pressure fluctuation frequency domain diagrams of RN05 and CT07, and the four monitoring points are distributed in the flow field in turn according to the flow direction. The maximum amplitude appears at 0.49 fn, and the upstream value of runner channel is 4.801. When the pressure signals propagate to the middle of the channel, it decreases to 2.633, and then 2.521 in the downstream, while the amplitude at the conical tube of the draft tube is only 0.219. The amplitude variation between the monitoring points of runner and draft tube is reflected in the gradual decrease from upstream to downstream, indicating that the influence of pressure fluctuations is gradually weakened, which is the same as the above results.
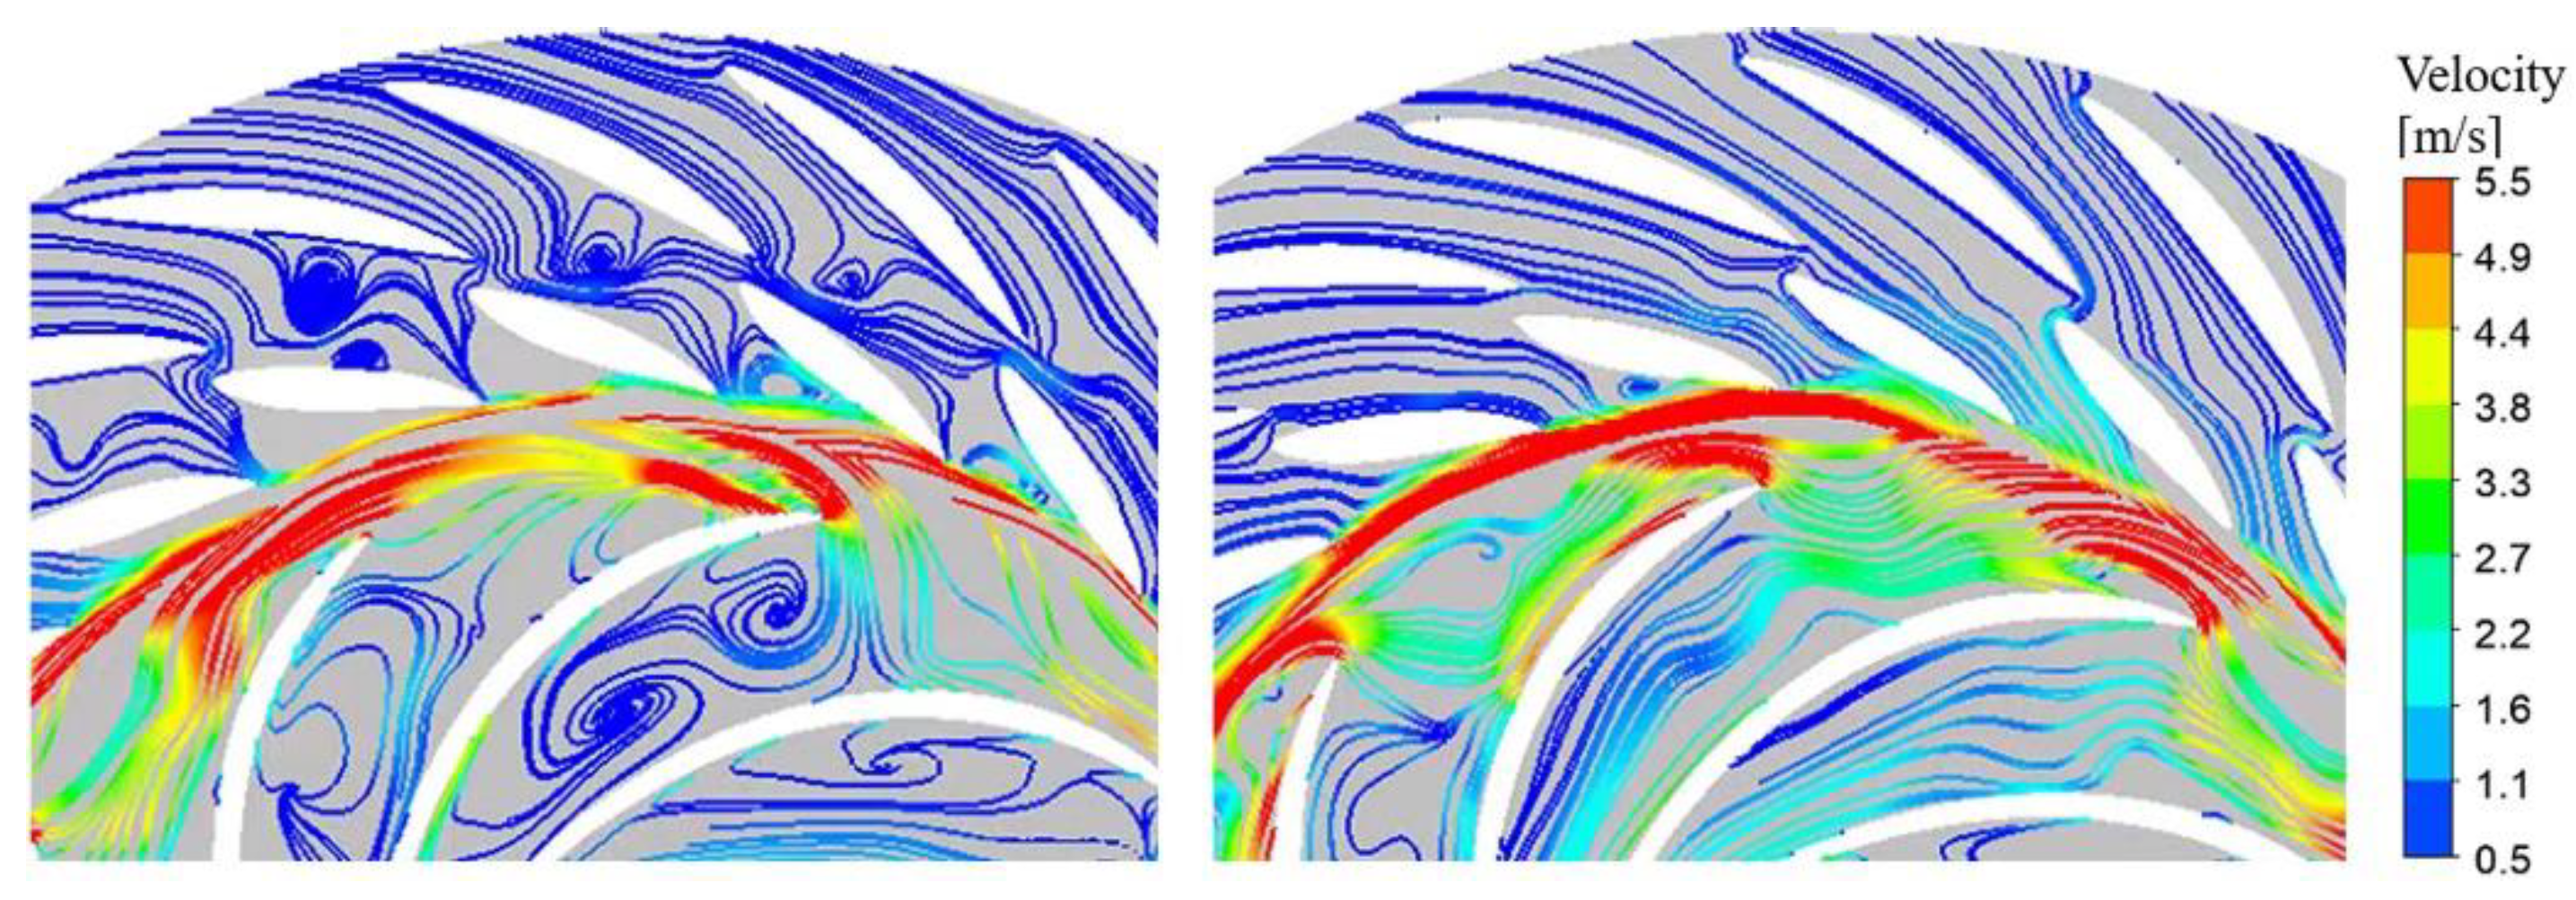
The streamline distribution is shown in Figure 18, where the left figure generates numerous complicated vortices, and the flow of the right one does not appear. It can be seen that when there is a backflow in the generator, the guide vane channels are blocked, the discharge of corresponding runner channel is low, and the vortices are formed in the corresponding runner channel. In the channel without vortex, streamlines are relatively smooth. This phenomenon indicates that the blockage of the runner channel is related to the flow characteristics in the vaneless space.
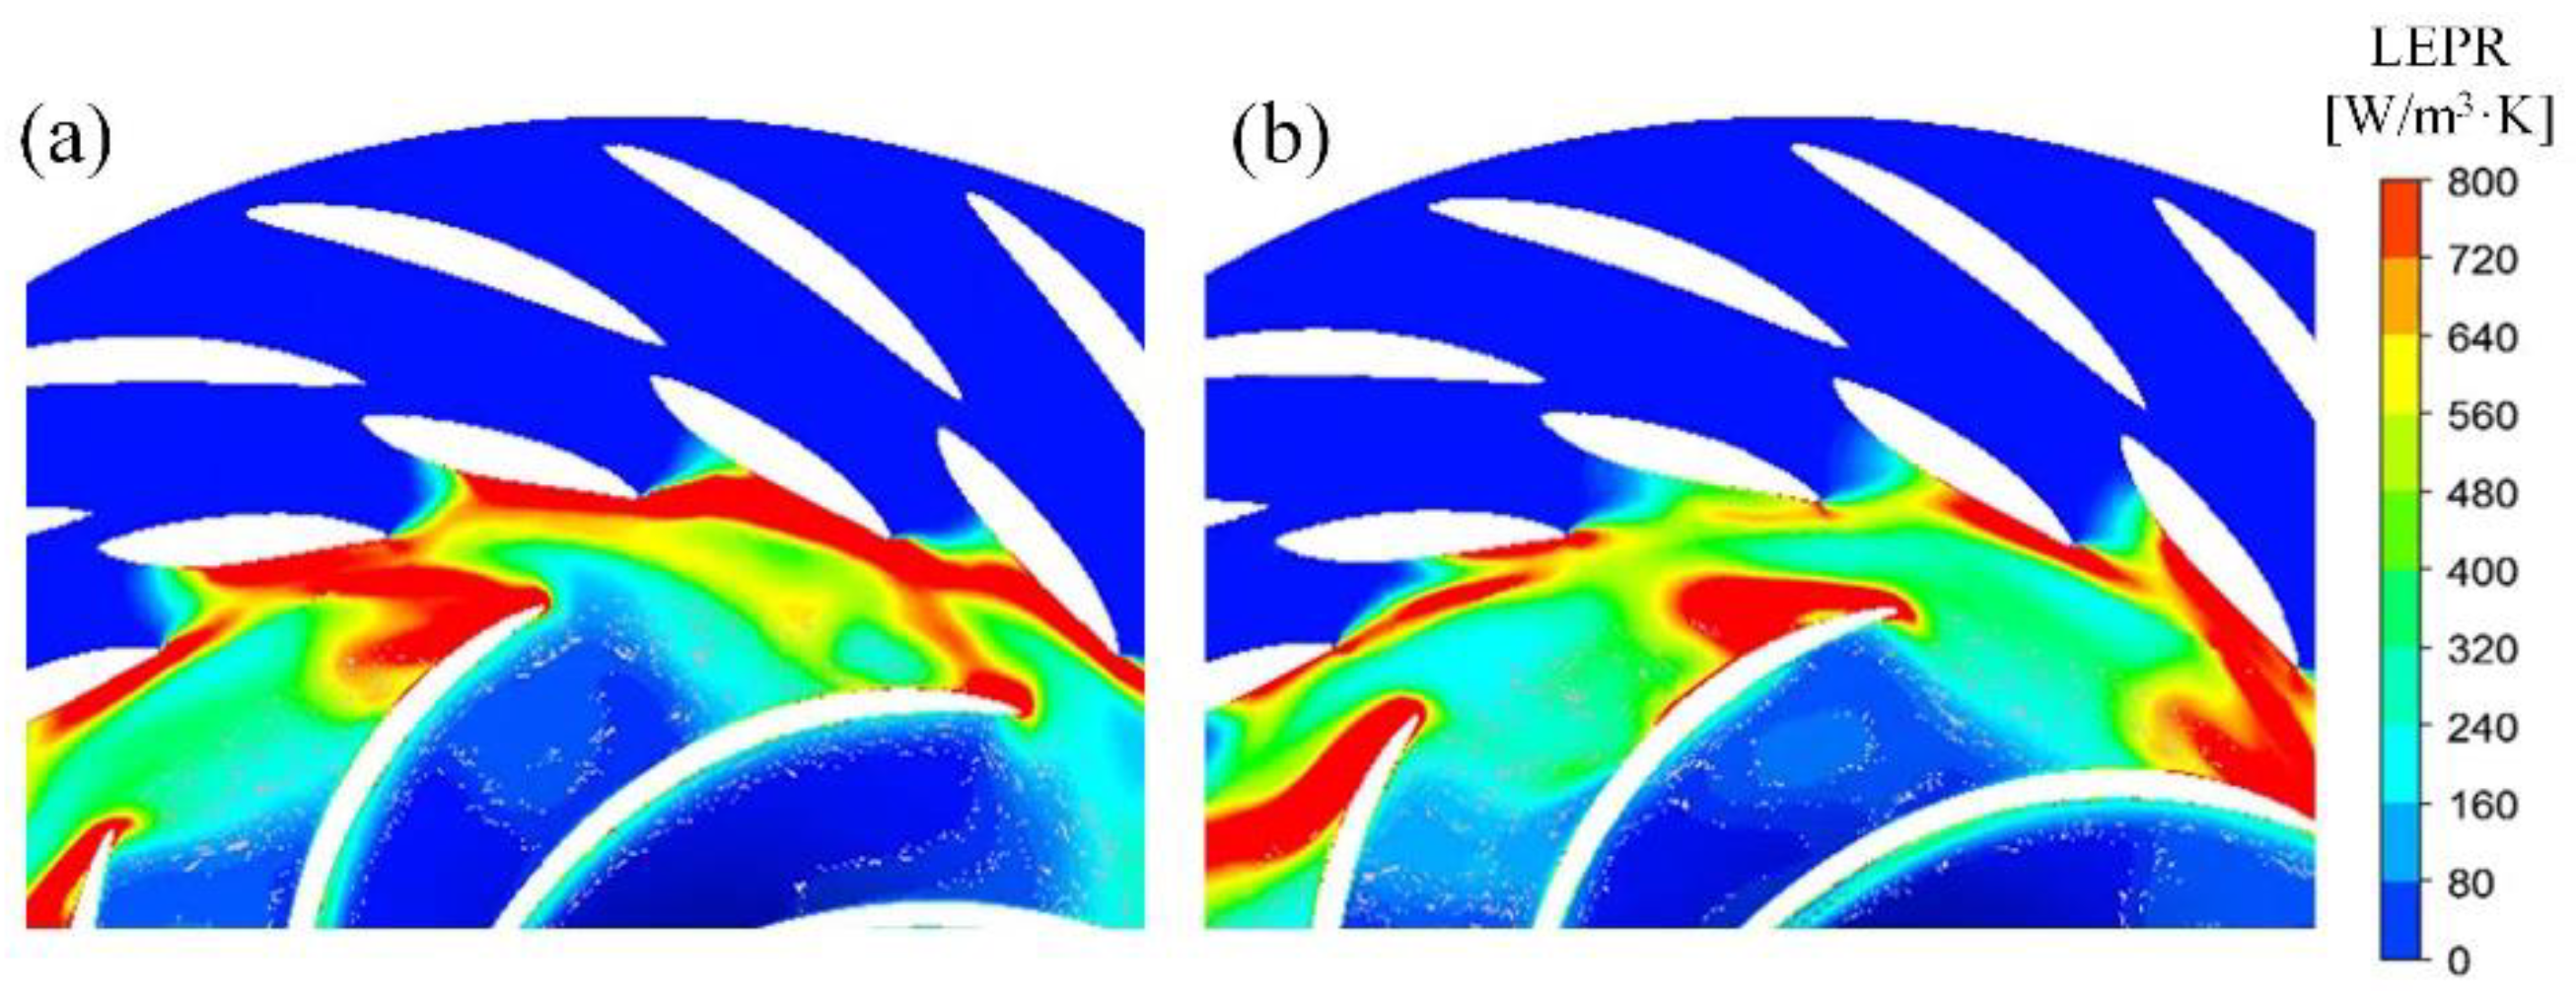
From the perspective of energy loss, there is a high-value local entropy production rate area in the vaneless space when more vortices appear. However, the local entropy production rate decreases when the vortices disappear, and the main high local entropy production rate region are distributed at the inlet of the runner, as shown in Figure 19. This is consistent with the above analysis, and the vortices leads an increase in loss.

3.3. Pressure Fluctuation Analysis of Reverse Pump Condition

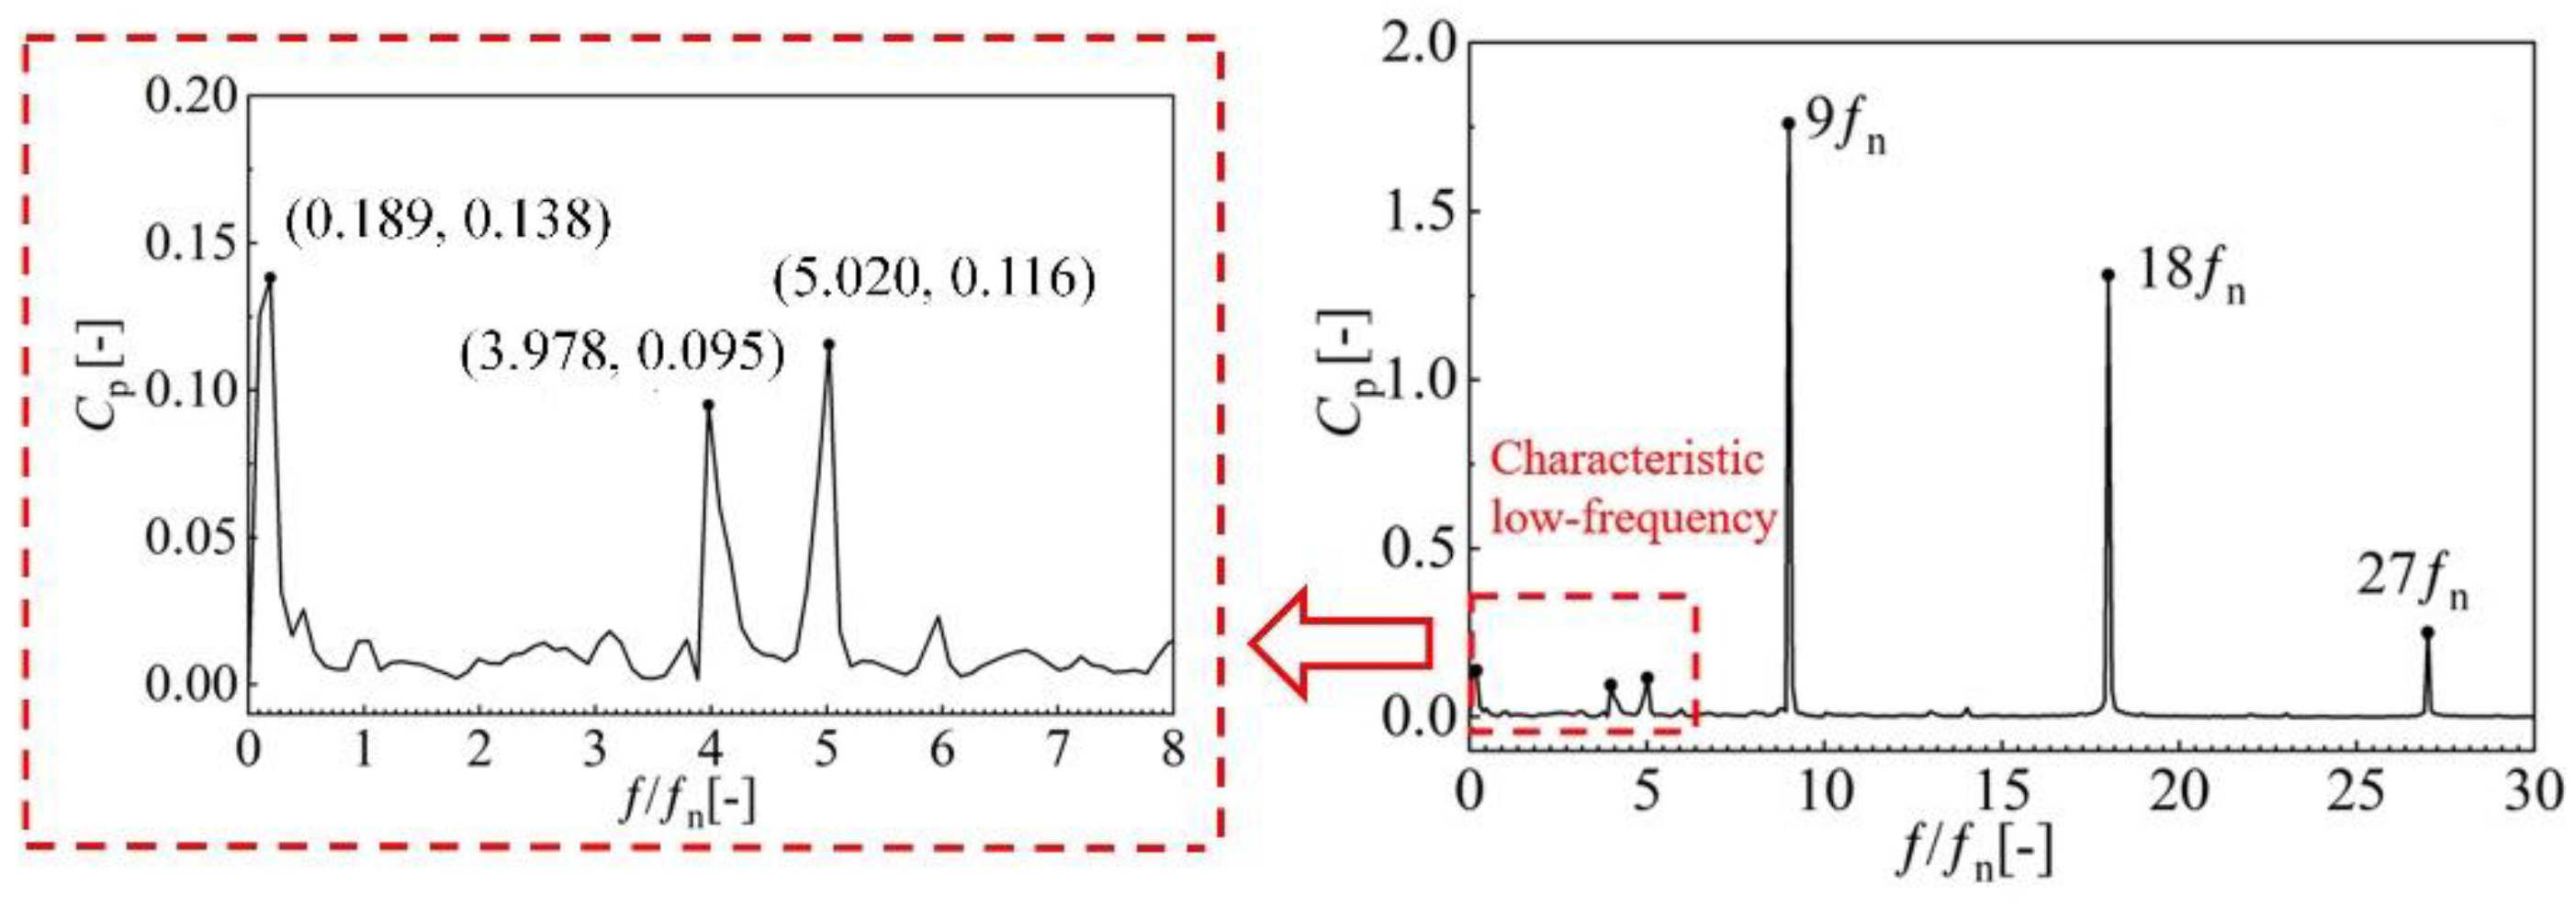
When the pump–turbine enters braking operating condition, it is easy to form the reverse pump condition. The fluid in the runner will be thrown out at high speed, and then flow into guide vanes to form a large number of backflow area, which brings a great threat to safety. The pressure fluctuations at GV11 are shown in Figure 20. The amplitude is lower than that of braking operating condition, and the dominant frequency is 9 fn. There are also 0.19 fn, 4 fn, and 5 fn. Furthermore, the low frequency may be related to the vortex in the vaneless space and the unstable flow in the draft tube.
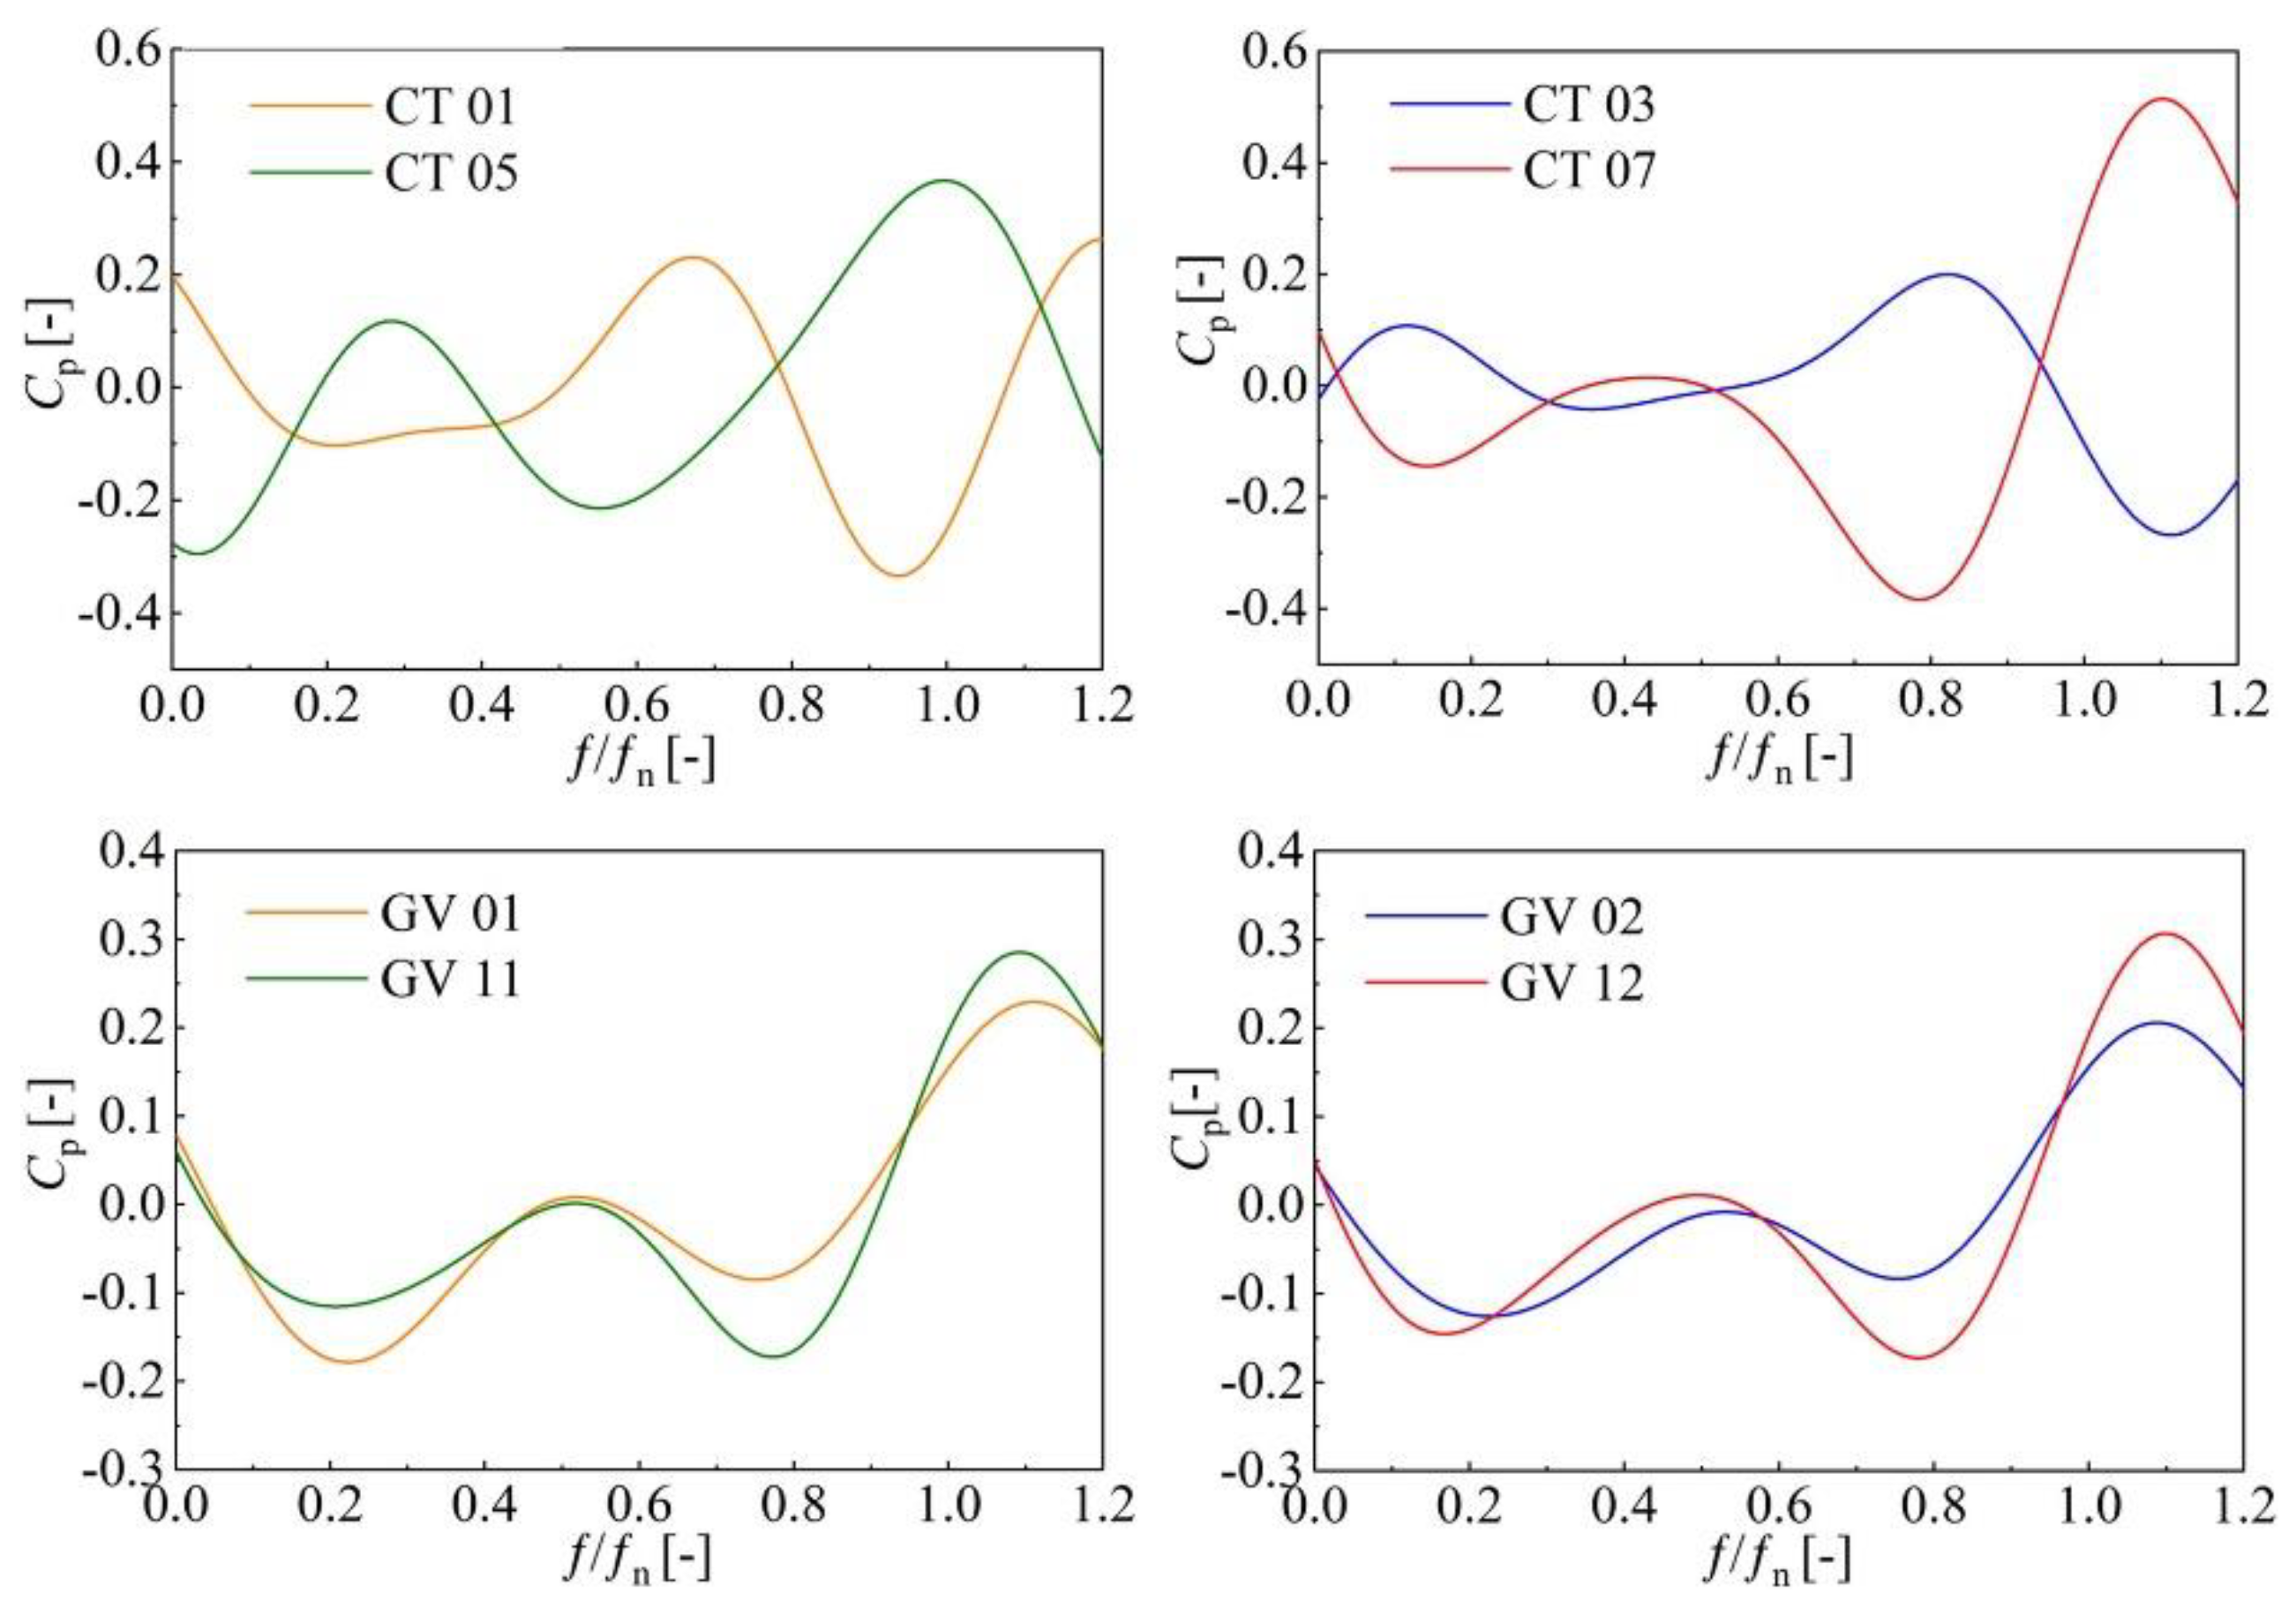
The propagation law of the most severe pressure fluctuation in the low frequency of guide vanes was analyzed, and pressure data were filtered to obtain the low-frequency wave of the monitoring points at cone pipe section and guide vanes (Figure 21). The phase difference between two cone pipe monitoring points, whose circumferential position is close to 180°, is π, while there is no obvious phase difference at guide vane monitoring points. According to this phenomenon, it is judged that 0.19 fn is generated in stay/guide vanes or vaneless space, and is not affected by the rotation of the runner. After propagating to the runner channels, it flows to the draft tube. Due to the rotation of the runner, the phase difference between two cone pipe monitoring points is generated.
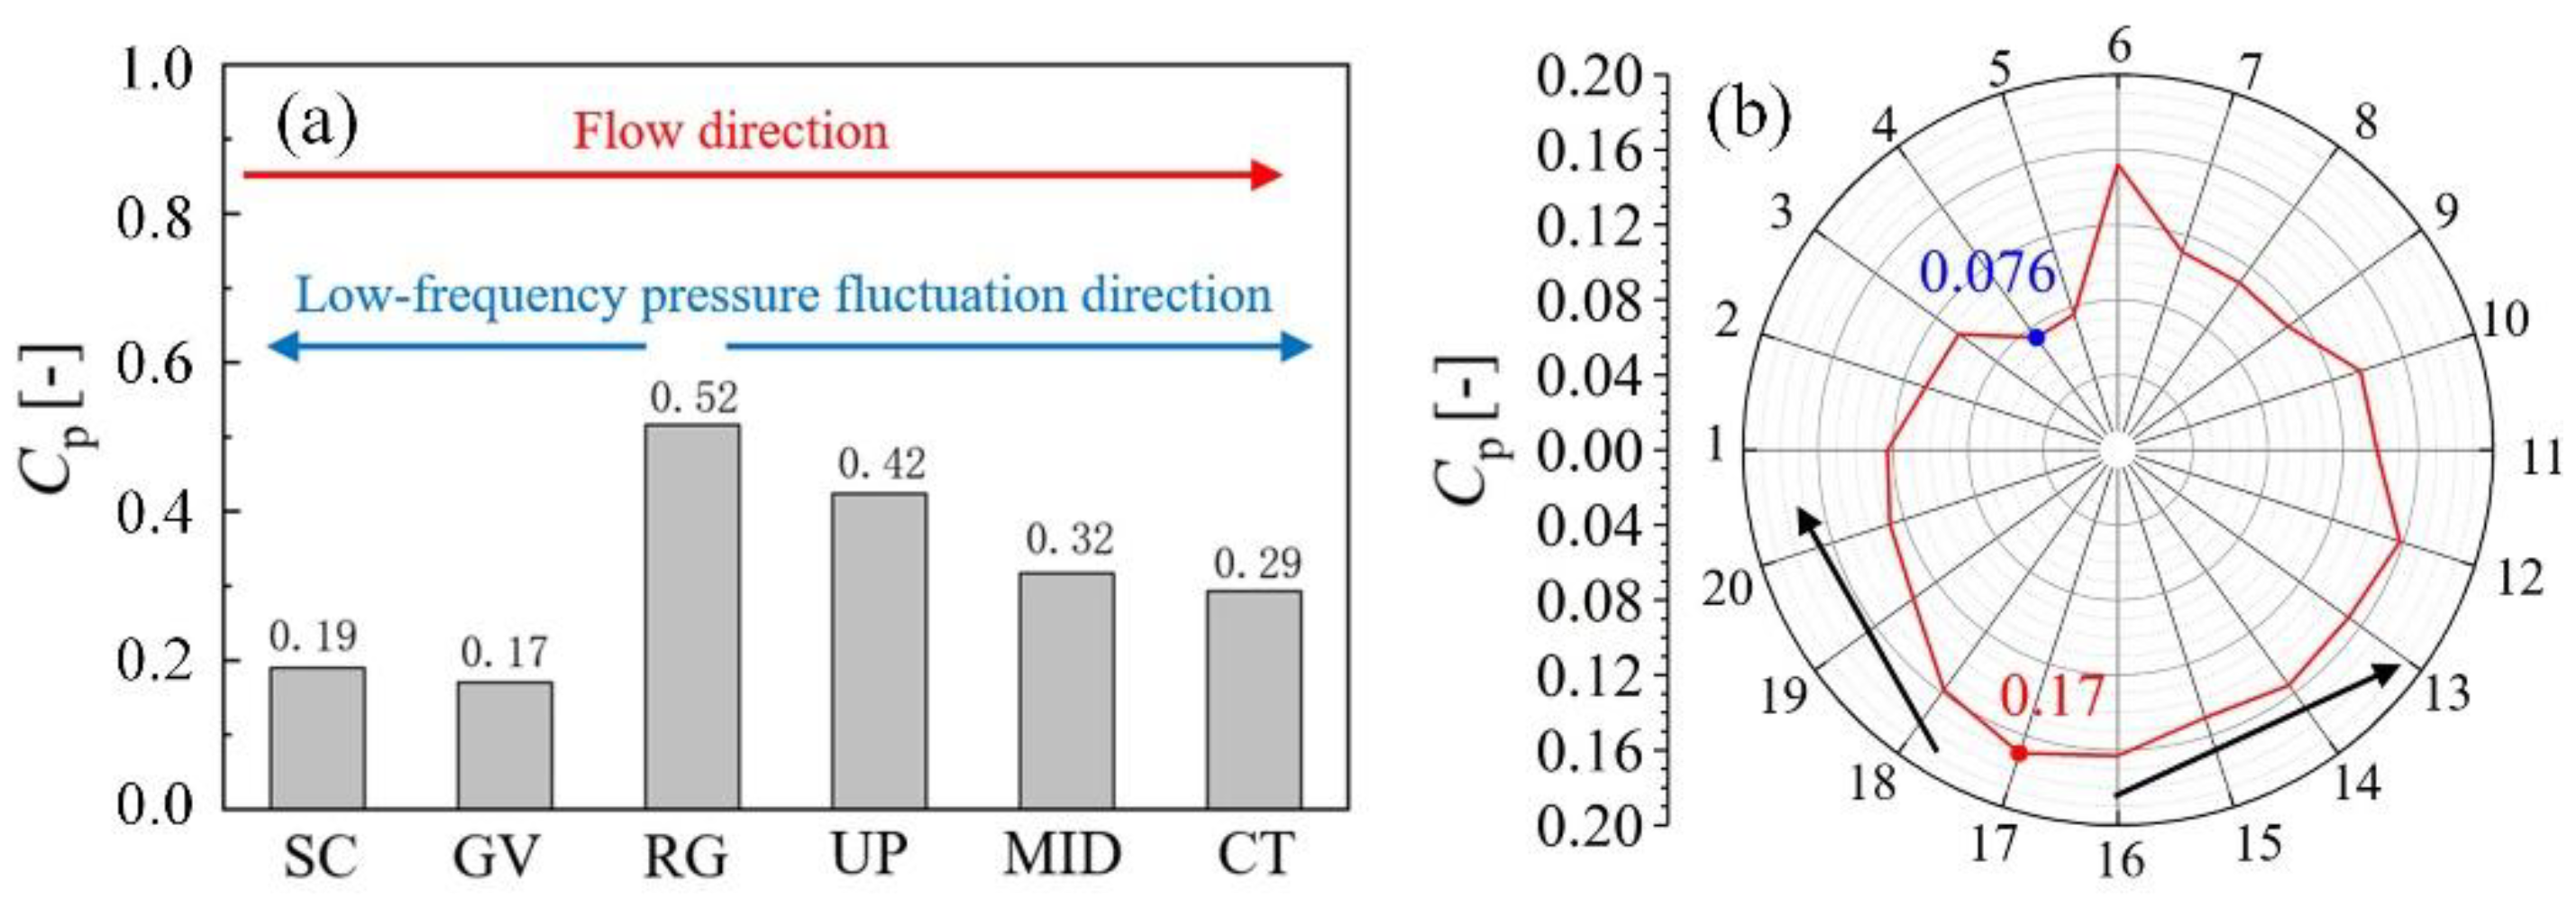
RG01 and the corresponding channel monitoring point RN MID 02 were selected for comparative analysis, as shown in Figure 22. It can be seen that there are many integral-time harmonic frequencies in the flow field, and the low-frequency pressure fluctuation in the vaneless space is higher than that of the runner, which can be judged on the propagation direction of the pressure fluctuation. The maximum amplitude of each monitoring point is comprehensively counted, as shown in Figure 23a. According to the bar graph, the maximum amplitude in vaneless space is 0.52, and the low-frequency pressure fluctuation propagates from the vaneless space with a downward trend. Because the vaneless space monitoring points rotate with the runner, the guide vane monitoring points are used to explore the low-frequency pressure propagation in the circumferential direction. The amplitude of 0.19 fn is shown in Figure 23b, the maximum amplitude in the guide vanes appear at GV17, corresponding to the amplitude of 0.17, and has the trend of spreading along both circumferential directions.
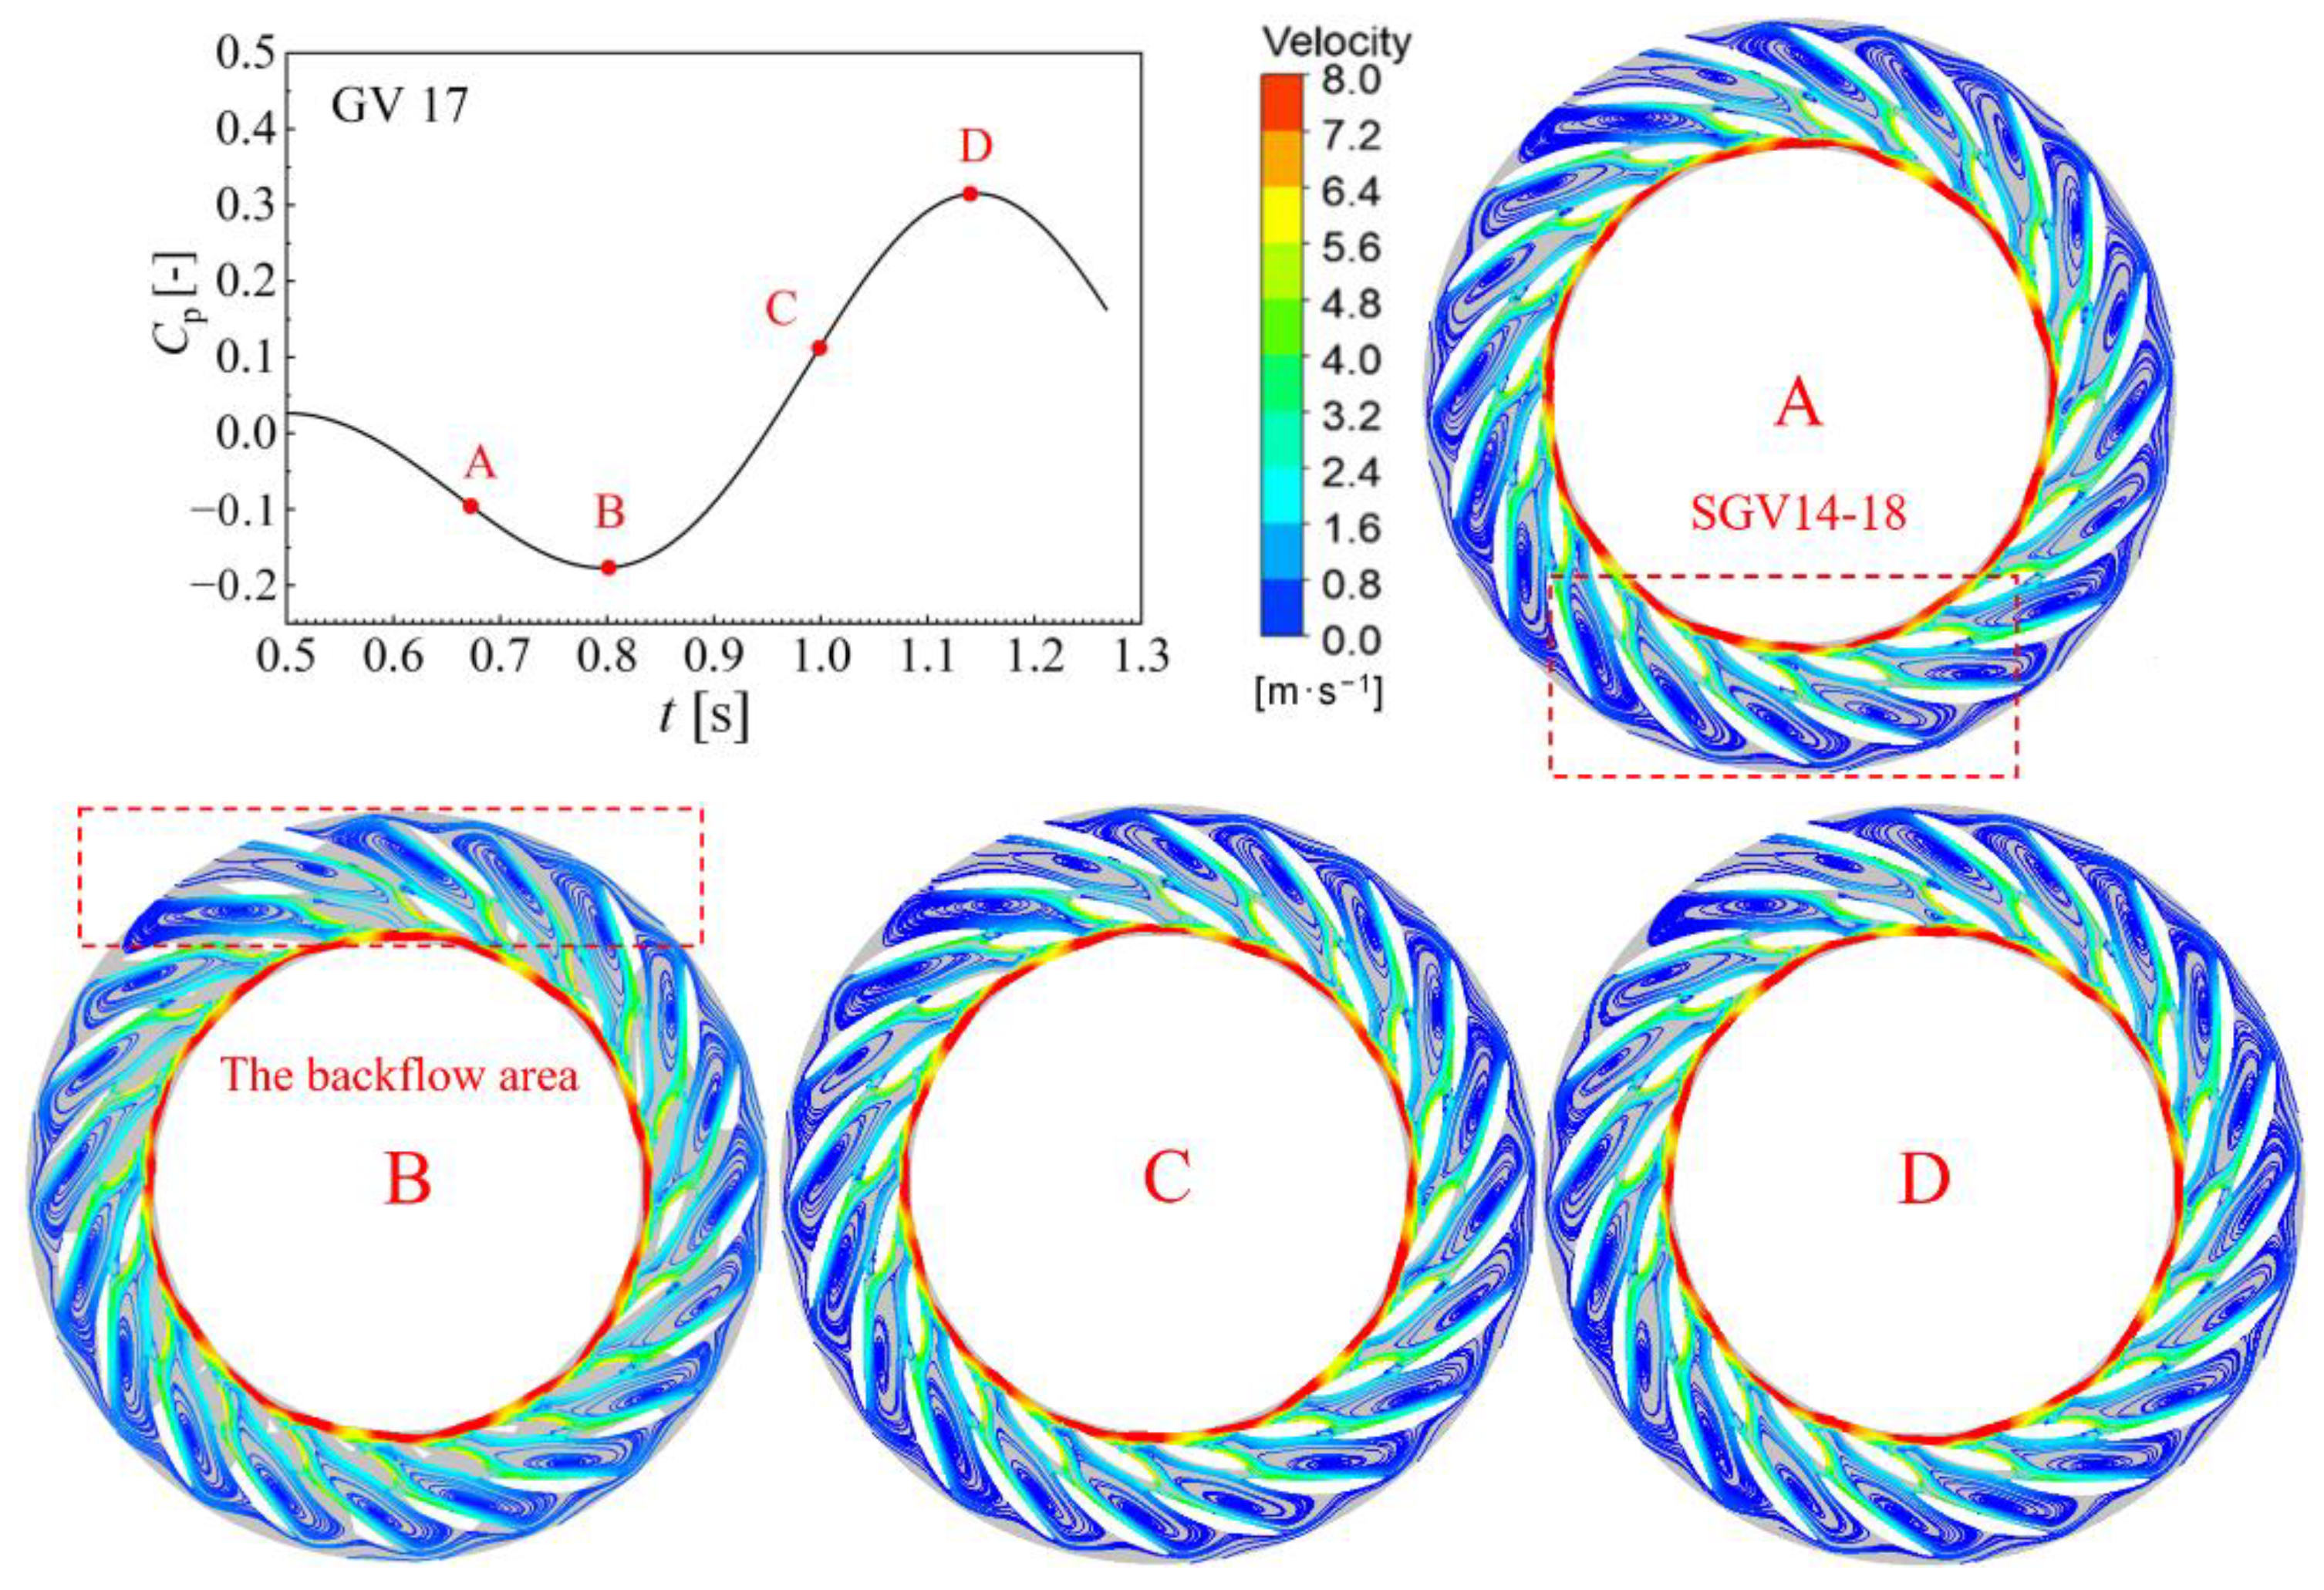
The first chart of Figure 24 is a curve of the maximum pressure fluctuation amplitude at GV17, with filtering out the high-frequency wave in the guide vanes, and four moments on the curve were selected for analysis. It can be seen that, at time A, the low-speed vortex region is generated in the vaneless space corresponding to channel 14 to 18, and that the region is amplified, as shown in Figure 25. The vortex is formed by the guide vane outlet fluid impacting the high-speed water ring at the runner. At time B, small low-speed vortices in the flow channel disappear, and continue to appear at time C, then disappear at time D. The generation and disappearance of the low-speed vortex region outside the water ring cause low-frequency pressure fluctuations. In addition, it is found in the flow field that there is an obvious large backflow area blocking the flow channel between stay vanes. The external characteristics of the large backflow area do not change with time, and the flow is relatively stable, which is also the reason for the small pressure fluctuations.
The above analysis shows that the main energy loss of the reverse pump operating condition is concentrated in the guide vanes and the vaneless region, where there are more recirculation zones leading to flow instability, which is consistent with previous research results. It is worth noting that this study innovatively combines the pressure fluctuation and flow distribution in each calculation domain, and analyzes the three operating conditions from the perspective of energy entropy production. It is found that the pressure fluctuation amplitude of the turbine operating condition is low and stable. The high amplitude pressure fluctuation rotates clockwise with the rotation of the runner, and the discharge of each channel is relatively stable without significant change (less than 5%). In the braking and the reverse pump operating condition, there is a recirculation zone in the GVs, which moves circumferentially with the rotation of the runner. In engineering, increasing the closing speed of guide vanes, controlling the slope of the guide vanes, and ensuring the synchronous change in the ball valve can avoid the pump–turbine in entering the reverse pump operating condition and can inhibit the occurrence of water hammer.

4. Conclusions

In hydropower engineering, the unstable working condition often occurs in the process of guide vanes opening or closing. In this study, a pump–turbine with a 25-mm guide vane opening was selected to analyze the unstable factors, which is helpful to the engineering research of the pump–turbine flow characteristics when the guide vane opening is changed, so as to weaken the S-shaped region, reduce the influence of instability, and better ensure the efficiency and operation lifespan of the units. In order to achieve in the application, this study explores the instability phenomenon of the S-shaped characteristic region, and unsteady simulations were carried out under the turbine, the braking, and the reverse pump operating conditions. The relevant results can be summarized as follows:
(1)
It is found that, under the turbine operating condition, pressure fluctuations have obvious periodicity. In terms of frequency, 9 fn is mainly generated by the rotor–stator interaction between guide vanes and runner. There is no backflow area in the flow field, and the fluid velocity changes uniformly. The streamline has high symmetry in the longitudinal and transverse sections.
(2)
Under braking operating condition, due to the decrease in discharge and the high speed of the runner, it is difficult for the fluid to reach the runner, and vortexes are formed in the vaneless space to block the guide vanes outlet. It is found that the vortices move circumferentially with the runner rotation. Dominant frequency of guide vanes and vaneless space are still the frequency generated by the rotor–stator interaction. The rotating stall phenomenon occurs periodically in the flow field, forming a 0.49-fn low-frequency pressure fluctuation that propagates to the upstream and downstream of vaneless space, and decreases to the minimum when it spreads to the draft tube. In addition, the local entropy production rate in the vaneless space increases when the large-scale backflow occurs, and causes great hydraulic loss.
(3)
By analyzing the reverse pump operating condition, it is found that large vortices occur in the flow channel of stay vanes and guide vanes, which generate a strong blockage. The rotating stall vortex in the vaneless space causes a 0.19-fn low-frequency pressure fluctuation, which propagates along two circumferential directions, and propagates upstream and downstream of the axial flow. The internal flow characteristics of the low discharge reverse pump are relatively stable, and the pressure fluctuations are lower than that of braking operating condition.

Author Contributions

Conceptualization, H.W. and D.L.; methodology, H.W., D.L., C.S. and X.W.; formal analysis, J.W. and C.S.; data curation, J.W.; writing—original draft preparation, J.W., D.L., C.S., R.G. and X.W.; writing—review and editing, J.W., D.L. and R.G.; supervision, H.W. and X.W.; project administration, H.W.; funding acquisition, D.L. All authors have read and agreed to the published version of the manuscript.

Funding

This work was supported by the National Natural Science Foundation of China [grant number 51806047 and 51906050], Foundation of State Key Laboratory of Hydro-power Equipment (SKLHE-ORF-202003).

Institutional Review Board Statement

Not applicable.

Informed Consent Statement

Not applicable.

Data Availability Statement

Not applicable.

Conflicts of Interest

The authors declare no conflict of interest.

Nomenclature

HHead [m]
nRotating speed [r·min−1]
QDischarge [m3·s−1]
TTorque [N·m]
D2Runner outlet diameter [m]
ZRunner blade number [-]
ZgGuide vane number [-]
ZsStay vane number [-]
bgGuide vane height [-]
tTime [s]
fFrequency of pressure fluctuation [Hz]
fnRunner rotation frequency [Hz]
νKinematic viscosity [m2/s]
μDynamic viscosity [Pa·s]
y+Dimensionless distance [-]
CpDimensionless coefficient of pressure fluctuation, C P = ( P P ¯ / ρ g H ) × 100
PCalculation pressure of monitoring points [Pa]
P ¯ Average pressure of monitoring points [Pa]
n11Unit speed, n 11 = n D 2 / H [r·m0.5·min−1]
Q11Unit discharge, Q 11 = Q / D 2 2 H [m0.5·s−1]
T11Unit torque, T 11 = T / n 2 D 2 5 [N·min2·r−2·m−4]
CalSimulation value
ExpExperimental value

References

  1. Kuriqi, A.; Pinheiro, A.N.; Sordo-Ward, A.; Garrote, L. Influence of hydrologically based environmental flow methods on flow alteration and energy production in a run-of-river hydropower plant. J. Clean. Prod. 2019, 232, 1028–1042. [Google Scholar] [CrossRef]
  2. Simão, M.; Ramos, H.M. Hybrid Pumped Hydro Storage Energy Solutions towards Wind and PV Integration: Improvement on Flexibility, Reliability and Energy Costs. Water 2020, 12, 2457. [Google Scholar] [CrossRef]
  3. Vasudevan, K.R.; Ramachandaramurthy, V.K.; Venugopal, G.; Ekanayake, J.; Tiong, S. Variable speed pumped hydro storage: A review of converters, controls and energy management strategies. Renew. Sustain. Energy Rev. 2020, 135, 110156. [Google Scholar] [CrossRef]
  4. Qi, Y.D.; Tang, X.B.; Zhao, J.J.; Sun, P. Present situation and development prospect of pumped storage power station in China. Collect. Work. Pumped Storage Power Stn. Constr. 2019, 5, 11–15. [Google Scholar]
  5. Tahani, M.; Kandi, A.; Moghimi, M.; Houreh, S.D. Rotational speed variation assessment of centrifugal pump-as-turbine as an energy utilization device under water distribution network condition. Energy 2020, 213, 118502. [Google Scholar] [CrossRef]
  6. Sallaberger, M.; Gentner, C.; Widmer, C.; Henggeler, U. Stability of Pump Turbine—A Challenge Faced in Design. Northwest Hydropower 2012, S1, 86–90+109. [Google Scholar]
  7. Li, D.; Fu, X.; Wang, H.; Zhao, R.; Wei, X. Evolution mechanism of a prototype pump-turbine after pump power off. Phys. Fluids 2021, 33, 106109. [Google Scholar] [CrossRef]
  8. Fu, X.; Zuo, Z.; Chang, H.; Li, D.; Wang, H.; Wei, X. Mechanism of low frequency high amplitude pressure fluctuation in a pump-turbine during the load rejection process. J. Hydraul. Res. 2020, 59, 280–297. [Google Scholar] [CrossRef]
  9. Cavazzini, G.; Covi, A.; Pavesi, G.; Ardizzon, G. Analysis of the Unstable Behavior of a Pump-Turbine in Turbine Mode: Fluid-Dynamical and Spectral Characterization of the S-shape Characteristic. J. Fluids Eng. 2015, 138, 021105. [Google Scholar] [CrossRef]
  10. Suh, J.-W.; Kim, S.-J.; Yang, H.-M.; Kim, M.-S.; Joo, W.-G.; Park, J.; Kim, J.-H.; Choi, Y.-S. A Comparative Study of the Scale Effect on the S-Shaped Characteristics of a Pump-Turbine Unit. Energies 2021, 14, 525. [Google Scholar] [CrossRef]
  11. Liu, W.; Zheng, J.; Chen, J.; Shi, Q. S-shaped characteristic optimization design of pump turbine in Xianju pumped storage power station. Collect. Work. Pumped Storage Power Stn. Constr. 2013, 5, 148–152. [Google Scholar]
  12. Casartelli, E.; Del Rio, A.; Mangani, L.; Schmid, A. Capturing S-Shape of Pump-Turbines by CFD Simulations Using an Anisotropic Turbulence Model. In Proceedings of the Fluid Applications and Systems, San Francisco, CA, USA, 28 July–1 August 2019. [Google Scholar]
  13. Hasmatuchi, V.; Roth, S.; Botero, F.; Avellan, F.; Farhat, M. High-speed flow visualization in a pump-turbine under off-design operating conditions. In Proceedings of the 25th IAHR Symposium on Hydraulic Machinery and Systems, Timişoara, Romania, 20–24 September 2010; Volume 12, p. 012059. [Google Scholar] [CrossRef]
  14. Sun, H.; Xiao, R.; Liu, W.; Wang, F. Analysis of S Characteristics and Pressure Pulsations in a Pump-Turbine with Misaligned Guide Vanes. J. Fluids Eng. 2016, 129, 12037. [Google Scholar] [CrossRef] [PubMed]
  15. Rezghi, A.; Riasi, A. Sensitivity analysis of transient flow of two parallel pump-turbines operating at runaway. Renew. Energy 2016, 86, 611–622. [Google Scholar] [CrossRef]
  16. Olimstad, G.; Nielsen, T.; Børresen, B. Stability Limits of Reversible-Pump Turbines in Turbine Mode of Operation and Measurements of Unstable Characteristics. J. Fluids Eng. 2012, 134, 111202. [Google Scholar] [CrossRef] [Green Version]
  17. Houdeline, J.B.; Liu, J.; Lavigne, S.; Laurant, Y.; Balara, L. Start-up improvement in turbine mode for high head PSP machine. In IOP Conference Series: Earth and Environmental Science; IOP Publishing: Bristol, UK, 2012; Volume 15, p. 042022. [Google Scholar]
  18. Yamabe, M. Improvement of Hysteresis Characteristics of Francis Pump-Turbines When Operated as Turbine. J. Basic Eng. 1972, 94, 581–585. [Google Scholar] [CrossRef]
  19. Rodriguez, C.; Egusquiza, E.; Santos, I.F. Frequencies in the Vibration Induced by the Rotor Stator Interaction in a Centrifugal Pump Turbine. J. Fluids Eng. 2007, 129, 1428–1435. [Google Scholar] [CrossRef] [Green Version]
  20. Jean-Bernard, H.; Liu, J.; Sylvain, L. Starting of high head reversible pump turbine. In Proceedings of the 19th China Symposium on Hydropower Equipment, Tianjin, China, 17 September 2013. [Google Scholar]
  21. Nielsen, T.K.; Svarstad, M.F. Unstable behaviour of RPT when testing turbine characteristics in the laboratory. In IOP Conference Series: Earth and Environmental Science; IOP Publishing: Bristol, UK, 2014; Volume 22, p. 32038. [Google Scholar]
  22. Gentner, C.; Sallaberger, M.; Widmer, C.; Braun, O.; Staubli, T. Numerical and experimental analysis of instability phenomena in pump turbines. In IOP Conference Series: Earth and Environmental Science; IOP Publishing: Bristol, UK, 2012; Volume 15, p. 032042. [Google Scholar]
  23. Widmer, C.; Staubli, T.; Ledergerber, N. Unstable Characteristics and Rotating Stall in Turbine Brake Operation of Pump-Turbines. J. Fluids Eng. 2011, 133, 041101. [Google Scholar] [CrossRef]
  24. Deng, R.; Gao, Z.Y.; Li, Y.L. Research status and recent development of turbulence model. J. Ship Mech. 2019, 23, 360–376. [Google Scholar]
  25. Olimstad, G.; Nielsen, T.; Børresen, B. Dependency on Runner Geometry for Reversible-Pump Turbine Characteristics in Turbine Mode of Operation. J. Fluids Eng. 2012, 134, 121102. [Google Scholar] [CrossRef]
  26. Trivedi, C.; Cervantes, M.J.; Dahlhaug, O.G. Numerical Techniques Applied to Hydraulic Turbines: A Perspective Review. Appl. Mech. Rev. 2016, 68, 010802. [Google Scholar] [CrossRef]
  27. Li, Z.; Wang, Z.; Wei, X.; Qin, D. Flow Similarity in the Rotor–Stator Interaction Affected Region in Prototype and Model Francis Pump-Turbines in Generating Mode. J. Fluids Eng. 2016, 138, 061201. [Google Scholar] [CrossRef]
  28. Li, D.; Song, Y.; Lin, S.; Wang, H.; Qin, Y.; Wei, X. Effect mechanism of cavitation on the hump characteristic of a pump-turbine. Renew. Energy 2020, 167, 369–383. [Google Scholar] [CrossRef]
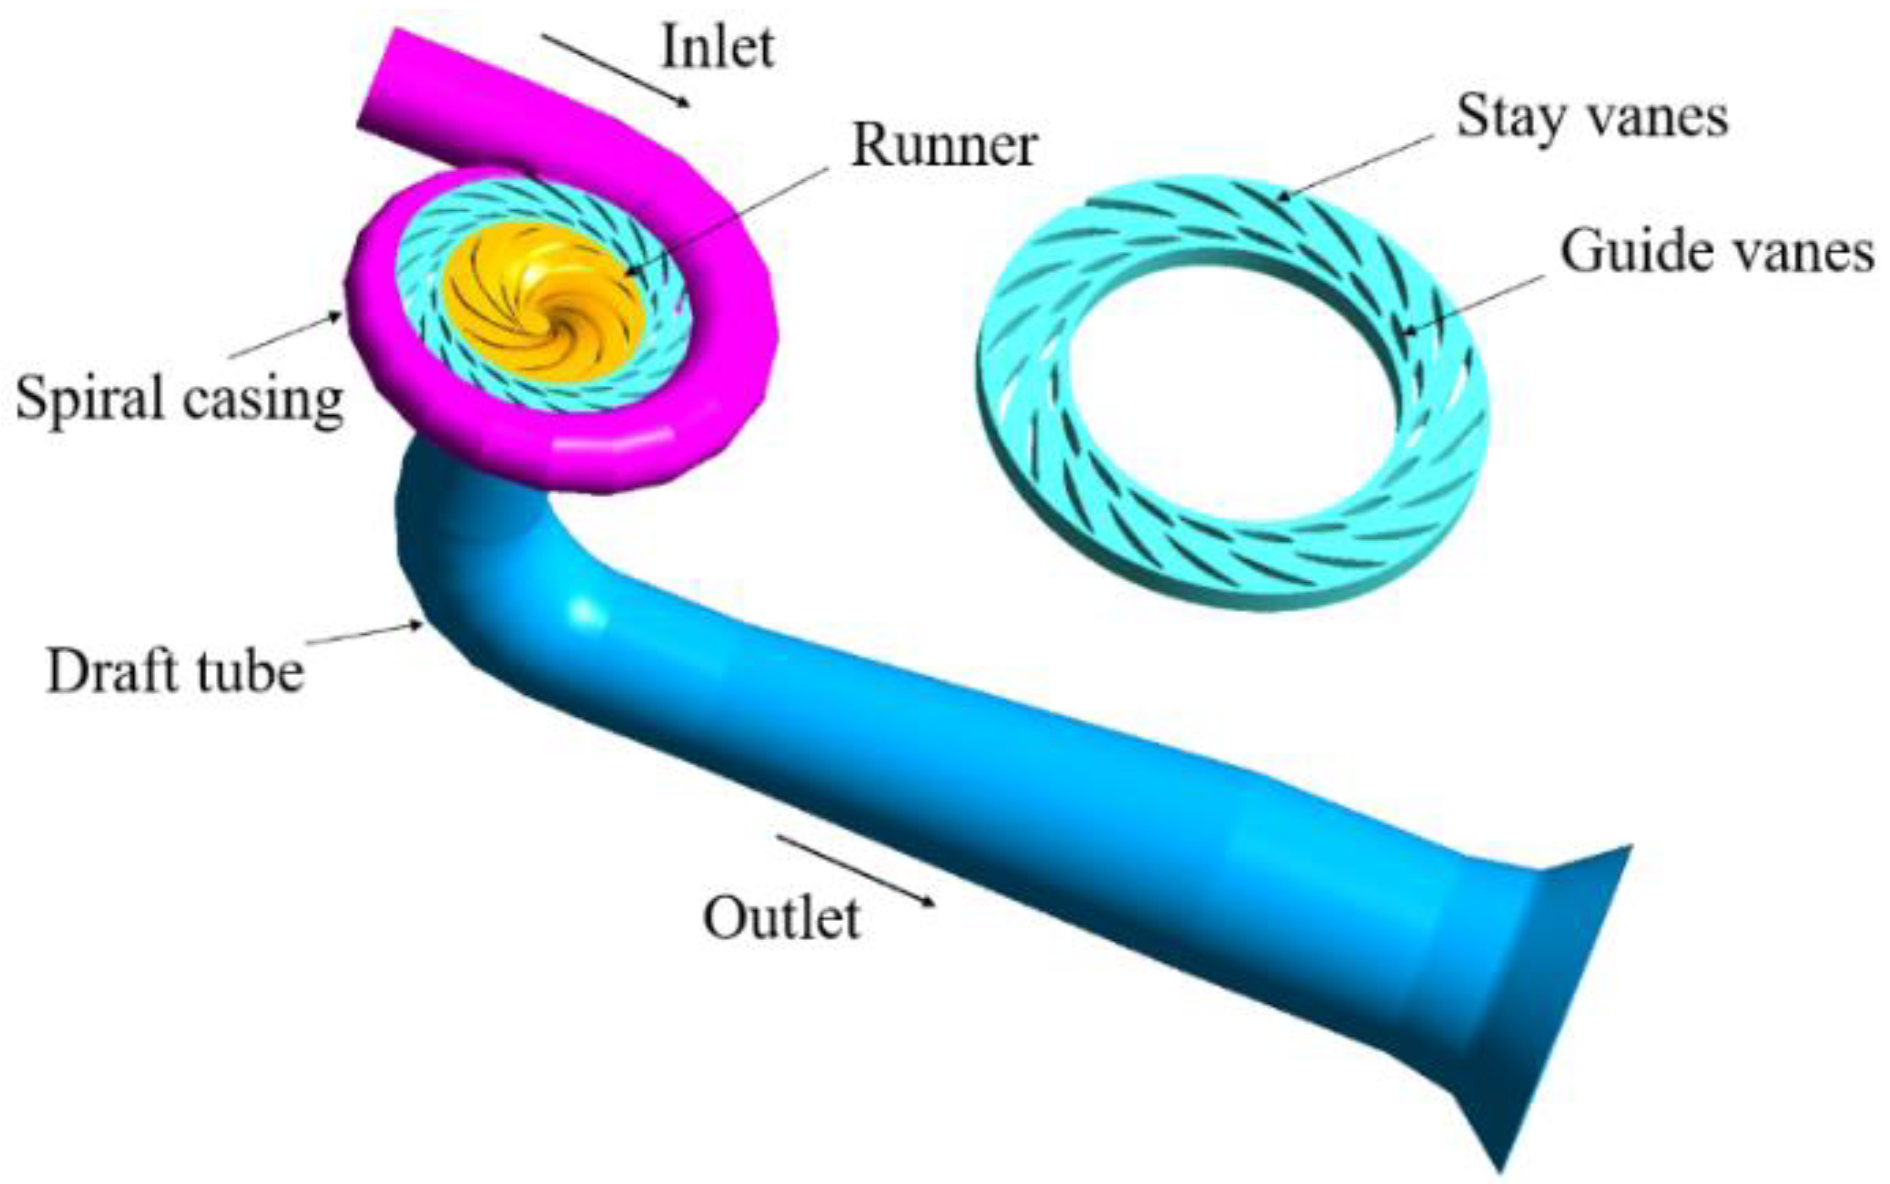
Figure 1. Three-dimensional domain of the pump–turbine.
Energies 14 06683 g001
Figure 2. Details of the grid.
Energies 14 06683 g002
Figure 3. Grid independence study.
Energies 14 06683 g003
Figure 4. Characteristic curve of unit parameter.
Energies 14 06683 g004
Figure 5. Monitoring points in the simulation.
Energies 14 06683 g005
Figure 6. Time and frequency characteristics at monitoring point RN UP 01: (a) time domain (b) frequency domain.
Energies 14 06683 g006
Figure 7. Pressure fluctuations of GVs.
Energies 14 06683 g007
Figure 8. High-frequency amplitudes of different positions.
Energies 14 06683 g008
Figure 9. Flow distributions of flow passage: (a) Guide vanes (b) Runner.
Energies 14 06683 g009
Figure 10. Frequency domain diagram of pressure fluctuations in guide vanes: (a) Pressure fluctuations of GVs (b) Pressure fluctuations of GV17.
Energies 14 06683 g010
Figure 11. Frequency domain diagram of pressure fluctuations: (a) RG 06 (b) RG 11.
Energies 14 06683 g011
Figure 12. Propagation direction of pressure signals.
Energies 14 06683 g012
Figure 13. Discharge of GVs under the braking operating condition.
Energies 14 06683 g013
Figure 14. Flow patterns of stay/guide vanes at different time.
Energies 14 06683 g014
Figure 15. Vortex structures in vaneless space.
Energies 14 06683 g015
Figure 16. Comparison of pressure fluctuations at monitoring points: (a) RN MIDs (b) CTs.
Energies 14 06683 g016
Figure 17. Frequency domain diagram of the pressure fluctuations of RN05s and CT07.
Energies 14 06683 g017
Figure 18. Flow patterns of different channels.
Energies 14 06683 g018
Figure 19. Local entropy production rate (LEPR) distribution: (a) with vortices (b) without vortices.
Energies 14 06683 g019
Figure 20. Characteristic frequency of GV11.
Energies 14 06683 g020
Figure 21. Low-frequency wave of the monitoring points in cone pipe and guide vanes.
Energies 14 06683 g021
Figure 22. Comparison of pressure fluctuations between RG01 and RN MID 02.
Energies 14 06683 g022
Figure 23. Propagation directions of low-frequency pressure fluctuations: (a) The maximum amplitude of each monitoring points (b) The amplitude of 0.19 fn.
Energies 14 06683 g023
Figure 24. Flow patterns of stay/guide vanes at different moments.
Energies 14 06683 g024
Figure 25. Diagram of low-velocity vortex in vaneless space.
Energies 14 06683 g025
Table 1. Differential pressure losses in typical operating conditions.
Operating ConditionSpiral CasingStay/Guide VanesRunnerDraft Tube
Turbine (S03)7.5%23.6%55.3%13.2%
Runaway (S05)0.019%15.1%79.3%5.5%
Braking (S06)0.47%37.6%49.4%10.5%
Reverse pump (S10)0.56%51.2%46.2%2.1%
Table 2. Pump–turbine model parameter specifications.
ParameterValueParameterValue
Runner blade number Z9Guide vane number Zg20
Rotational speed nr (r/min)499.850Stay vane number Zs20
Runner inlet D1m (m)0.450 Guide vane height bg0.044
Runner outlet D2m (m)0.250 Guide vane distribution diameter D00.541
Table 3. Detailed grid node specifications (×106).
PartsMesh IMesh IIMesh IIIMesh IV Mesh V
Spiral Casing & Stay/guide Vanes1.932.282.624.025.42
Runner1.441.772.292.653.24
Draft Tube0.480.891.071.501.54
Total3.854.945.988.1710.20
Publisher’s Note: MDPI stays neutral with regard to jurisdictional claims in published maps and institutional affiliations.