Abstract
Current research on human comfort has identified a gap in the investigation of multi-domain perception interactions. There is a lack of understanding the interrelationships of different physio-socio-psychological factors and the manifestation of their contextual interactions into cross-modal comfort perception. In that direction, this study used data from a post occupancy evaluation survey (n = 26), two longitudinal comfort studies (n = 1079 and n = 52) and concurrent measurements of indoor environmental quality factors (one building) to assess the effect of thermal, acoustic and air quality perception interactions on comfort and satisfaction of occupants in three mixed-mode university office buildings. The study concluded that thermal sensation (TSV) is associated with both air quality (ASV) and noise perception (NSV). The crossed effect of the interaction of air quality and noise perception on thermal sensation was not evident. The key finding was the significant correlation of operative temperature (Top) with TSV as expected, but also with noise perception and overall acoustic comfort. Regarding the crossed main effects on thermal sensation, a significant effect was found for the interactions of (1) Top and (2) sound pressure levels (SPL30) with air quality perception respectively. Most importantly, this study has highlighted the importance of air quality perception in achieving occupants’ comfort and satisfaction with office space.
1. Introduction
Energy use of buildings as well as the health and wellbeing of a building’s occupants have been repeatedly associated with the interaction between occupants and their indoor environment as they respond to environmental cues to achieve comfort [1,2,3,4]. Indoor environmental quality (IEQ) is often evaluated by assessing thermal, acoustic, visual and air quality factors [1,5]. A recent literature review, however, has identified a gap in studies on the combined effects of these factors on overall comfort [6], as most studies take place in controlled environments (e.g., climate chambers) and/or focus only on single effects.
Comfort research has historically been approached with siloed, discipline-specific approaches and methods that fail to provide a holistic interpretation of the physio-socio-psychological relationships and their evolution over time and external forcing. In addition, differences between individuals [3,7], and the yet unknown mechanisms of how stimuli trigger sensations, add complexity when evaluating comfort and applying comfort models to building design and the operation of building systems [8]. From a trans-modal perspective [9], the interactions between different comfort domains (i.e., cross-modal effects [10,11,12]) are interpreted as comfort and satisfaction within a physio-psychological context.
Current research has investigated the relationships and mechanisms that link the level of comfort with the perception of indoor environment quality and its contextual manifestation. In general, comfort dimensions are distinguished as expectation (non-sensory stimuli), sensation (sensory stimuli) and relative perception (satisfaction and preference) [13]. This interpretation of comfort is linked to the “affect” defined in Heydarian et al.’s (2020) [14] review of behavioural theories and to the holistic review into the drivers of thermal perception [15]. In that direction, Schweiker et al. (2020) examined the concept of “seasonal alliesthesia” that approaches comfort through the view of thermal pleasure and suggests the existence of long-term experiences and expectations, which affect contextual thermal perception [13,16]. Studies on multi-modal perception interactions and their effect on comfort remain limited. Tang et al. (2020) in a controlled laboratory experiment identified relationships between indoor air quality and both thermal satisfaction and sound pressure levels [17]. In another controlled experiment, Yang and Moon (2019) investigated multisensory interactions between thermal, acoustic and illuminance conditions, and their study has revealed that indoor sound levels have a larger impact on thermal comfort than illuminance, whereas interestingly sound levels had significant effects on both the overall indoor environment and visual comfort [18]. Similarly, in an experimental laboratory study, satisfaction with thermal conditions has been shown to influence satisfaction with other IEQ factors, but most importantly thermal satisfaction has created “comfort expectations” that subsequently affect an occupant’s evaluation of other surveyed parameters [19]. These important findings all come from studies in controlled environments and quite often with student participants. Most studies usually assess the combined effects of IEQ factors, and they evaluate the relative effect and influence of factors, instead of explicitly looking at interaction effects in terms of the examined factors. This paper addresses those limitations by presenting results from “real life” office environments, and we analyze the multi-modal interactions (i.e. cross-modal) between thermal, acoustic and air quality perception and commonly monitored environmental IEQ factors.
Over the last few decades, before the SARS COVID pandemic, open-space offices prevailed as an office type, mainly due to the reduction in facility costs that this working environment offers. Several studies have shown that open-space design has adversely affected productivity, health and wellbeing in the workspace [20,21]. Amount of space, noise, visual intrusiveness and lack of privacy are commonly identified by employees as the key factors for their (lack of) satisfaction with their workspace environment [22,23]. More recently, studies have shown that despite the important roles of factors related to the indoor environment, there are additional socio-psychological parameters that could influence thermal perception and comfort, such as personal mood, aesthetics, likable architecture, office layout and employer’s policies related to wellbeing [24,25,26,27]. Post Occupancy Evaluation (POE) methodologies have been increasingly used to identify issues that might affect a building’s performance and occupant satisfaction. POE has gained attention from the industry and has been included as a requirement in popular “green” building certifications and sustainability assessment methods. Reportedly, though, high scores in such certification schemes often do not translate into occupants’ satisfaction with the indoor environment [28,29]. Nevertheless, POE results offer valuable insights into the aspects that require attention and cause dissatisfaction among the buildings’ users.
This study combines results from a POE and comfort surveys to evaluate the mixed effects of indoor environment parameters and multi-domain comfort on thermal comfort perception. The present work aims to provide new evidence on the cross-modal comfort perception in “real-living” conditions. The research questions addressed by this study are as follows:
(1) Is there a cross-modal effect of thermal, acoustic and air quality perception on occupants’ comfort?
(2) How does indoor environmental quality affect thermal perception?
2. Materials and Methods
2.1. Study Design
This research was carried out in three stages, described as follows.
Stage 1: In the first stage, a Post Occupancy Evaluation (POE) was carried out following the Building Use Studies (BUS) methodology [30,31]. The aim of POE was to gain an understanding of the buildings users’ satisfaction with their living environment. BUS is an established POE methodology that has been widely used and reported in relevant literature [29,32,33,34]. On top of the expected benefits, BUS offers the opportunity to compare occupants’ satisfaction and building performance with other similar buildings worldwide.
The case study building was a mixed-mode office building at the University of Southampton (referred to as B1). This pilot study had 26 participants who completed the BUS online questionnaire survey during August 2020. The survey includes 16 sections, collecting demographic data such as age, gender, working hours and days at the building and at their work area. It is also designed to collect feedback regarding the building’s environmental performance, building services and overall design. The analysis of the POE focused on the reported satisfaction with typical indoor environmental quality (IEQ) (air quality, thermal conditions, noise and lighting) factors and the occupants’ thermal perception and comfort in winter and summer. The survey applied a 7-point scale to assess the satisfaction level from “1” representing “very dissatisfied” to “7” representing “very satisfied”. Similarly, a 7-point scale was used to assess thermal comfort from “1” representing “uncomfortable” to “7” representing “comfortable”.
Stage 2: In the second stage, building upon the findings from the POE, a weekly “right-here right-now” comfort survey took place over a period of a year (from 25 July 2017 to 25 June 2018) to review the relationship among thermal sensation (TSV), thermal preference (TPV), acoustic perception (NSV) and perceived air quality (ASV). The thermal sensation vote (TSV), thermal preference vote (TPV), acoustic (i.e., noise) perception vote (NSV) and air quality perception vote (ASV) were collected from the questionnaire responses, as shown in Table 1. Four different scales were used following the smart controls and thermal comfort project (SCATs) survey method [35]. Thermal sensation (TSV) was assessed with the ASHRAE 7-point scale [36], and thermal preference, acoustic and air quality perception were evaluated with a relevant 7-point scale, respectively (Table 1). The survey responses were collected from participants in two mixed-mode office buildings at the University of Southampton (referred to as B2 and B3). The number of valid, completed surveys and consequently the sample size is n = 1079 responses from 116 individual participants. In addition to the surveys, the researchers interviewed the respective building managers to understand any daily operation issues and common grievances from the occupants.

Table 1.
Sampled questions related to the investigated variables from the weekly survey questionnaires.
Stage 3: In Stage 3 of the research design, a small and focused study in building B1 was undertaken to assess thermal, acoustic and air quality perception with a comfort survey and concurrent environmental conditions monitoring (i.e., sound pressure levels, air temperature and relative humidity), between January and March 2020. Typical individual control opportunities were monitored such as (1) private office door open/close, (2) window open/close, (3) air conditioning on/off, (4) ventilation on/off and (5) heating on/off. The sample comprised 12 participants, and most worked in an open plan office (N = 9) in B1 or individual offices (N = 3) at the same floor level. Following a similar method as Stage 2, the 12 participants in the Stage 3 survey were asked to complete three surveys; an initial background survey that collected contextual metadata and demographic information, a weekly survey that assessed their comfort perception and productivity, and a final feedback survey. The questionnaire followed the thermal comfort informative for subjective evaluation in the ASHRAE 55 [36] and EN 15251 (Annex H) [37]. The three investigated variables (TSV, NSV, ASV) were assessed with the same as in Stage 2 perceptual scales. Non-intrusive environmental sensors were installed in selected locations that represent the average ambient environment. Although the participants from B1 were different from the participants at B2 and B3, they all worked in similar buildings at the same location, and they did similar jobs. In addition, the buildings were maintained and operated by the same organization, they all had mixed-mode ventilation and followed the same operation schedule.
2.2. Case Study Buildings
The three case study buildings have been commissioned recently and they are located at the Highfield and Bolderwood Campuses of the University of Southampton, UK. All three buildings have mixed-mode ventilation (both mechanical and natural ventilation) providing heating in winter and peak cooling only during extreme heat events in summer. Figure 1 shows the three buildings’ typical floor plans which all encompass cellular offices and open plan office spaces next to a central atrium. The atriums are key features of the natural ventilation strategy.
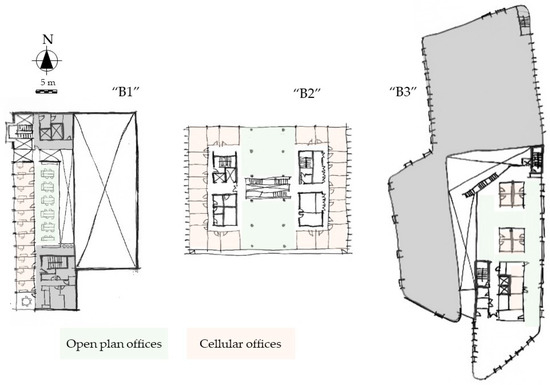
Figure 1.
Floor plans of the open (green) and cellular (orange) office spaces in B1 (left), B2 (middle) and B3 (right) buildings at the University of Southampton Bolderwood (B1 and B2) and Highfield (B3) campuses.
Traffic noise levels as represented with LAeq,16h were estimated around the 60 dB level for all the buildings. LAeq,16h is defined as the annual average noise level (in dB) for the 16-h period between 07:00–23:00 and it is typically assessed at a receptor’s height of 4 m above ground. B1 floors are connected with an atrium that starts from the common, multi-functional space at the ground floor and extends upwards to the roof of the building. Each floor has an open plan office and a mezzanine style area open to the atrium and the corridor next to the private, individual offices (Figure 1).
2.3. Indoor Environmental Quality (IEQ) Data Collection
The dataloggers used for the IEQ data collection in Stage 3 of this study were installed whenever possible at heights and locations that would be representative of the occupants’ working conditions while seated at a desk. Air temperature (T) and relative humidity (RH) were monitored with 5 min frequency. Sound pressure levels were monitored every second. The specifications of the data loggers and the sampling rates are shown in Table 2. In the beginning of Stage 3, the reverberation time (RT) was measured with a Brüel & Kjær 2250 handheld analyser in unoccupied conditions at different places of B1, all with a potential to impact the acoustic conditions of the surveyed offices. The wide band reverberation times were averaged across the 400 Hz to 1.25 kHz frequencies and the acoustic conditions were assessed based on the RT60 (T30) measurements. The sound test at the atrium was the only one not surprisingly to return high RT longer than 1.2 s while the other tested locations had RT values lower than 1 s.
Table 2.
Environmental monitoring data logger specifications.
Three sound pressure level (SPL) meters were used to assess background noise conditions during the working and after work hours. The sound level meters were positioned at heights and locations to represent the sound heard by the participants while at their typical seating positions (about 1.0 m above floor level). The sampling time was 1 s to allow for the detection of short impulse sound sources. The collected sound data were used to compute time-averaged acoustic parameters such as the equivalent continuous sound level (LAeq) and LA10, a statistical noise level measure commonly used to evaluate if the sound pressure levels exceed the acceptable threshold (i.e., 50 dB [38]) for 10% of the study’s duration.
2.4. Building Services and Controls
Individual, cellular offices in B1 have operable windows, thermostats and passive infrared sensors that control the mechanical ventilation and cooling through a roof mounted air-handling unit. The heating is provided with a wet system through radiators with thermostatic valve (TRV) control. Open plan offices have no direct access to windows. Ventilation and cooling are provided through a roof-mounted, centralised air-handling unit.
B2 has operable windows with external shades whereas mechanical ventilation and cooling are provided by centralised air handling units through floor grilles across the span of the floor. Trench heating is provided with radiators around the perimeter of the floor, next to the windows, through grilles at the floor. There are thermostats in each individual office and at different zones of the large open plan office space.
B3 has operable windows too. Mechanical ventilation, heating and cooling are provided by centralised air handling units and distributed by wall and roof mounted grilles. There are thermostats in the individual offices and in different zones at the open plan office space.
In most cases the thermostats at all studied buildings are connected with the building management systems (BMS) and the temperature of each zone is pre-set and controlled by the building managers and the estates and facilities personnel. Individual access and control of the temperature is restricted.
2.5. Participants
The number of participants in the sample at each stage and the response rates are shown in Table 3. The survey duration refers to the number of weeks that comfort survey questionnaires were sent to each participant. In general, the response rate was acceptable for web-based surveys [39] and comparable with previous relevant studies when sample size is considered [40].
Table 3.
Sample size and response rate at the different stages of the study.
The sample at all stages comprised administrative staff, academic staff and postgraduate researchers that work regularly and have a permanent workspace in the three case study buildings. All participants had consented to participate in the questionnaire surveys. All responses and data were pseudonymized, and any data were collected and managed in accordance with the approved ethics.
3. Results
3.1. Stage 1—Post Occupancy Evaluation and Satisfaction with Building (B1, n = 26 Valid Questionnaires)
The BUS POE results in general revealed high level of satisfaction with the building design and environmental conditions. The overall comfort was overwhelmingly voted as satisfactory (light shades of grey in Figure 2) and similar results were obtained for the satisfaction with the thermal conditions in the heating (winter) and cooling (summer) seasons. In the heating season especially more than 75% of the responses indicated satisfaction with thermal comfort. This level of satisfaction was less prominent during summer, pointing to issues that likely have to do with the ventilation and cooling of the office space during hot spells (Figure 3).
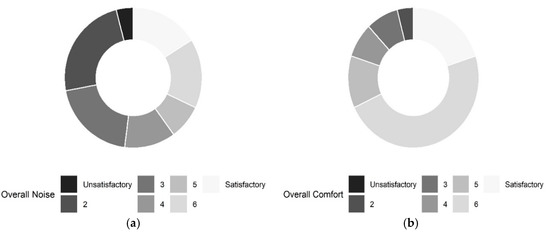
Figure 2.
Level of satisfaction with: (a) Overall Noise; (b) Overall Comfort from the POE results in Stage 1 of the study.
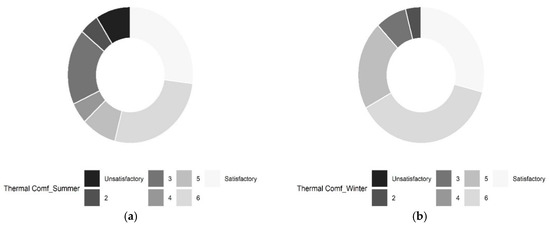
Figure 3.
Satisfaction vote for the thermal conditions in the office: (a) in summer; (b) in winter.
In relation to this study, it is interesting that the results from the POE, despite the high levels of satisfaction with most aspects of the building’s environment and use, showed a rather widespread dissatisfaction with the overall noise levels (Figure 2). That result was expected as background noise has been repeatedly identified as a cause of dissatisfaction in open plan offices [41,42], and the individual offices in the sample have visitors regularly. The POE analysis did not assess the relationship between noise dissatisfaction and interruption frequency.
The review of satisfaction levels for different room occupancy (i.e., single, twin or multi) revealed a clear pattern. Individual office occupants were likely to be dissatisfied with the frequency of interruptions but not noise. Whereas, in open plan and shared office spaces, users were mostly dissatisfied with the overall noise rather than the interruptions (Figure 4).
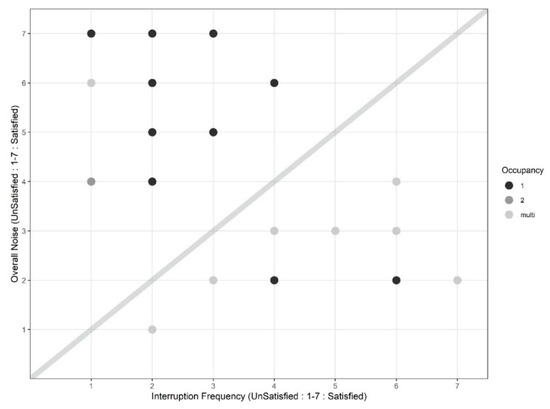
Figure 4.
Scatterplot of the Overall Noise satisfaction and satisfaction with Interruption Frequency grouped by different room occupancy (1: single office; 2: twin office; multi: open plan multi occupancy).
Following that rationale, the next hypothesis was that background noise is related to productivity changes and at the same time noise perception and productivity are likely to be affected by the hours at work. This means busy, “long” days in the office will increase the dissatisfaction with noise and decrease the productivity. The Goodman Kruskal’s gamma test was used to investigate if there was a correlation of the Overall Noise with Interruption Frequency and with Productivity Change at the office spaces occupied by the participants. Goodman Kruskal’s gamma (GKG) is a test of association between two ordinal variables such as in this case where responses are in the Likert scale. GK gamma (G) takes values in the space (−1, 1) with G = −1 and G = 1 denoting a strong negative and positive association respectively. The productivity measurement in this study is based on a self-assessment of the survey respondents, which is completely subjective and might be biased by the occupants’ comfort at the time of response. In Figure 5, the responses were grouped by the number of hours the participants reported that they spent working in the office every day.
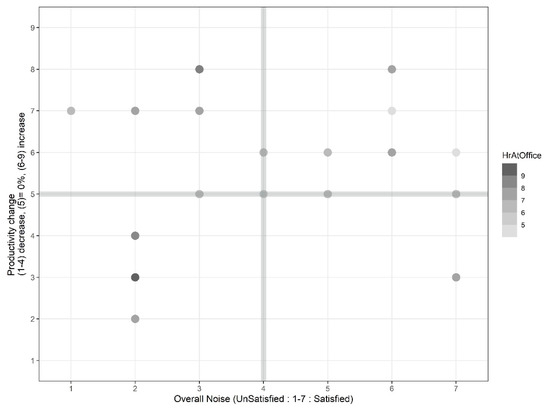
Figure 5.
Scatterplot of the Overall Noise satisfaction and Productivity Change grouped by the duration of occupants’ workdays (HrAtOffice: hours spent at work).
The productivity change was reported with a scale from “1” to “9” in 10% increments and “5” denoting the central, “no change”, point. The satisfaction with overall noise is shown as before with a 7-point scale where “4” marks the “neither noisy nor quiet” point.
The GKG test of the association showed a significant but moderate negative correlation between Overall Noise and Interruption Frequency satisfaction (G = −0.55, confidence intervals (CI (−0.84, −0.27), p = 0.003 < 0.01). As overall noise satisfaction increases, the interruption frequency satisfaction decreases. In other words, as the noise level increases the participant may be less sensitive to interruption disturbances. The relationship between Overall Noise satisfaction and Productivity Change was not significant (G = 0.165, CI (−0.26, 0.59), p = 0.352 > 0.05). However, Figure 5 shows that participants working longer hours at the office are likely to be more unsatisfied with overall noise level (7.7 h on average for participants reported being unsatisfied (levels 1–3) and 6.9 h on average for participants reported being satisfied (levels 5–7)). A previous study has found that the working hours threshold between office occupants who are satisfied and those who are dissatisfied with the IEQ is as low as 20 h/week [43].
3.2. Stage 2—Comfort Survey (B2 and B3, n = 1079 Valid Questionnaires)
This stage builds on the results of the POE to examine the relationship among thermal sensation (TSV), thermal preference (TPV), acoustic perception (NSV) and perceived air quality (ASV). Stage 1 has identified that noise is the only category where satisfaction levels were rated from average to low. The hypothesis at this stage of the study was that there is a relationship among the three examined comfort domains and their interaction terms. In this context, the study assessed the GKG to examine the existence of correlations among TSV, NSV and ASV and investigate the effect of noise perception, indoor air quality and their interactions on thermal perception. Initial descriptive analysis did not indicate the existence of a linear relationship between noise perception (NSV) and thermal sensation (TSV) (Figure 6). The distribution of responses in the graph shown in Figure 6, suggests that most responses are in the neutral to “warm” (TSV 0, 1) and the “neither noisy nor quiet” to “slightly noisy” (NSV 0, −1) area of the graph.
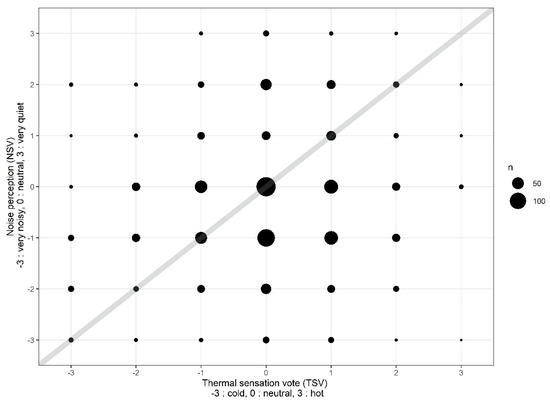
Figure 6.
Comparison of agreement between thermal and noise perception vote results for Stage 2 (the number of responses n is proportional to the area of circles).
With regard to the association between air quality perception and thermal perception, Figure 7 indicates that most responses are on and around the central point denoting neutral vote. Interestingly, “slightly bad” to “bad” air quality perception (ASV −1 to −2) was associated with a warm perception of the thermal environment. This result raises questions about the role of air movement and relative humidity levels which are usually responsible for the feeling of “stuffiness” that is typically assessed through carbon dioxide concentration monitoring [44]. Following this finding, Figure 8 describes the relationship of air movement sensation (AMS) and air quality sensation (ASV).
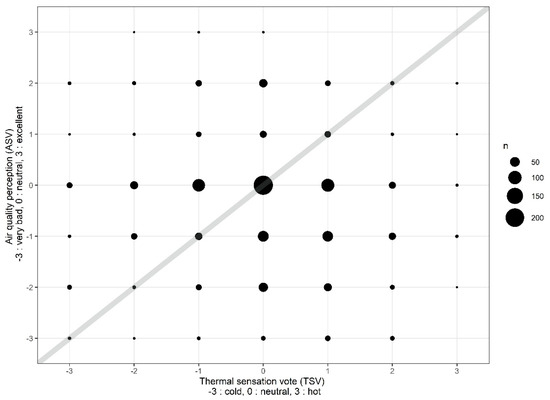
Figure 7.
Comparison of agreement between thermal and air quality perception vote results for Stage 2 (the number of responses n is proportional to the area of circles).
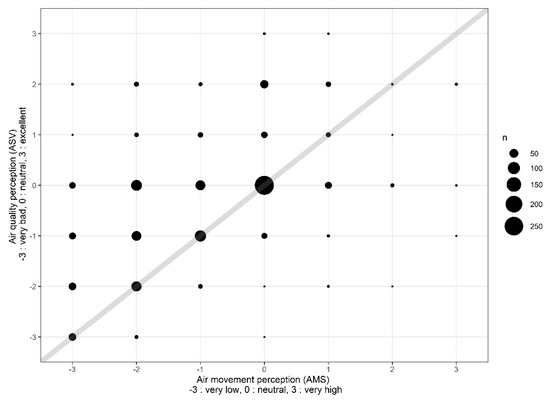
Figure 8.
Comparison of agreement between air movement and air quality perception vote results for Stage 2 (the number of responses n is proportional to the area of circles).
The results, as expected, show low air movement perception associated with “bad” air quality perception. Most importantly, the questionnaire results suggest that air movement is perceived as being low (AMS 0 to −3) and the air quality is perceived as rather poor (ASV 0 to −3).
The GKG test revealed a significant but weak negative correlation between TSV and ASV (G = −0.114, CI (−0.18, −0.04), p = 0.026 < 0.05). Similarly, TSV was found to be positively but weakly correlated with NSV (G = −0.109, CI (0.04, 0.18), p = 7.966 × 10−05 < 0.01). As expected, there was also a significant correlation between ASV and NSV (G = 0.258, CI (0.18, 0.33), p = 2.2 × 10⁻¹⁶ < 0.01).
The last test examined the combined effect of air quality perception (ASV) and noise perception (NSV) on thermal perception (TSV) and the effect of their interactions. For this analysis, mixed effect logistic regression models were assessed, following the methodology described by Schweiker & Wagner, 2018 [45]. The analysis used the R [46] packages lme4 [47] and lmerTest [48]. The mixed effect models were compared with the maximum likelihood estimation (ML). The stepwise backward elimination process (function step.model in R) was used to evaluate the significance of the effects of interactions and optimise the final model. The participants’ unique ID was used as the random effect variable. The final model had the formula (TSV ~ ASV + NSV + (1|ID), where (1|ID) is the random effect variable. The effect of the interaction term ASV:NSV on the TSV was not significant (p = 0.83 > 0.05).
To follow the modelling analysis, the study explored the relationship between TSV, TPV and ASV. It is important to note that the highest levels of thermal sensation (‘hot’ coded “3”) and thermal preference (‘much cooler’ coded “−3” and ‘much warmer’ coded “3”) should not be taken into consideration as the sample sizes were small and the confidence intervals were large. As shown in Figure 9, when participants felt cooler (TSV) or preferred to be warmer (TPV) there was a slight adverse effect on perceived air quality (ASV). However, when participants felt warmer (TSV) or preferred to be cooler (TPV) there was a strong adverse effect on perceived air quality. In summary, the respondents gave the most favourable assessment of air quality when they felt thermally comfortable and preferred no change in their thermal environment.
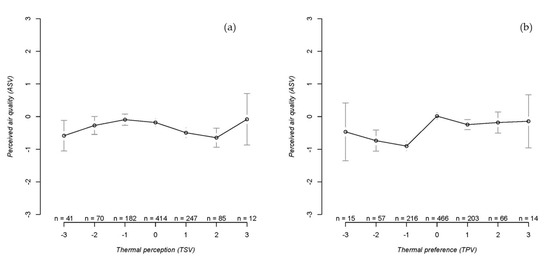
Figure 9.
Perceived air quality for: (a) thermal perception votes; (b) for thermal preference votes, for Stage 2 (n shows the number of responses).
3.3. Stage 3—Comfort Study in Focus Group (B1, n = 52 Valid Questionnaires)
3.3.1. Environmental Conditions
A summary of common descriptive statistics of the environmental variables monitored in B1 during the third stage of this study is shown in Table 4. The mean and median values are almost equal indicating symmetrical distribution of the variables. Relatively small standard deviation in combination with the small variability (Max-Min) suggest that the building’s environment was quite stable.
Table 4.
Descriptive statistics of the main environmental parameters monitored at Stage 3.
An example of the noise level measurements from one of the three sensors in the open plan office is shown in Figure 10. The red-dashed line shows the 50 dB acoustic comfort limit suggested for office spaces by building design guidelines [38].
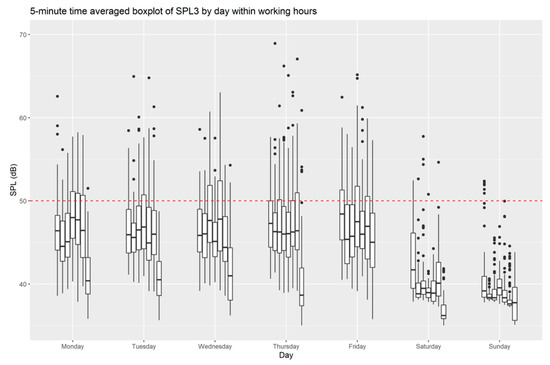
Figure 10.
Boxplots of the 5 min averaged observations of sound pressure levels (SPL) collected from the open plan office in B1 during working hours (weekend included as baseline) for Stage 3. Red-dashed line denotes the recommended acoustic comfort threshold [38] for office space in the UK.
The 5-min averaged sound pressure level observations pointed out that during the working days the sound exceeds the recommended levels in about 25% of the observations (Q4 of boxplots) within the working hours. That result could confirm the existence of issues with acoustic comfort and noise satisfaction as it was shown by the POE at Stage 1 of the analysis in this paper (note: same office but different sample).
3.3.2. Correlation Analysis and Effects of Interactions
The first part of the correlation analysis investigates the relationship between the current noise perception when the questionnaire was answered (NSV), the acoustic comfort (NSC) and the noise levels perception in the hours before the survey (NSB). The main hypothesis was that the acoustic comfort will be related both to the previous and current sound levels. The Goodman Kruskal’s gamma was calculated for the NSV, NSB and NSC pairs to reveal the strength and direction of any associations. The test revealed a strong negative (G = −0.735, CI (−1, −0.4)) and significant association (p = 0.02 < 0.05) between the current noise perception (NSV) and acoustic comfort (NSC). As expected, when noise perception changed from “very noisy” (−3) to “very quiet” (3) the acoustic comfort vote changed from “uncomfortable” (5) to “comfortable” (1). Interestingly, the analysis also found significant strong associations between the noise preconditions (NSB) with current noise perception (NSV) (G = 0.796, CI (0.6, 0.99), p = 2.03 × 10⁻⁷ < 0.01) and with the acoustic comfort vote (NSC) (G = −0.912, CI (−1, −0.776), p = 3.53 × 10⁻⁶ < 0.01) respectively.
The second part of the analysis at this stage, looked at the relationship between current noise perception (NSV), with thermal sensation (TSV), thermal comfort (TCV) and the perception of indoor air quality (ASV). Results from Stage 2 had found that TSV is associated with both the ASV and the NSV but there was not any significant effect of their interaction. It is difficult to assess the impact of the sample size effect on the results and the sample of Stage 3 is small. Therefore, Kendall’s correlation was chosen for the analysis in order to build confidence on the previous results. The Kendall’s correlation matrix of results (Table 5) confirmed this study’s findings that thermal perception is negatively correlated with air quality perception (ASV) (TSV ~ ASV, = −0.363, p = 0.003 < 0.01) but there was not conclusive evidence on an association between TSV and noise perception (NSV).
Table 5.
Kendall’s correlation results ((p)) matrix for Stage 3 of the study design.
This finding lead to the investigation of direct associations of TSV with sound and temperature environmental factors (Table 6) instead of the perception votes used until this point. The 30 min averaged sound pressure level observations (SPL30) were negatively associated with noise perception but the association with acoustic comfort was not significant. Most importantly, the operative temperature (Top) was found to be significantly associated with all thermal (TSV), noise (NSV) perception and acoustic comfort (NSC).
Table 6.
Kendall’s correlation results ((p)) for two monitored IEQ factors.
Lastly, mixed effect logistic regression analysis was used, following the same methods with stage 2, to evaluate the effect of any interactions between thermal, noise and air quality parameters on their impact on thermal sensation. Different combinations of predictors and random effect variables were examined with thermal sensation (TSV) as the dependent variable. The independent fixed effects variables were the operative temperature (Top), the air quality perception (ASV), the 30 min average sound pressure level (SPL30), the daily average outdoor temperature (Tout_d), and the outdoor and indoor temperature at the time of the survey (Tin/out_s). The continuous environmental variables were standardized, scaled based on their means and standard deviations. The mixed effect models were compared with the maximum likelihood estimation (ML) and a stepwise backward elimination process (function step.model in R) was used to evaluate the significance of the effects of interactions and optimise the final model.
The results of the mixed effect logistic regression with TSV as dependent variable and NSV as random effect variable, revealed that the effect of the interactions of (1) Top with ASV and (2) SPL30 with ASV are both significant (p < 0.05) whereas the independent environmental variables related with the outdoor and indoor temperature and their interactions are not. Findings about the interaction terms were consistent across cases where thermal (TCV) and acoustic (NSC) comfort were allowed to vary randomly (i.e., set as random effect variable). The final model had the formula (TSV ~ Top + SPL30 + ASV + (1|NSV) + Top:ASV + SPL30:ASV) where (1|NSV) is the random effect variable and Top:ASV + SPL30:ASV are the interaction terms for Top and SPL30 with ASV. The confidence intervals are shown in Table 7 (standardized variables).
Table 7.
Confidence intervals for the independent variables (standardized) with significant effect on TSV.
4. Discussion
The POE results identified potential issues with building acoustics and noise in the case study building B1. Individual, cellular office occupants were mostly dissatisfied with the frequency of interruptions, whereas the occupants of the open plan office were mostly dissatisfied with background noise. Open plan offices are often preferred as a solution because they maximize density, but their design should include provisions for noise control [41,42]. The marked contrast between the cause of dissatisfaction in single/twin and multi occupancy offices in an academic context could also be a result of the role and responsibilities of individuals and the hierarchy in ranking and space. Senior academics are more likely to have individual offices and frequent interruptions from visitors. Open plan office space is typically occupied by research students, researchers and administration staff. In general, the POE showed that noise was the only category that occupants were not satisfied with the building and the indoor environmental quality (IEQ). In relation to this proposition of indoor noise nuisance, it was found that the overall noise perception was negatively associated with the frequency of interruptions. Most importantly it was shown that noise did not have a significant effect on productivity. This result contradicts previous studies that concluded background noise has adverse effects on productivity [49,50,51,52]. Relevant research has shown that the factors associated with productivity and the magnitude of their effect are related to the office types, and they include, as expected, IEQ parameters and demographics but also building design features and organizational arrangements (e.g., working hours, position and workplace arrangements) [27,53].
Adding to the current literature on IEQ and its association with health and comfort, it was shown that bad air quality is generally associated with a “warm” thermal sensation response. This could be describing the feeling of “stuffiness”, a condition often attributed to low air movement, high RH and a high concentration of carbon dioxide [44,54]. Looking into the association of related IEQ components and their interactions, this study pointed out that air quality (ASV) and noise perception (NSV) are both correlated with thermal perception (TSV), but there is no evidence for the effect of their interaction on TSV. Air quality perception was correlated with both TSV and NSV, showing once again the complexity of occupants’ perception and comfort. With regard to the relationship between air quality and thermal comfort, participants who were feeling uncomfortable (in particular if feeling warm and preferring to be cooler) perceived the air-quality worse than participants who felt comfortable. This finding is consistent with results from previous studies [55].
Building on the findings from the first two stages, the third stage of the analysis in this study looked at noise perception and its relationship to background noise exposure duration (based on sound pressure levels in the hours before the survey was taken). Interestingly, the noise perception in the hours before the survey was associated with both the noise perception at the time of the survey (NSV) and overall acoustic comfort (NSC). Then a combined effect analysis of air quality and noise perception on the thermal perception was undertaken through a different method in order to validate the findings from stage 2. The results confirmed the weak negative correlation between TSV and ASV but could not conclude on the relationship of TSV with noise perception. The contradictory results lead to the investigation of the effect of the monitored environmental parameters directly on the thermal and noise perception. The results indicated that operative temperature, Top, was correlated with thermal sensation as expected, but it was also correlated with noise perception and acoustic comfort. In conclusion, thermal perception in this last analysis was found to be a function of the Top, the sound pressure levels (SPL30) and air quality perception (ASV), but there was also a significant effect found of the interaction terms of (1) Top with ASV and (2) SPL30 with ASV. A finding that confirmed the importance of good air quality to achieve comfort in office buildings.
5. Conclusions
This study concluded that thermal sensation is associated with both air quality and noise perception. An effect of the interaction of air quality and noise perception on thermal sensation was not evident. A key finding was the significant correlation of operative temperature (Top) with TSV as expected, but also a correlation of operative temperature with noise perception and overall acoustic comfort. Regarding the crossed effect of IEQ parameters on the thermal sensation, a significant effect was found for the interaction of (1) Top with air quality perception and (2) sound pressure levels (SPL30) with air quality perception. Most importantly, the findings highlighted the importance of air quality perception in achieving comfort and high satisfaction within the space where people work. It is expected that air quality in office buildings will play an important role in the future design of buildings and building services systems. The conclusions of this study aim to contribute to the research on cross-modal comfort perception and its application to the development of models and systems for adaptive buildings.
5.1. Internal and External Validity
The research design could be replicated in studies with non-university office buildings to examine the consistency of the findings. The differences between the POE and “right-here-right-now” surveys might not allow a direct comparison of results from the surveys in this study. In addition, the variation in the sample size and survey duration might introduce a “seasonal effect” on the questionnaires’ results due to the number of valid questionnaires used in the analysis and their distribution across the seasons. The impact of different data collection methods on the final sample size and on the quality of responses should be also examined.
The results may apply only to buildings that are similar to the buildings in this study in terms of use and characteristics (i.e., mixed mode with concurrent or change-over mode of operation). Any findings might not be transferable to other building types that would have different adaptive opportunities. The generalization of the results might be further restricted by the sample size and the participants’ characteristics, especially their environmental awareness and energy-saving attitudes, as they all are highly educated and they work in relevant disciplines in an academic environment. The effects of education, gender, age and possibly of any relevant beliefs and social roles, as result of their profession, should be carefully investigated in future work.
5.2. Future Research
This study has identified the importance of indoor environmental quality, and in particular air quality perception and operative temperature, in the cross-modal perception of comfort in office buildings. It is suggested that longitudinal, POE-comfort mixed surveys are a useful tool to investigate the effect of building design and environmental factors on occupants’ comfort and behaviour. Further research is required to explore the trans-modal perspective of comfort through studying the integration of cross-modal comfort perception with contextual preferences and behaviours for different occupant characteristics. This trans-modal comfort approach could be used to develop adaptive, reactive and dynamic systems for buildings with occupant-specific zonal conditions that proactively respond to external forcing (including different degrees of environmental discomfort), the preferences of present occupants and the use of personalized controls.
It has been suggested that the ways we work and live may have changed permanently due to the SARS COVID pandemic. These changes will inevitably affect the places where we live and work, especially as work and home spaces become similar. Under these propositions, research about comfort and IEQ in office spaces will also become relevant in the context of homeworking. It will likely become more important to monitor and control the IEQ and comfort parameters in buildings that were designed and built with different adaptive opportunities, specifications, systems, occupancy assumptions and use in mind.
Future work will focus on the study of air quality and IEQ-related parameters in both office and home-office spaces. Future research needs to further investigate the variability in the impact of different office design characteristics (between work and home) on cross-modal comfort. The findings could be also used in the research about an office design’s effect on the occupants’ physical and mental wellbeing and the necessary retrofits and adjustments to office space both at work and home, as we adapt in new ways to future living.
Author Contributions
L.B. and S.G. contributed to the conception of the study design; L.B., S.G., N.K.S.E. and P.X. contributed to field work of the case study buildings; L.B., S.G., N.K.S.E. and P.X. contributed to the quality assurance and processing of the case study raw data; L.B., S.G., N.K.S.E. and P.X. contributed to the analysis and interpretation of data; L.B and S.G. contributed to drafting the article and revising it critically; All authors contributed to the approval of the final version. All authors have read and agreed to the published version of the manuscript.
Funding
This research received no external funding.
Institutional Review Board Statement
The study was approved by the Ethics Committee of the University of Southampton (ERGO 28671, approved on 3 July 2017, ERGO 53502, approved on 29 November 2019 and ERGO 58356, approved on 4 August 2020).
Informed Consent Statement
Informed consent was obtained from all subjects involved in the study.
Data Availability Statement
Data not available. The data are not publicly available due to ethical restrictions.
Acknowledgments
This study was conducted within the framework of the International Energy Agency—Energy in Buildings and Communities Program (IEA-EBC) Annex 69-Strategy and Practice of Adaptive Thermal Comfort in Low Energy Buildings and Annex 79-Occupant-Centric Building Design and Operation. L.B. and S.G. would like to thank the Sustainable Energy Research Group at the University of Southampton for supporting this work (www.energy.soton.ac.uk). Part of the work of L.B. was supported by the Lancaster School of Architecture and Imagination Lancaster (imagination.lancaster.ac.uk) at LICA, Lancaster University.
Conflicts of Interest
The authors declare no conflict of interest.
References
- Ortiz, M.A.; Kurvers, S.R.; Bluyssen, P.M. A review of comfort, health, and energy use: Understanding daily energy use and wellbeing for the development of a new approach to study comfort. Energy Build. 2017, 152, 323–335. [Google Scholar] [CrossRef]
- Al Horr, Y.; Arif, M.; Kaushik, A.; Mazroei, A.; Katafygiotou, M.; Elsarrag, E. Occupant productivity and office indoor environment quality: A review of the literature. Build. Environ. 2016, 105, 369–389. [Google Scholar] [CrossRef]
- Mahdavi, A.; Berger, C. Predicting Buildings′ Energy Use: Is the Occupant-Centric “Performance Gap” Research Program Ill-Advised? Front Energy Res. 2019, 7, 124. [Google Scholar] [CrossRef]
- Manfren, M.; Nastasi, B.; Piana, E.; Tronchin, L. On the link between energy performance of building and thermal comfort: An example. AIP Conf. Proc. 2019, 21, 23. [Google Scholar]
- Antoniadou, P.; Papadopoulos, A.M. Occupants’ thermal comfort: State of the art and the prospects of personalized assessment in office buildings. Energy Build. 2017, 153, 136–149. [Google Scholar] [CrossRef]
- Schweiker, M.; Ampatzi, E.; Andargie, M.S.; Andersen, R.K.; Azar, E.; Barthelmes, V.M.; Berger, C.; Bourikas, L.; Carlucci, S.; Chinazzo, G.; et al. Review of multi-domain approaches to indoor environmental perception and behaviour. Build. Environ. 2000, 106804. Available online: https://www.sciencedirect.com/science/article/abs/pii/S0360132320301621 (accessed on 6 January 2021). [CrossRef]
- Wang, Z.; de Dear, R.; Luo, M.; Lin, B.; He, Y.; Ghahramani, A.; Zhu, Y. Individual difference in thermal comfort: A literature review. Build. Environ. 2018, 138, 181–193. [Google Scholar] [CrossRef]
- Carlucci, S.; Bai, L.; de Dear, R.; Yang, L. Review of adaptive thermal comfort models in built environmental regulatory documents. Build. Environ. 2018, 137, 73–89. [Google Scholar] [CrossRef]
- Nordvall, M.; Arvola, M. Perception, Meaning and Transmodal Design. DRS2016 Futur Think. 2016, 3, 1–12. [Google Scholar]
- Yang, W.; Moon, H.J. Cross-modal effects of noise and thermal conditions on indoor environmental perception and speech recognition. Appl. Acoust. 2018, 141, 1–8. [Google Scholar] [CrossRef]
- Chinazzo, G.; Wienold, J.; Andersen, M. Influence of indoor temperature and daylight illuminance on visual perception. Light. Res. Technol. 2019, 52, 350–370. [Google Scholar] [CrossRef]
- Lam, C.K.C.; Yang, H.; Yang, X.; Liu, J.; Ou, C.; Cui, S.; Kong, X.; Hang, J. Cross-modal effects of thermal and visual conditions on outdoor thermal and visual comfort perception. Build. Environ. 2020, 186, 107297. [Google Scholar] [CrossRef]
- Schweiker, M.; Schakib-Ekbatan, K.; Fuchs, X.; Becker, S. A seasonal approach to alliesthesia. Is there a conflict with thermal adaptation? Energy Build. 2020, 212, 109745. [Google Scholar] [CrossRef]
- Heydarian, A.; McIlvennie, C.; Arpan, L.; Yousefi, S.; Syndicus, M.; Schweiker, M.; Jazizadeh, F.; Rissetto, R.; Pisello, A.L.; Piselli, C.; et al. What drives our behaviors in buildings? A review on occupant interactions with building systems from the lens of behavioral theories. Build. Environ. 2020, 179, 106928. [Google Scholar] [CrossRef]
- Schweiker, M.; Huebner, G.M.; Kingma, B.R.M.; Kramer, R.; Pallubinsky, H. Drivers of diversity in human thermal perception—A review for holistic comfort models. Temperature 2018, 5, 308–342. [Google Scholar] [CrossRef] [PubMed]
- Schweiker, M.; Rissetto, R.; Wagner, A. Thermal expectation: Influencing factors and its effect on thermal perception. Energy Build. 2020, 210, 109729. [Google Scholar] [CrossRef]
- Tang, H.; Ding, Y.; Singer, B. Interactions and comprehensive effect of indoor environmental quality factors on occupant satisfaction. Build. Environ. 2020, 167, 106462. [Google Scholar] [CrossRef]
- Yang, W.; Moon, H.J. Combined effects of acoustic, thermal, and illumination conditions on the comfort of discrete senses and overall indoor environment. Build. Environ. 2019, 148, 623–633. [Google Scholar] [CrossRef]
- Geng, Y.; Ji, W.; Lin, B.; Zhu, Y. The impact of thermal environment on occupant IEQ perception and productivity. Build. Environ. 2017, 121, 158–167. [Google Scholar] [CrossRef]
- Barnes, J.; Wineman, J.; Adler, N. Open Office Space: The Wave of the Future for Academic Health Centers? Acad. Med. 2020, 95, 52–58. [Google Scholar] [CrossRef]
- Richardson, A.; Potter, J.; Paterson, M.; Harding, T.; Tyler-Merrick, G.; Kirk, R.; Reid, K.; McChesney, J. Office design and health: A systematic review. N. Z. Med. J. 2017, 130, 39–49. [Google Scholar] [PubMed]
- Frontczak, M.; Schiavon, S.; Goins, J.; Arens, E.; Zhang, H.; Wargocki, P. Quantitative relationships between occupant satisfaction and satisfaction aspects of indoor environmental quality and building design. Indoor Air 2012, 22, 119–131. [Google Scholar] [CrossRef] [PubMed]
- Kim, J.; de Dear, R. Nonlinear relationships between individual IEQ factors and overall workspace satisfaction. Build. Environ. 2012, 49, 33–40. [Google Scholar] [CrossRef]
- Castaldo, V.L.; Pigliautile, I.; Rosso, F.; Cotana, F.; De Giorgio, F.; Pisello, A.L. How subjective and non-physical parameters affect occupants’ environmental comfort perception. Energy Build. 2018, 178, 107–129. [Google Scholar] [CrossRef]
- Kwon, M.; Remøy, H.; van den Dobbelsteen, A.; Knaack, U. Personal control and environmental user satisfaction in office buildings: Results of case studies in the Netherlands. Build. Environ. 2019, 149, 428–435. [Google Scholar] [CrossRef]
- Ma, N.; Aviv, D.; Guo, H.; Braham, W.W. Measuring the right factors: A review of variables and models for thermal comfort and indoor air quality. Renew. Sustain. Energy Rev. 2021, 135, 110436. [Google Scholar] [CrossRef]
- Chen, C.F.; Yilmaz, S.; Pisello, A.L.; De Simone, M.; Kim, A.; Hong, T.; Bandurski, K.; Bavaresco, M.V.; Liu, P.L.; Zhu, Y. The impacts of building characteristics, social psychological and cultural factors on indoor environment quality productivity belief. Build. Environ. 2020, 185, 107189. [Google Scholar] [CrossRef]
- Pastore, L.; Andersen, M. Building energy certification versus user satisfaction with the indoor environment: Findings from a multi-site post-occupancy evaluation (POE) in Switzerland. Build. Environ. 2019, 150, 60–74. [Google Scholar] [CrossRef]
- Byrd, H.; Rasheed, E.O. The productivity paradox in green buildings. Sustainability 2016, 8, 347. [Google Scholar] [CrossRef]
- Leaman, A. Usable Buildngs Trust, The Partner Network Building Use Studies (BUS) Methodology 2006. Available online: https://busmethodology.org.uk/ (accessed on 6 January 2021).
- Leaman, A.; Stevenson, F.; Bordass, B. Building evaluation: Practice and principles. Build. Res. Inf. 2010, 38, 564–577. [Google Scholar] [CrossRef]
- Khoshbakht, M.; Baird, G.; Rasheed, E.O. The influence of work group size and space sharing on the perceived productivity, overall comfort and health of occupants in commercial and academic buildings. Indoor Built Environ. 2020. [Google Scholar] [CrossRef]
- Baird, G.; Chun, S.; Gandhi, A.; Gjerde, M. Assessment of changes in building performance from the users’ point of view: A before-and-after case study of an academic department. In Proceedings of the 53rd International Conference of Architectural Science Association, Roorkee, Uttrakhand, India, 28–30 November 2019. [Google Scholar]
- Rasheed, E.O.; Khoshbakht, M.; Baird, G. Does the number of occupants in an office influence individual perceptions of comfort and productivity?-new evidence from 5000 office workers. Buildings 2019, 9, 73. [Google Scholar] [CrossRef]
- McCartney, K.J.; Fergus Nicol, J. Developing an adaptive control algorithm for Europe. Energy Build. 2002, 34, 623–635. [Google Scholar] [CrossRef]
- ASHRAE Standing Standard Project Committee 55. ASHRAE Standard 55-2010. Thermal Environmental Conditions for Human Occupancy; ASHRAE: Atlanta, GA, USA, 2010. [Google Scholar]
- CEN. Standard EN15251. Indoor Environmental Input Parameters for Design and Assessment of Energy Performance of Buildings Addressing Indoor Air Quality, Thermal Environment, Lighting and Acoustics; CEN: Brussels, Belgium, 2007. [Google Scholar]
- CIBSE. Guide A: Environmental Design. Chart. Inst. Build. Serv. Eng. 2015. [Google Scholar] [CrossRef]
- Poynton, T.A.; DeFouw, E.R.; Morizio, L.J. A Systematic Review of Online Response Rates in Four Counseling Journals. J. Couns. Dev. 2019, 97, 33–42. [Google Scholar] [CrossRef]
- Langevin, J.; Gurian, P.L.; Wen, J. Tracking the human-building interaction: A longitudinal field study of occupant behavior in air-conditioned offices. J. Environ. Psychol. 2015, 42, 94–115. [Google Scholar] [CrossRef]
- Lee, Y.; Aletta, F. Acoustical planning for workplace health and well-being: A case study in four open-plan offices. Build. Acoust. 2019, 26, 207–220. [Google Scholar] [CrossRef]
- Banbury, S.P.; Berry, D.C. Office noise and employee concentration: Identifying causes of disruption and potential improvements. Ergonomics 2005, 48, 25–37. [Google Scholar] [CrossRef]
- Bae, S.; Asojo, A.O.; Martin, C.S. Impact of occupants’ demographics on indoor environmental quality satisfaction in the workplace. Build. Res. Inf. 2020, 48, 301–315. [Google Scholar] [CrossRef]
- Ramalho, O.; Mandin, C.; Ribéron, J.; Wyart, G. Air Stuffiness and Air Exchange Rate in French Schools and Day-Care Centres. Int. J. Vent. 2013, 12, 175–180. [Google Scholar] [CrossRef]
- Schweiker, M.; Wagner, A. Interactions between thermal and visual (dis-)comfort and related adaptive actions through cluster analyses. In Proceedings of the BauSIM2018—7. Deutsch-Österreichische IBPSA-Konferenz Tagungsband, Karlsruhe, Germany, 26–28 September 2018; pp. 204–215. [Google Scholar]
- R Core Team R: A Language and Environment for Statistical Computing 2020. Available online: http://www.r-project.org/ (accessed on 6 January 2021).
- Bates, D.; Mächler, M.; Bolker, B.M.; Walker, S.C. Fitting linear mixed-effects models using lme4. J. Stat. Softw. 2015, 67, 1–48. [Google Scholar] [CrossRef]
- Kuznetsova, A.; Brockhoff, P.B.; Christensen, R.H.B. lmerTest Package: Tests in Linear Mixed Effects Models. J. Stat. Softw. 2017, 82, 1–26. [Google Scholar] [CrossRef]
- Göçer, Ö.; Candido, C.; Thomas, L.; Göçer, K. Differences in occupants’ satisfaction and perceived productivity in high- and low-performance offices. Buildings 2019, 9, 199. [Google Scholar] [CrossRef]
- Varjo, J.; Hongisto, V.; Haapakangas, A.; Maula, H.; Koskela, H.; Hyönä, J. Simultaneous effects of irrelevant speech, temperature and ventilation rate on performance and satisfaction in open-plan offices. J. Environ. Psychol. 2015, 44, 16–33. [Google Scholar] [CrossRef]
- Roskams, M.J.; Haynes, B.P. Testing the relationship between objective indoor environment quality and subjective experiences of comfort. Build. Res. Inf. 2020. [Google Scholar] [CrossRef]
- Cahyani, A.A. Influence of Work Environment Noise to Productivity of Employee Performance of Sidoarjo District. J. Public Heal. Sci. Res. 2020, 1, 12–17. [Google Scholar] [CrossRef][Green Version]
- Göçer, Ö.; Hua, Y.; Göçer, K. Completing the missing link in building design process: Enhancing post-occupancy evaluation method for effective feedback for building performance. Build. Environ. 2015, 89, 14–27. [Google Scholar] [CrossRef]
- Reinikainen, L.M.; Aunela-Tapola, L.; Jaakkola, J.J.K. Humidification and perceived indoor air quality in the office environment. Occup. Environ. Med. 1997, 54, 322–327. [Google Scholar] [CrossRef]
- Humphreys, M.A.; Nicol, J.F.; Mccartney, K.J. An Analysis of Some Subjective Assessments of Indoor Air-quality in Five European Countries. Indoor Air 2002, 5, 86–91. [Google Scholar]


Publisher’s Note: MDPI stays neutral with regard to jurisdictional claims in published maps and institutional affiliations. |
© 2021 by the authors. Licensee MDPI, Basel, Switzerland. This article is an open access article distributed under the terms and conditions of the Creative Commons Attribution (CC BY) license (http://creativecommons.org/licenses/by/4.0/).