Surface Deformations Caused by the Convergence of Large Underground Gas Storage Facilities


Abstract
:1. Introduction
2. Methods for Determining Changes in Rock Mass Deformation for Salt Caverns
3. Method of Surface Deformation Prediction for a Large Field of Salt Caverns
- S(r, z, t)—subsidence of surface point at moment t, situated in the ground level z at a distance of r from the cavern axis,
- smax (z, t)—maximum subsidence at moment t,
- Hr—distance between the terrain surface and the depth of cavern roof,
- Hf—distance between the terrain surface and the depth of cavern floor,
- Rr—parameter of the horizontal influence scale, so-called radius of main influences, calculated from the cavern roof,
- Rf—radius of main influences, calculated from the cavern floor,
- h = Hf-Hr—cavern’s height,
- β—so-called angle of main influences (Knothe 1953),
- λ—coefficient of horizontal displacement,
- c—coefficient/characteristics of cavern roof,
- n—surface factor of the range of main influences of exploitation in the rock mass,
- z—height on the terrain surface,
- zr—depth of cavern roof occurrence,
- zf—depth of cavern floor occurrence.

4. Prediction of Land Surface Deformation Along with Its Verification for an Exemplary Area of an Underground Gas Storage Facility
5. Conclusions
Author Contributions
Funding
Institutional Review Board Statement
Informed Consent Statement
Data Availability Statement
Conflicts of Interest
References
- Kan, S.; Chen, B.; Wu, X.; Chen, Z.M.; Chen, G. Natural gas overview for world economy: From primary supply to final demand via global supply chains. Energy Policy 2019, 124, 215–225. [Google Scholar] [CrossRef]
- IEA. Gas Information. Available online: https://www.iea.org/subscribe-to-data-services/natural-gas-statistics (accessed on 12 September 2020).
- Matkowski, A.; Musiał, P. Systemowe magazyny gazu w Polsce. Arch. Energetyki 2012, 42, 81–92. [Google Scholar]
- EIA: U.S. Energy Information Administration. Available online: https://www.eia.gov/ (accessed on 12 September 2020).
- Verga, F. What’s conventional and what’s special in a reservoir study for underground gas storage. Energies 2018, 11, 1245. [Google Scholar] [CrossRef] [Green Version]
- Cala, M.; Cyran, K.; Kowalski, M.; Wilkosz, P. Influence of the anhydrite interbeds on a stability of the storage caverns in the mechelinki salt deposit (Northern Poland). Arch. Min. Sci. 2018, 63, 1007–1025. [Google Scholar] [CrossRef]
- Cyran, K. Insight into a shape of salt storage caverns. Arch. Min. Sci. 2020, 65, 363–398. [Google Scholar] [CrossRef]
- Ślizowski, J.; Urbańczyk, K. An attempt to asses suitability of middle-poland salt domes for natural gas storage/ocena przydatności środkowopolskich wysadów solnych do magazynowania gazu ziemnego. Arch. Min. Sci. 2012, 57, 335–349. [Google Scholar] [CrossRef]
- Korzeniowski, W.; Poborska-Młynarska, K.; Skrzypkowski, K.; Zagórski, K.; Chromik, M. Cutting niches in rock salt by means of a high-pressure water jet in order to accelerate the leaching of storage caverns for hydrogen or hydrocarbons. Energies 2020, 13, 1911. [Google Scholar] [CrossRef] [Green Version]
- Bhatka, T.; Usmani, A.; Mandal, A.; Nanda, A. Wedge failure analysis and remedial measures in large unlined rock cavern: A case study. Arch. Min. Sci. 2018, 63, 963–974. [Google Scholar] [CrossRef]
- Hengst, G. Monitoring der durch Kavernenkonvergenz induzierten Bodensenkungen unter Betrachtung ihrer Wirkungen auf die ökologischen Zusammenhänge. Geokinematischer Tag 2014, 15, 237–251. [Google Scholar]
- Wang, T.; Yang, C.; Yan, X.; Li, Y.; Liu, W.; Liang, C.; Li, J. Dynamic response of underground gas storage salt cavern under seismic loads. Tunn. Undergr. Space Technol. 2014, 43, 241–252. [Google Scholar] [CrossRef]
- Wang, T.; Yang, C.; Ma, H.; Li, Y.; Shi, X.; Li, J.; Daemen, J. Safety evaluation of salt cavern gas storage close to an old cavern. Int. J. Rock Mech. Min. Sci. 2016, 83, 95–106. [Google Scholar] [CrossRef]
- Wang, T.; Yang, C.; Chen, J.; Daemen, J. Geomechanical investigation of roof failure of China’s first gas storage salt cavern. Eng. Geol. 2018, 243, 59–69. [Google Scholar] [CrossRef]
- Wang, T.; Ma, H.; Shi, X.; Yang, C.; Zhang, N.; Li, J.; Ding, S.; Daemen, J. Salt cavern gas storage in an ultra-deep formation in Hubei, China. Int. J. Rock Mech. Min. Sci. 2018, 102, 57–70. [Google Scholar] [CrossRef]
- Yang, C.; Wang, T.; Ma, H.; Li, Y.; Shi, X.; Daemen, J.J.K. Feasibility analysis of using horizontal caverns for un-derground gas storage: A case study of Yunying salt district. J. Nat. Gas Sci. Eng. 2016, 36, 252–266. [Google Scholar] [CrossRef]
- Wang, G.; Guo, K.; Christianson, M.; Konietzky, H. Deformation characteristics of rock salt with mudstone interbeds sur-rounding gas and oil storage cavern. Int. J. Rock Mech. Min. Sci. 2011, 48, 871–877. [Google Scholar] [CrossRef]
- Wang, T.; Yang, C.; Shi, X.; Ma, H.; Li, Y.; Yang, Y.; Daemen, J. Failure analysis of thick interlayer from leaching of bedded salt caverns. Int. J. Rock Mech. Min. Sci. 2015, 73, 175–183. [Google Scholar] [CrossRef]
- Wang, T.; Yang, C.; Yan, X.; Daemen, J. Allowable pillar width for bedded rock salt caverns gas storage. J. Pet. Sci. Eng. 2015, 127, 433–444. [Google Scholar] [CrossRef]
- Wang, C.; Zhang, Q.Y.; Xiang, W. Physical and numerical modeling of the stability of deep caverns in tahe oil field in China. Energies 2017, 10, 769. [Google Scholar] [CrossRef] [Green Version]
- Thoraval, A.; Lahaie, F.; Brouard, B.; Berest, P. A generic model for predicting long-term behavior of storage salt caverns after their abandonment as an aid to risk assessment. Int. J. Rock Mech. Min. Sci. 2015, 77, 44–59. [Google Scholar] [CrossRef]
- Xie, P.; Wen, H.; Wang, G. An analytical solution of stress distribution around underground gas storage cavern in bedded salt rock. J. Renew. Sustain. Energy 2018, 10, 34101. [Google Scholar] [CrossRef]
- Staudtmeister, K.; Rokahr, R. Rock mechanical design of storage caverns for natural gas in rock salt mass. Int. J. Rock Mech. Min. Sci. 1997, 34, 300.e1–300.e13. [Google Scholar] [CrossRef]
- Polański, K. Numerical Calculations of Main Stress in the Rock Massif Around Salt Cavern for Compressed Air Storage. In Proceedings of the IOP Conference Series: Earth and Environmental Science, Kraków, Poland, 14–17 November 2017; Volume 214, p. 12079. [Google Scholar]
- Ma, H.; Yang, C.; Qi, Z.; Li, Y.; Hao, R. Experimental and Numerical Analysis of Salt Cavern Convergence in Ultra-Deep Bedded Formation. In Proceedings of the 46th US Rock Mechanics/Geomechanics Symposium, Chicago, IL, USA, 24–27 June 2012; 2012. [Google Scholar]
- Lindvall, A. Modeling and Simulation of Creep in a Thermal Energy Storage Unit. Master’s Thesis, Chalmers University of Technology, Gothenburg, Sweden, 2020. [Google Scholar]
- Ślizowski, J.; Lankof, L.; Urbańczyk, K.; Serbin, K. Potential capacity of gas storage caverns in rock salt bedded deposits in Poland. J. Nat. Gas. Sci. Eng. 2017, 43, 167–178. [Google Scholar] [CrossRef]
- Zander-schiebenhöfer, D.; Roordink, P.; Gasunie, N.V.N. Subsidence modelling for the zuidwending cavern field sub-sidence modelling for the zuidwending cavern field. In Proceedings of the Solution Mining Research Institute Fall 2017 Technical Conference, Münster, Germany, 25–26 September 2017. [Google Scholar]
- Sroka, A.; Misa, R.; Tajduś, K. Calculation of convergence induced rock mass and ground surface movements in salt caverns for storage of liquid and gaseous energy carriers. In Geomechanics and Geodynamics of Rock Masses; CRC Press: Boca Raton, FL, USA, 2018; pp. 629–634. [Google Scholar]
- Xia, M.; Zhang, H. Stress and deformation analysis of buried gas pipelines subjected to buoyancy in liquefaction zones. Energies 2018, 11, 2334. [Google Scholar] [CrossRef] [Green Version]
- Albusoda, B.S.; Abbas, H.O. Numerical Modelling of Buried Steel Pipeline Overlaying Expansive Soil. In Proceedings of the 1st International Scientific Conference of Engineering Sciences—3rd Scientific Conference of Engineering Science (ISCES), Diyala, Iraq, 10–11 January 2018; pp. 281–286. [Google Scholar]
- Kouretzis, G.P.; Karamitros, D.K.; Sloan, S.W. Analysis of buried pipelines subjected to ground surface settlement and heave. Can. Geotech. J. 2015, 52, 1058–1071. [Google Scholar] [CrossRef]
- Sarvanis, G.C.; Karamanos, S.A.; Vazouras, P.; Dakoulas, P.; Mecozzi, E.; Lucci, A. Soil-Pipe Interaction Models for the Simulation of Buried Steel Pipeline Behaviour Against Geohazards. In Proceedings of the International Conference on Offshore Mechanics and Arctic Engineering—OMAE, Trondheim, Norway, 25–30 June 2017; Volume 5B-2017, pp. 1–10. [Google Scholar] [CrossRef]
- Zhang, J.; Liang, Z.; Zhao, G. Mechanical behaviour analysis of a buried steel pipeline under ground overload. Eng. Fail. Anal. 2016, 63, 131–145. [Google Scholar] [CrossRef]
- Rusek, J. The Point Nuisance Method as a decision-support system based on bayesian inference approach. Arch. Min. Sci. 2020, 65, 117–127. [Google Scholar]
- Knothe, S. Effect of time on formation of basin subsidence. Arch. Min. Steel Ind. 1953, 1, 1–7. [Google Scholar]
- Sroka, A.; Schober, F. Die Berechnung der maximalen Bodenbewegungen über kavernenartigen Hohlräumen unter Berücksichtigung der Hohlraumgeometrie. Kali Steinsalz 1982, 4, 273–277. [Google Scholar]
- Sroka, A. Abschätzung Einiger Zeitlicher Prozesse im Gebirge. In Proceedings of the Schriftenreihe Lagerstättenerfassung und--Darstellung, Bodenbewegungen und Bergschäden, Ingenieurvermessung, Kolloquium, Leoben, Austria, 15–16 November 1984; pp. 103–132. [Google Scholar]
- Hartmann, A. Ein Beitrag zur Überwachung von Kavernenanlagen. Master’s Thesis, Technische Universität Clausthal, Clausthal, Germany, 15 June 1984. [Google Scholar]
- Haupt, W.; Sroka, A.; Schober, F. Die Wirkung Verschiedener Konvergenzmodelle für Zylinderförmige Kavernen auf die Übertägige Senkungsbewegung. Das Markscheidewesen 1983, 90, 159–164. [Google Scholar]
- Serbin, K.; Ślizowski, J.; Urbańczyk, K.; Nagy, S. The influence of thermodynamic effects on gas storage cavern convergence. Int. J. Rock Mech. Min. Sci. 2015, 79, 166–171. [Google Scholar] [CrossRef]
- Khaledi, K.; Mahmoudi, E.; Datcheva, M.; Schanz, T. Stability and serviceability of underground energy storage caverns in rock salt subjected to mechanical cyclic loading. Int. J. Rock Mech. Min. Sci. 2016, 86, 115–131. [Google Scholar] [CrossRef]
- Kamiński, P.; Czaja, P. An innovative solution to counteract convergence of shaft lining in rock salt strata. Arch.Min. Sci. 2019, 64, 429–445. [Google Scholar] [CrossRef]


| Country | Underground Gas Storage (UGS) Facilities in Salt Caverns | (Sum) |
|---|---|---|
| Belgium | 1 | 2 |
| Denmark | 1 | 2 |
| France | 3 | 15 |
| Germany | 21 | 46 |
| United Kingdom | 3 | 6 |
| Czech Republic | 1 | 7 |
| Poland | 2 | 9 |
| Portugal | 1 | 1 |
| Production Phase | Yearly Convergence Rate (%) | Time in Years |
|---|---|---|
| Operation/Leaching | 0.6 | 7–10 |
| Standby | 0.3 | 1–5 |
| Storage (gas) | 0.8–1.6 | 30–50 |
| Storage (petroleum) | 0.2 | 30–50 |
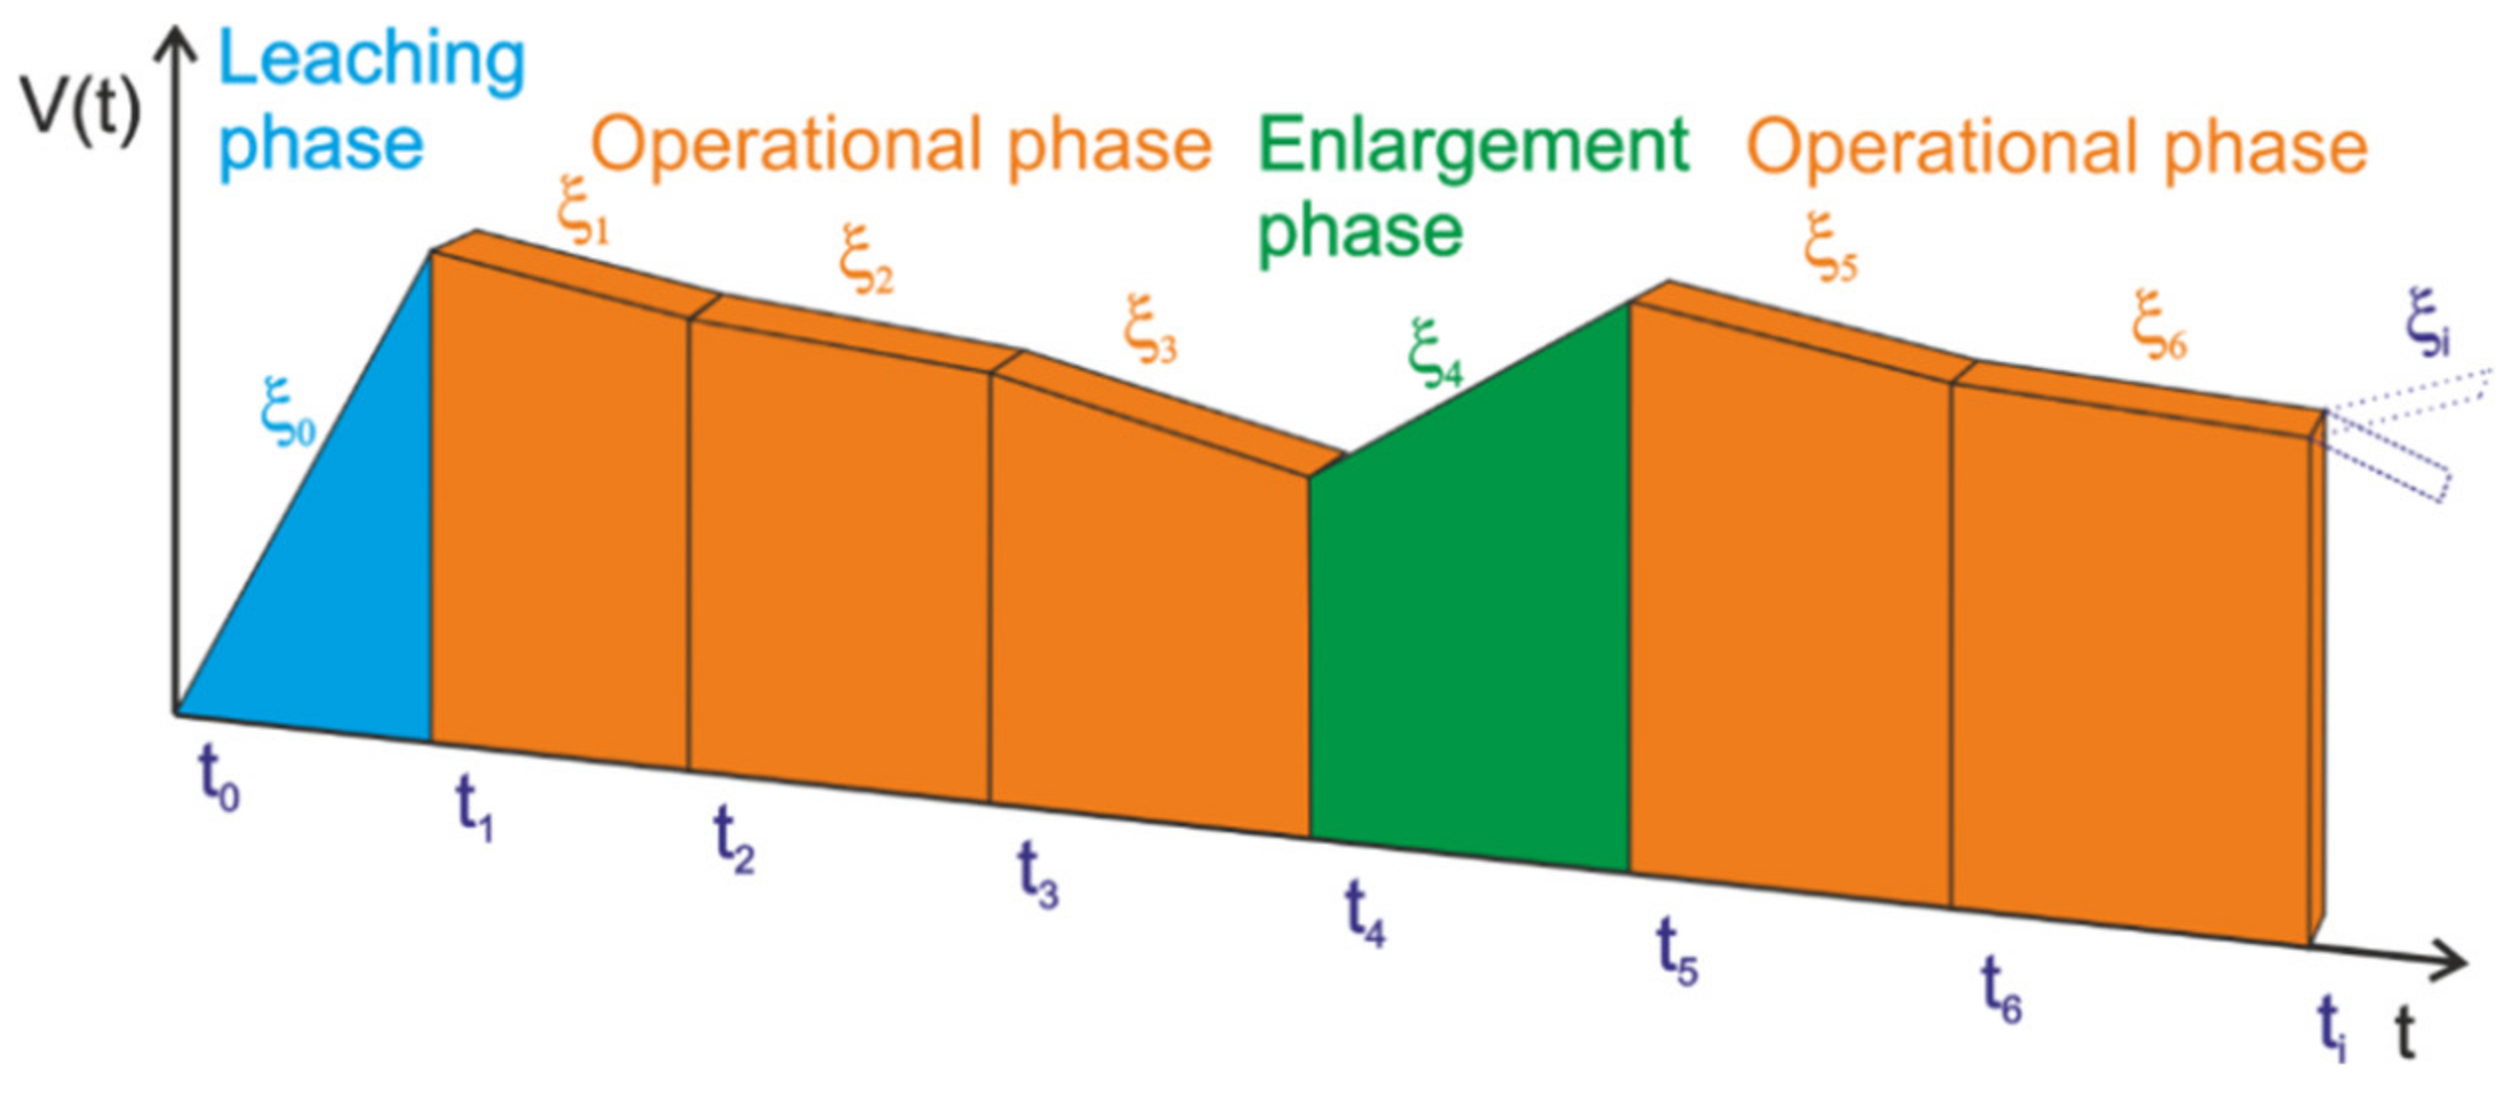
| Phase | Date of the Phase Beginning (mm.dd.yyyy) | End Date of the Phase (mm.dd.yyyy) | 𝛏 (%/year) | Free Volume of the Cavern (m3) |
|---|---|---|---|---|
| Leaching | 03.23.1972 | 03.23.1978 | 0.42 | 286100 |
| Enlargement | 03.23.1978 | 09.30.1983 | 0.33 | 347700 |
| Enlargement | 09.30.1983 | 04.14.1986 | 0.50 | 548700 |
| Enlargement | 04.14.1986 | 04.03.1992 | 0.33 | 613701 |
| Operational | 04.03.1992 | 02.16.2009 | 0.30 | 583412 |
| Enlargement | 02.16.2009 | 05.16.2010 | 0.37 | 647701 |
| Operational | 05.16.2010 | 12.30.2019 | 0.30 | 629267 |
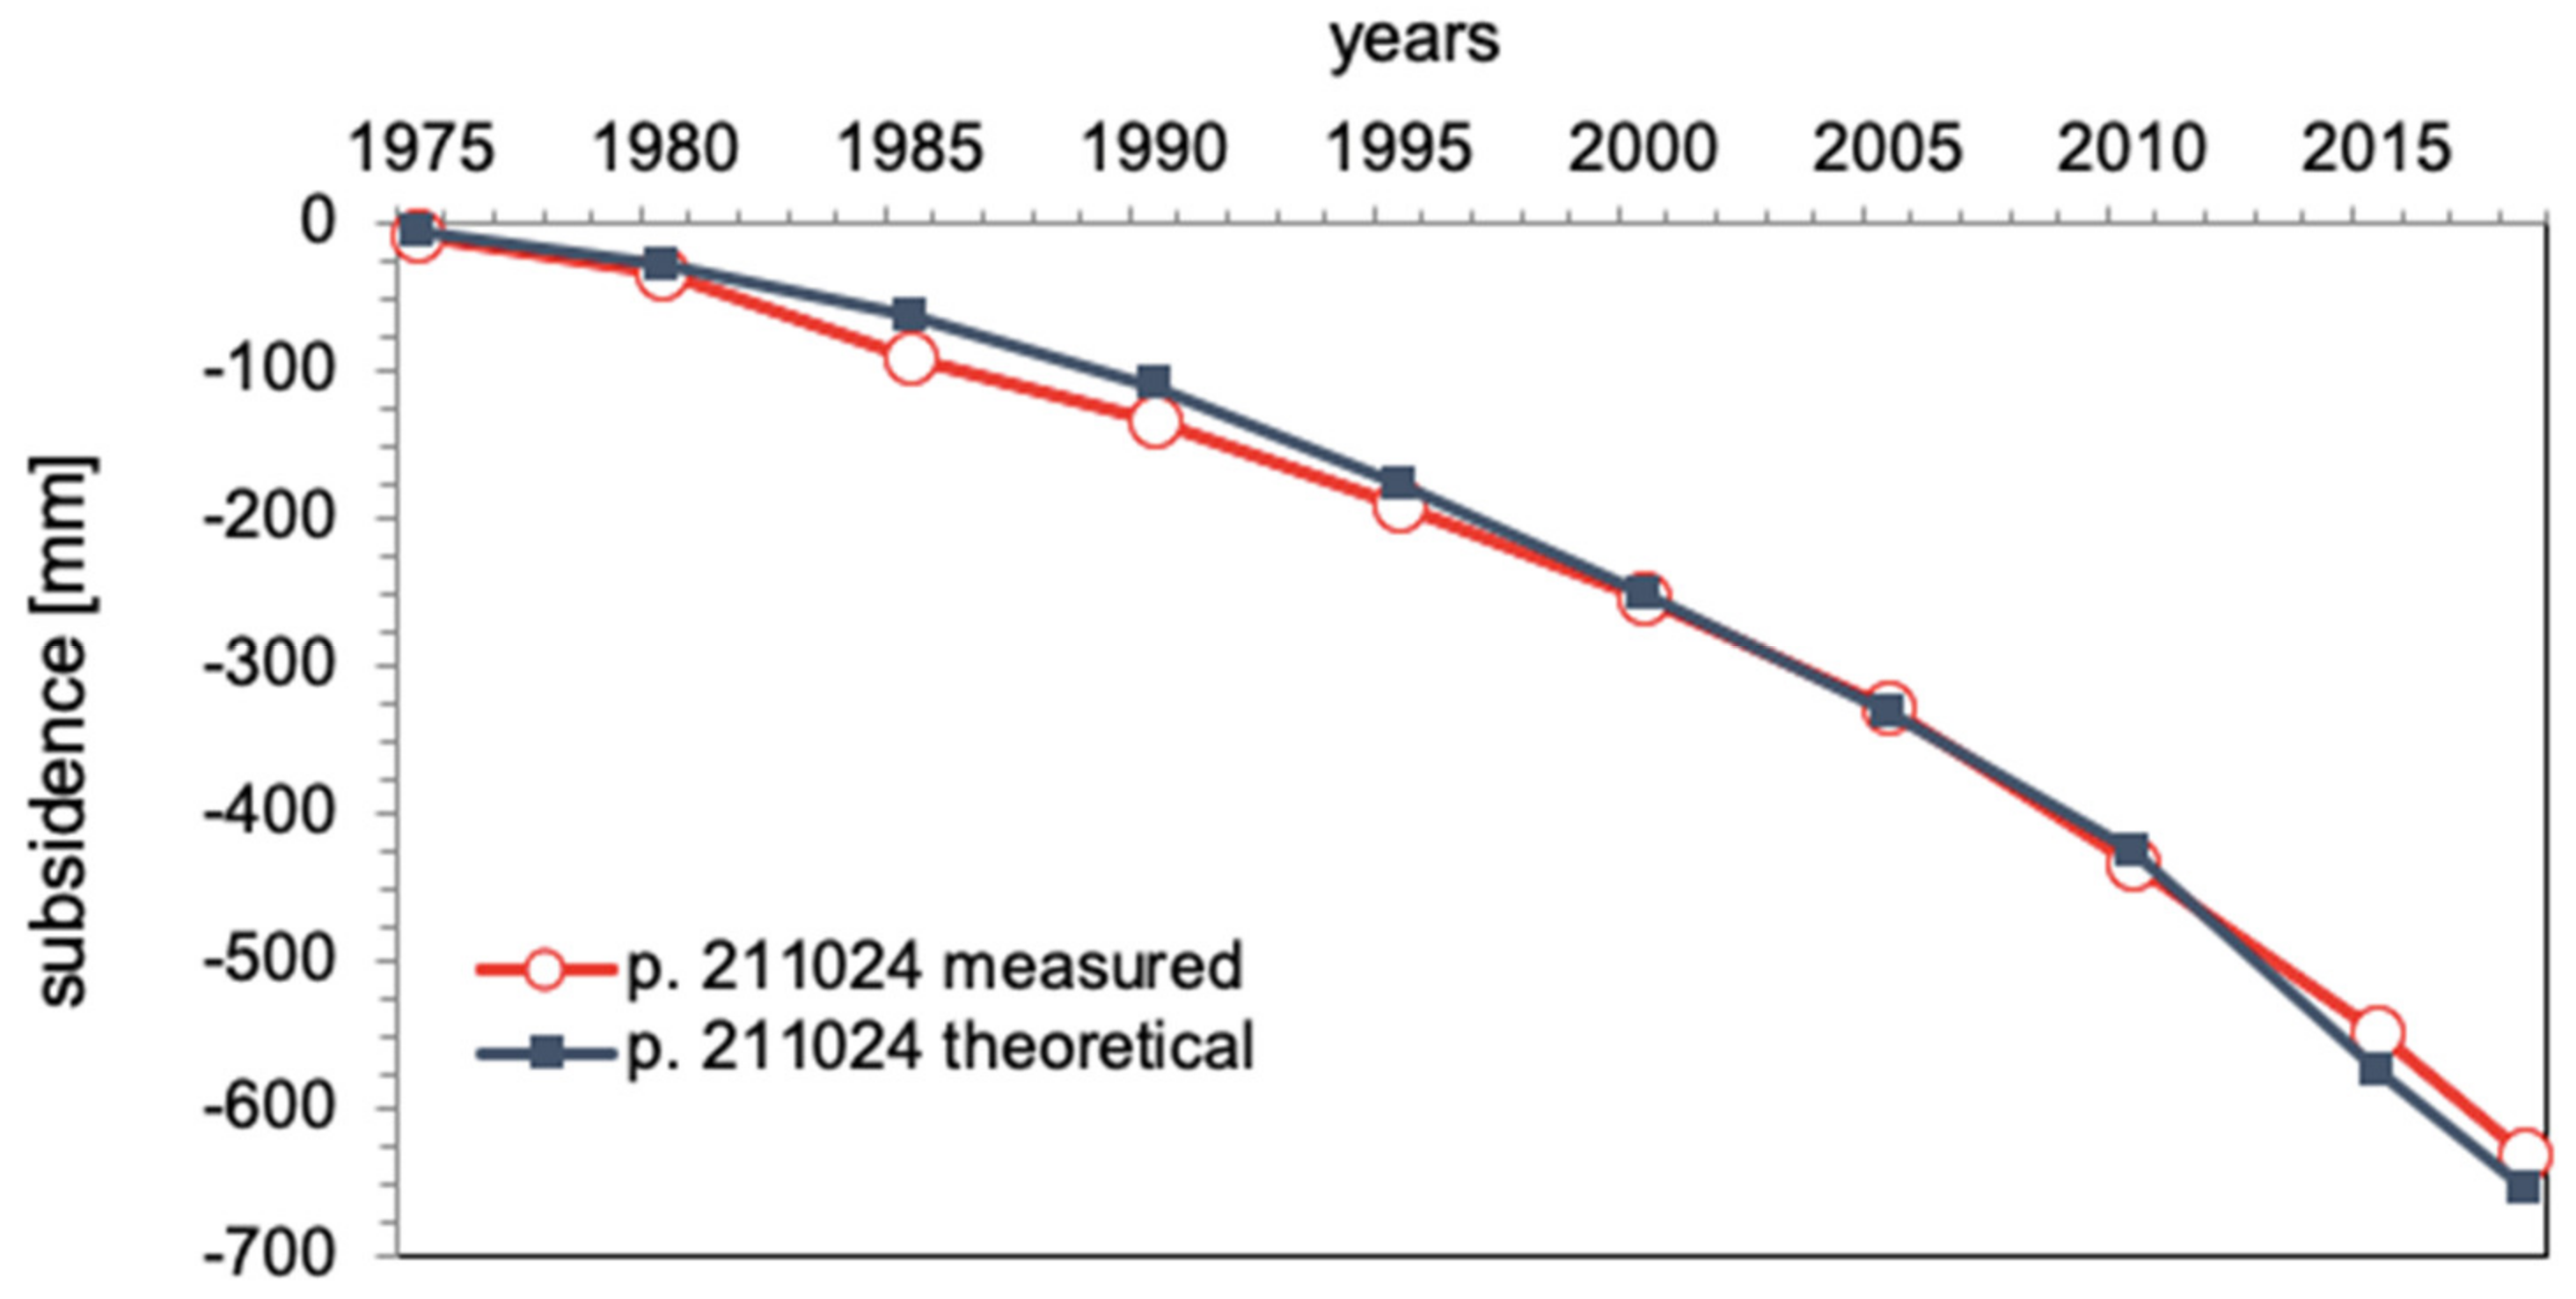
| Point | Period of Measurement | Displacement Measured (cm) | Displacement Calculated (cm) | Difference (cm) |
|---|---|---|---|---|
| u1 | 2006–2019 | 15.7 | 16.9 | 1.2 |
| u2 | 2003–2016 | 20.3 | 17.9 | −2.4 |
| u3 | 2000–2016 | 8.8 | 7.2 | −1.6 |
Publisher’s Note: MDPI stays neutral with regard to jurisdictional claims in published maps and institutional affiliations. |
© 2021 by the authors. Licensee MDPI, Basel, Switzerland. This article is an open access article distributed under the terms and conditions of the Creative Commons Attribution (CC BY) license (http://creativecommons.org/licenses/by/4.0/).
Share and Cite
Tajduś, K.; Sroka, A.; Misa, R.; Tajduś, A.; Meyer, S. Surface Deformations Caused by the Convergence of Large Underground Gas Storage Facilities. Energies 2021, 14, 402. https://doi.org/10.3390/en14020402
Tajduś K, Sroka A, Misa R, Tajduś A, Meyer S. Surface Deformations Caused by the Convergence of Large Underground Gas Storage Facilities. Energies. 2021; 14(2):402. https://doi.org/10.3390/en14020402
Chicago/Turabian StyleTajduś, Krzysztof, Anton Sroka, Rafał Misa, Antoni Tajduś, and Stefan Meyer. 2021. "Surface Deformations Caused by the Convergence of Large Underground Gas Storage Facilities" Energies 14, no. 2: 402. https://doi.org/10.3390/en14020402
APA StyleTajduś, K., Sroka, A., Misa, R., Tajduś, A., & Meyer, S. (2021). Surface Deformations Caused by the Convergence of Large Underground Gas Storage Facilities. Energies, 14(2), 402. https://doi.org/10.3390/en14020402