
Determination of the Extent of the Rock Destruction Zones around a Gasification Channel on the Basis of Strength Tests of Sandstone and Claystone Samples Heated at High Temperatures up to 1200 °C and Exposed to Water


Abstract
:1. Introduction
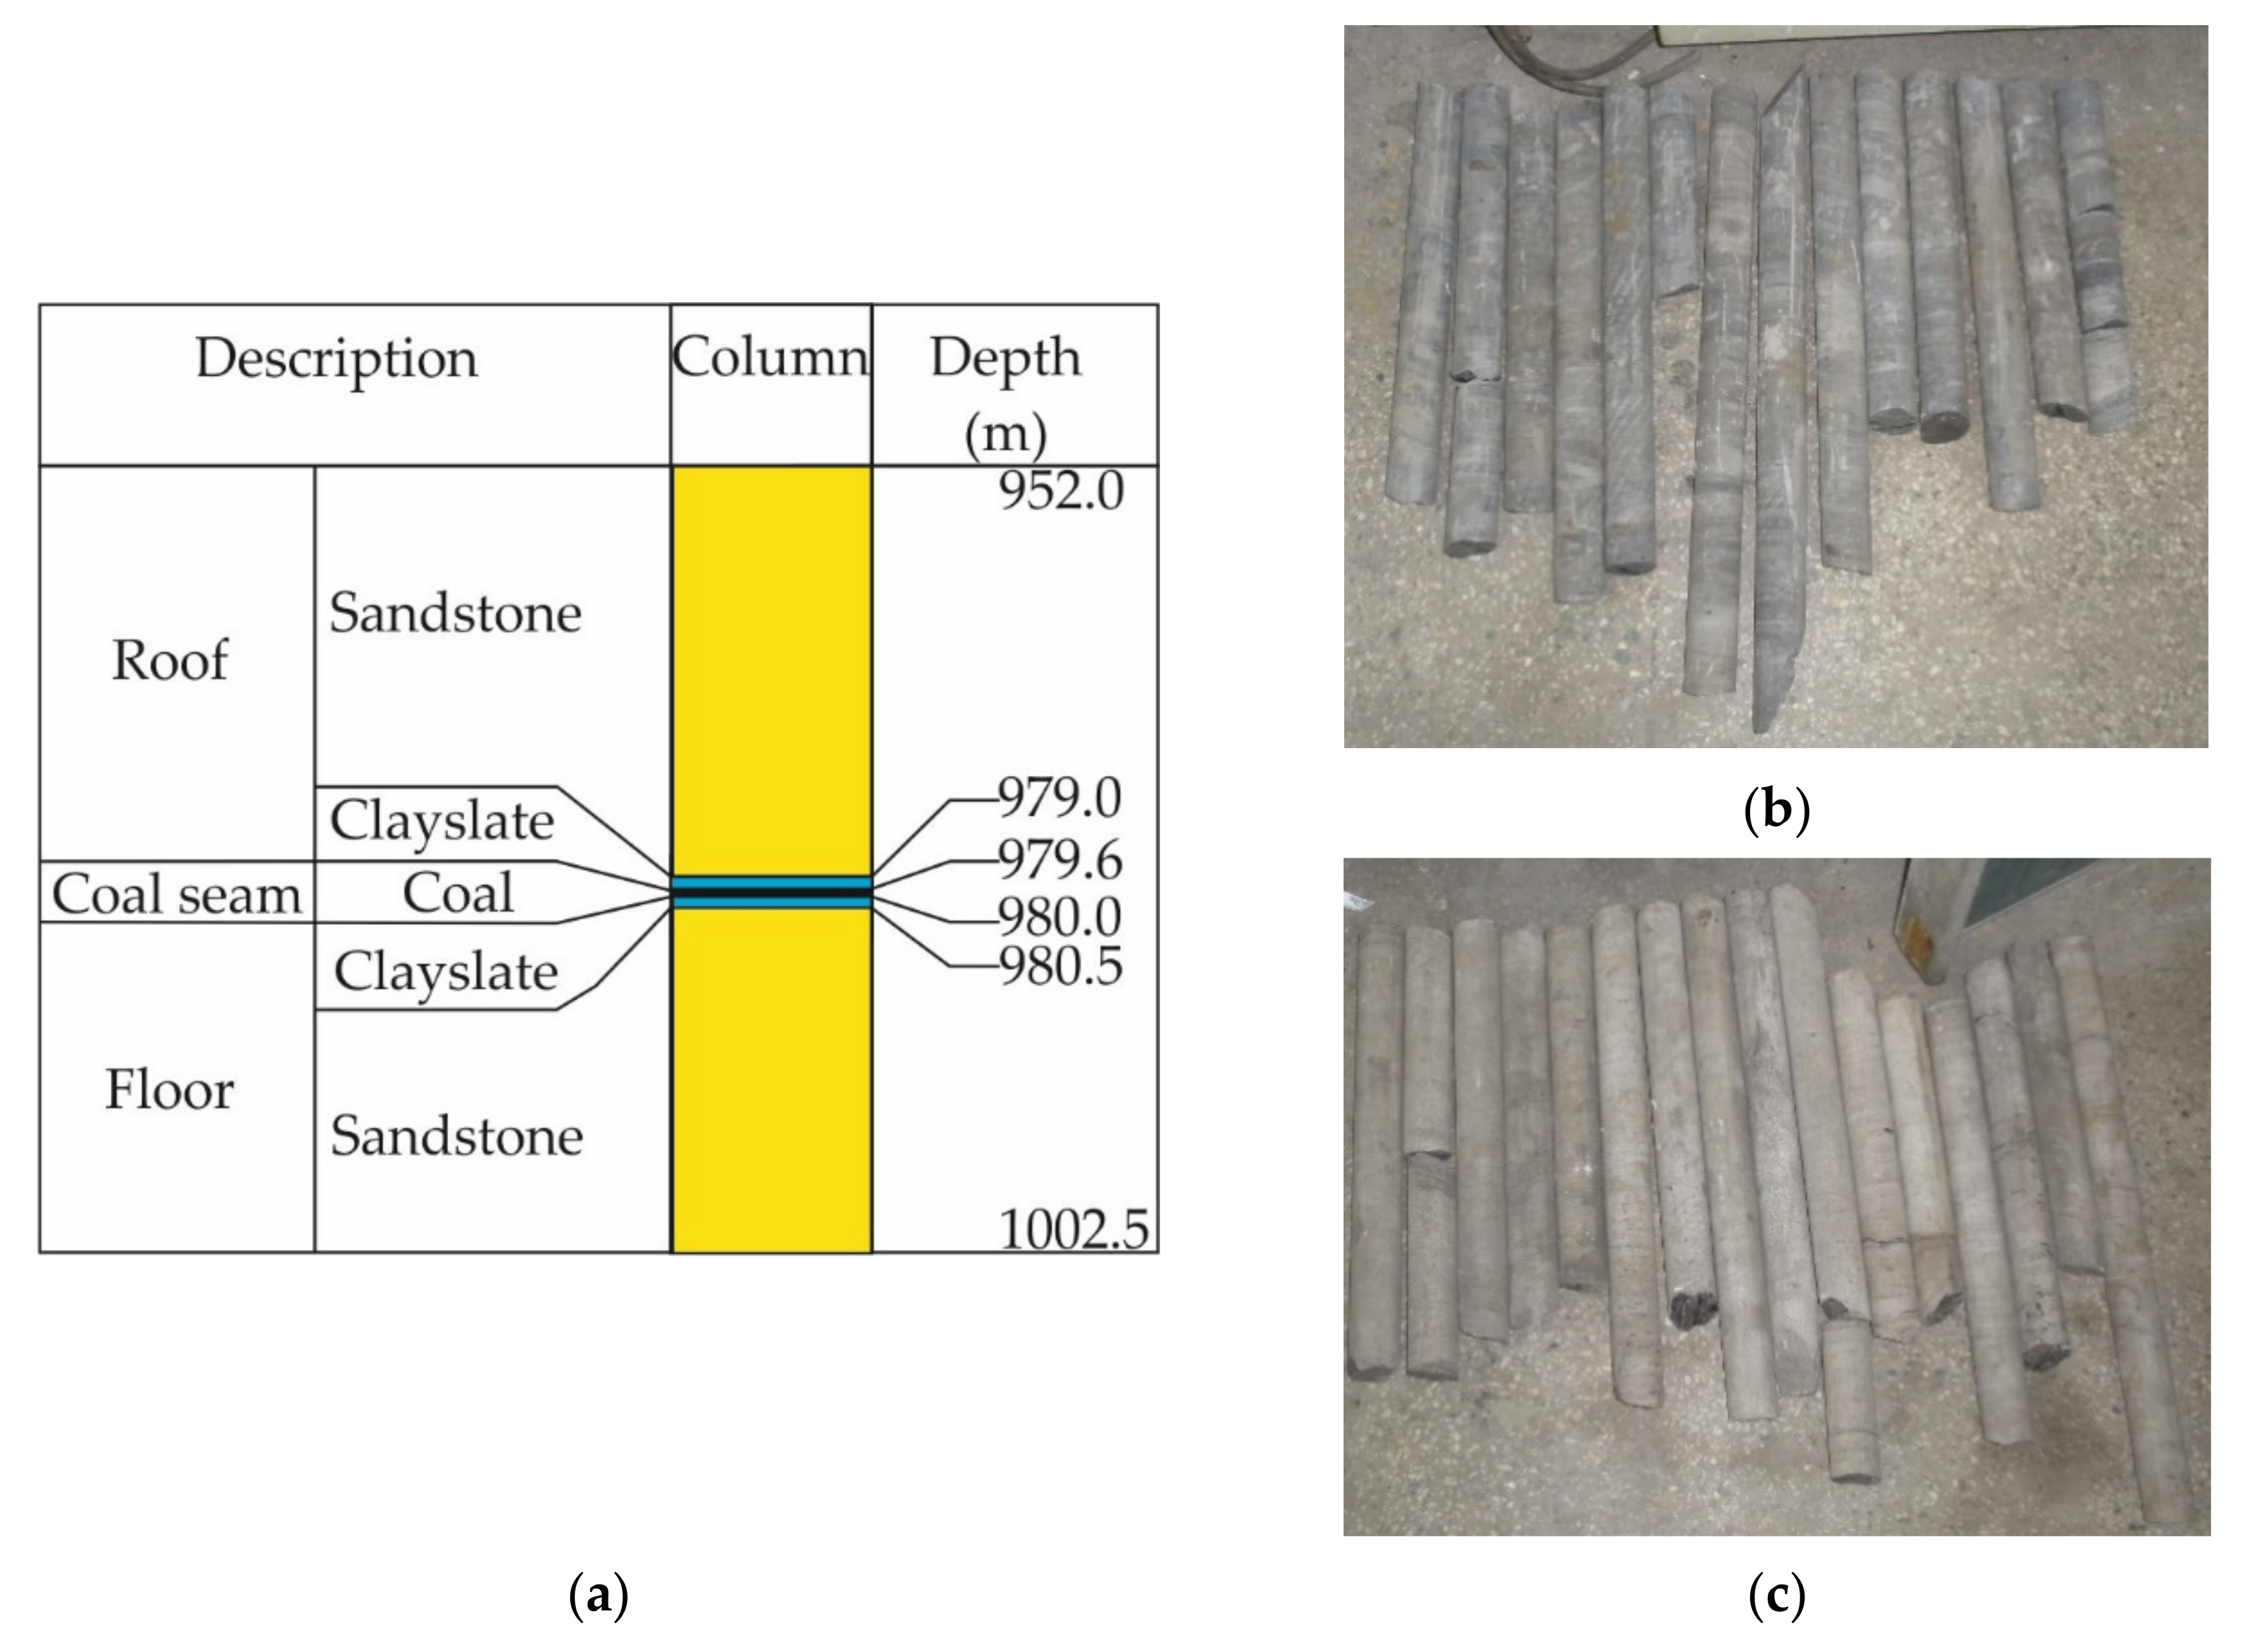
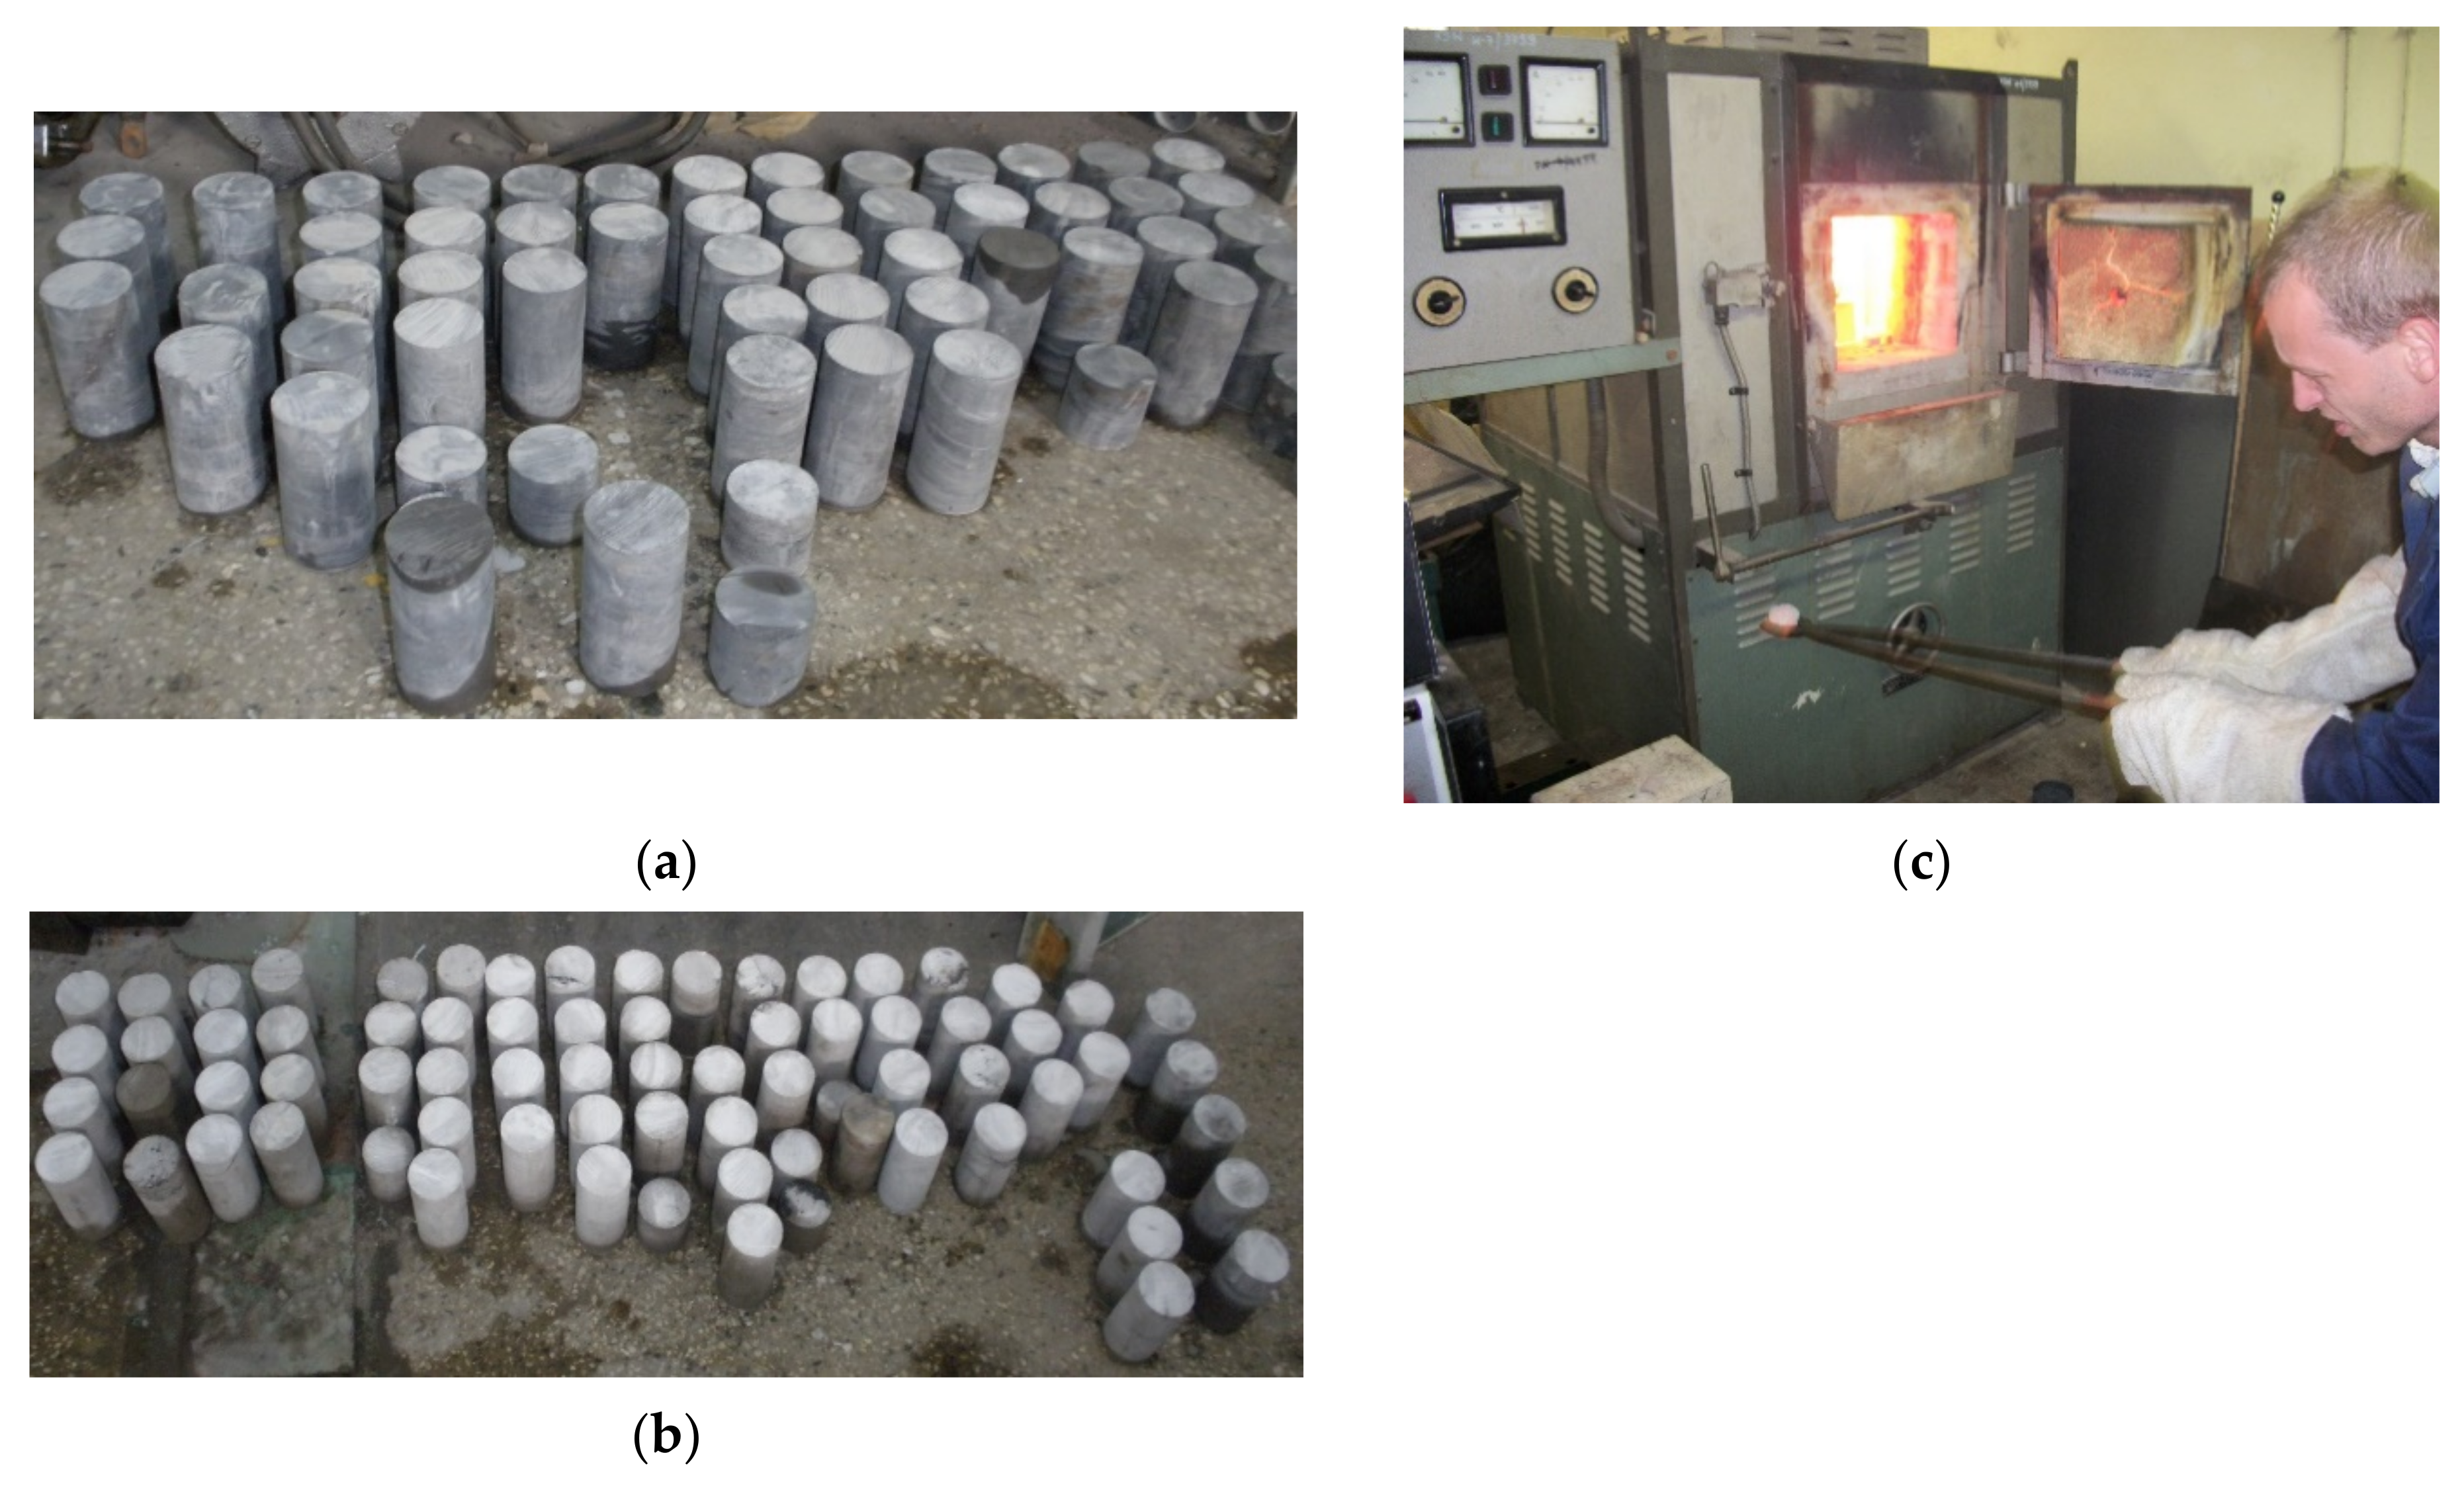
2. Preparation of Samples for Testing
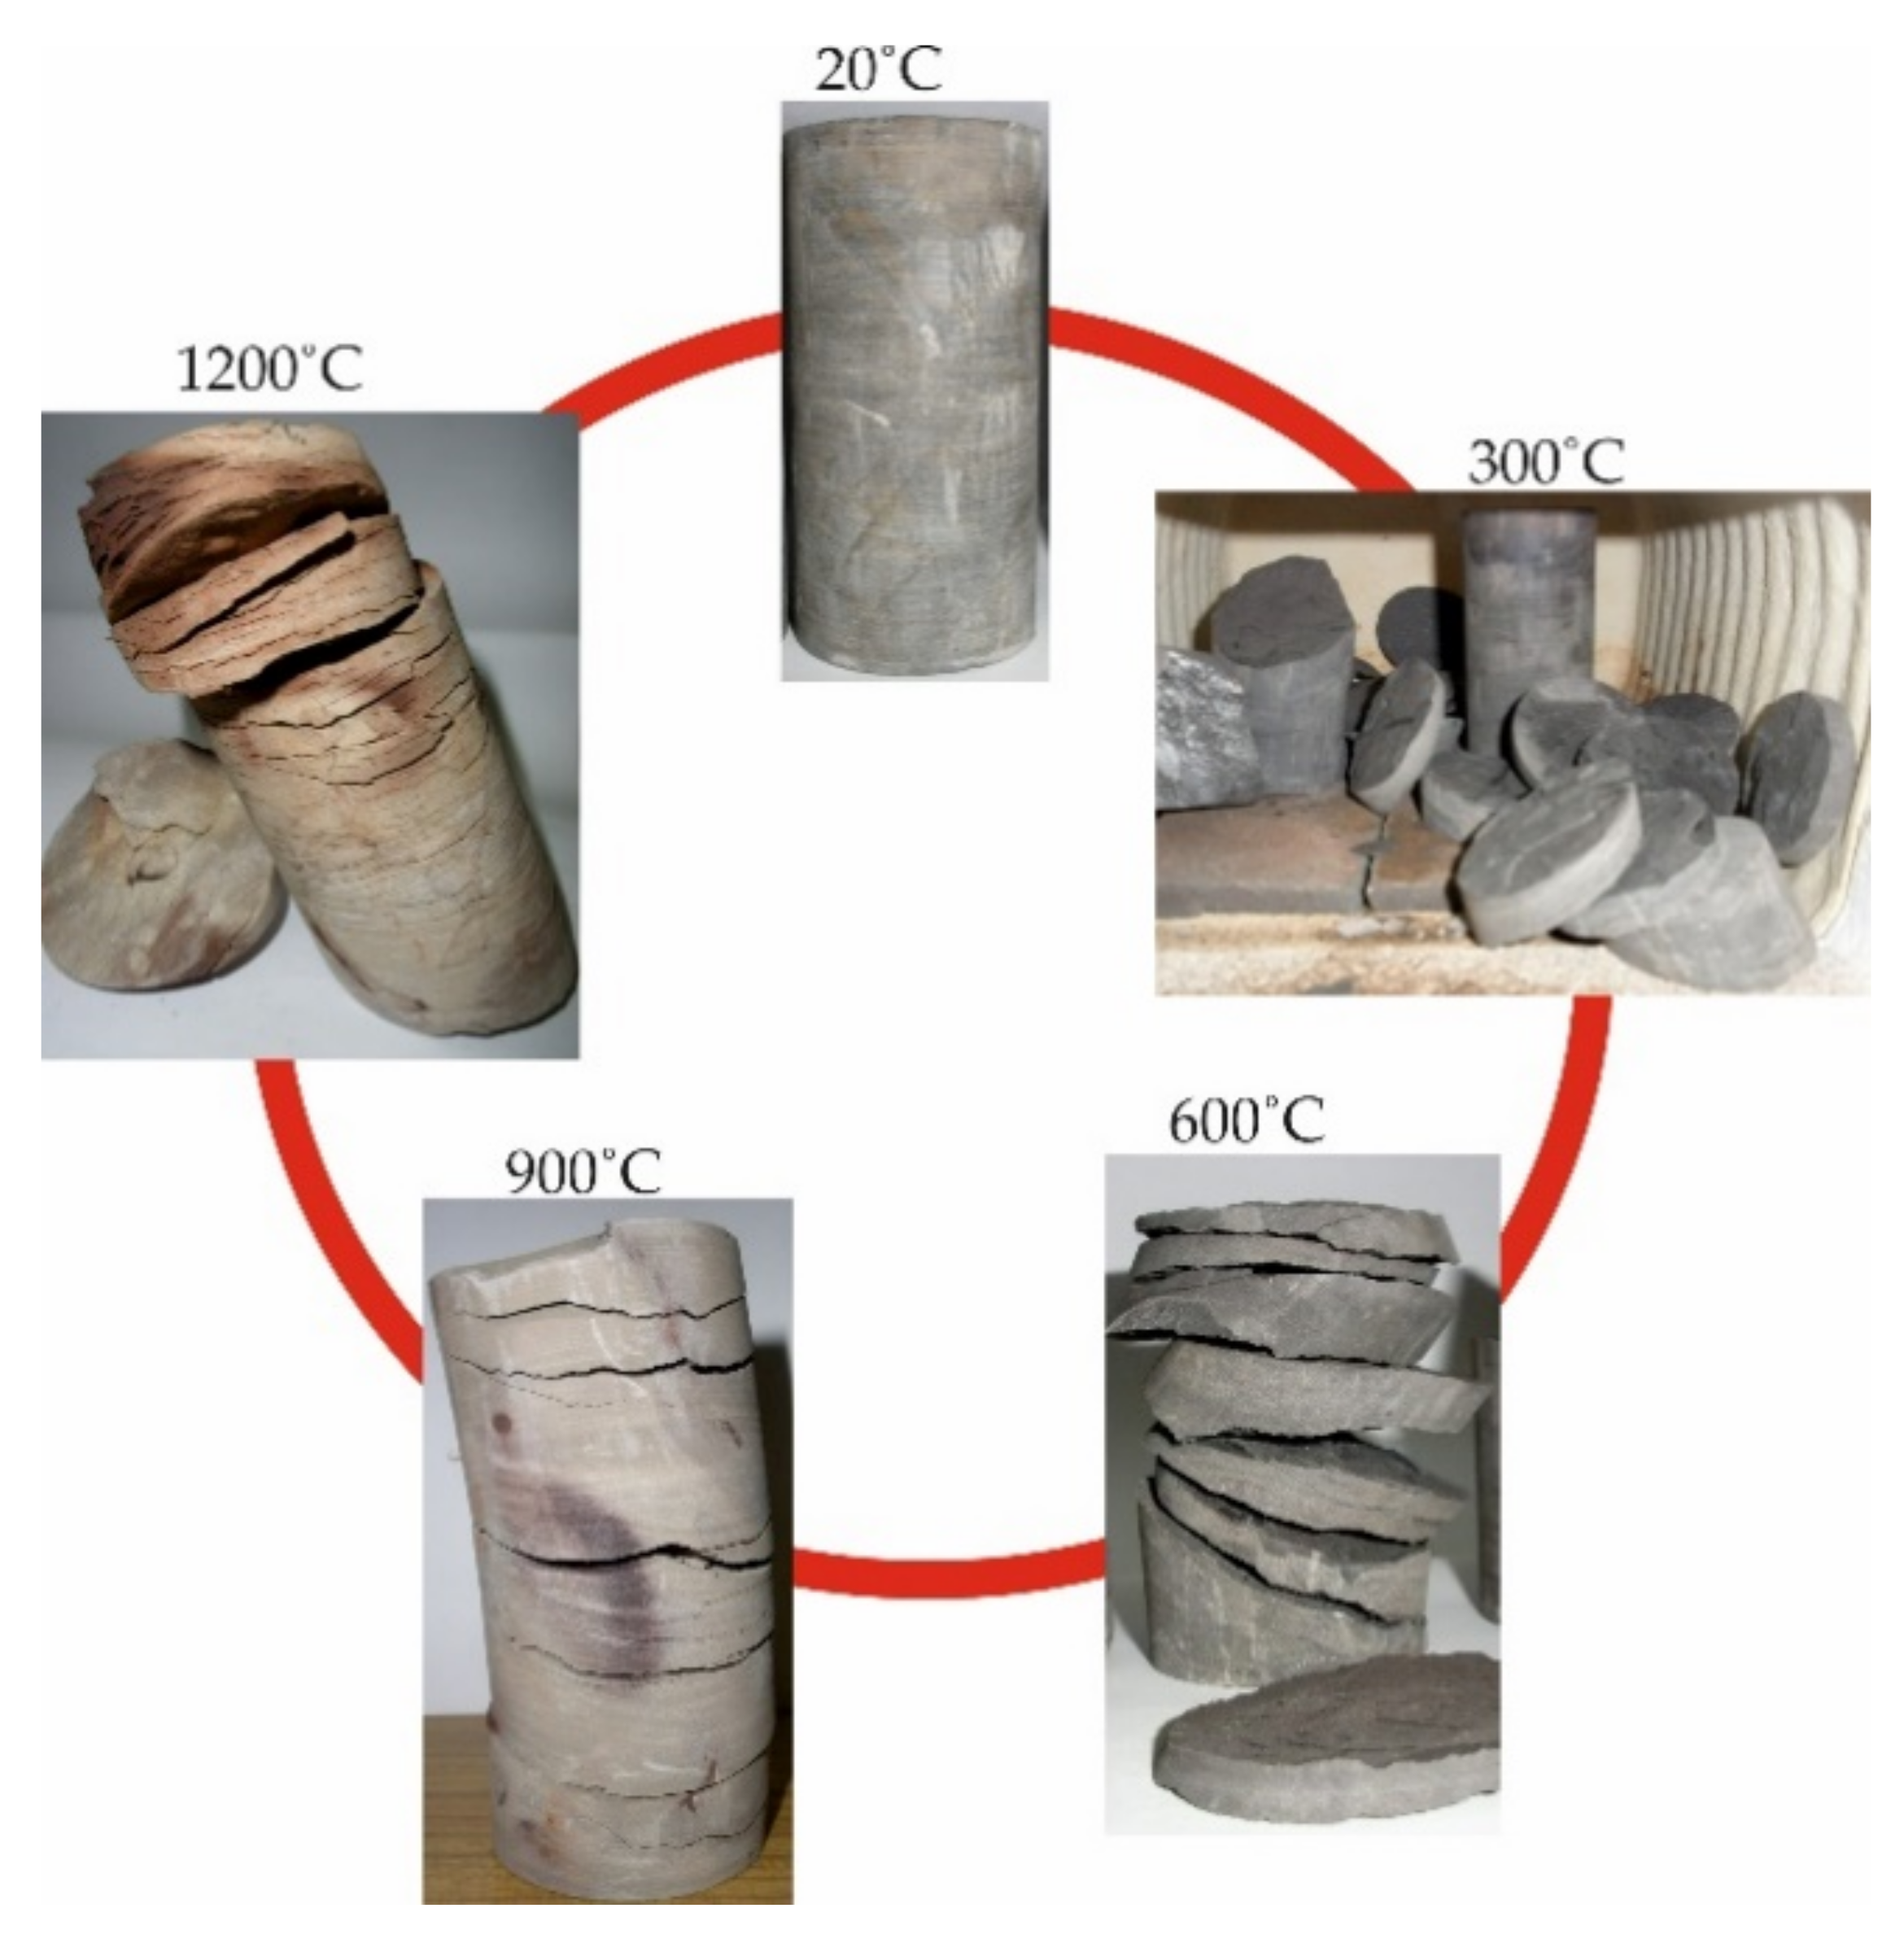
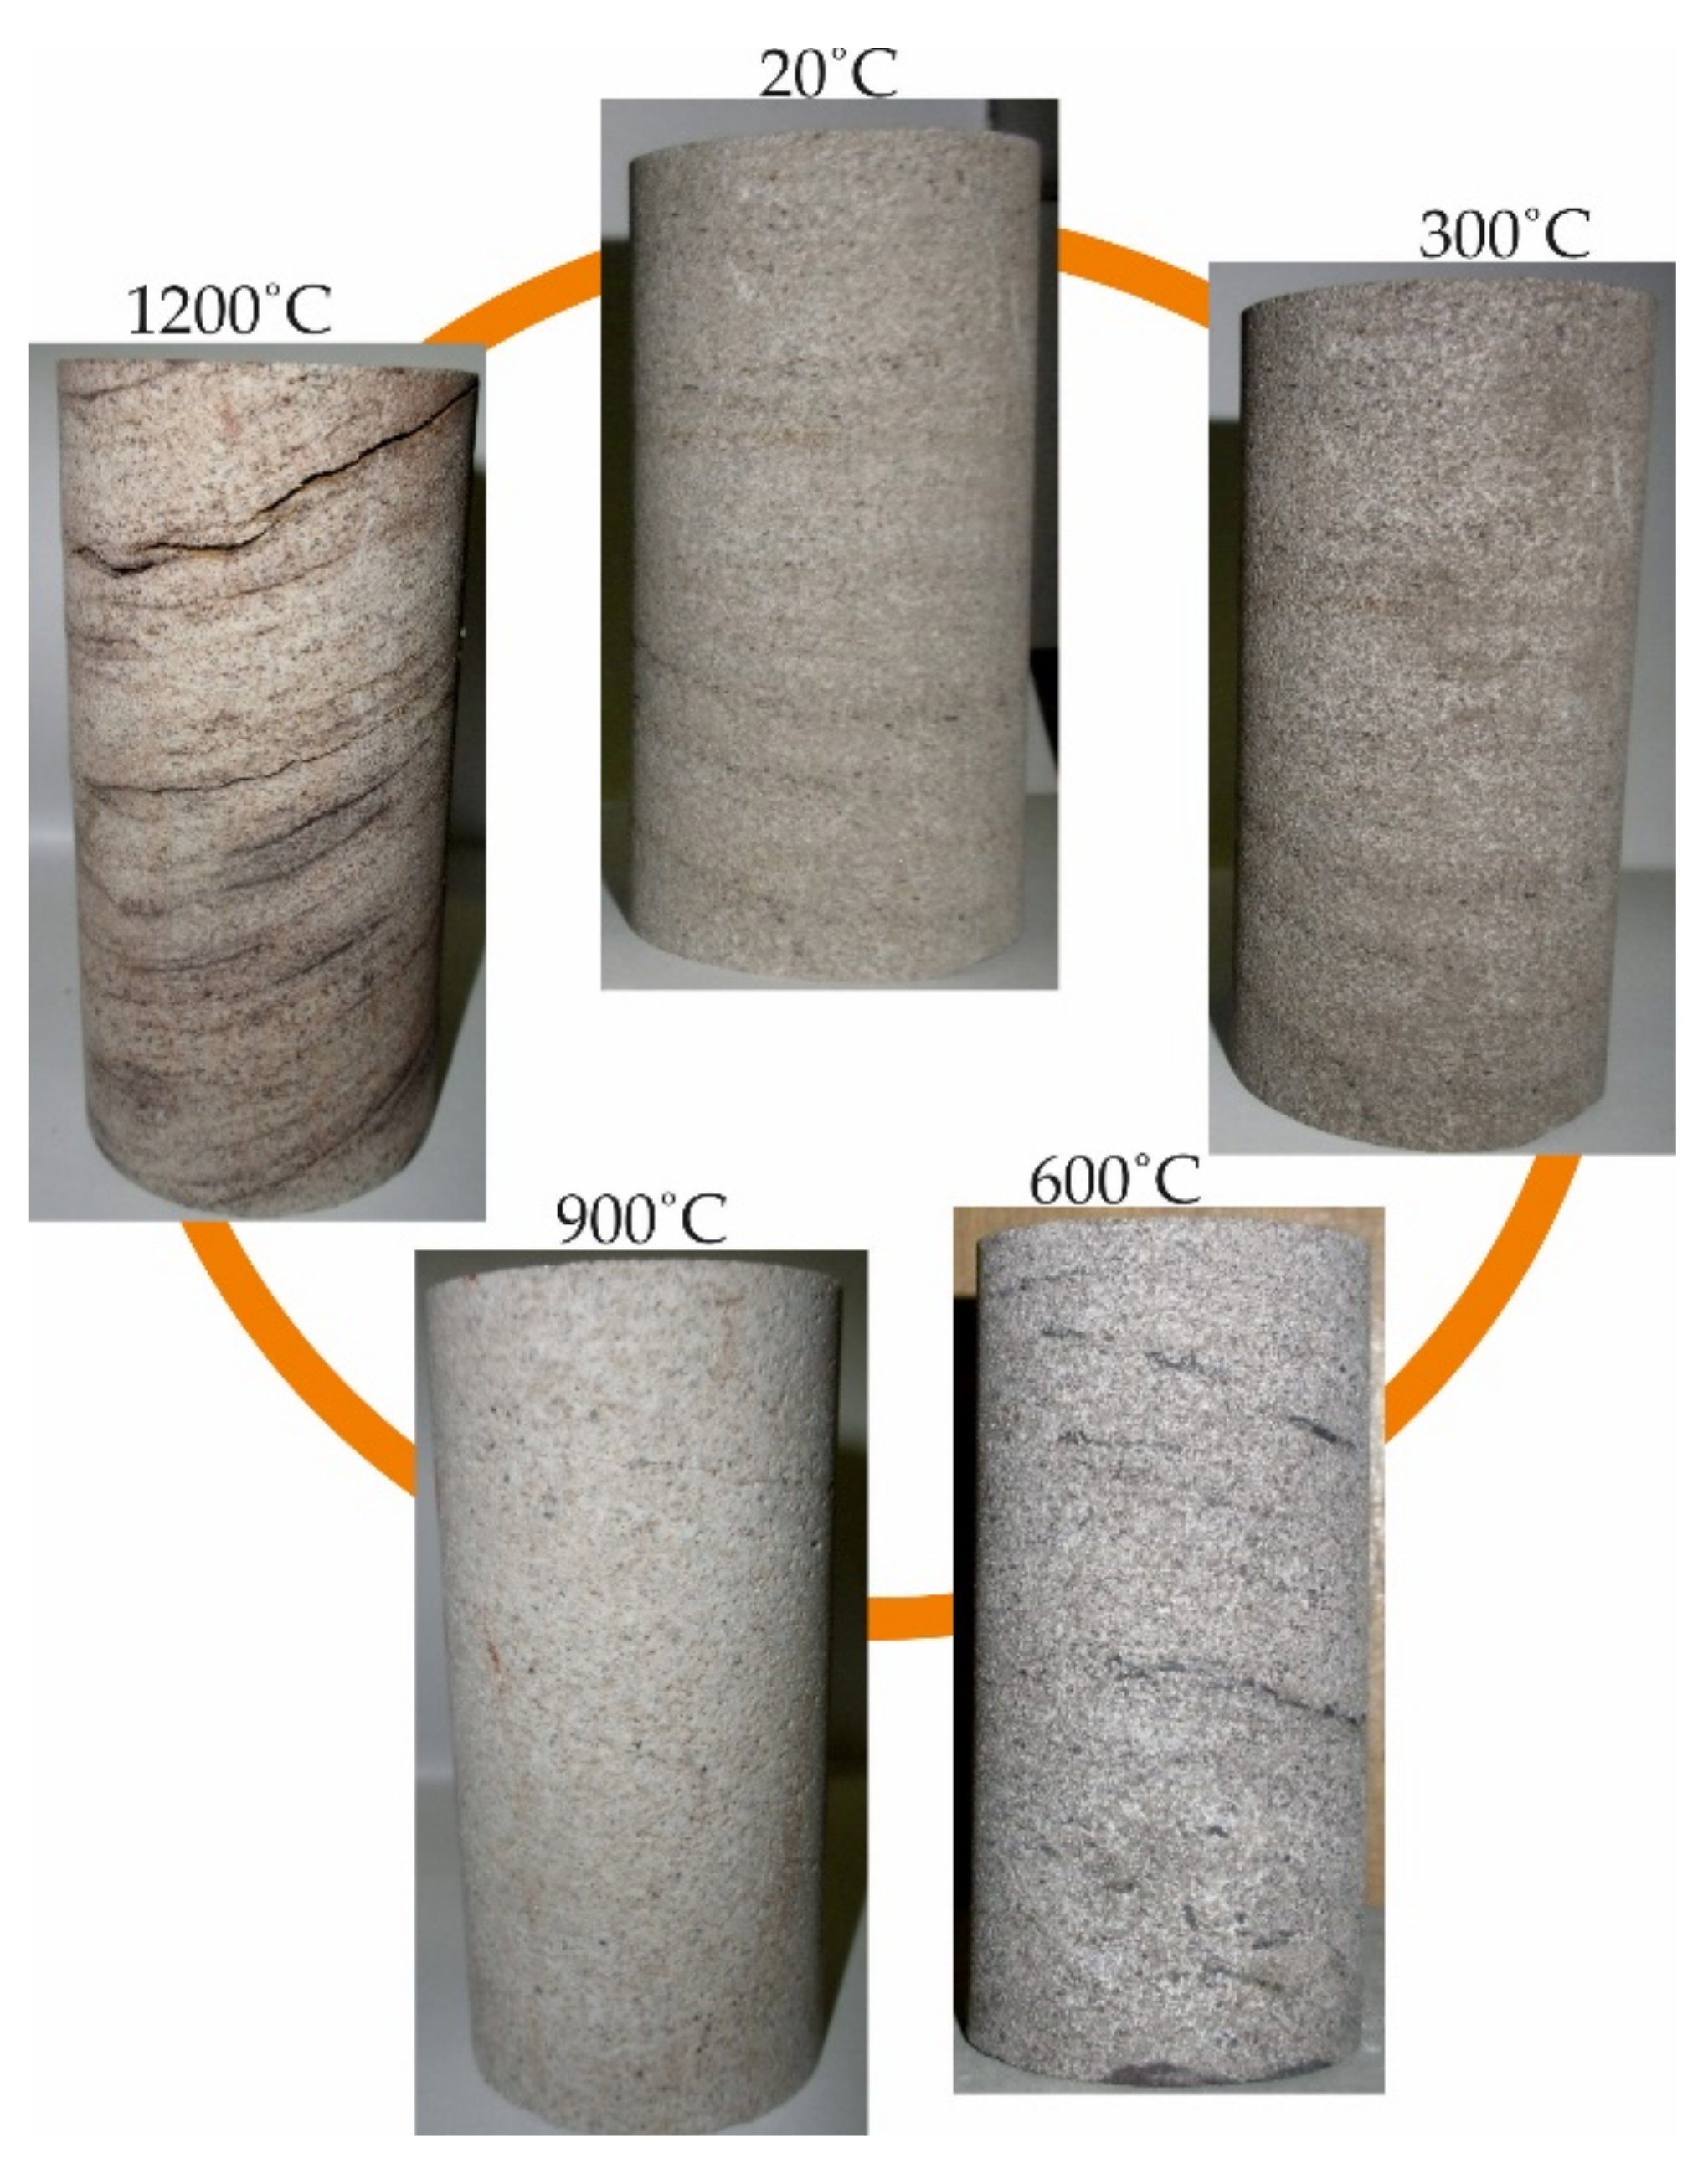
3. Strength, Deformation and Structural Parameters of Sandstone and Claystone Heated at High Temperatures
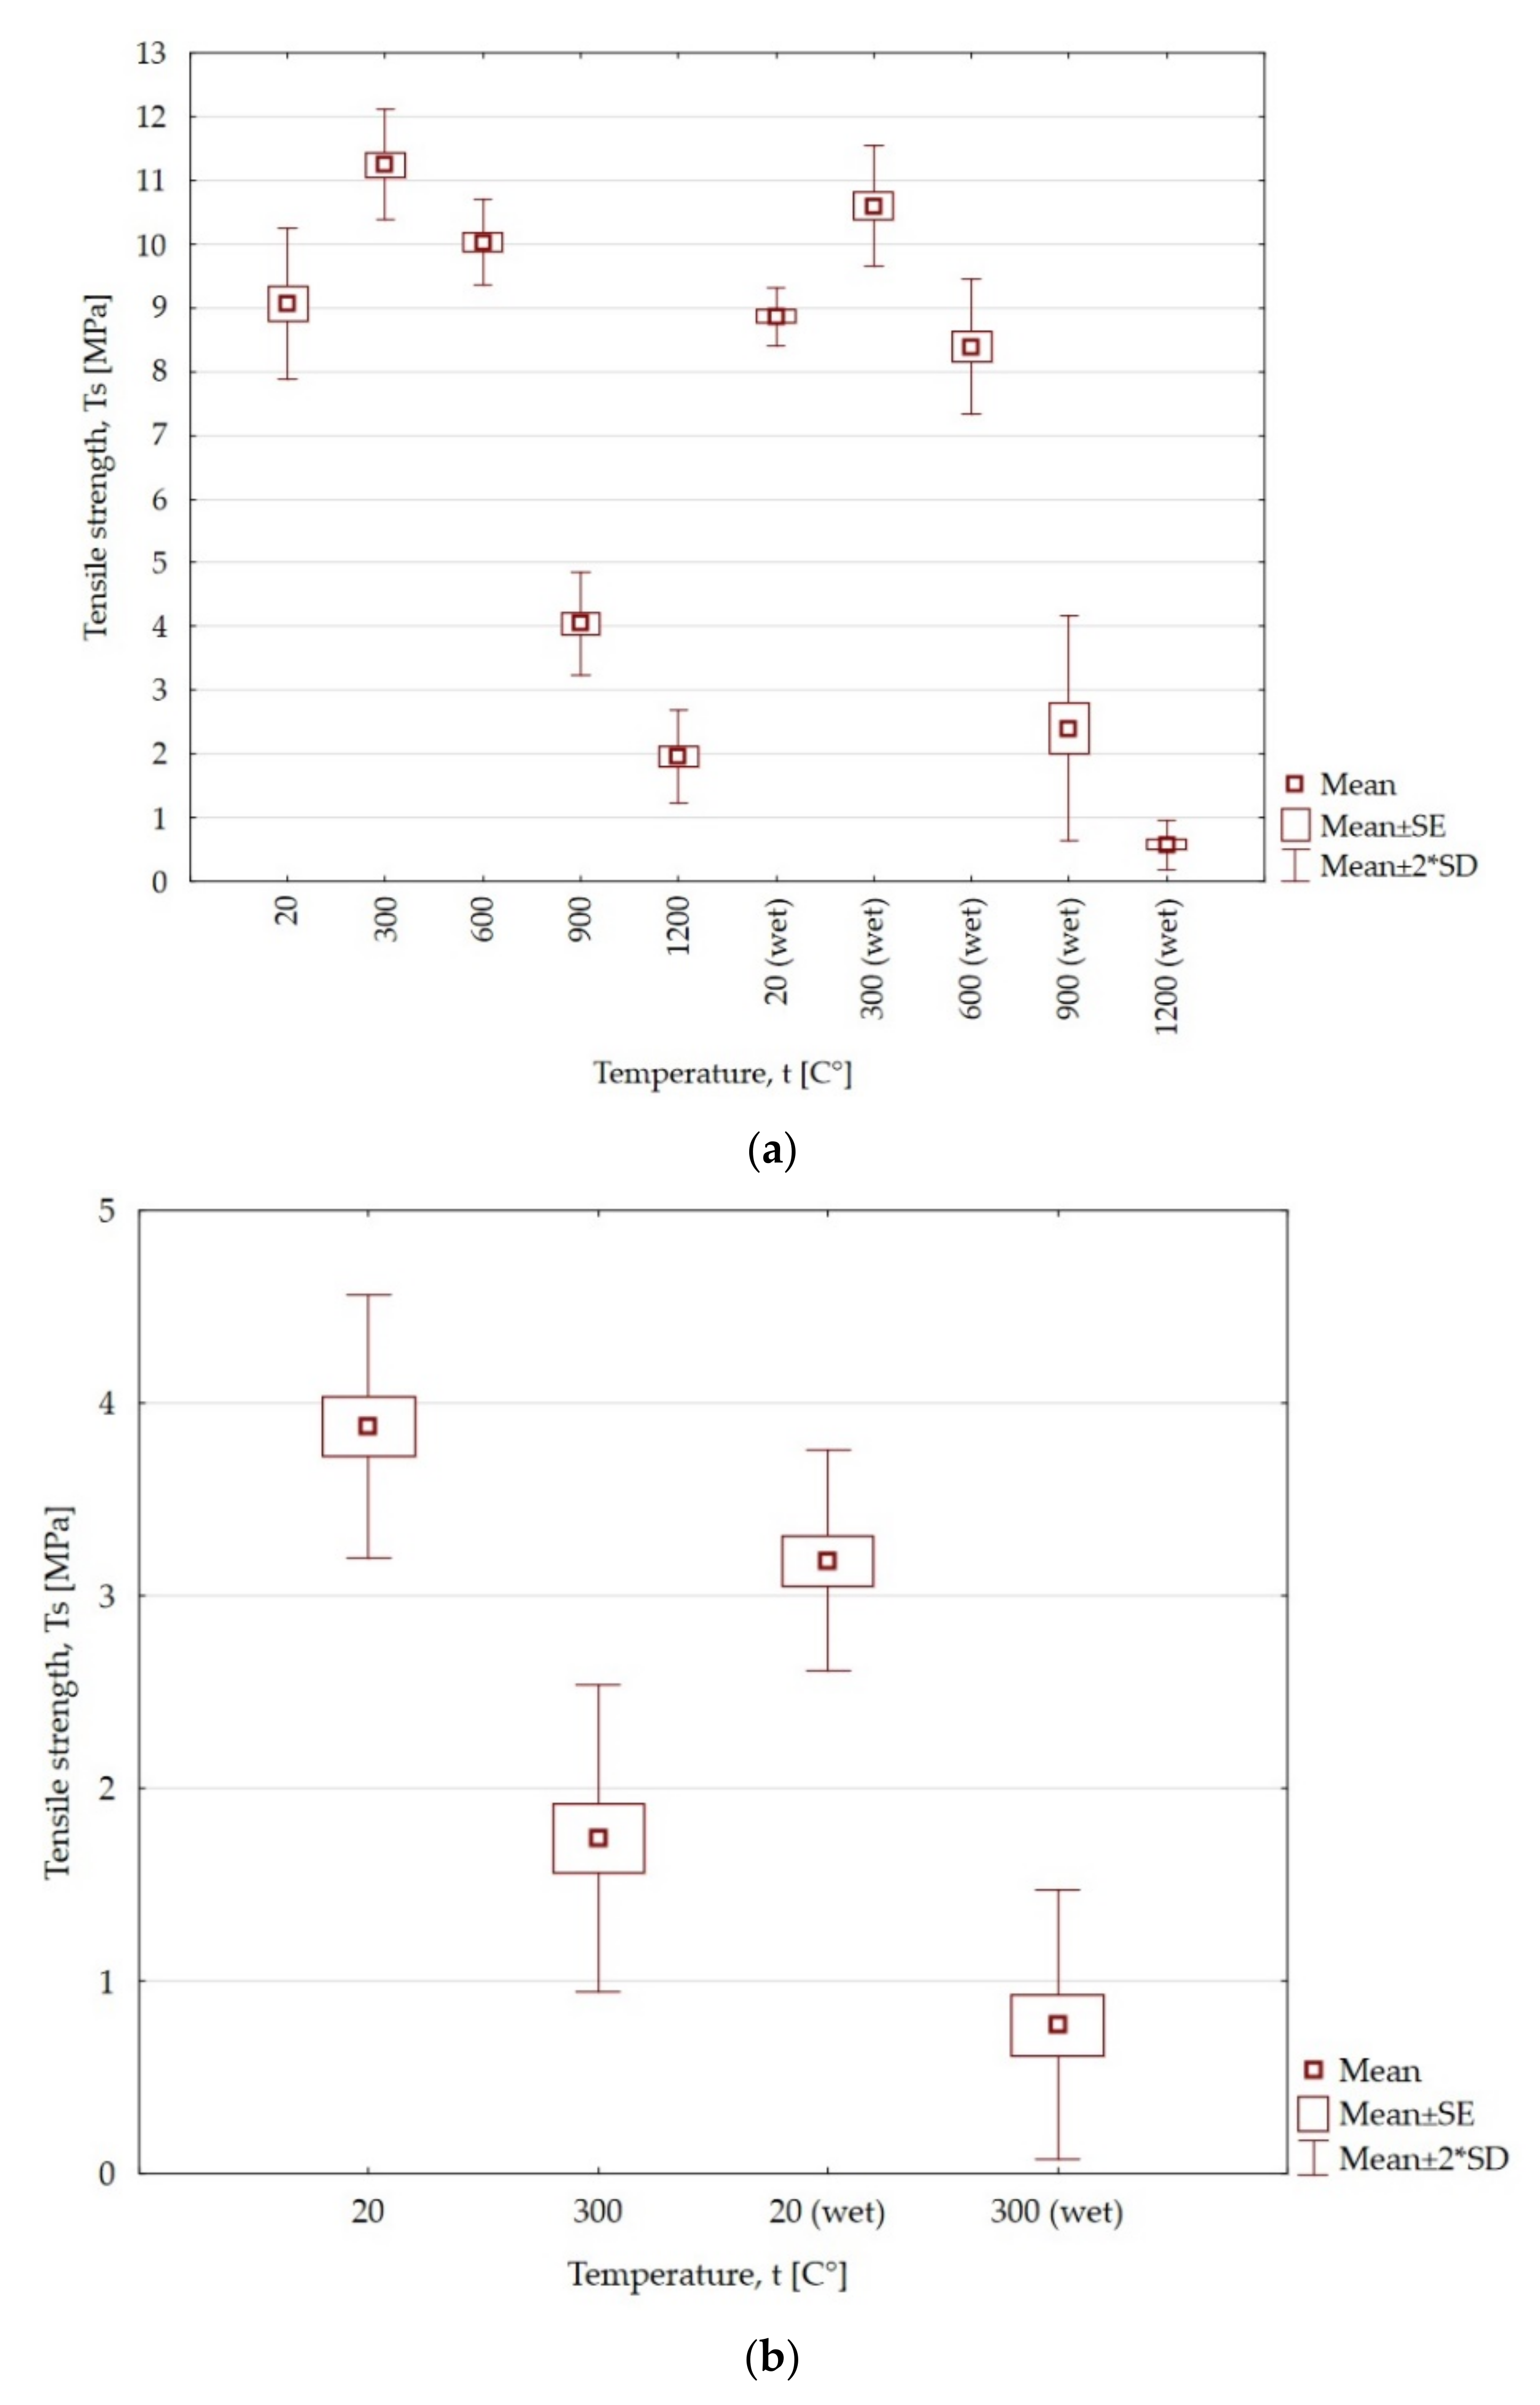
- Ts—tensile strength (MPa);
- L—maximal recorded load (N);
- d—the diameter of the specimen (mm),
- w—the width of the specimen (mm).
4. Numerical Modeling
5. Discussion
6. Conclusions
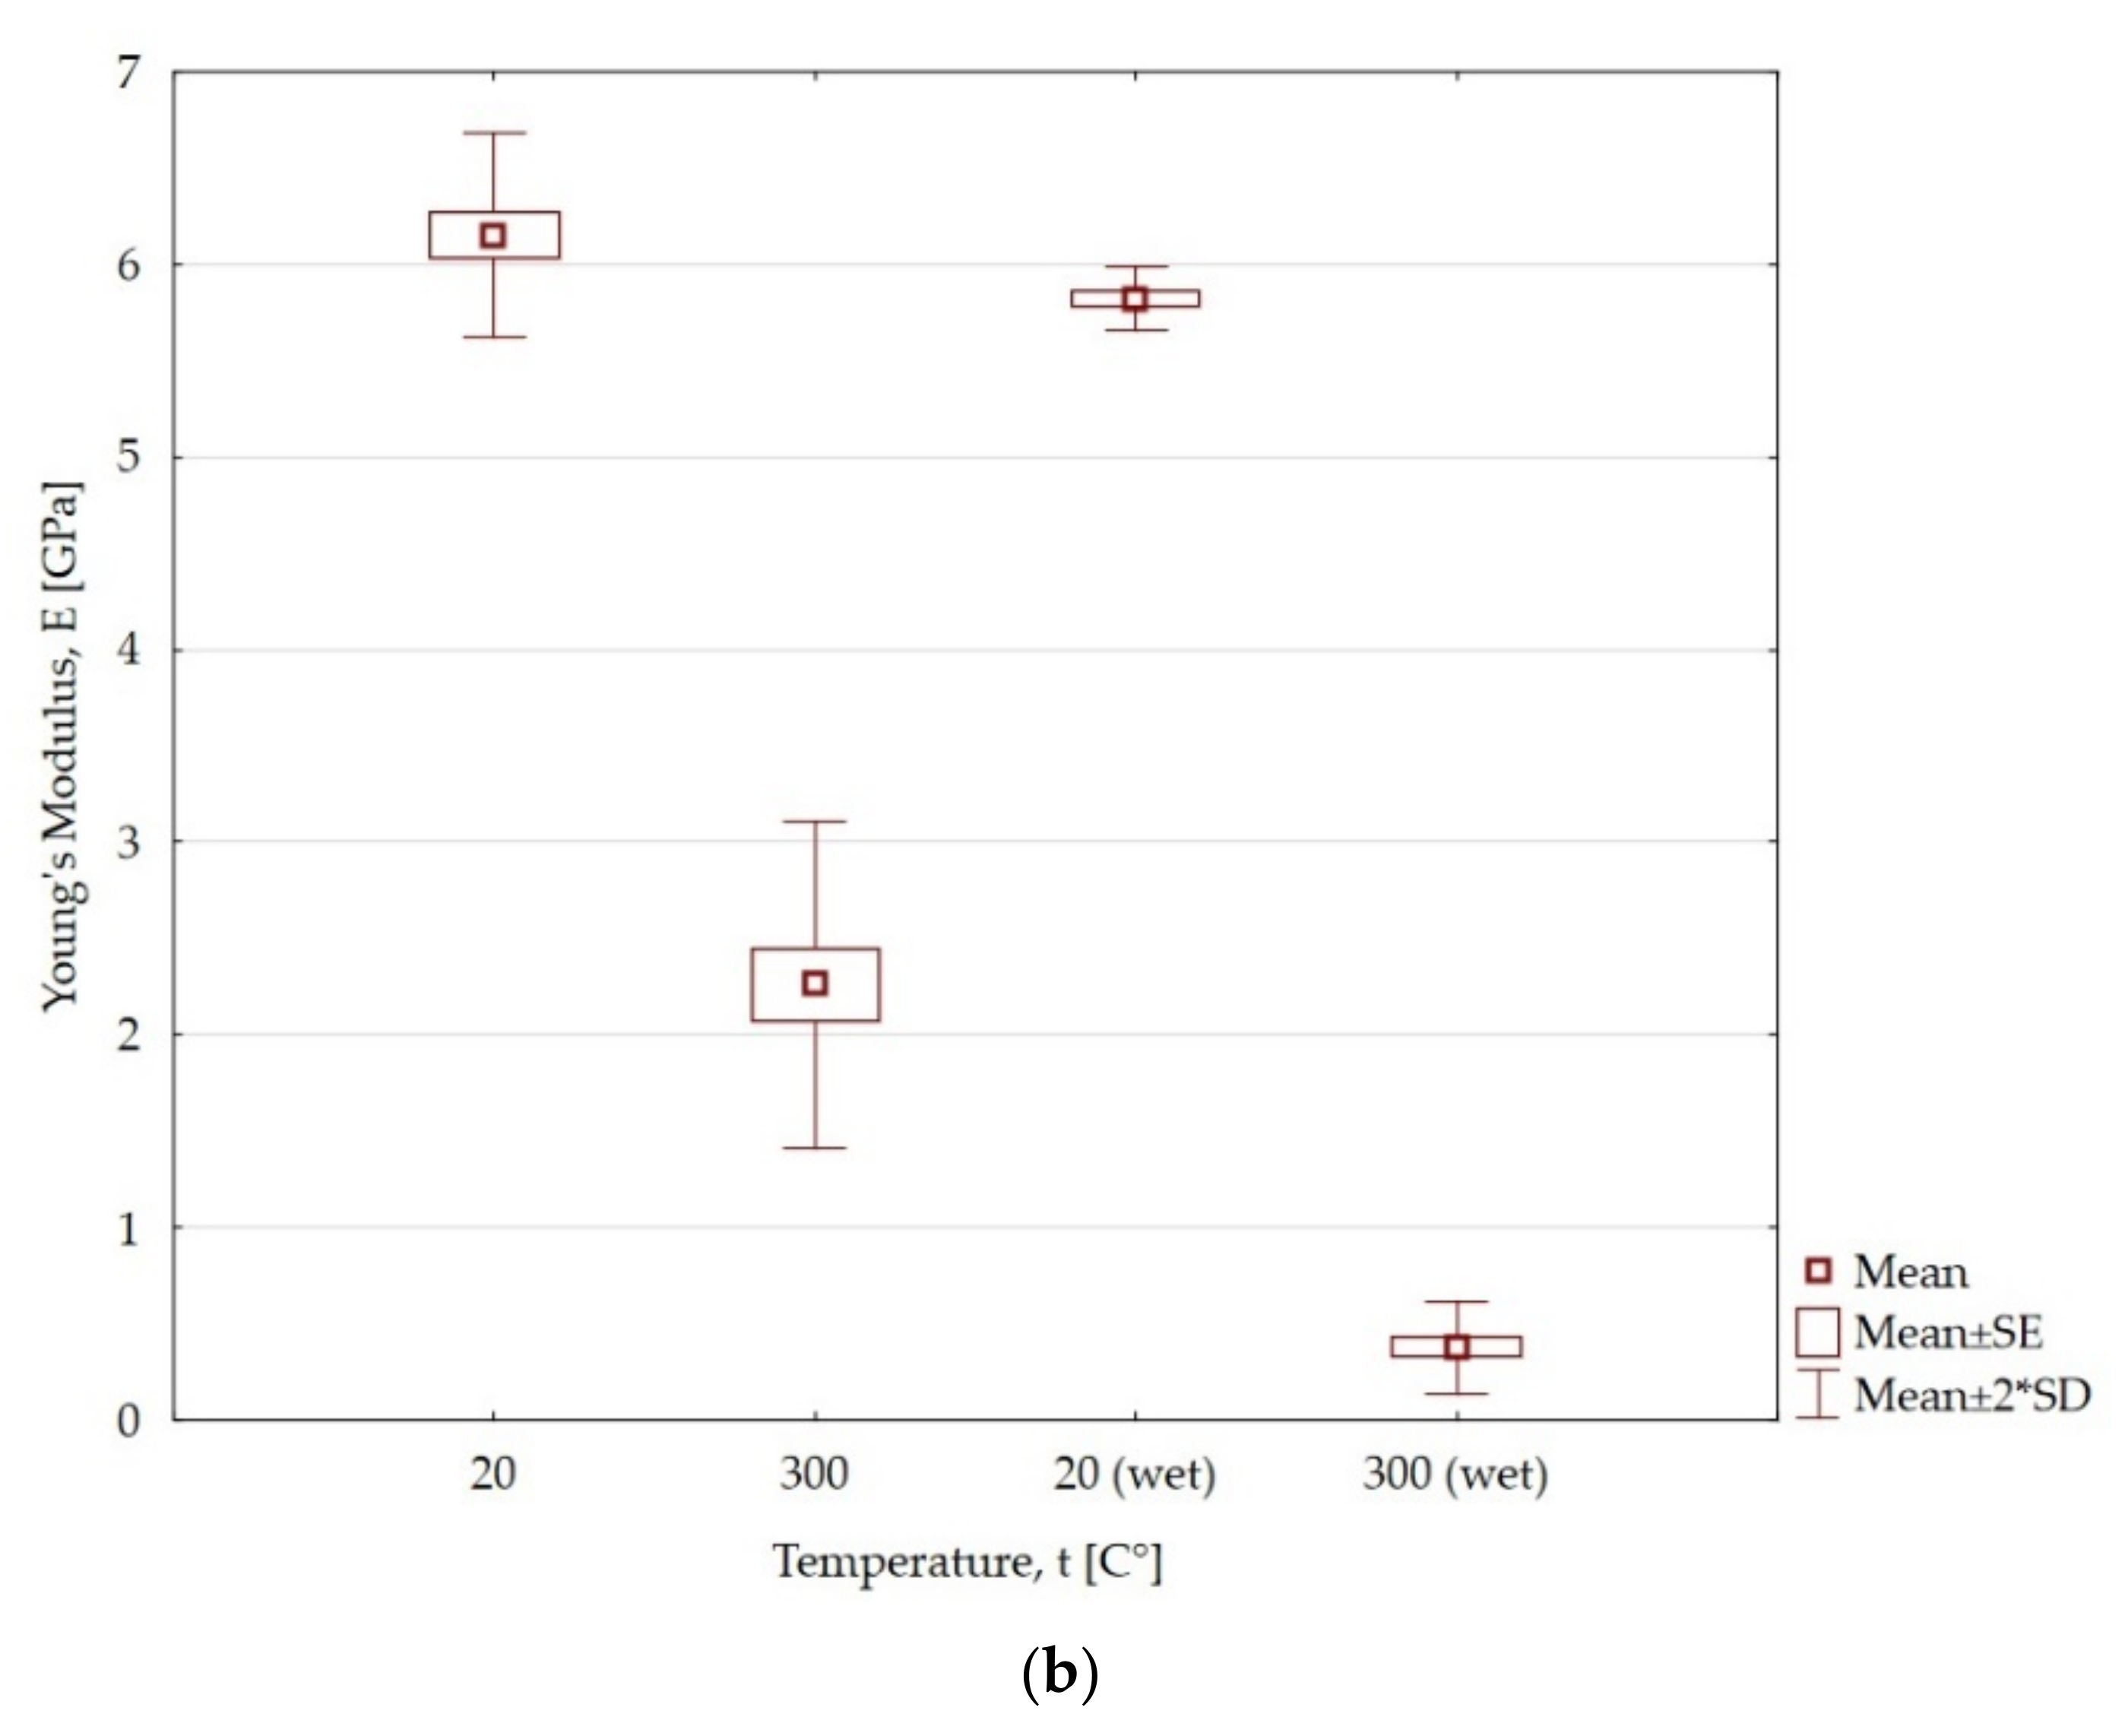
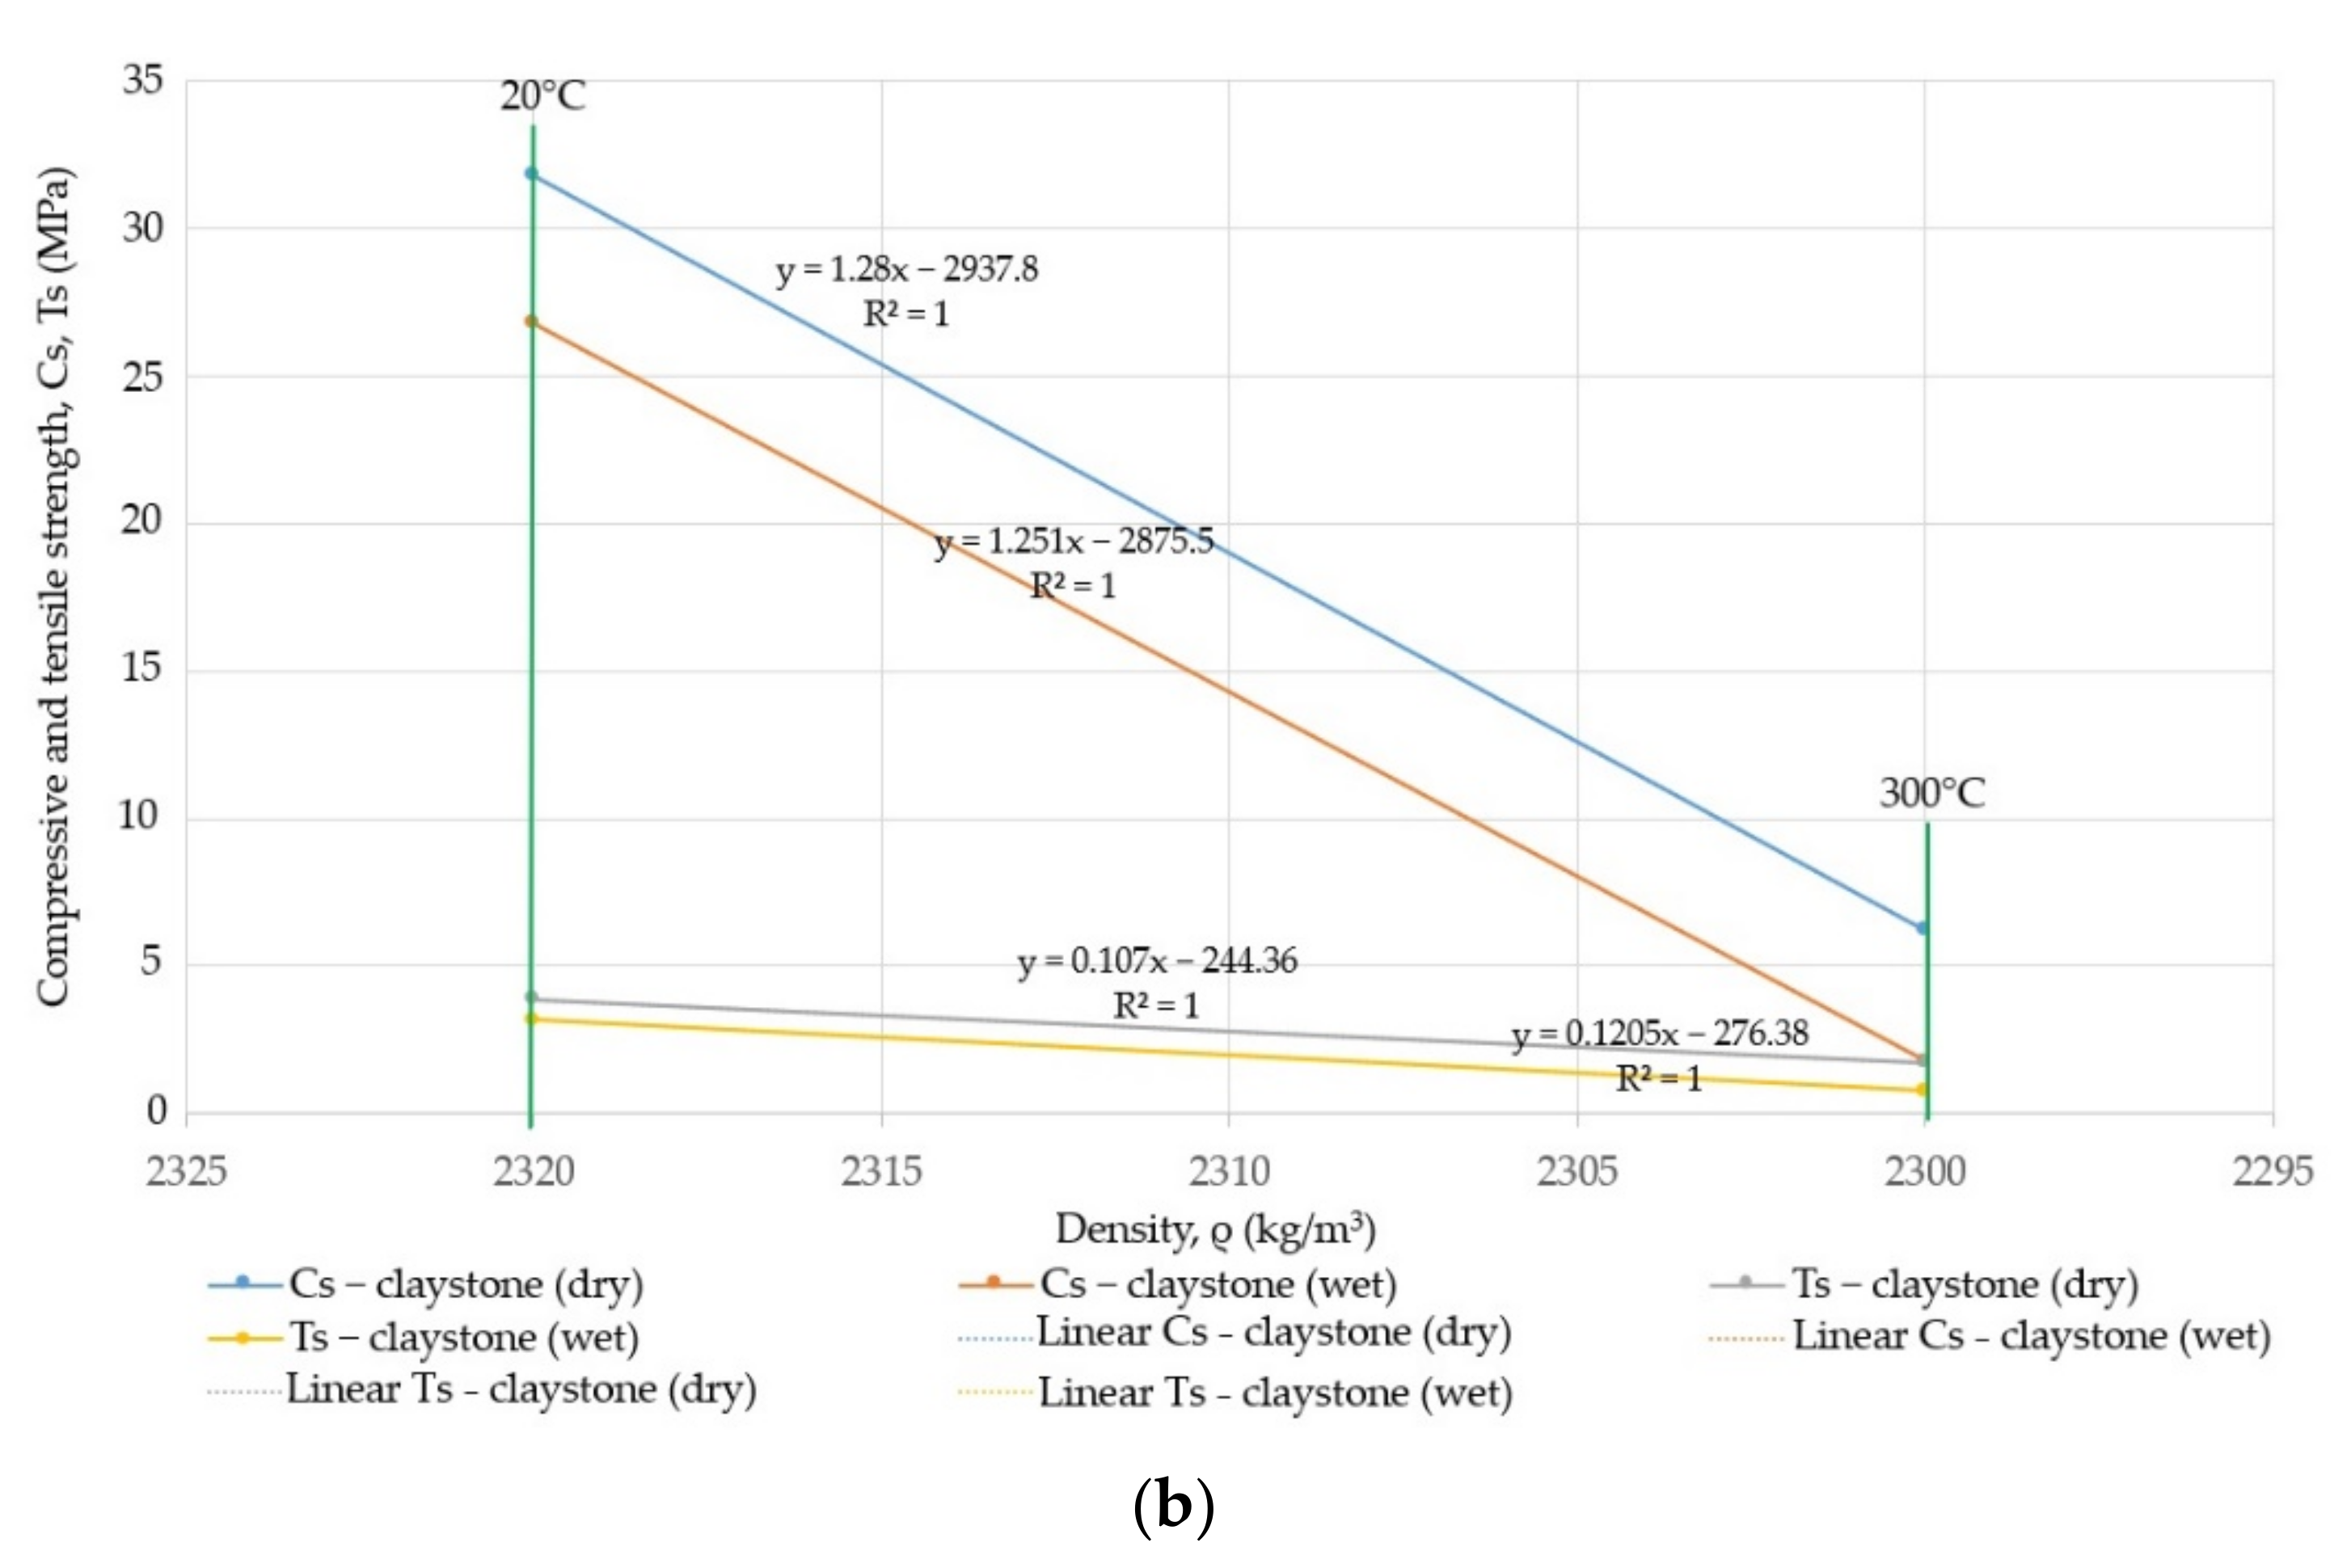
- For dry claystone at the temperature of 300 °C, the compressive strength and tensile strength decrease by 80.5% and 55.15%, respectively, while for wet claystone, these decrease by 93.35% and 75.78%, respectively, in relation to the initial value. After exceeding the temperature of 300 °C, the claystone decomposed;
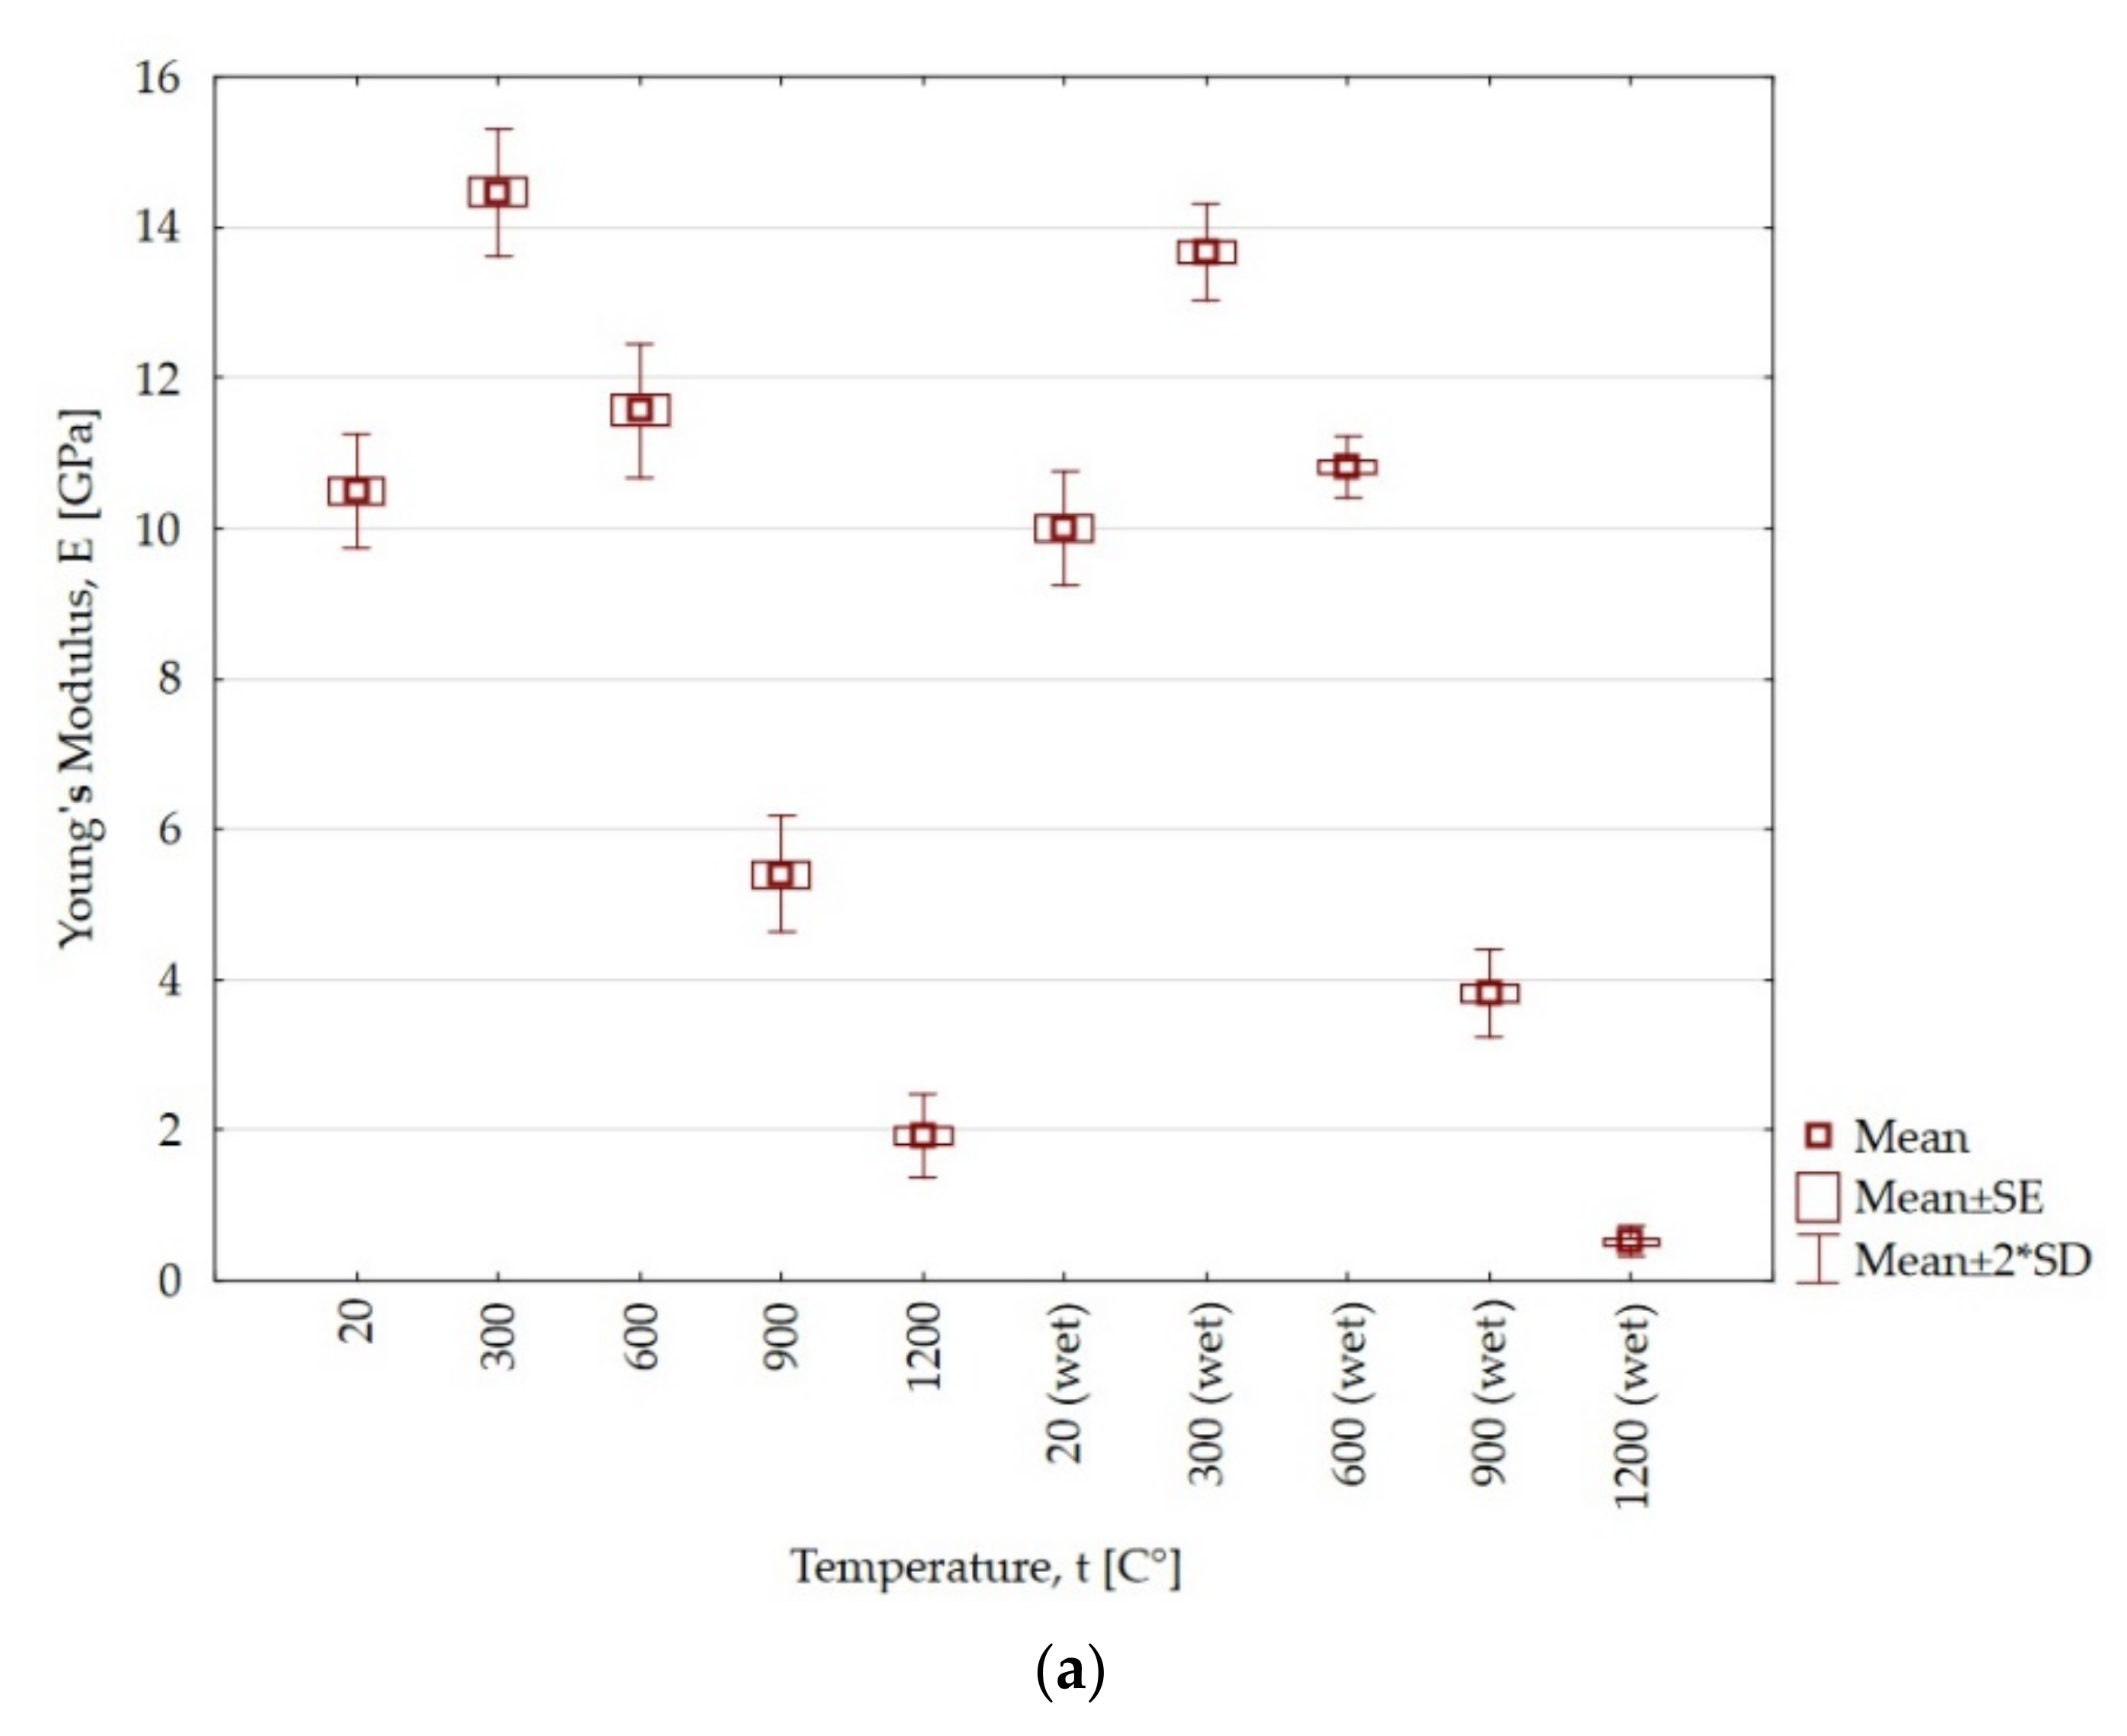
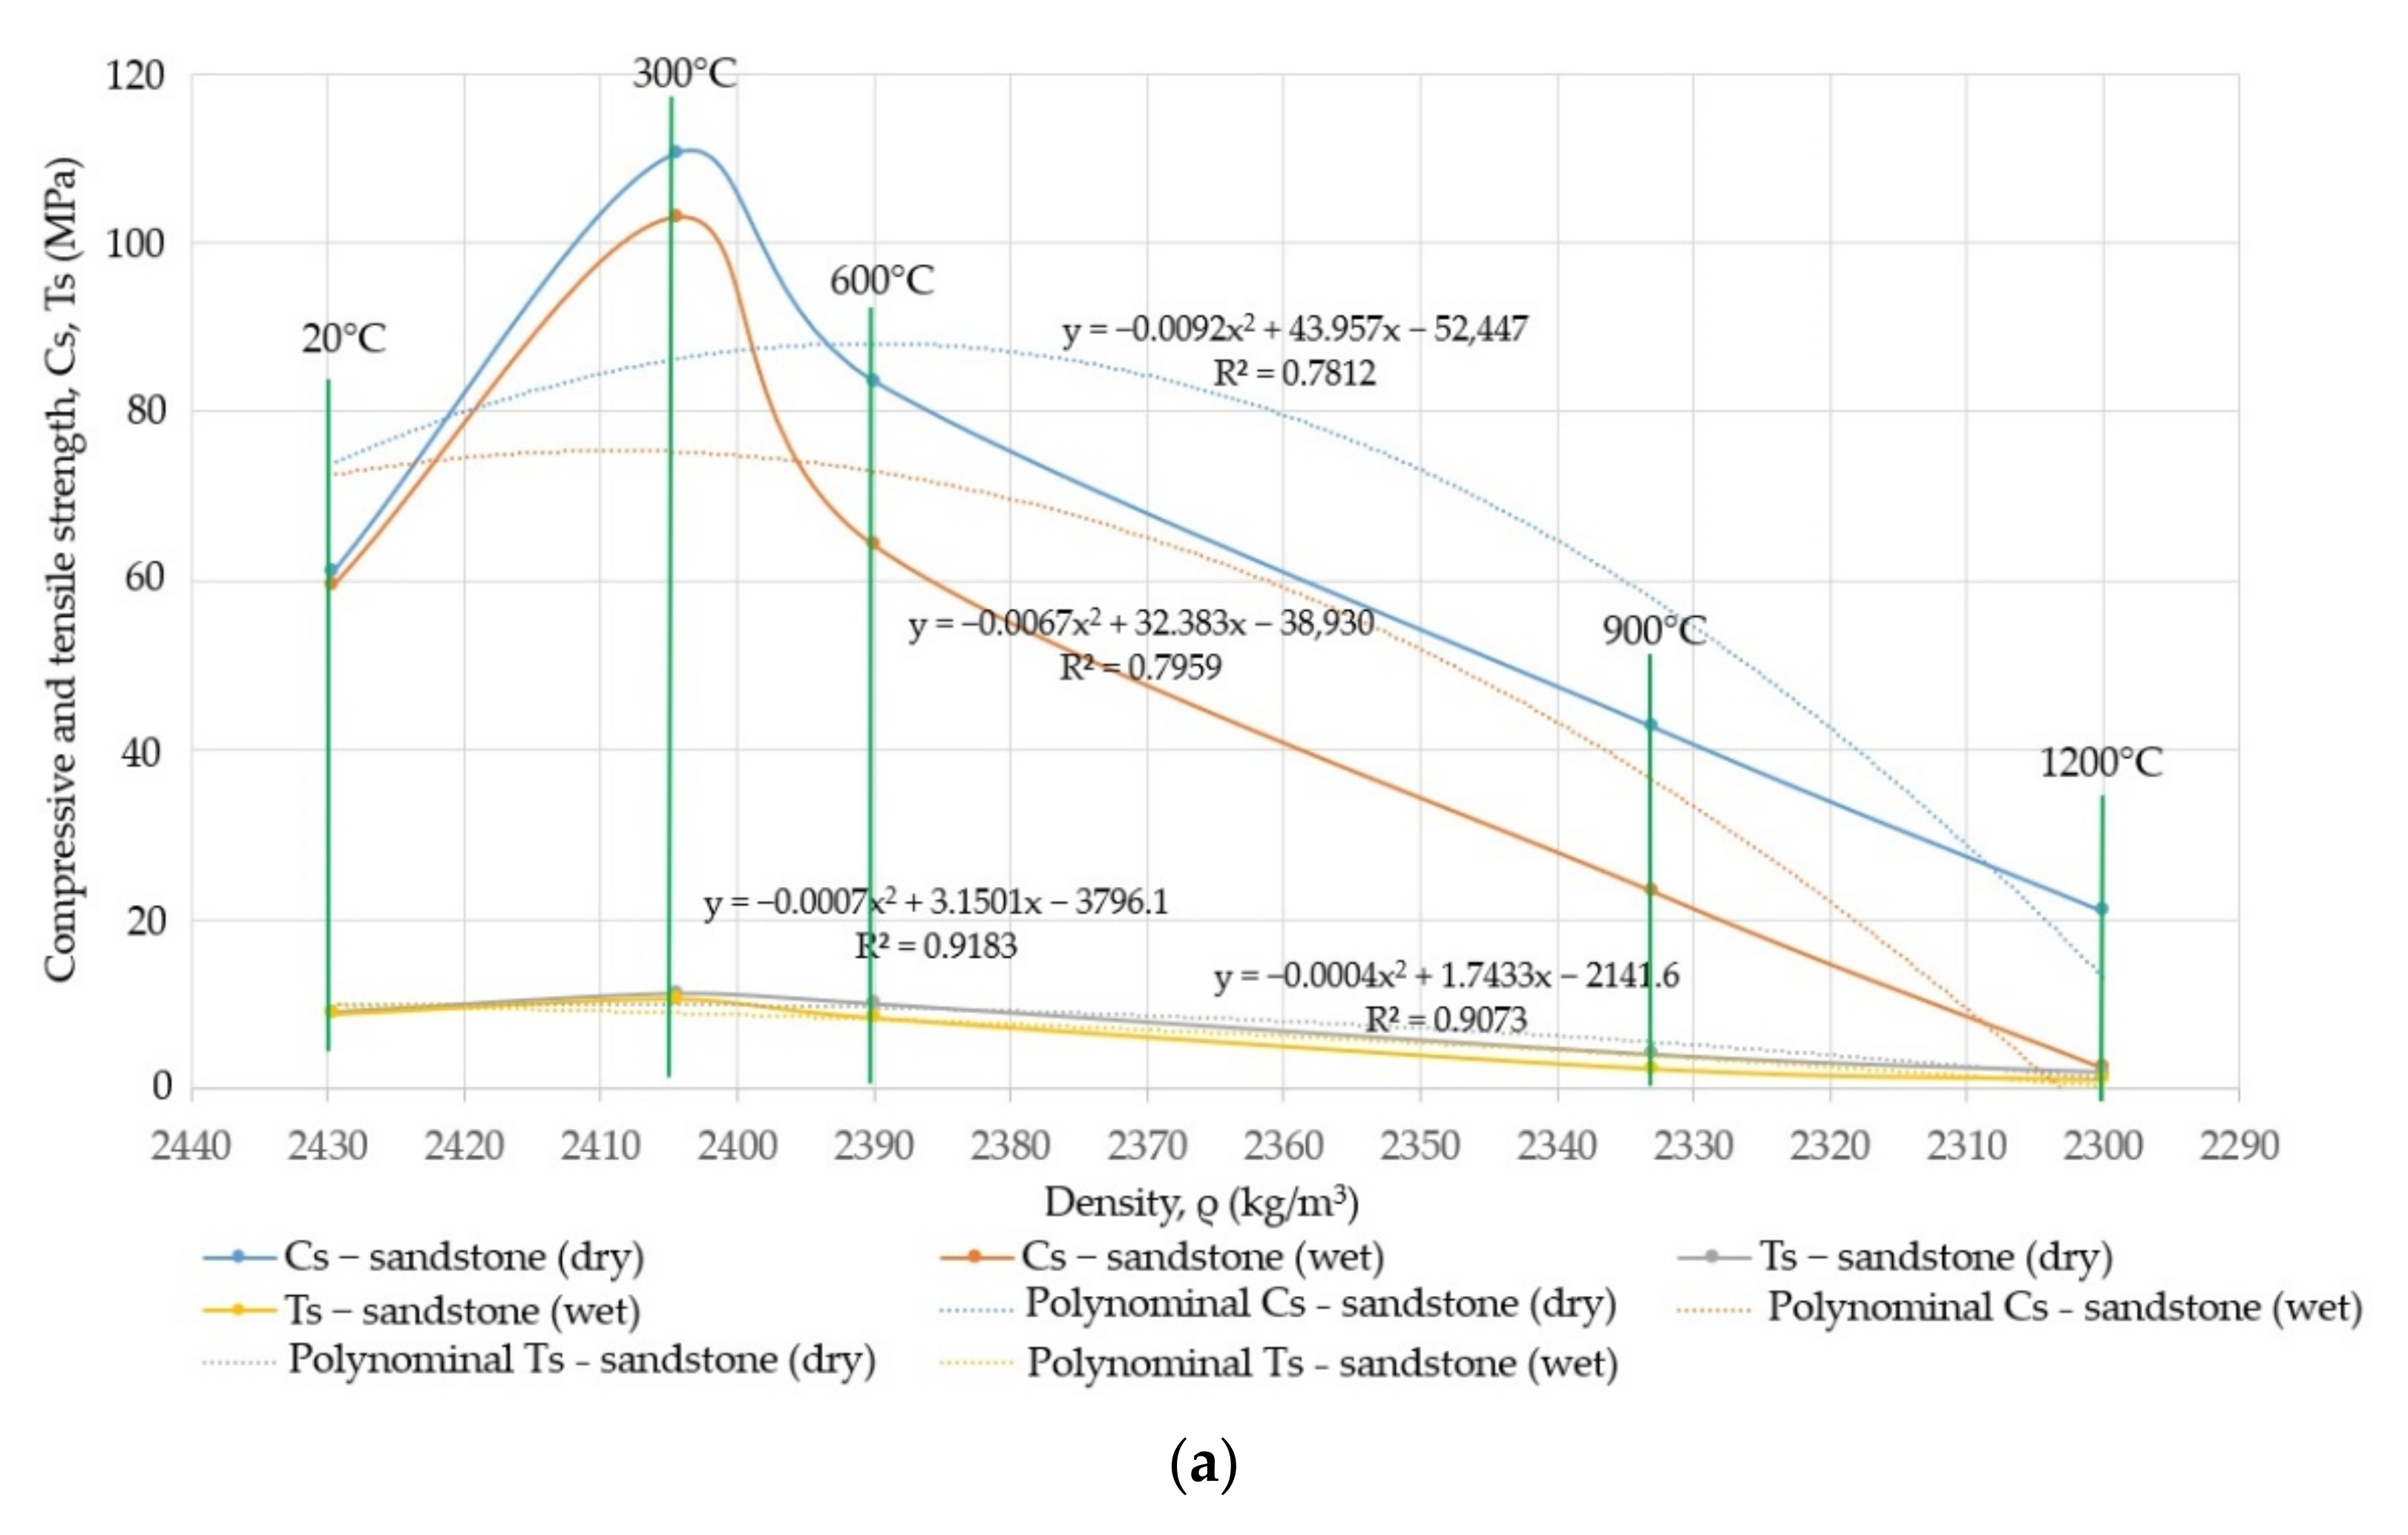
- For dry sandstone heated at 300 °C and 600 °C, the compressive strength increases by 80.7% and 36.6%, respectively, while for temperatures from 900 °C to 1200 °C, there is a decrease by 30.06% and 65.68%, respectively, in relation to the temperature of 20 °C. In the case of wet sandstone, there is an increase of 72.8% and 7.7% for temperatures of 300 °C and 600 °C, respectively, and a decrease of 60.73% and 95.73%, respectively, for temperatures of 900 °C and 1200 °C. The tensile strength for dry sandstone increases by 24.06% and 10.06%, respectively, for the temperatures of 300 °C and 600 °C, and decreases by 30.06% and 65.68%, respectively, for the temperatures of 900 °C and 1200 °C. On the other hand, for wet sandstone, there is an increase of 19.63% for the temperature of 300 °C and a decrease of 5.37%, 72.86% and 87.29% for the temperatures of 600 °C, 900 °C and 1200 °C, respectively;
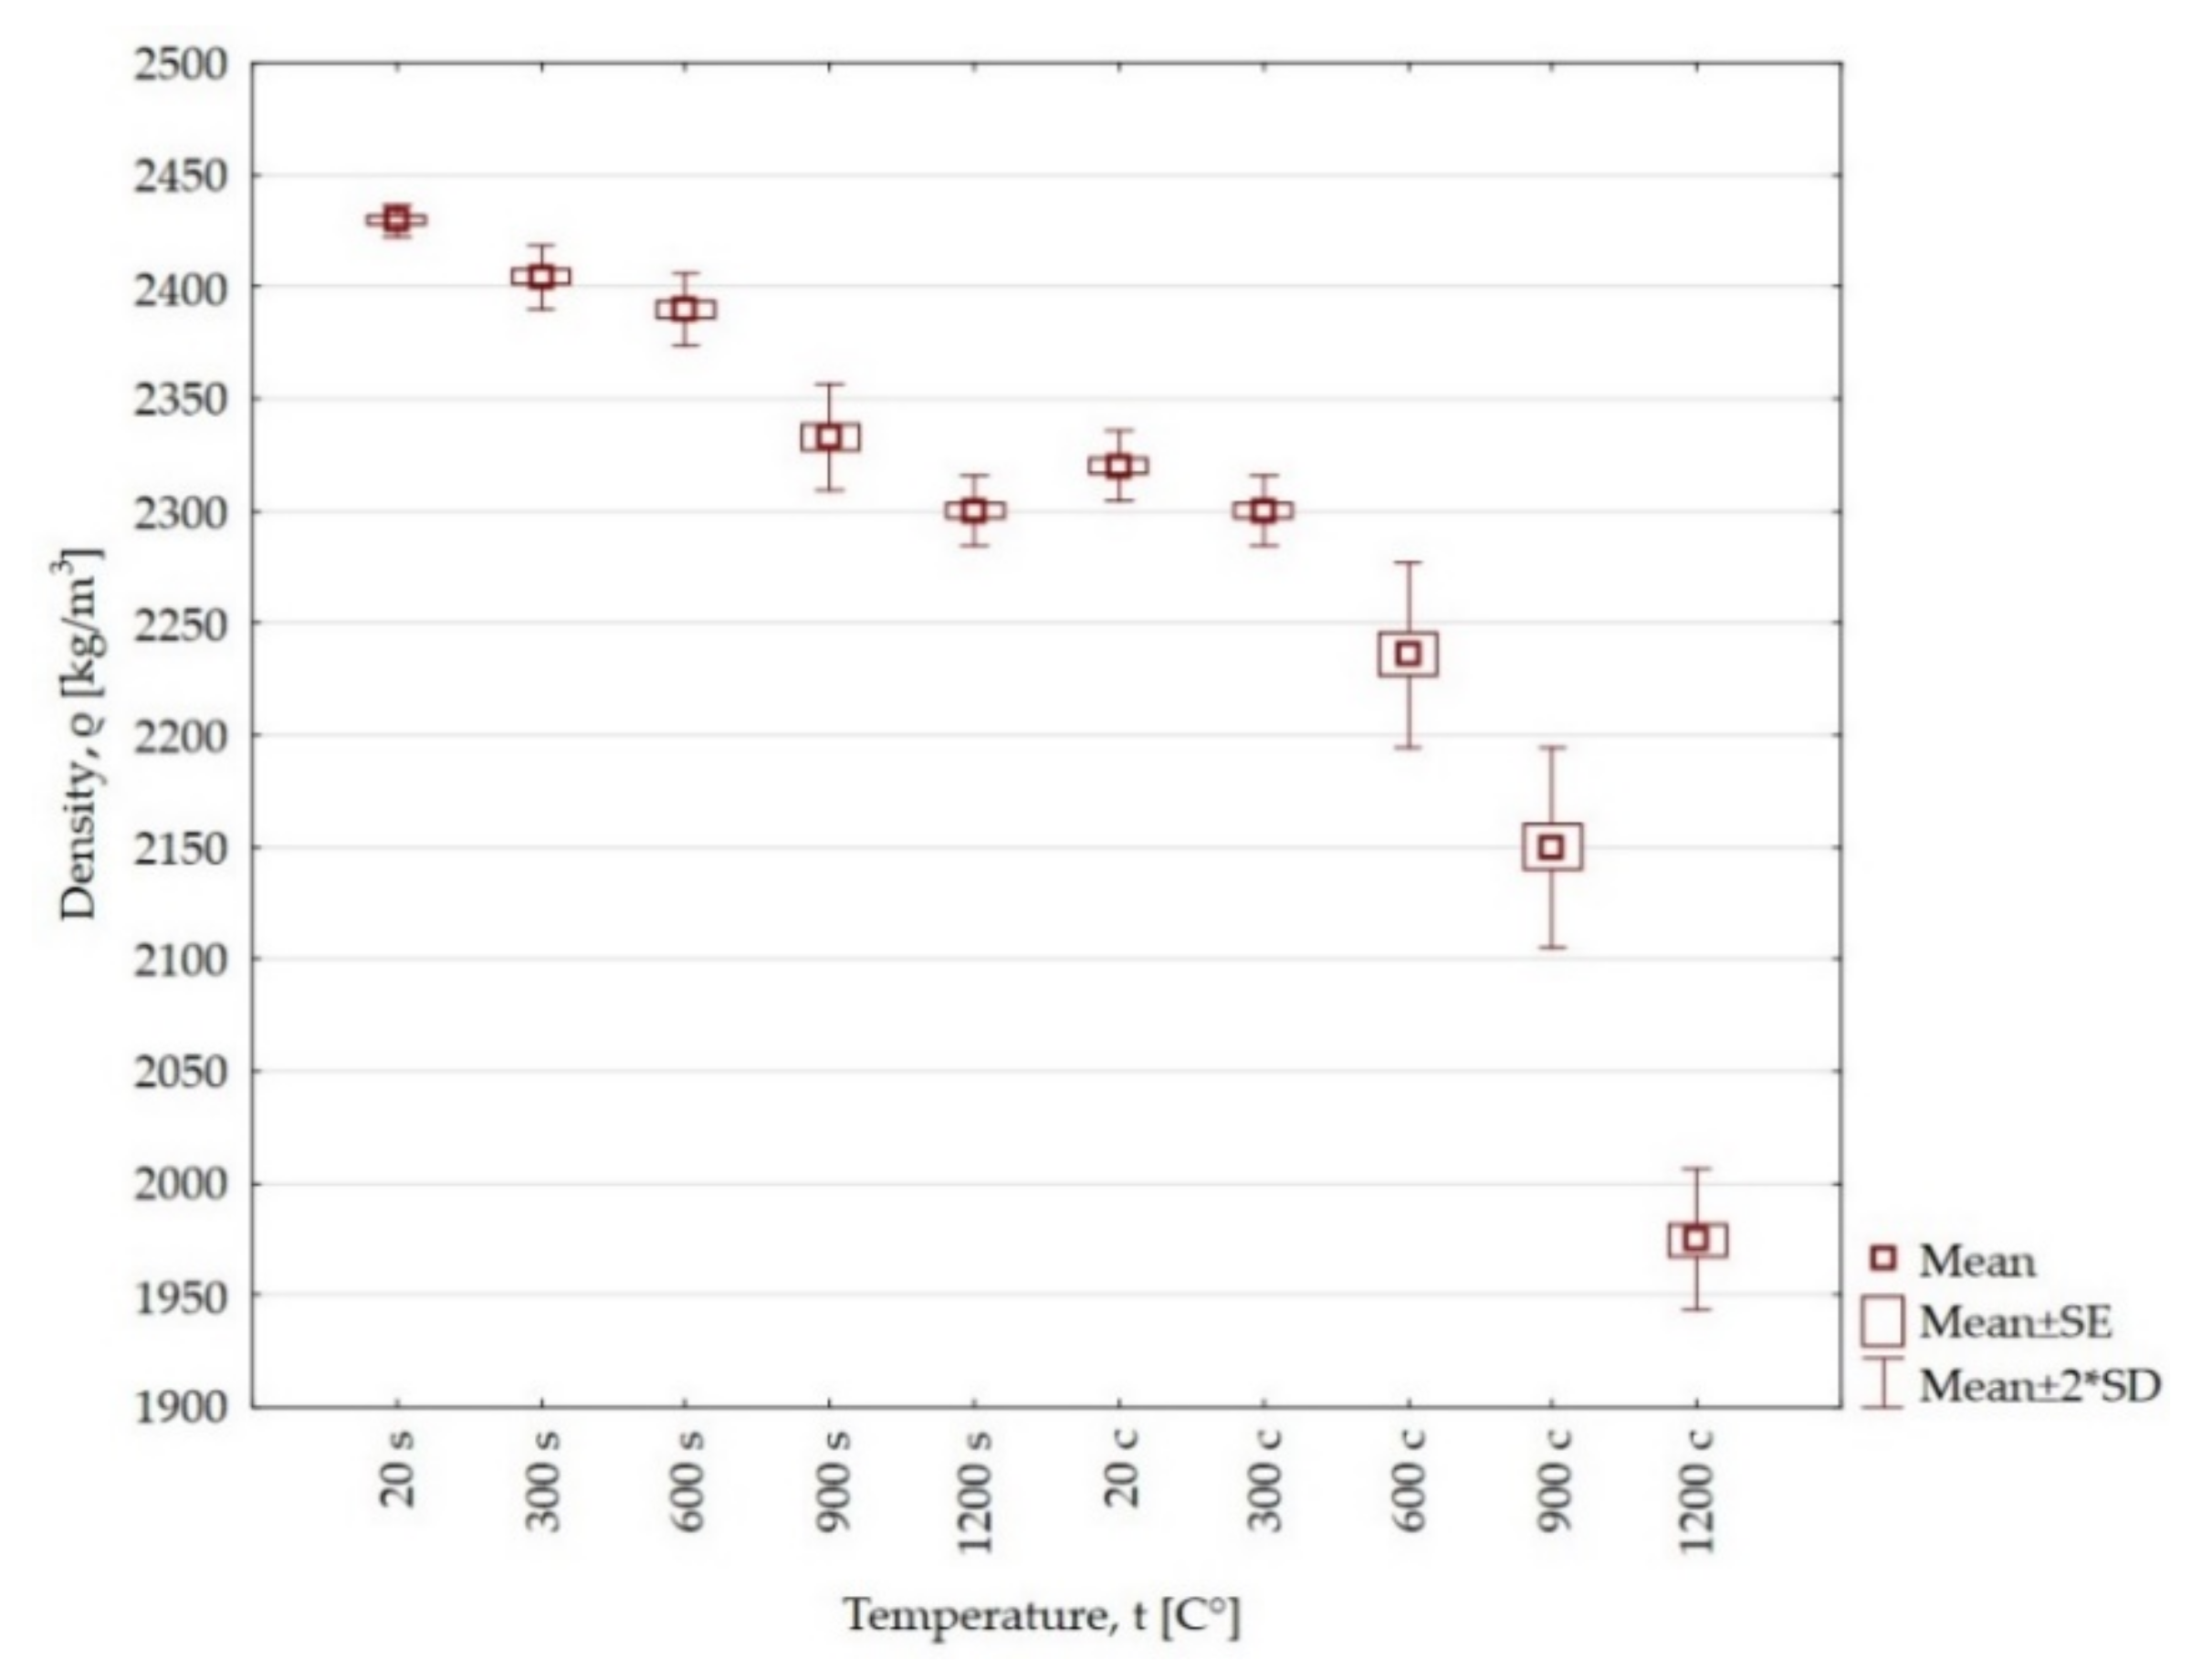
- Within the temperature range of 300 °C, 600 °C, 900 °C, 1200 °C, the density decreases by 0.86%, 3.62%, 7.32% and 14.87%, respectively, for claystone rocks, and 1.03%, 1.62%, 3.97% and 5.33%, respectively, for sandstone compared to the initial value.
- Based on numerical research, it can be concluded that:
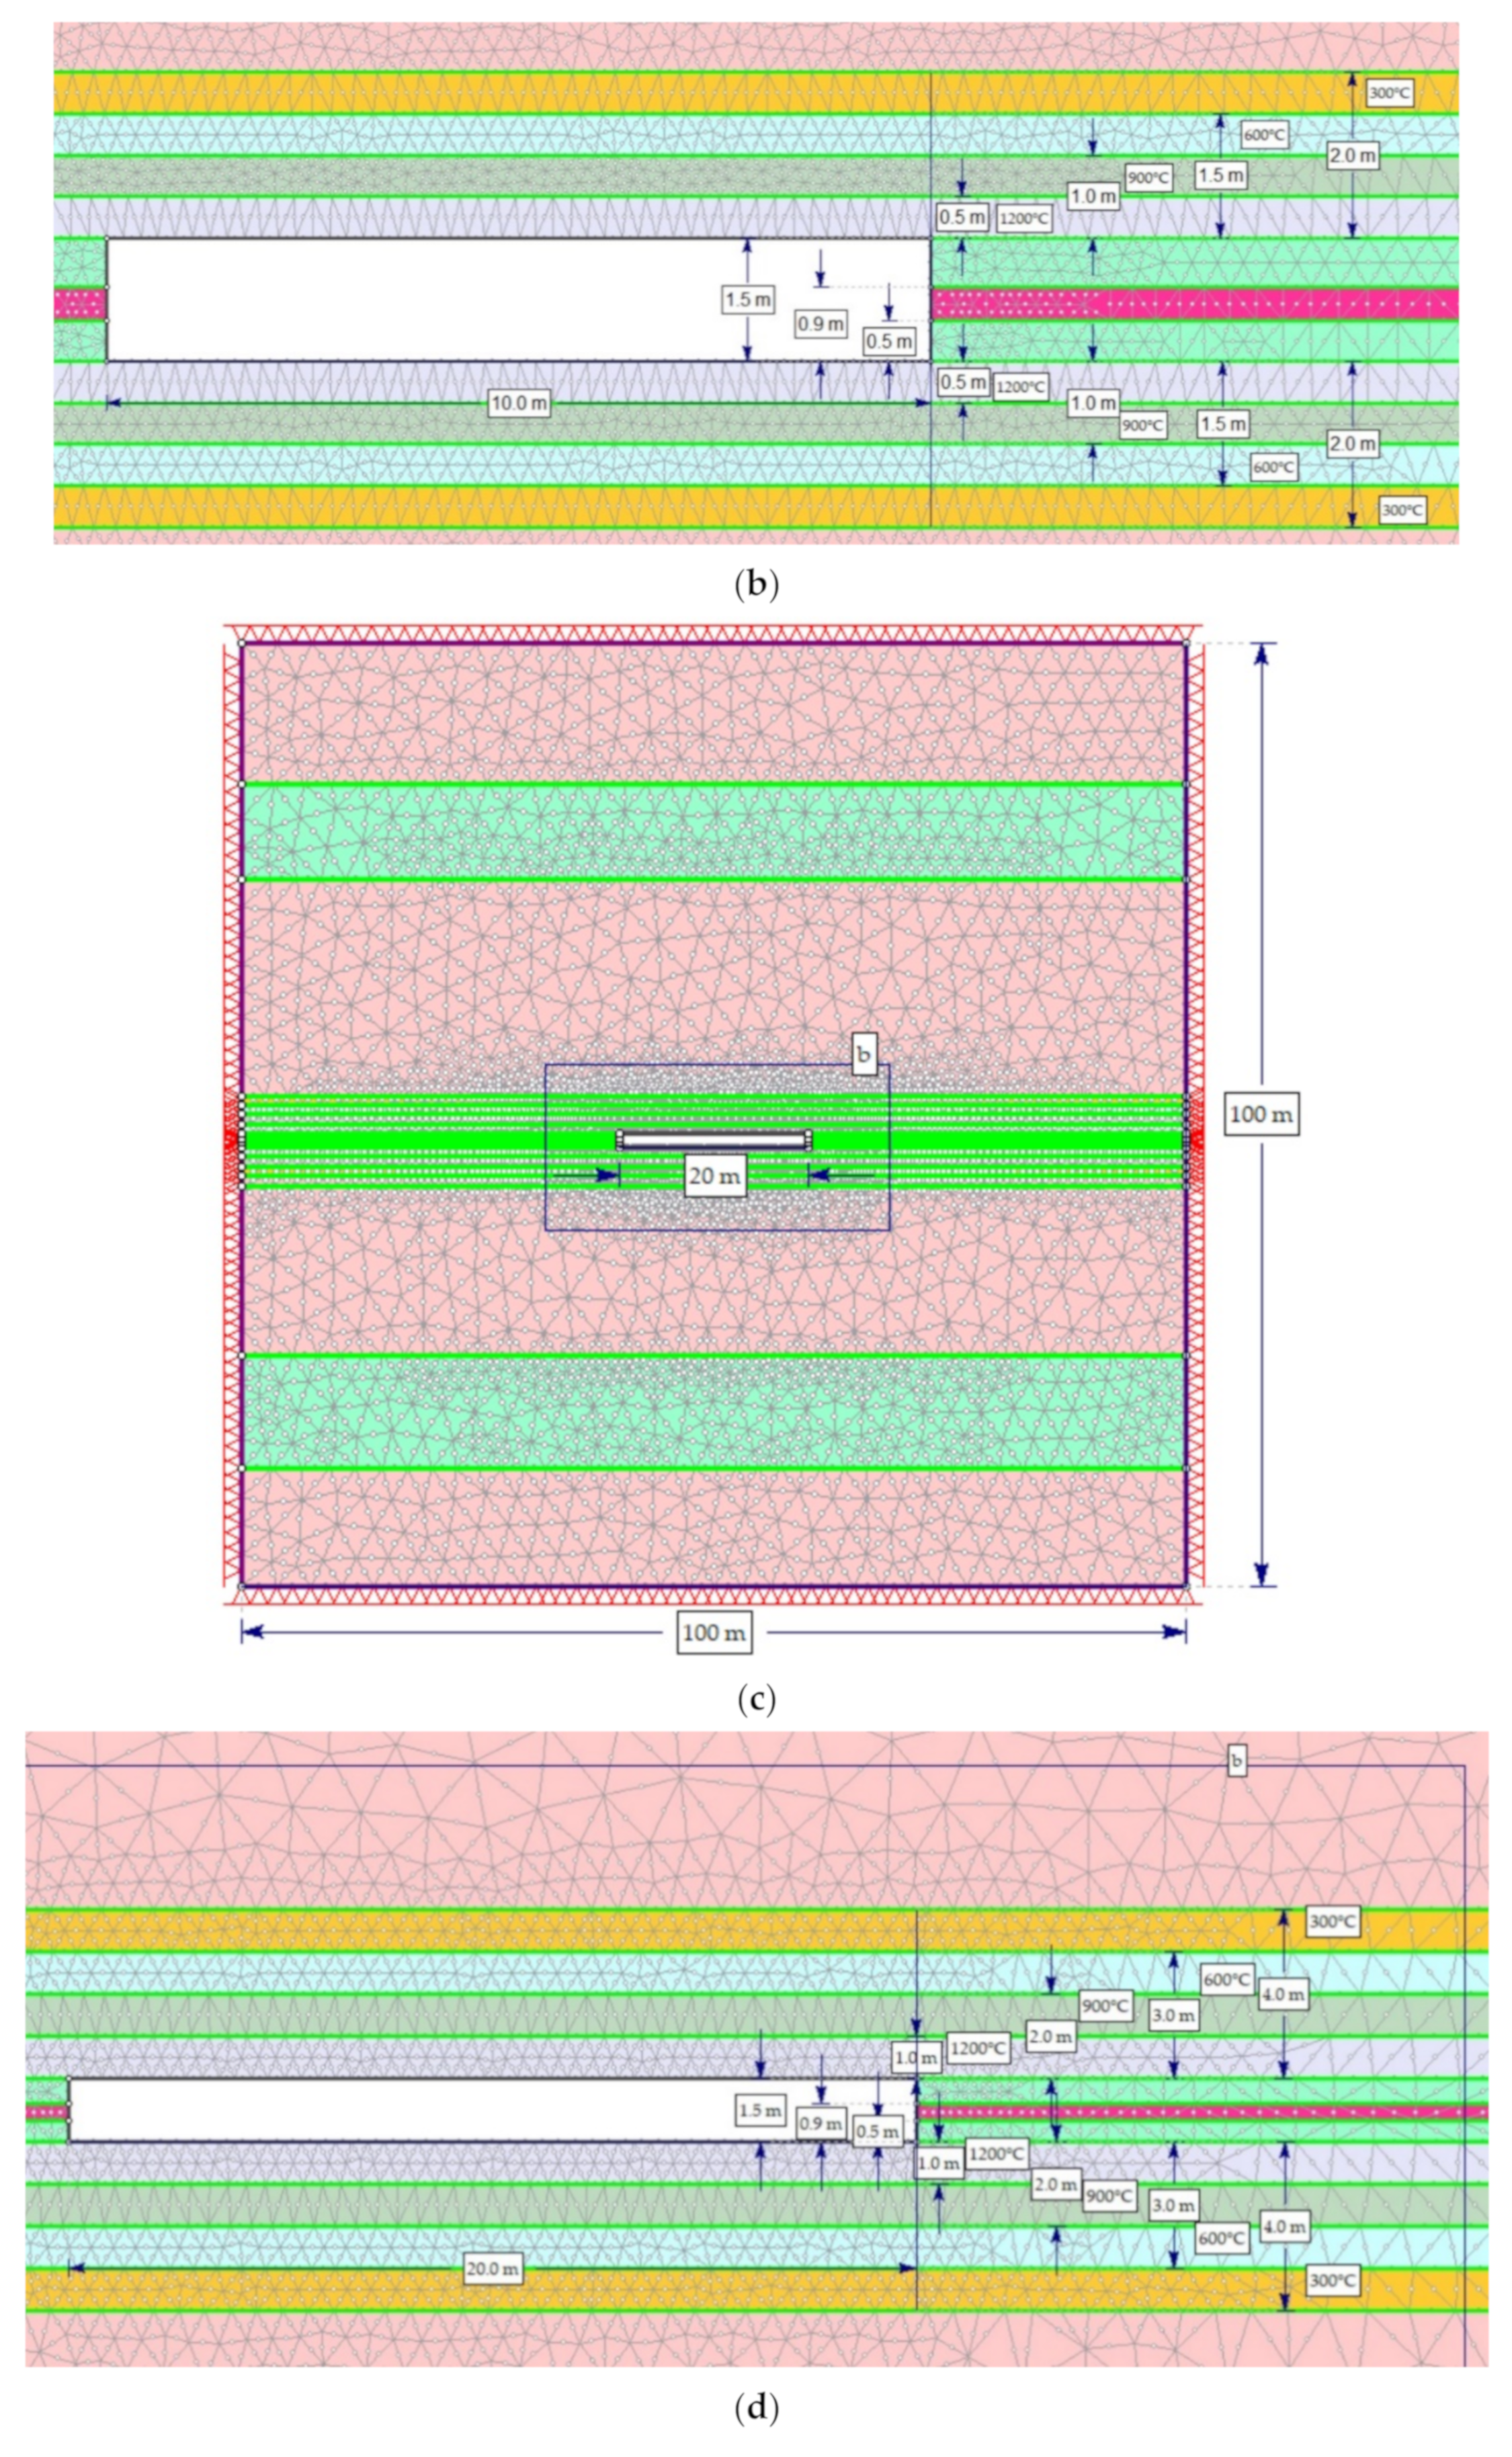
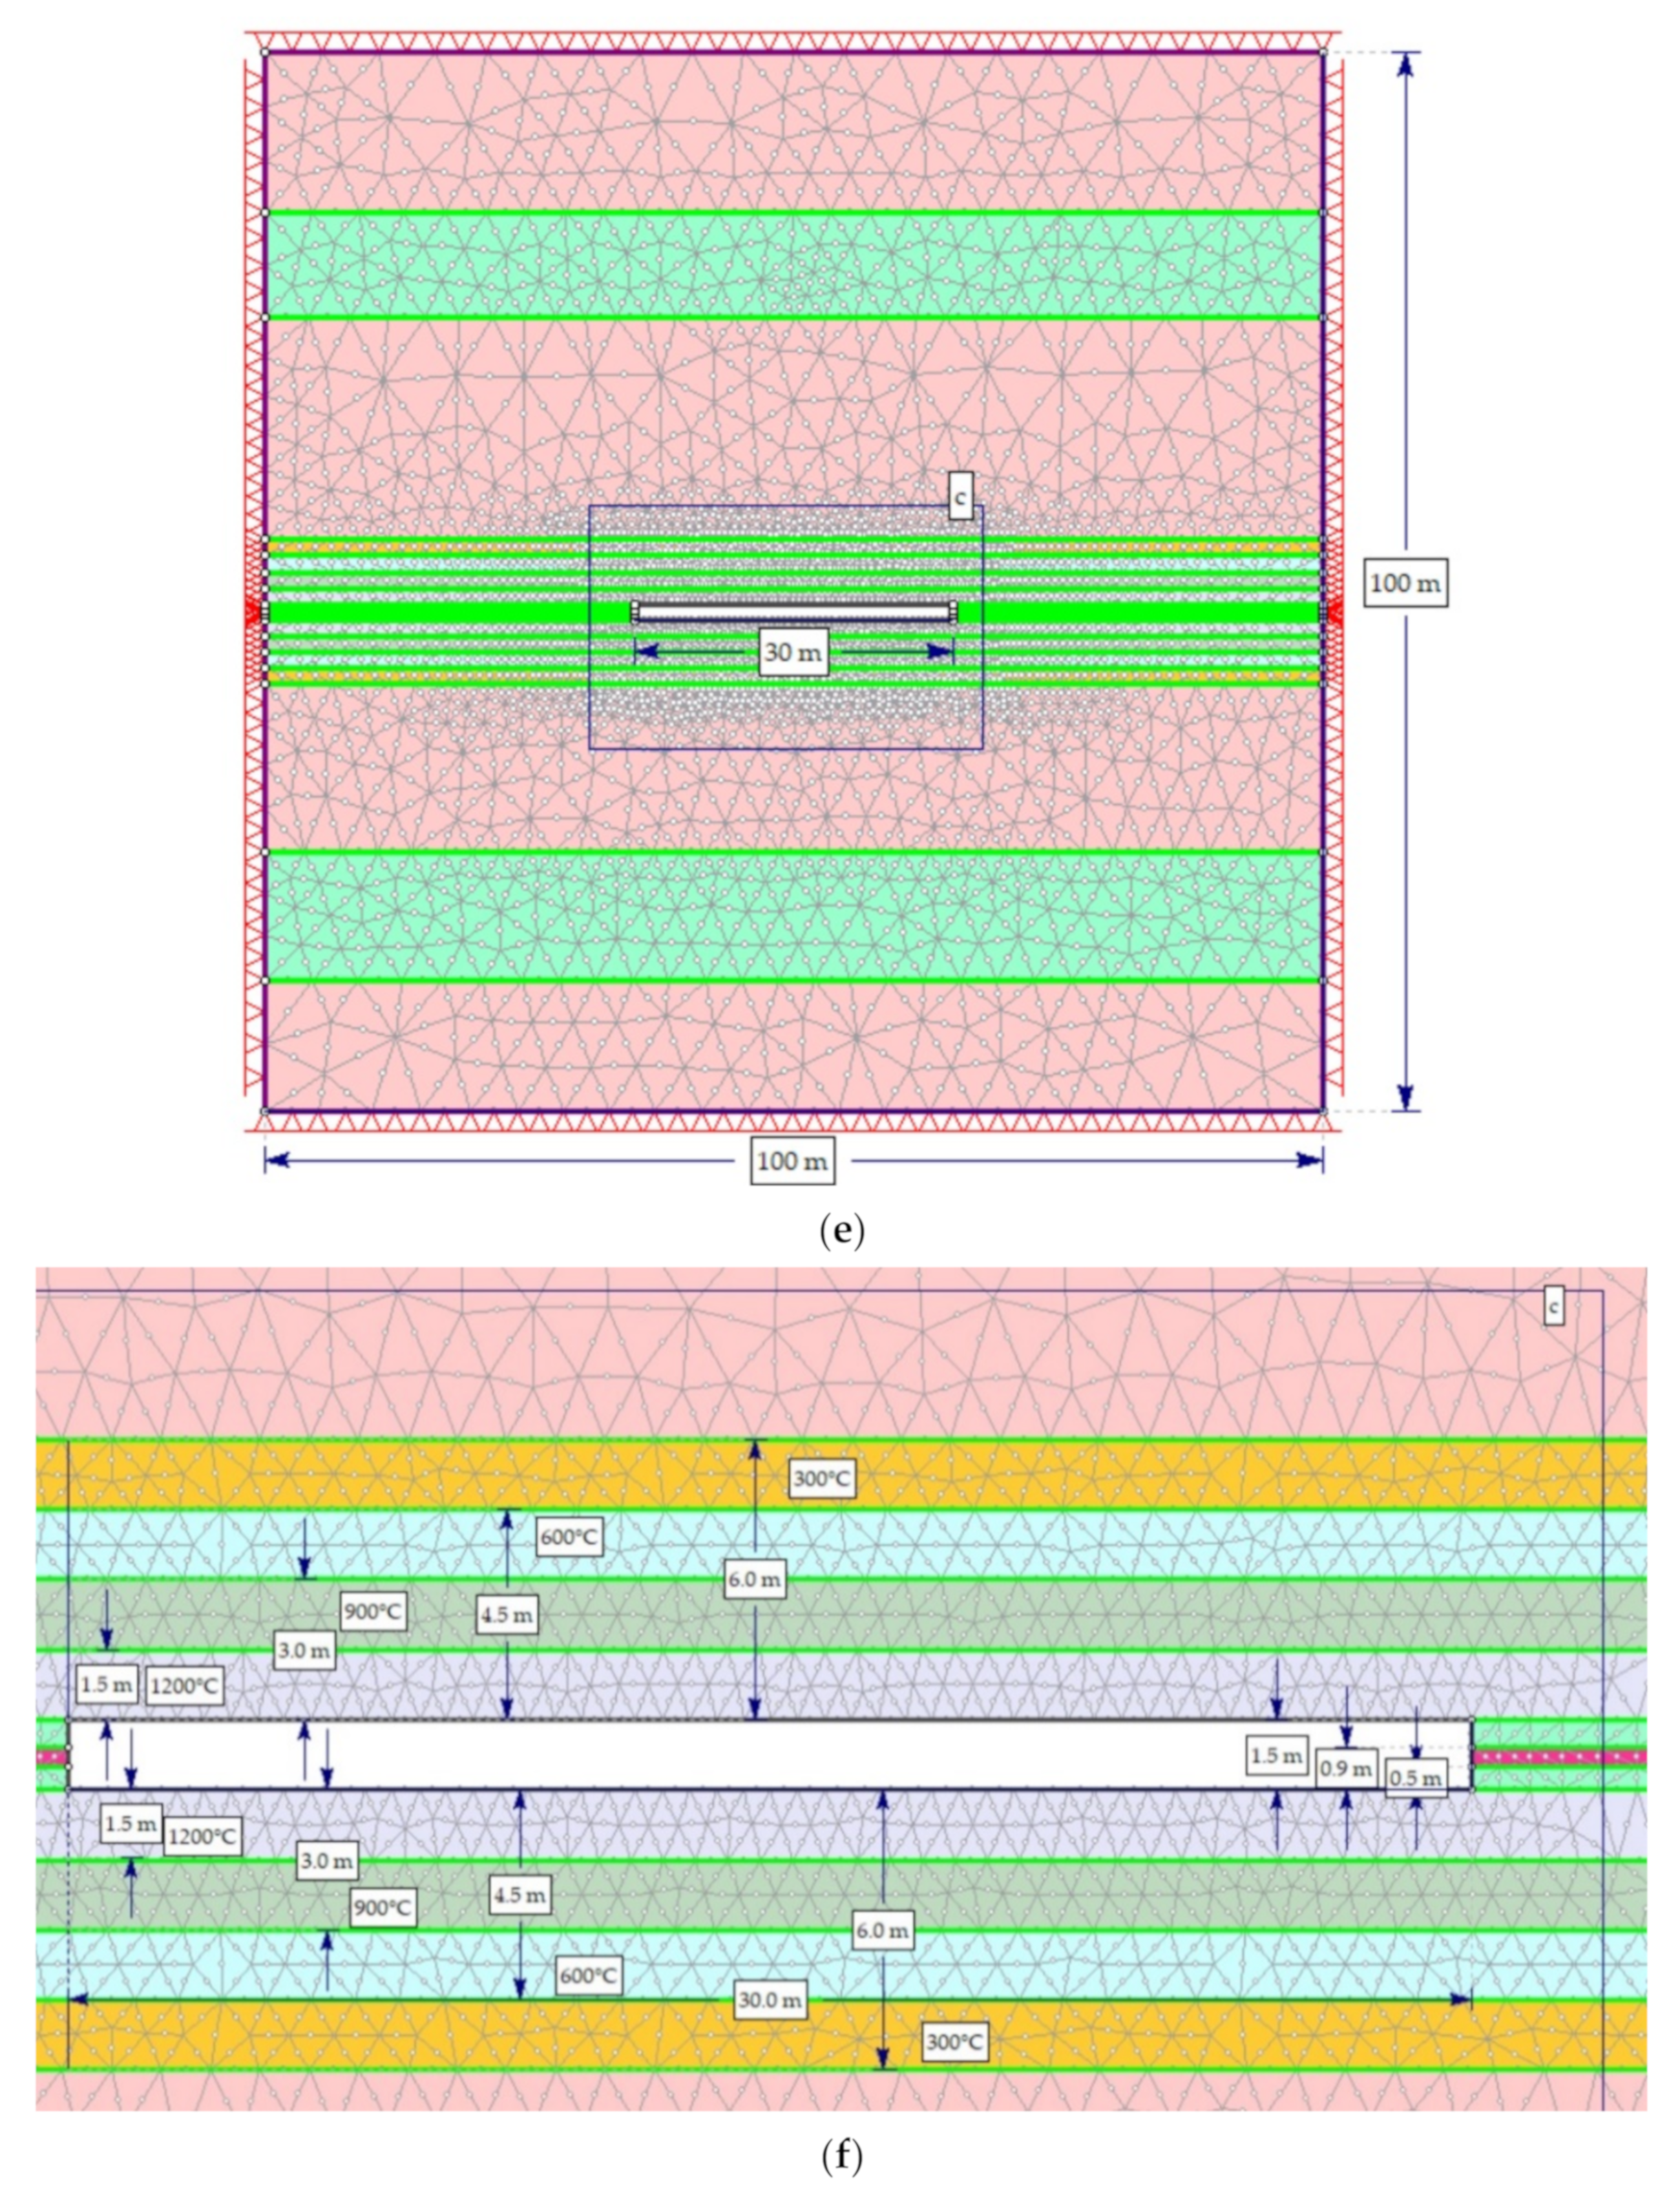
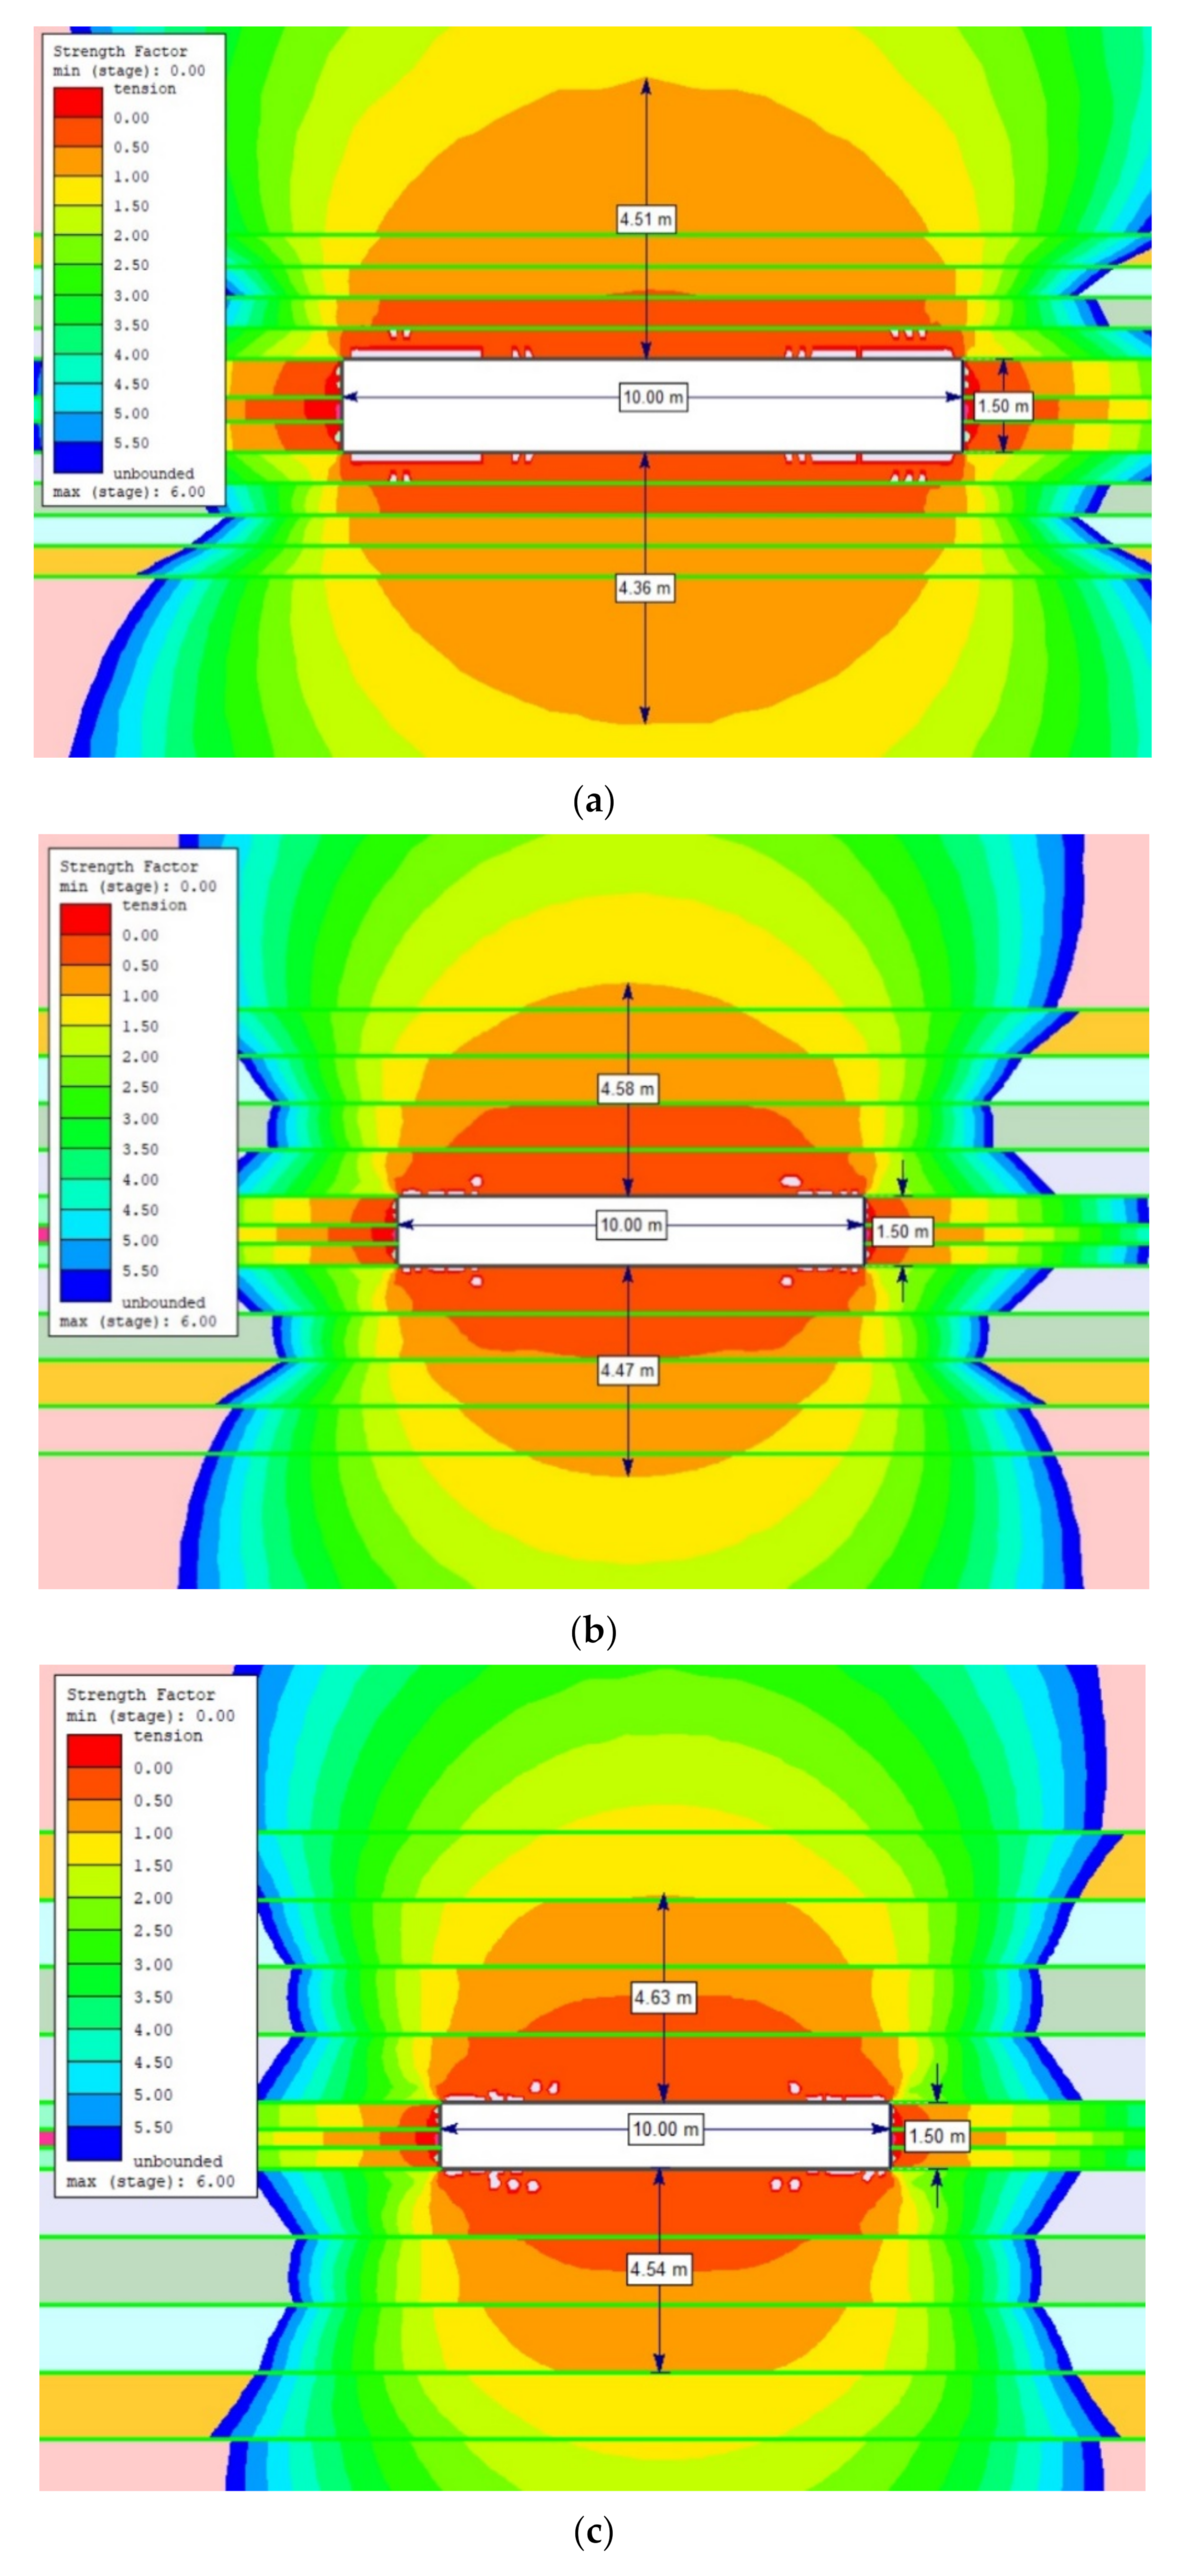
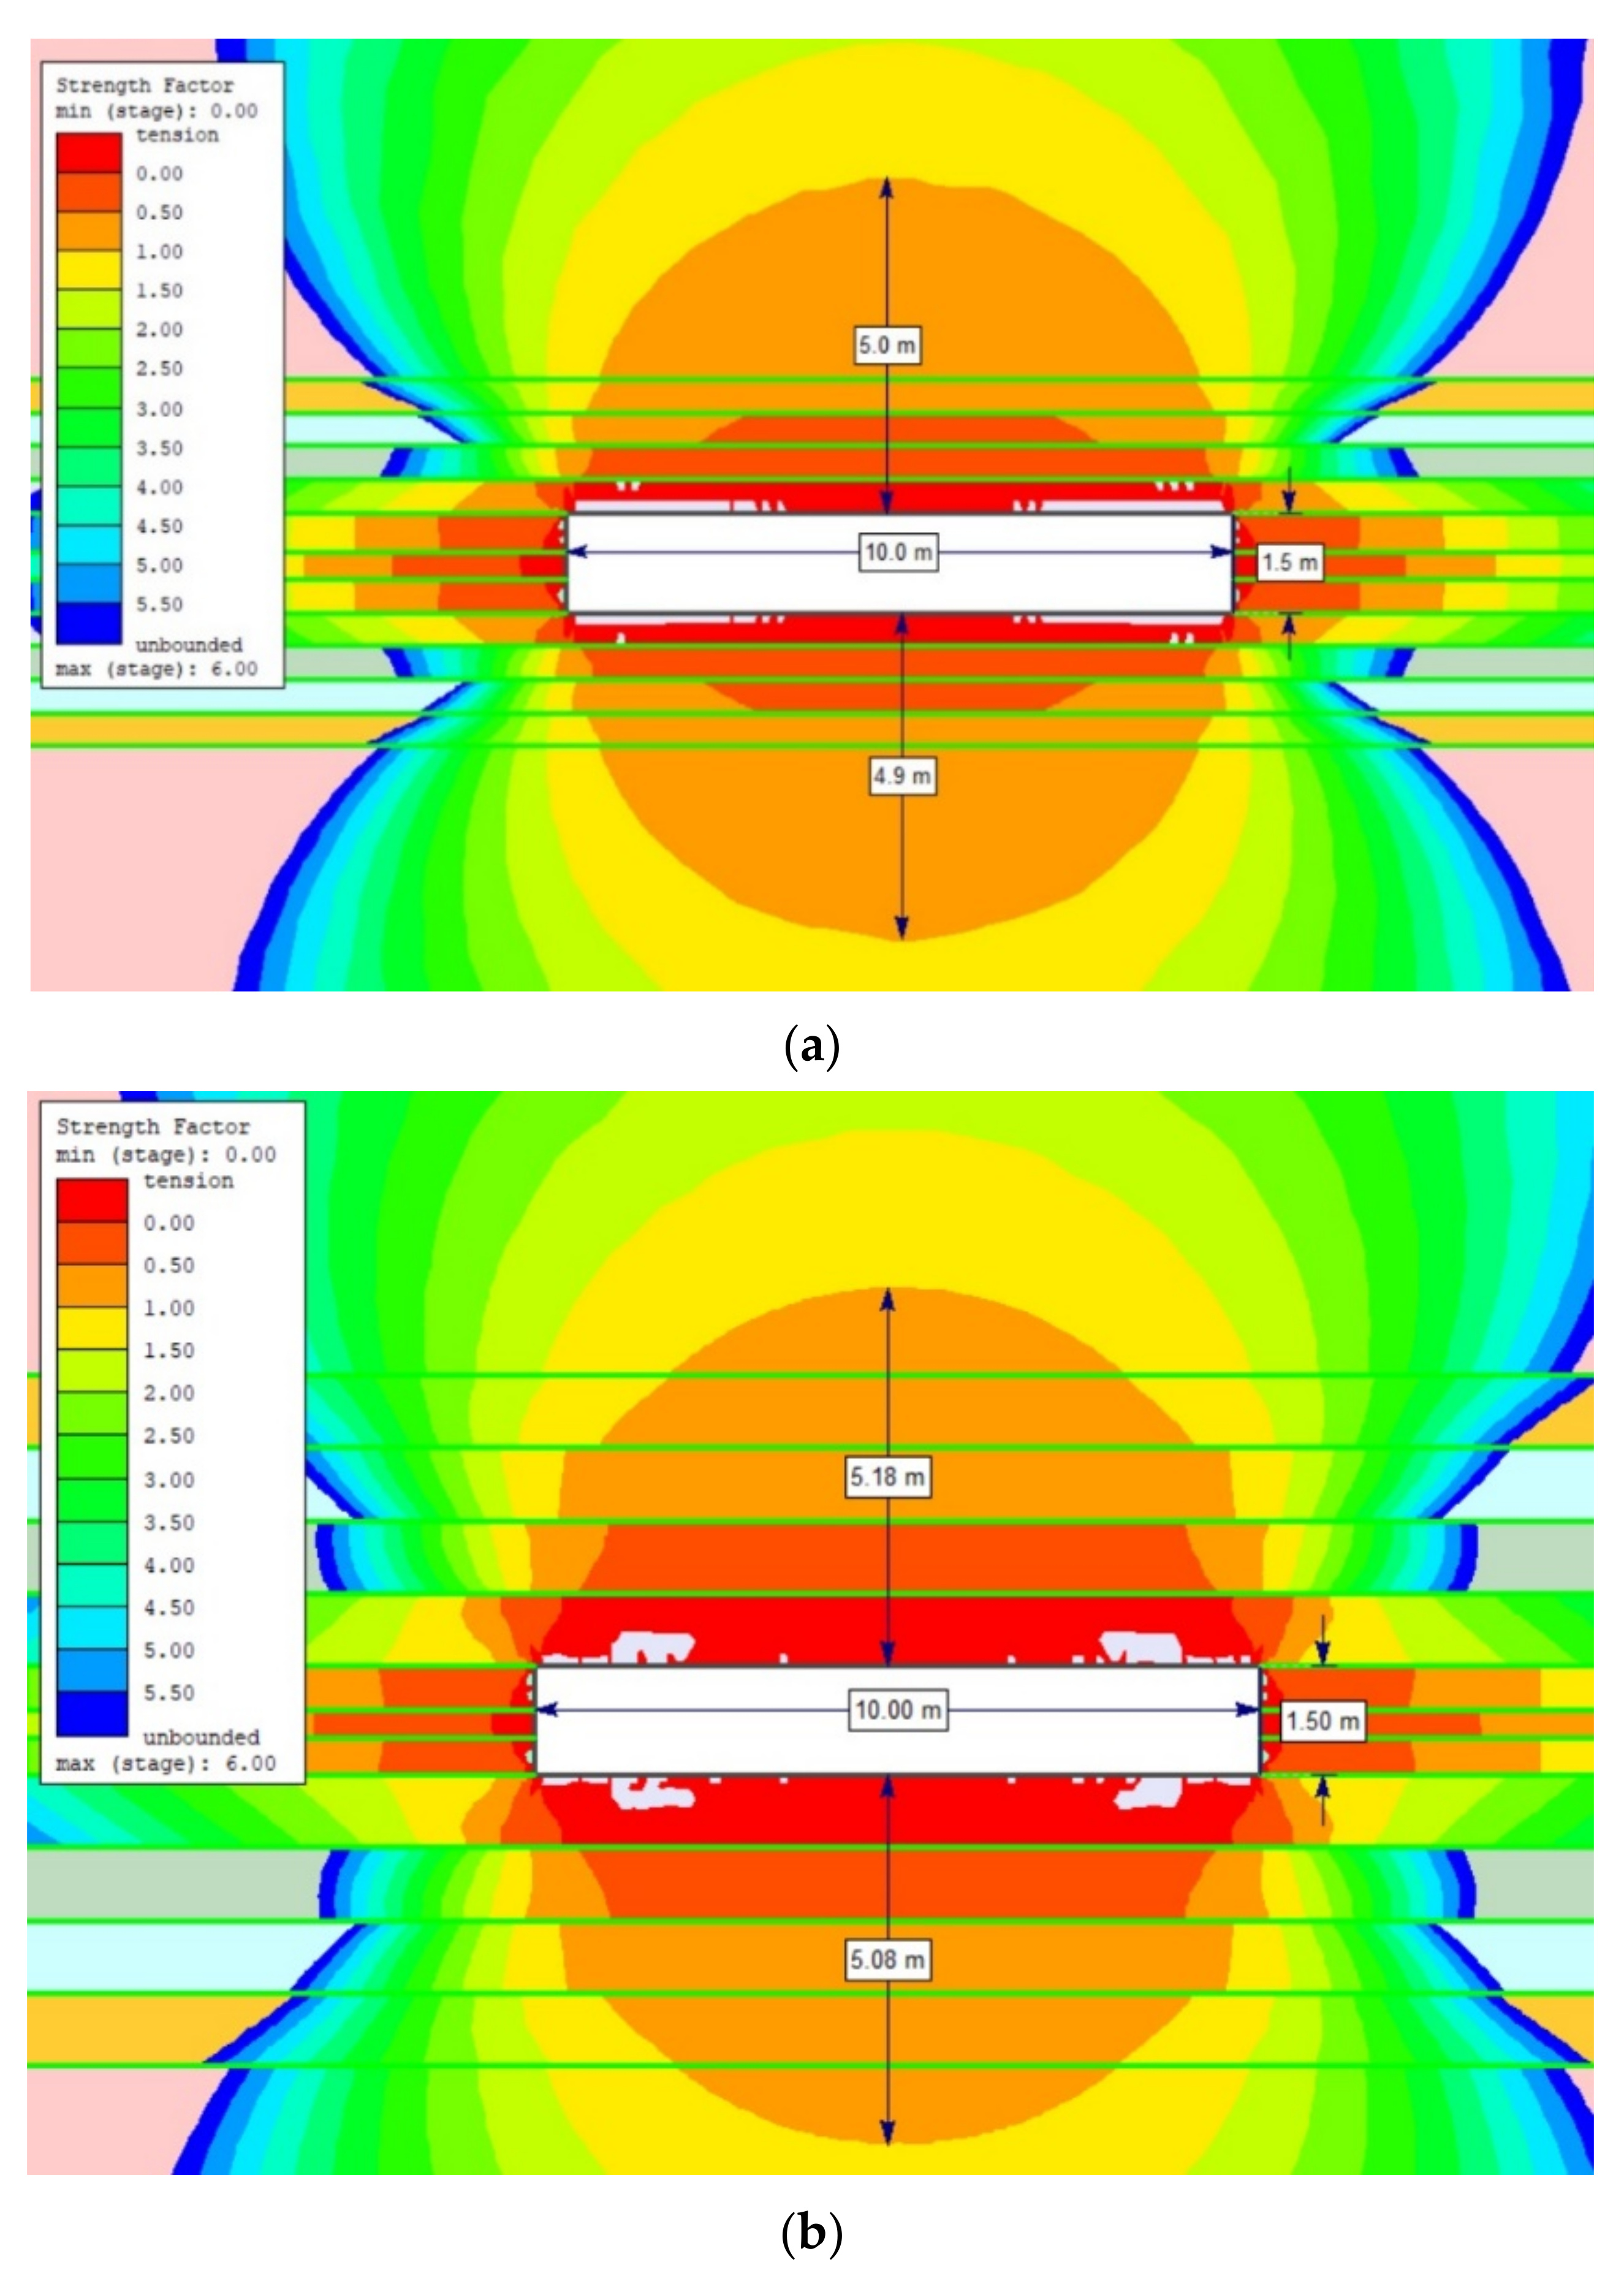
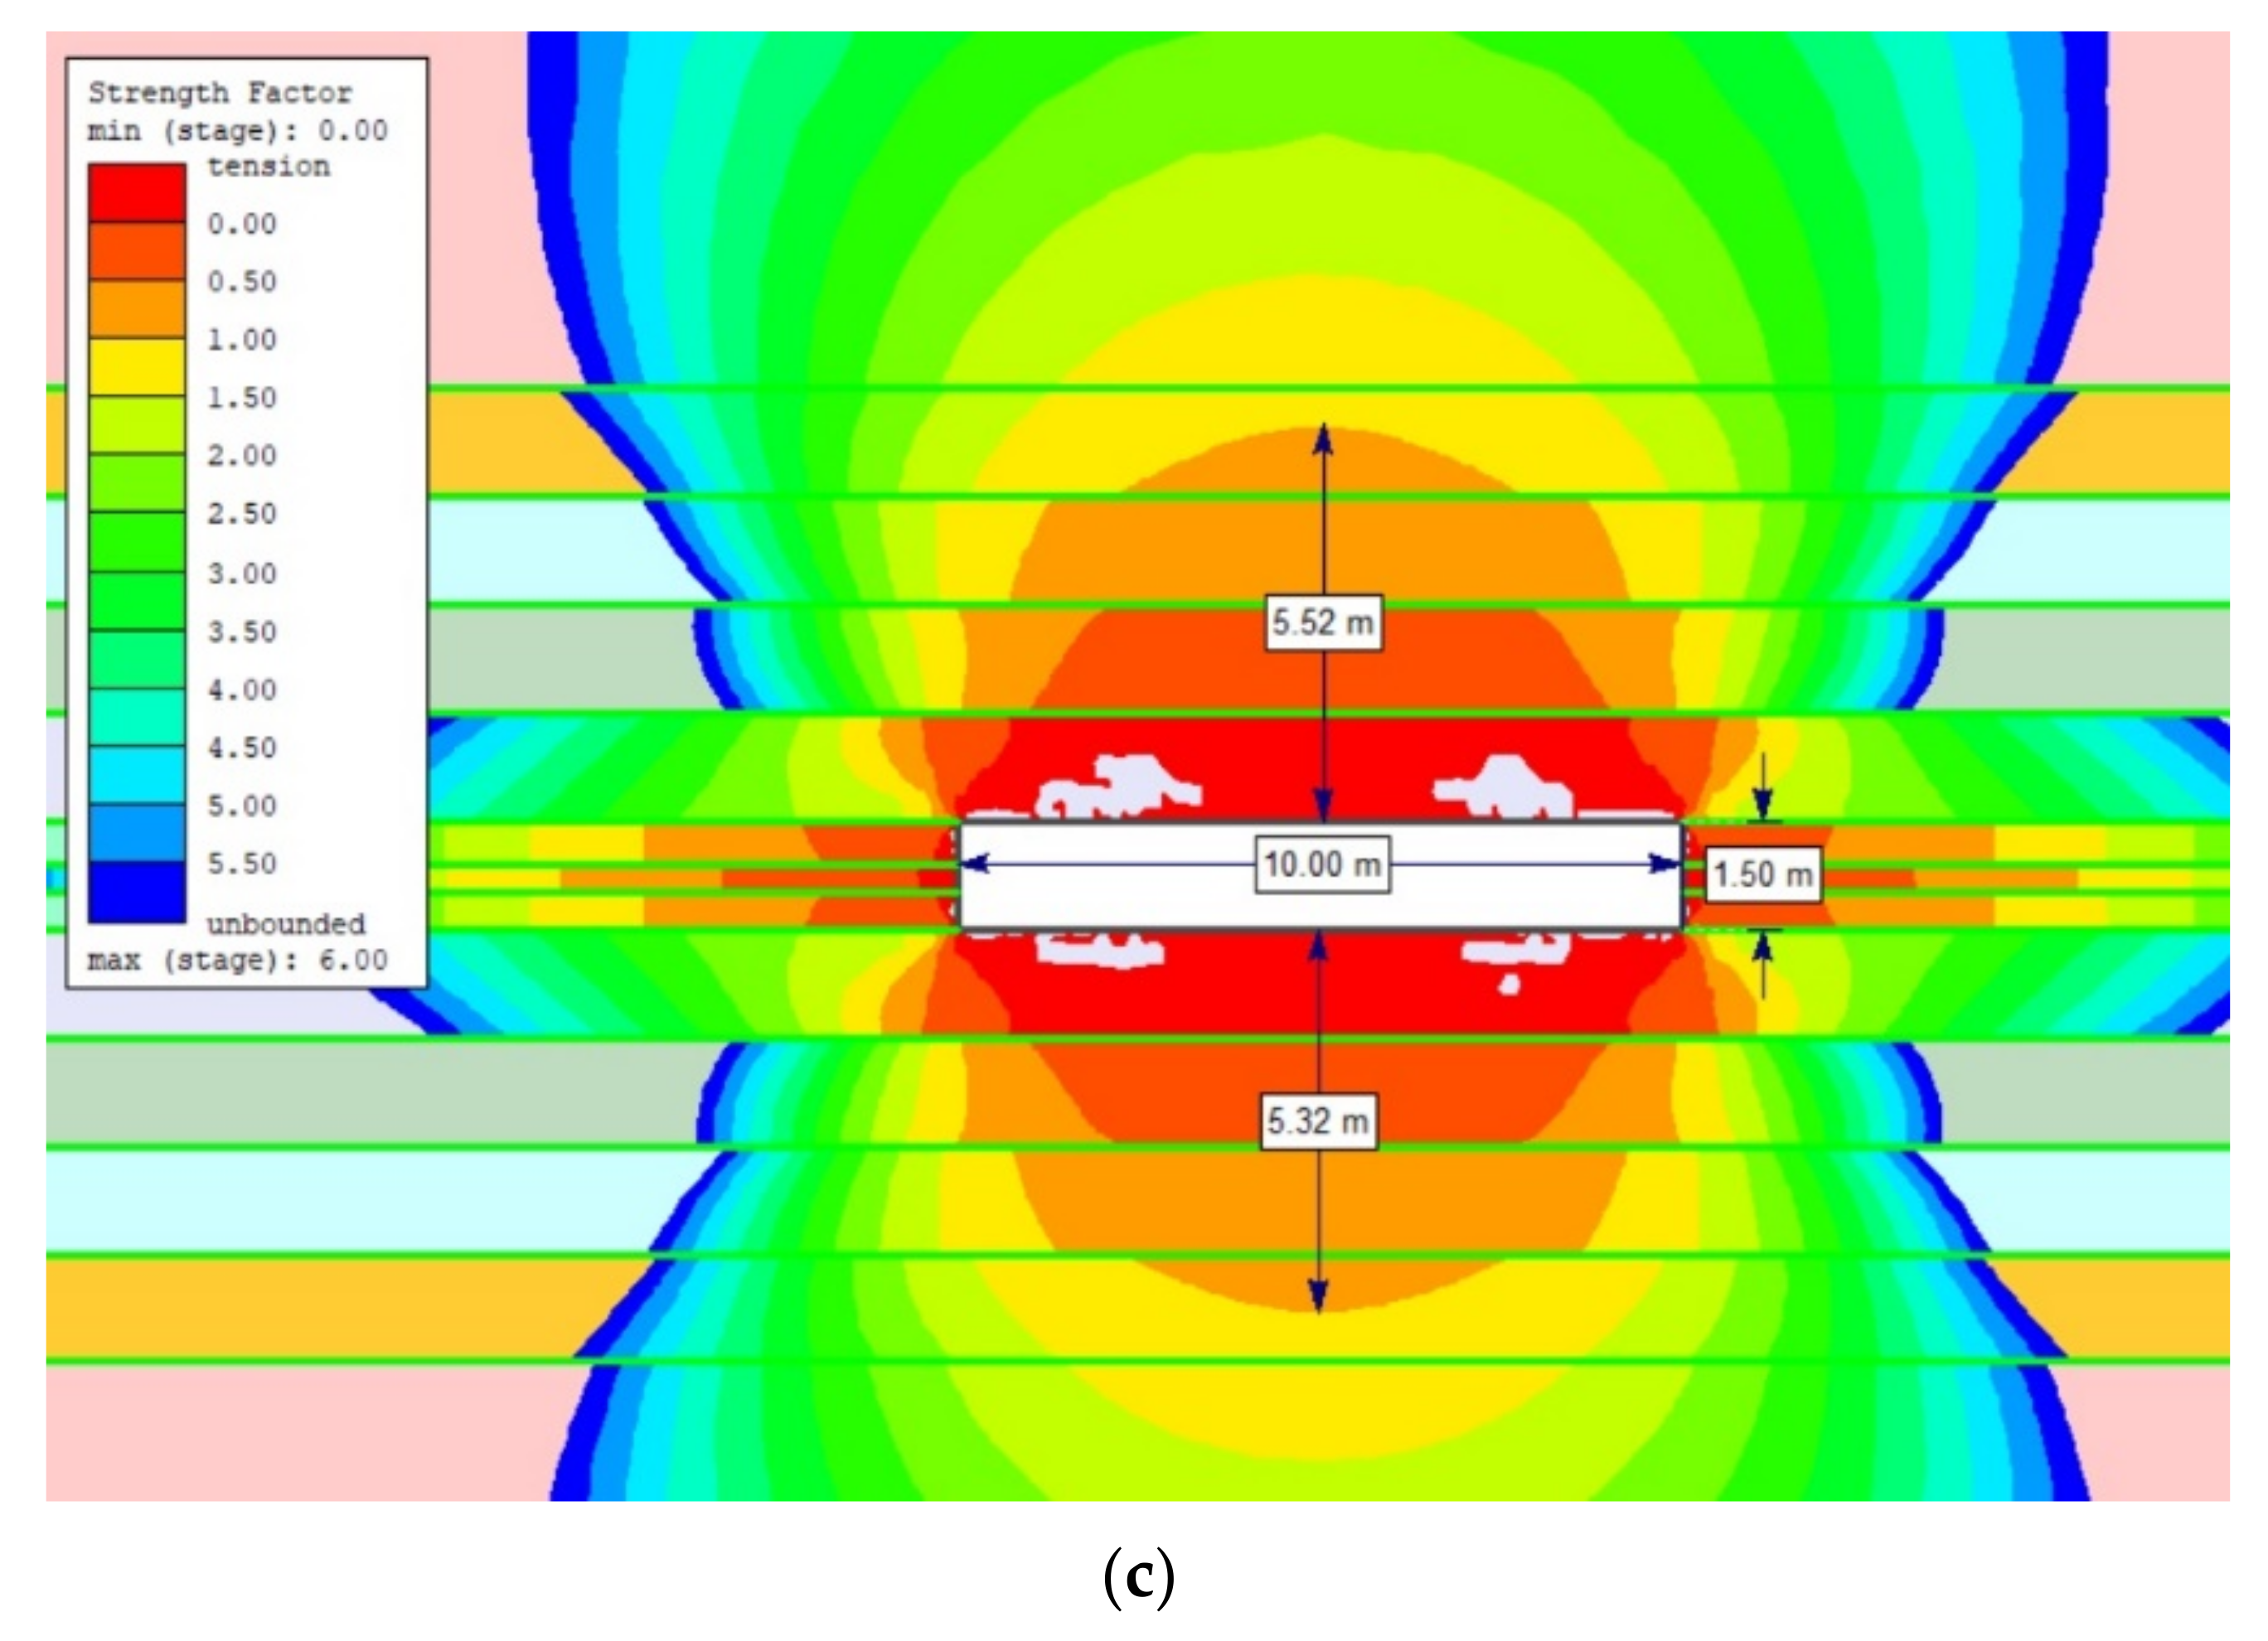
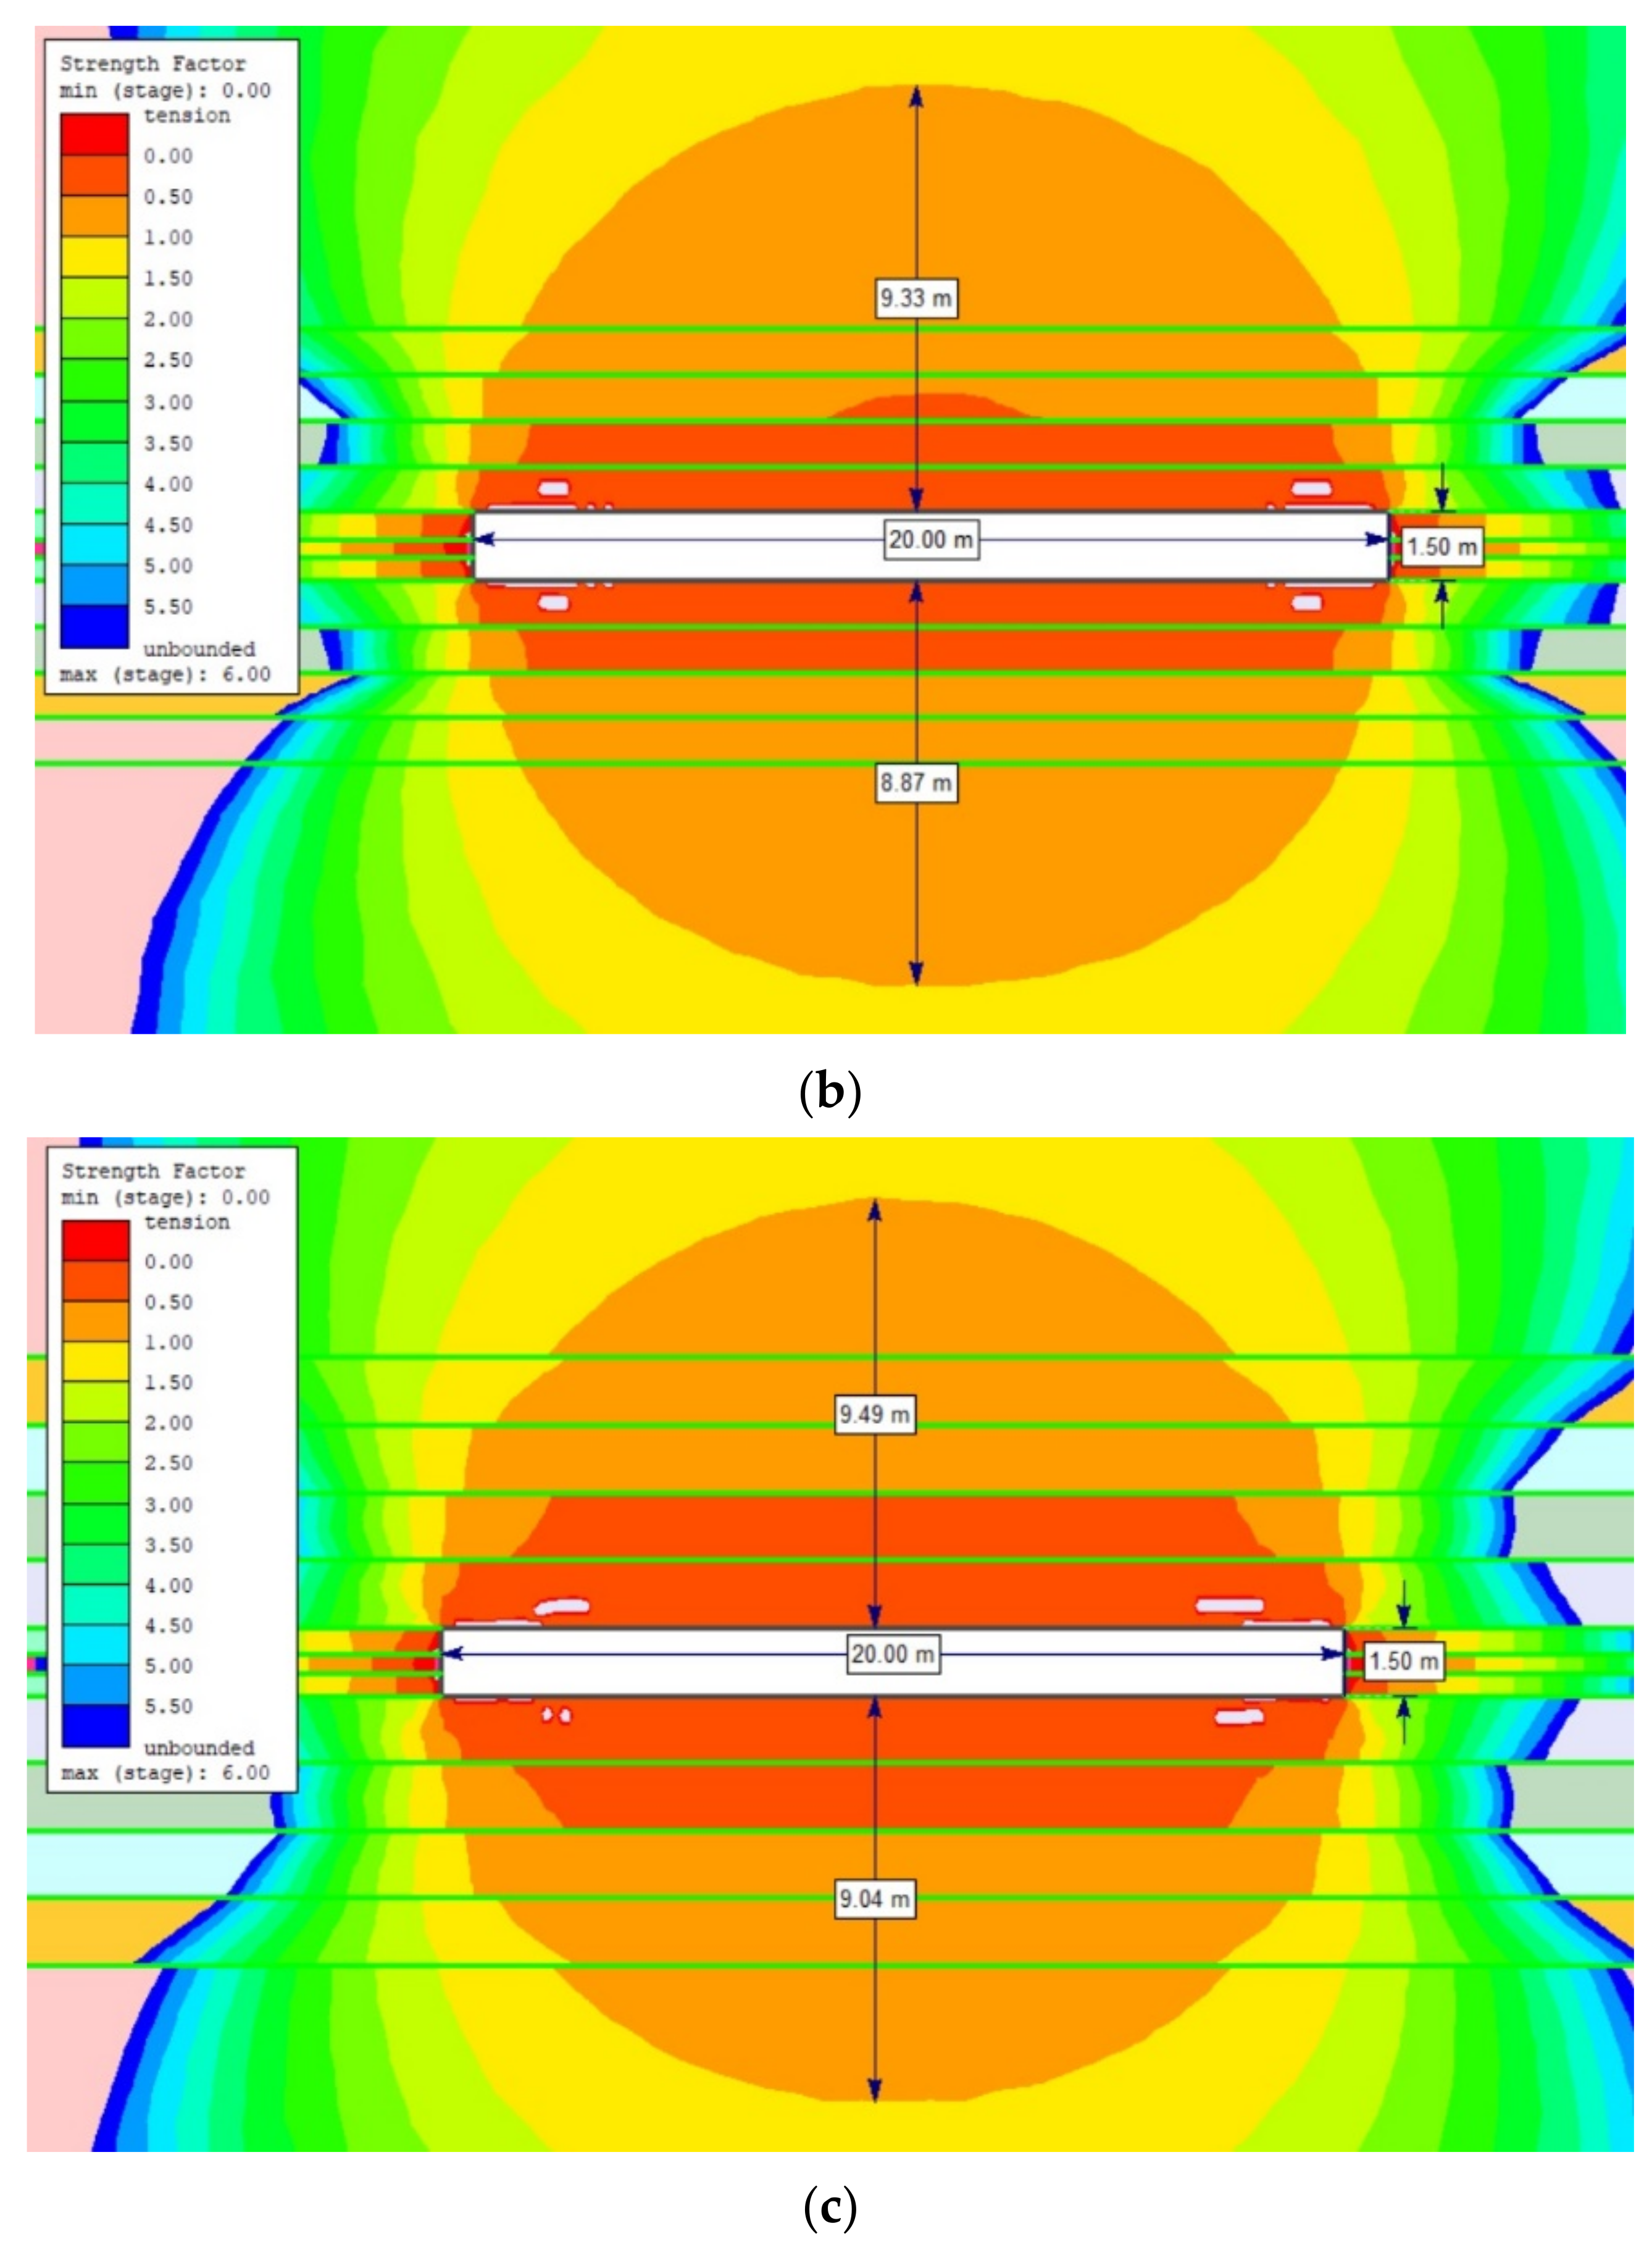
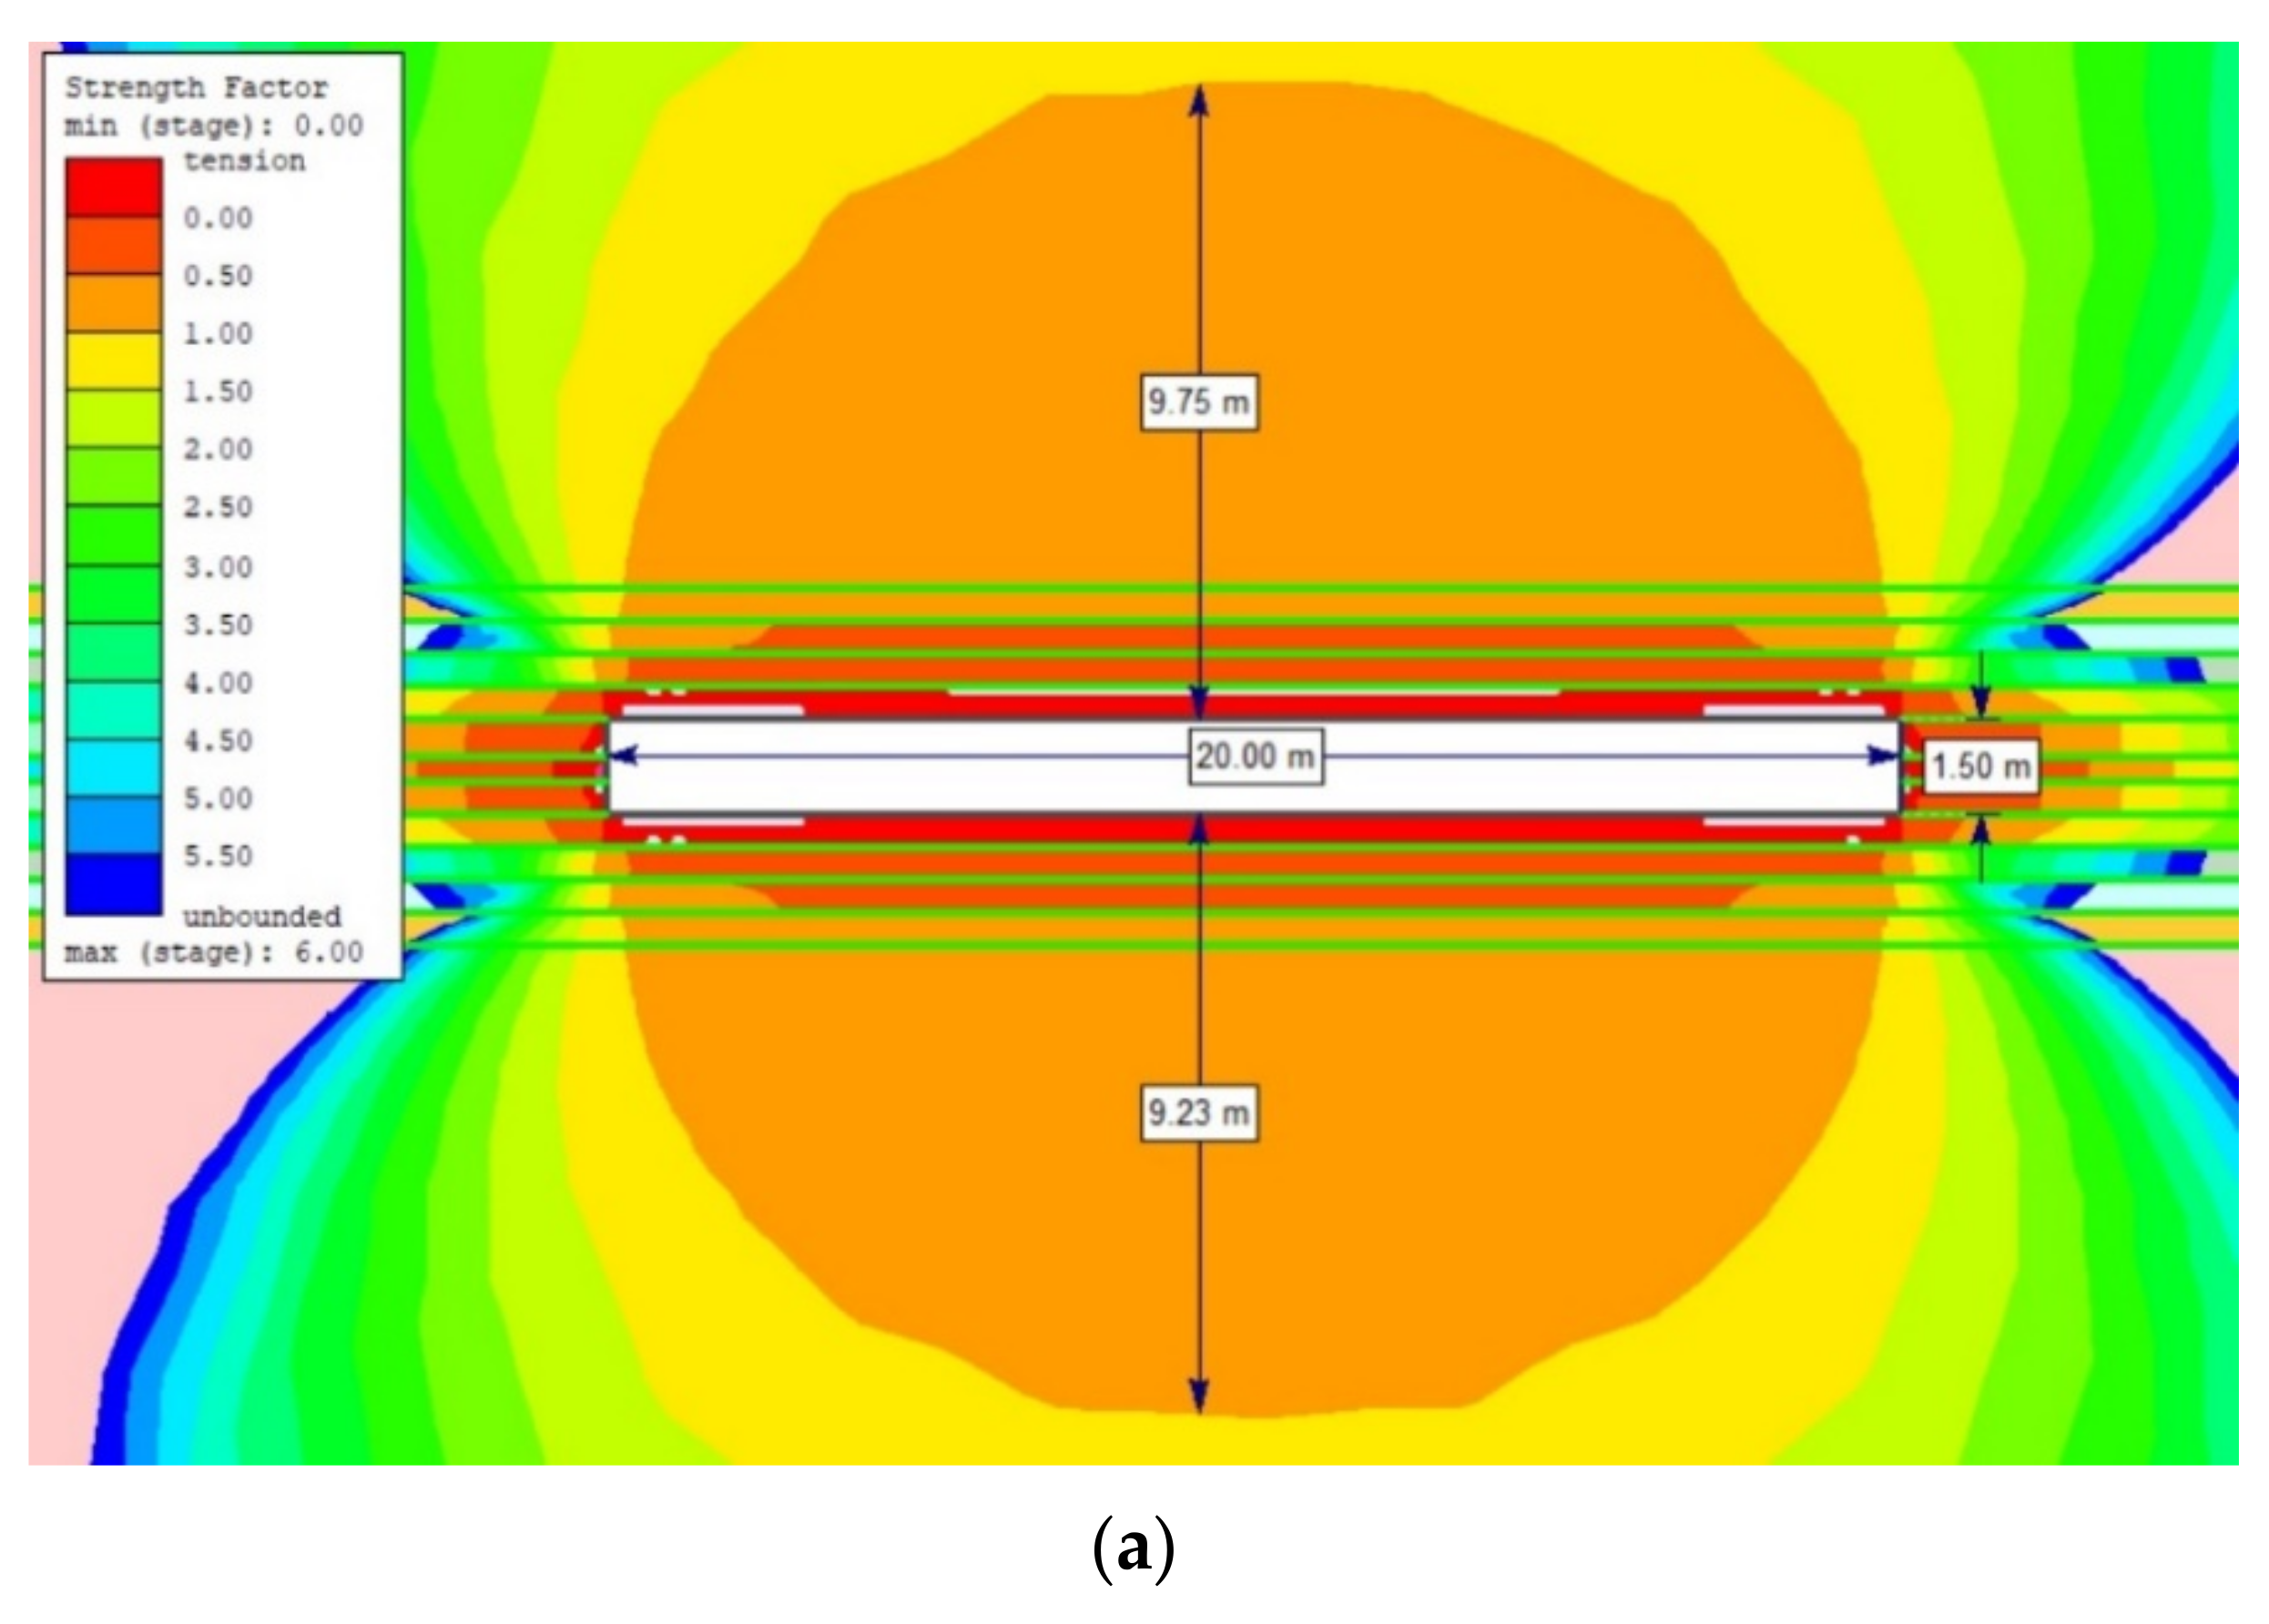
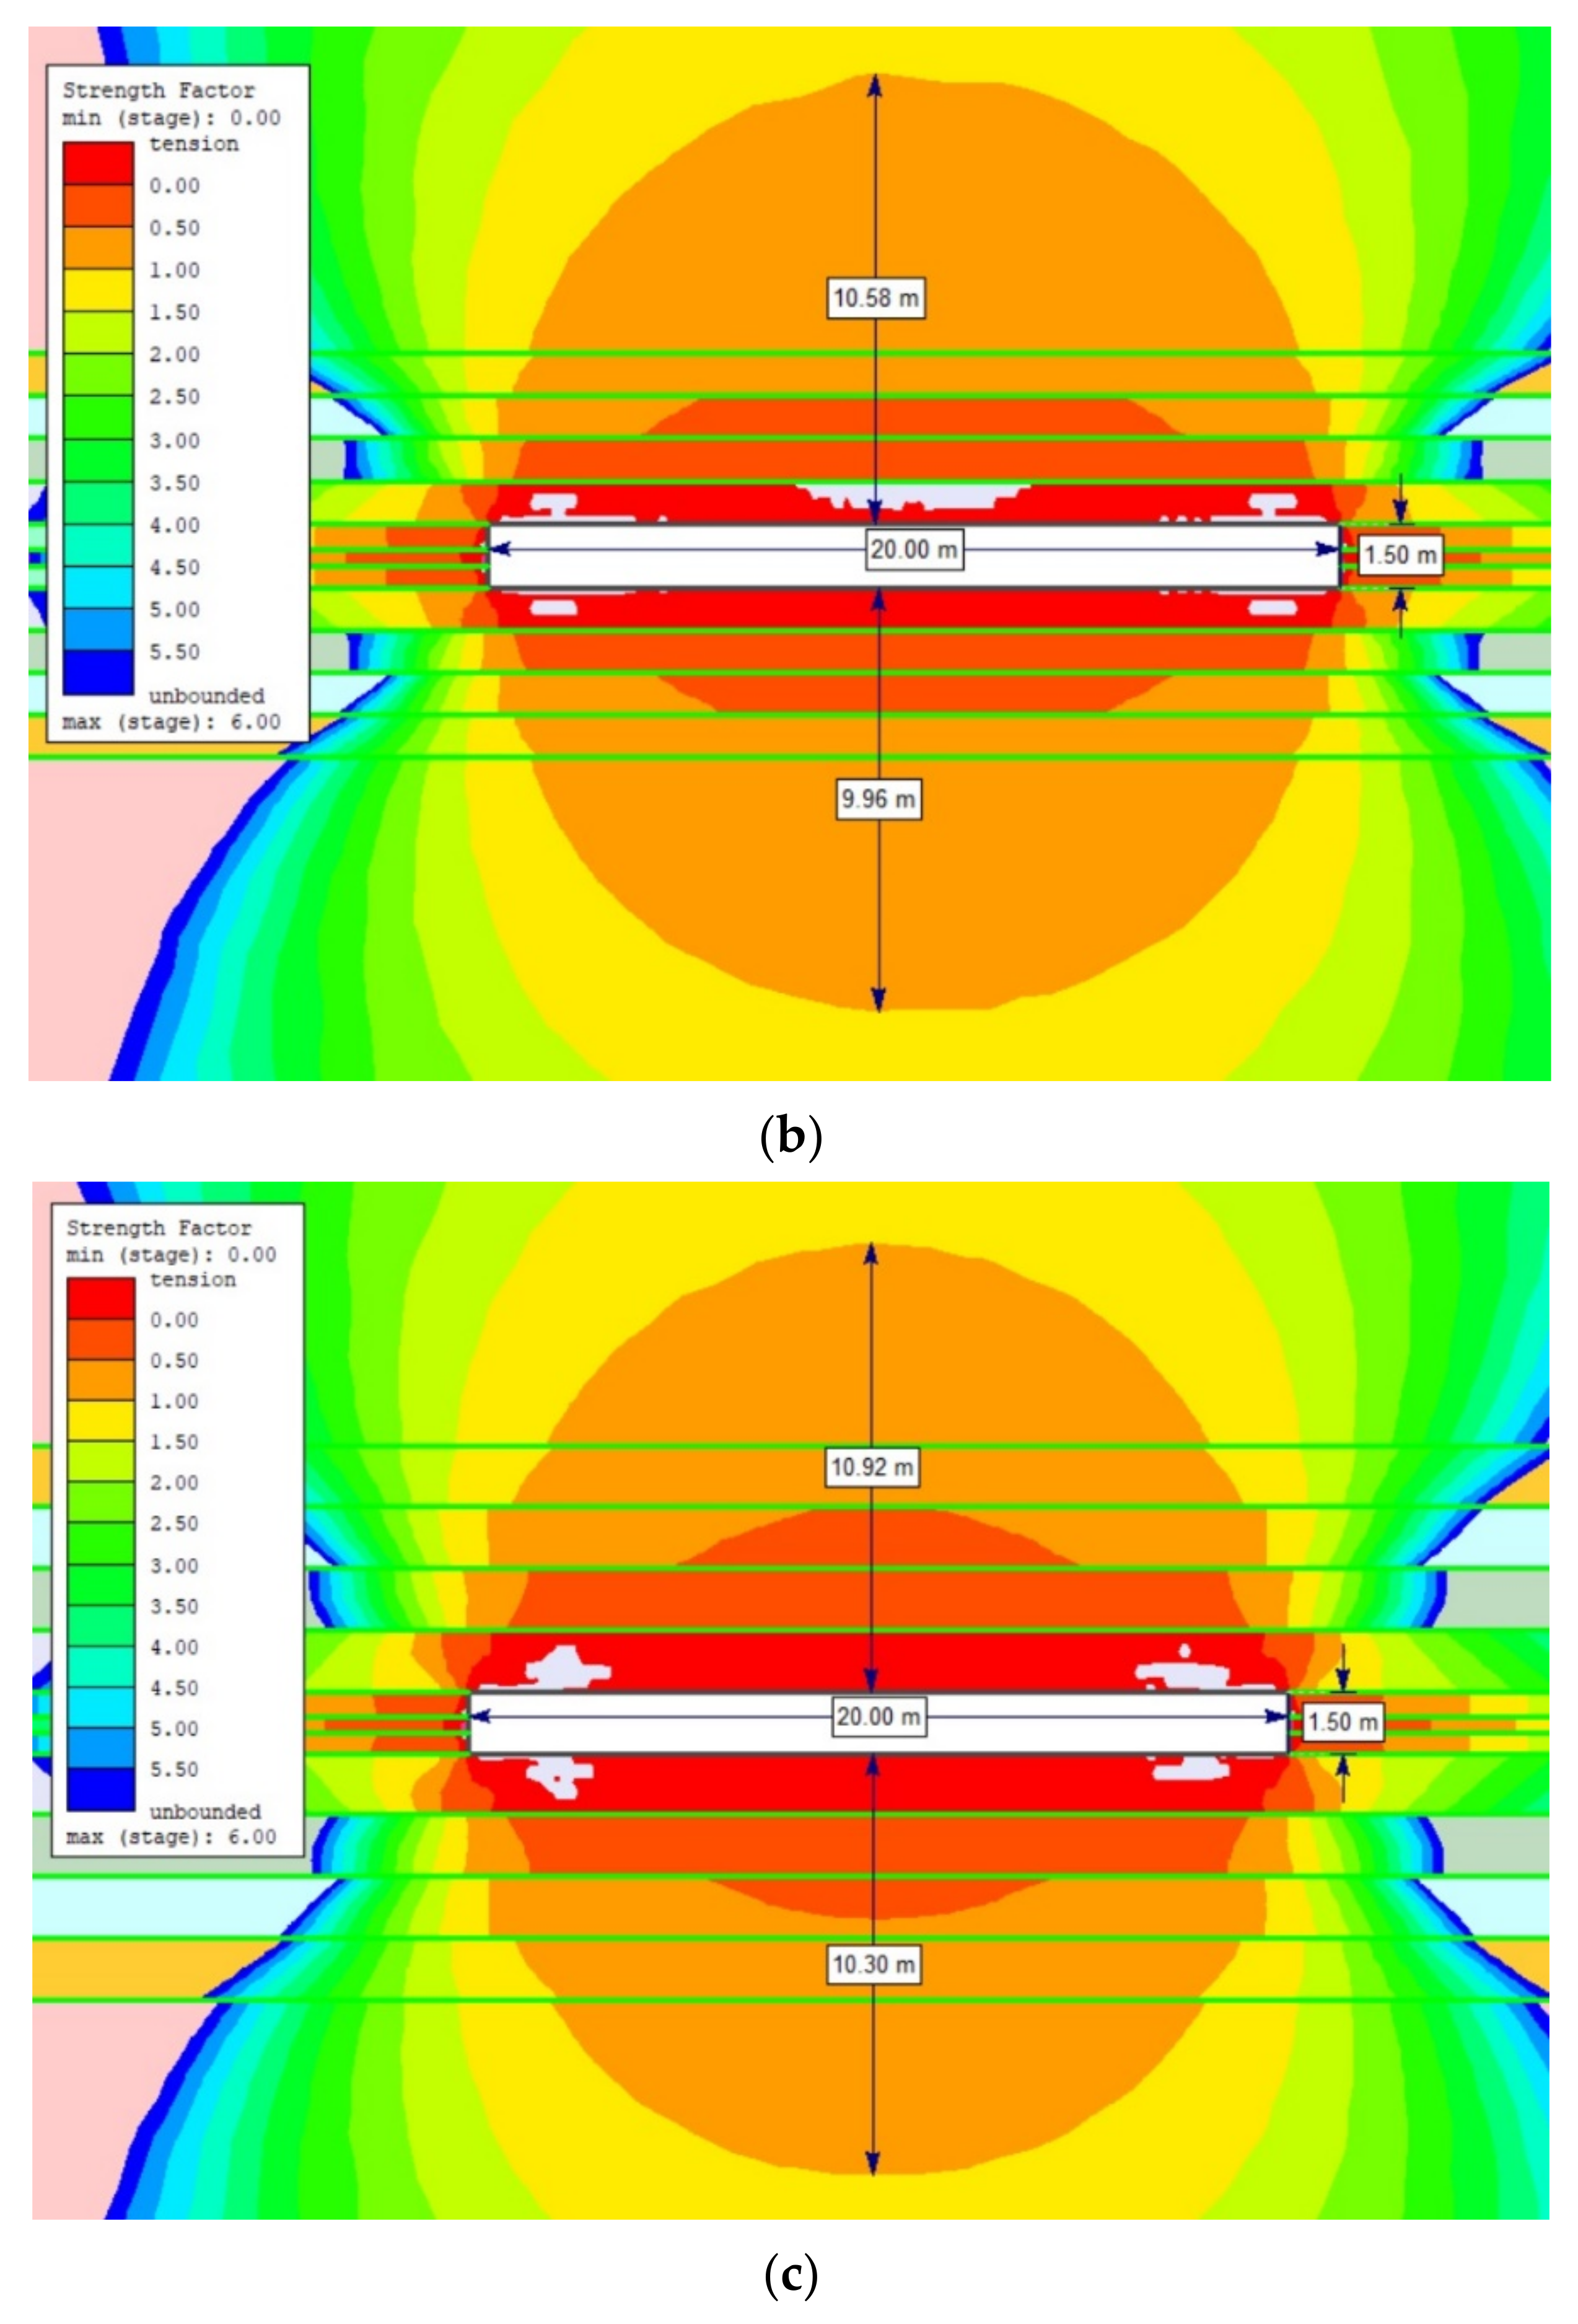
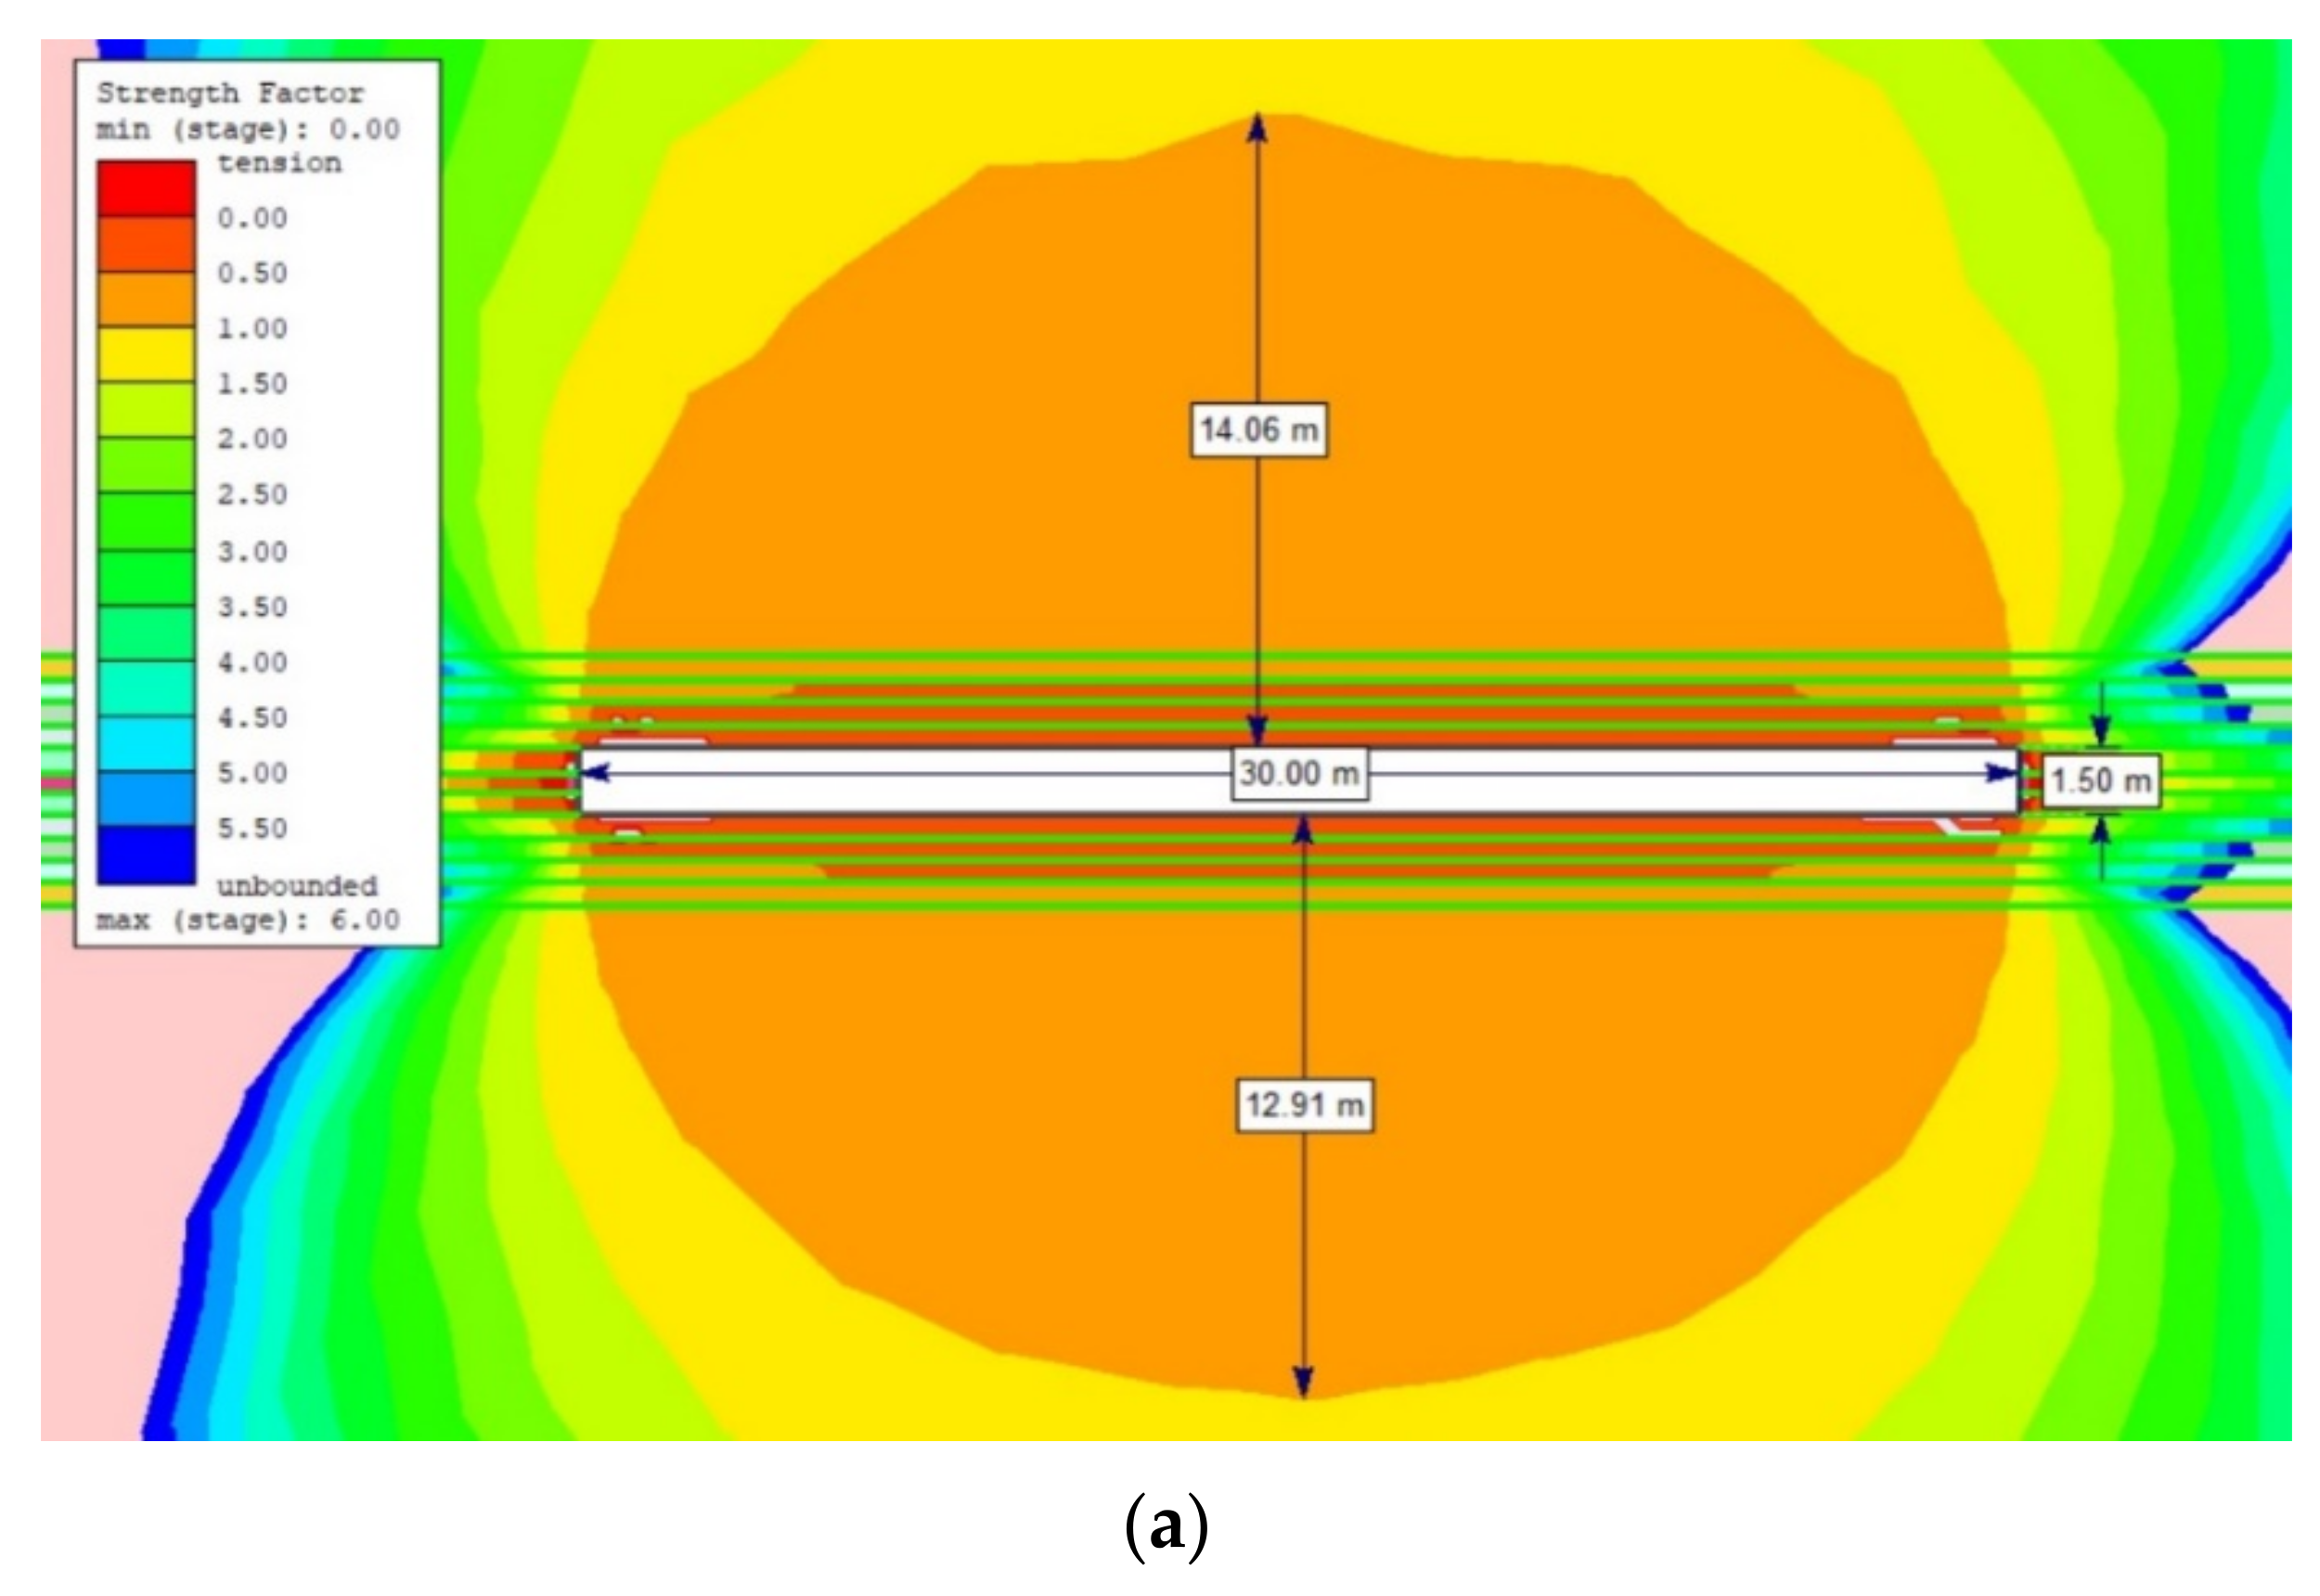
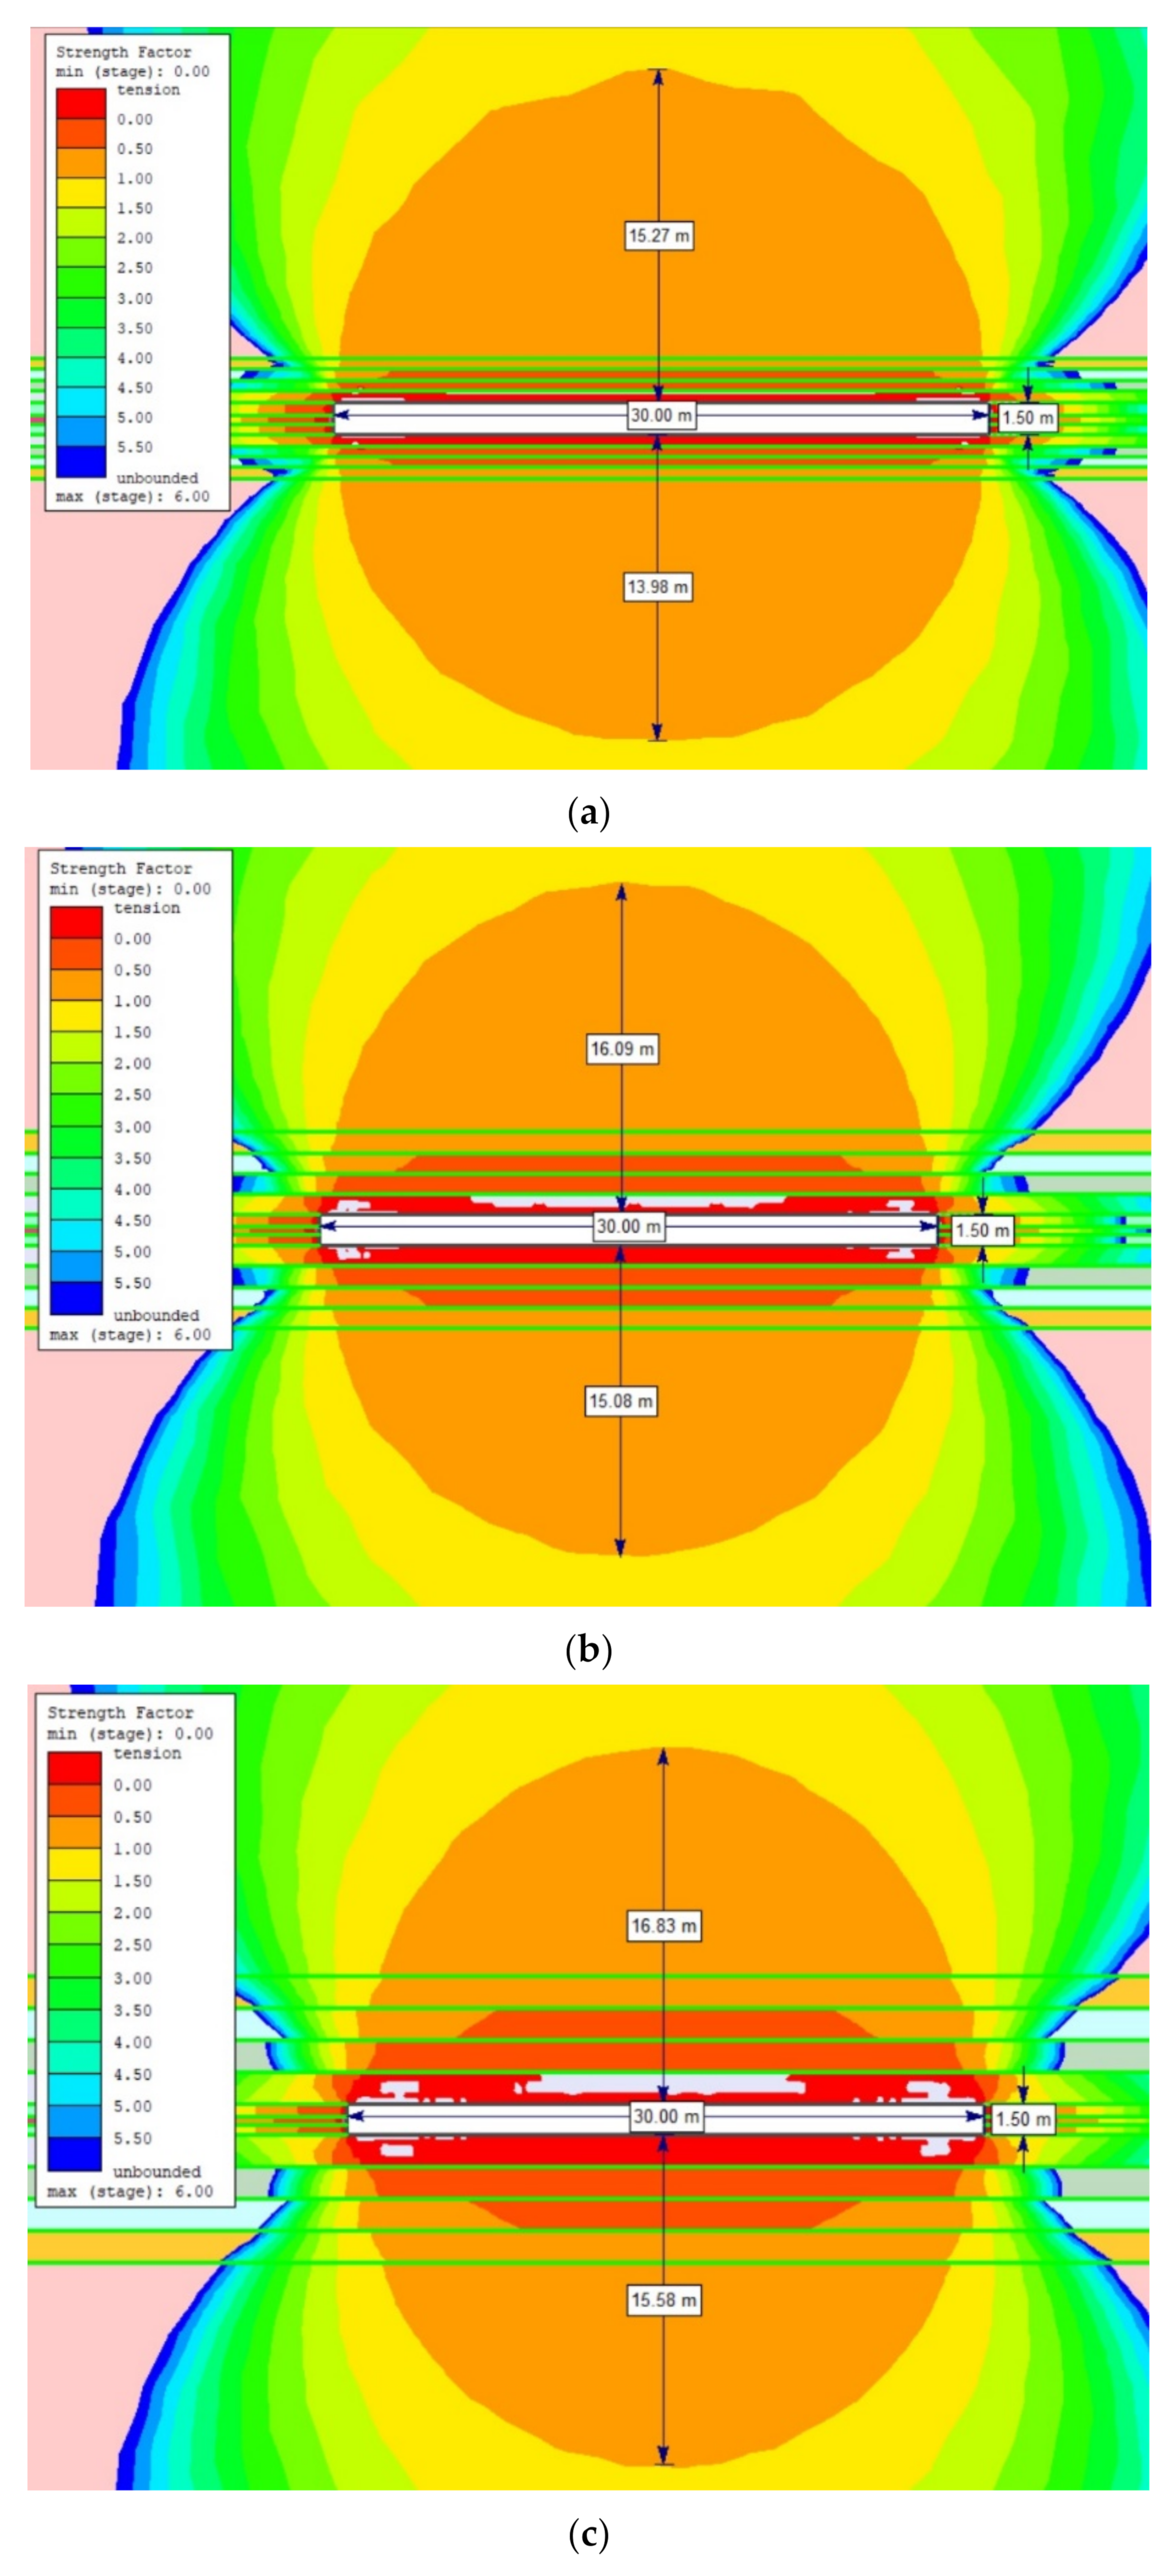
- For the width of the gasification channel equal to 10, 20 and 30 m, the maximum extent of rock destruction for dry rock mass does not exceed 5, 10 and 15 m, respectively;
- An increase in the extent of rock destruction occurs for wet rock mass. For roof rocks, the maximum range is increased by 19.2%, 15% and 14.33%;
- Additionally, for floor rocks, there is an increase by 17.1%, 13.9% and 13.7% in relation to the dry rock mass.
Author Contributions
Funding
Institutional Review Board Statement
Informed Consent Statement
Data Availability Statement
Conflicts of Interest
References
- Kostúr, K.; Laciak, M.; Durdan, M. Some Influences of Underground Coal Gasification on the Environment. Sustainability 2018, 10, 1512. [Google Scholar] [CrossRef] [Green Version]
- Dubińśki, J.; Turek, M. Basic aspects of productivity of underground coal gasification proces. Archi. Min. Sci. 2015, 2, 443–453. [Google Scholar]
- Sajjad, M.; Rasul, M.G. Prospect of Underground Coal Gasification in Bangladesh. Procedia Eng. 2015, 105, 537–548. [Google Scholar] [CrossRef] [Green Version]
- Ordinance of the Minister of the Environment of June 20, 2005 Changing the Ordinance on the Criteria for the Balance of Mineral Deposits. Available online: https://www.prawo.pl/akty/dz-u-2005-116-978,17199479 (accessed on 26 August 2021).
- Kapusta, K.; Stańczyk, K. Pollution of water during underground coal gasification of hard coal and lignite. Fuel 2011, 90, 1927–1934. [Google Scholar] [CrossRef]
- Kapusta, K.; Stańczyk, K.; Korczak, K.; Pankiewicz, M.; Wiatowski, M. Some aspects of impact of underground coal gasification process on water environment. Res. Rep. Min. Environ. 2010, 4, 17–27. (In Polish) [Google Scholar]
- Liu, S.; Wang, Y.; Yu, L.; Oakey, J. Volatilization of mercury, arsenic and selenium during underground coal gasification. Fuel 2006, 85, 1550–1558. [Google Scholar] [CrossRef]
- Chmura, K. Physico-Thermal Properties of Rocks of Some Polish Mining Basins; Śląsk Publishing House: Katowice, Poland, 1970; p. 63. (In Polish) [Google Scholar]
- Tian, H.; Mei, G.; Jiang, G.S.; Qin, Y. High-Temperature Influence on Mechanical Properties of Diorite. Rock Mech. Rock Eng. 2017, 50, 1661–1666. [Google Scholar] [CrossRef]
- Liu, X.; Guo, G.; Li, H. Study on the propagation law of temperature field in surrounding rock of underground coal gasification (UCG) combustion cavity based on dynamic thermal parameters. Results Phys. 2019, 12, 1956–1963. [Google Scholar] [CrossRef]
- Perkins, G. Underground coal gasification Part II: Fundamental phenomena and modeling. Prog. Energy Combust. Sci. 2018, 67, 234–274. [Google Scholar] [CrossRef]
- Min, X.; Lin, X.; Weitao, L.; Xiangming, H.; Weimin, C.; Chao, L.; Zhigang, W. Study on the physical properties of coal pyrolysis in underground coal gasification channel. Powder Technol. 2020, 376, 573–592. [Google Scholar]
- Feng, B.; Bhatia, S.K. Variation of the pore structure of coal chars during gasification. Carbon 2003, 41, 507–523. [Google Scholar] [CrossRef]
- Deming, Z.; Wenwen, W.; Libo, L.; Hui, J.; Liejin, G. Variation of pore structure in Zhundong coal particle with stepped K2CO3 loading during supercritical water gasification. Fuel 2021, 305, 1–8. [Google Scholar]
- Brotóns, V.; Tomás, R.; Ivorra, S.; Alarcón, J.C. Temperature influence on the physical and mechanical properties of a porous rock: San Julian’s calcarentine. Eng. Geol. 2013, 167, 117–127. [Google Scholar] [CrossRef]
- Yavuz, H.; Demirgas, S.; Caran, S. Thermal effect on the physical properties of cabonate rocks. Int. J. Rock Mech. Min. Sci. 2010, 47, 94–103. [Google Scholar] [CrossRef]
- Chaki, S.; Takarli, M.; Agbodjan, W.P. Influence of thermal damage on physical properties on a granite rock: Porosity, permeability and ultrasonic wave evolutions. Constr. Build Mater. 2008, 22, 1456–1461. [Google Scholar] [CrossRef]
- Tian, H.; Kempka, T.; Xu, N.X.; Ziegler, M. Physical properties of sandstone after high temperature treatment. Rock. Mech. Rock. Eng. 2012, 45, 1113–1117. [Google Scholar] [CrossRef]
- Małkowski, P.; Niedbalski, Z.; Hydzik-Wiśniewska, J. The change and structural thermal properties of rocks exposed to high temperature in the vicinity of designed geo-reactor. Archi. Min. Sci. 2013, 58, 465–480. [Google Scholar]
- Yang, L.; Liang, J.; Yu, L. Clean Coal technology—Study on the pilot Project experiments of underground coal gasifications. Energy 2003, 28, 1445–1460. [Google Scholar] [CrossRef]
- Kacur, J.; Laciak, M.; Durdán, M.; Flegner, P. Model-Free Control of UCG Based on Continual Optimization of Operating Variables: An Experimental Study. Energies 2021, 14, 4323. [Google Scholar] [CrossRef]
- Sygała, A.; Bukowska, M. Identification of temperature effect on post-critical geomechanical properties of loaded sandstones. Arab. J. Geosci. 2019, 12, 1–10. [Google Scholar] [CrossRef] [Green Version]
- Otto, C.; Kempka, T. Thermo-Mechanical Simulations of Rock Behavior in Underground Coal Gasification Show Negligible Impact of Temperature-Dependent Parameters on Permeability Changes. Energies 2015, 8, 5800–5827. [Google Scholar] [CrossRef] [Green Version]
- Hsu, C.; Davies, P.T.; Wagner, N.J.; Kauchali, S. Investigation of cavity formation in lump coal in the context of underground coal gasification. J. South. Afr. Inst. Min. Metall. 2014, 114, 305–309. [Google Scholar]
- Zagorščaka, R.; Sadasivama, S.; Thomas, H.R.; Stańczyk, K.; Kapusta, K. Experimental study of underground coal gasification (UCG) of a high-rank coal using atmospheric and high-pressure conditions in an ex-situ reactor. Fuel 2020, 270, 117490. [Google Scholar] [CrossRef]
- Yang, L.; Zhang, X.; Lis, S.; Yu, L.; Zhang, W. Field test of large-scale hydrogen manufacturing from underground coal gasification (UCG). Int. J. Hydrog. 2008, 33, 1275–1285. [Google Scholar] [CrossRef]
- Falsztinskij, W.S.; Diczkowskij, R.E.; Łoziskij, W.G. Economical justification of effectiveness the sealing rockmass above the gas generator for borehole coal gasification. Res. Rep. Min. Environ. 2010, 3, 51–59. (In Polish) [Google Scholar]
- Polish Standard: PN-EN 1936. Natural Stone Research Methods—Determination of Density and Bulk Density as well as Total and Open Porosity; Publishing Polish Committee for Standardization: Warszawa, Poland, 2010; pp. 1–12. (In Polish) [Google Scholar]
- International Society for Rock Mechanics and Rock Engineering. Suggested Methods for Determining Tensile Strength of Rock Materials Part 2: Suggested Method for determining indirect tensile strength by the Brazil Test. Int. J. Rock Mech. Min. Sci. 1978, 15, 99–103. [Google Scholar] [CrossRef]
- American Society of Testing and Materials. Standard Test Method for Splitting Tensile Strength of Intact Rock Core Specimens; ASTM D3967-16; ASTM International: West Conshohocken, PA, USA, 2016; pp. 1–5. [Google Scholar]
- Rocscience. Available online: https://www.rocscience.com (accessed on 11 September 2021).
- Białecka, B. Underground coal gasification. In Basics of the Decision-Making Process; Publishing House of the Central Mining Institute: Katowice, Poland, 2008; pp. 25–28. (In Polish) [Google Scholar]
- Khan, M.M.; Mmbaga, J.P.; Shirazi, A.S.; Trivedi, J.; Liu, Q.; Gupta, R. Modelling Underground Coal Gasification—A Review. Energies 2015, 8, 12603–12668. [Google Scholar] [CrossRef] [Green Version]
- Tian, H.; Kempka, T.; Schlüter, R.; Feinendegen, M.; Ziegler, M. Influence of high temperature on rock mass surrounding in situ coal conversion sites. In Proceedings of the 10th International Symposium on Environmental Geotechnology and Sustainable Development, Bochum, Germany, 7–11 September 2009; pp. 128–132. [Google Scholar]
- Wolf, K.H.A.A.; Hettema, M.H.H.; Pater, C.J.; Van Hooydonk, R. Classification of overburden properties for underground coal gasification: Laboratory studies under high temperature and in situ stress conditions. In Proceedings of the Rock Characterization: ISRM Symposium, Eurock, Chester, UK, 14–17 September 1992; pp. 93–98. [Google Scholar]
- Hettema, M.H.H.; Niepce, D.V.; Wolf, K.H.A.A. A microstructural analysis of the compaction of claystone aggregate at high temperature. Int. J. Rock Mech. Min. Sci. 1999, 36, 57–68. [Google Scholar] [CrossRef]
- Wu, G.; Wang, Y.; Swift, G.; Chen, J. Laboratory investigation of the effect of temperature on the mechanical properties of sandstone. Geotech. Geol. Eng. 2013, 31, 809–816. [Google Scholar] [CrossRef]
- Bresser, J.H.P.; Urai, J.L.; Olgaard, D.L. Effect of water on the strength and mictrostructure of Carrara marble axially compressed at high temperature. J. Struct. Geol. 2005, 27, 265–281. [Google Scholar] [CrossRef]
- Luo, J.; Wang, L. High-temperature mechanical properties of mudstone in the process of underground coal gasification. Rock Mech. Rock Eng. 2011, 44, 749–754. [Google Scholar] [CrossRef]
- Kiliç, Ö. The influence of high temperature on limestone P-wave velocity and Schmidt hammer strength. Int. J. Rock Mech. Min. Sci. 2006, 43, 980–986. [Google Scholar] [CrossRef]
- Zhang, L.; Mao, X.; Lu, A. Experimental study on the mechanical properties of rocks at high temperature. Sci. China Ser. E-Technol. Sci. 2009, 52, 641–646. [Google Scholar] [CrossRef]
- Rao, Q.-H.; Wang, Z.; Xie, H.-F.; Xie, Q. Experimental study of mechanical properties of sandstone at high temperature. J. Cent. Univ. Technol. 2007, 14, 478–483. [Google Scholar] [CrossRef]
- Małkowski, P.; Skrzypkowski, K.; Bożęcki, P. Changes of rock behaviour under the influence of high temperatures in the vicinity of a georeactor. Res. Reports. Min. Environ. 2011, 4/2, 259–272. (In Polish) [Google Scholar]
- Otto, C.; Kempka, T. Thermo-mechanical simulations confirm: Temperature-dependent mudrock properties are nice to have in far-field environmental assessments of underground coal gasification. Energy Procedia 2015, 76, 582–591. [Google Scholar] [CrossRef] [Green Version]
- Nakaten, N.; Kempka, T. Techno-Economic Comparison of Onshore and Offshore Underground Coal Gasification End-Product Competitiveness. Energies 2019, 12, 3252. [Google Scholar] [CrossRef] [Green Version]
- Pivnyak, G.; Falshtynskyi, V.; Dychkovskyi, R.; Saik, P.; Lozynskyi, V.; Cabana, E.; Koshka, O. Conditions of Suitability of Coal Seams for Underground Coal Gasification. Key Eng. Mater. 2020, 844, 38–48. [Google Scholar] [CrossRef]
- Dengina, N.I.; Kazak, V.N.; Pristash, V.V. Changes in rock at high temepraure. J. Min. Sci. 1994, 29, 472–477. [Google Scholar] [CrossRef]
- Luo, J.; Lianguo, W.; Furong, T.; Yan, H.; Lin, Z. Variation in the temperature field of rocks overlying a high-temperature cavity during underground coal gasification. Min. Sci. Technol. 2011, 21, 709–713. [Google Scholar] [CrossRef]
- Wiatowski, M.; Kapusta, K.; Nowak, J.; Szyja, M.; Basa, W. An exsitu underground coal gasification experiment with a siderite interlayer: Course of the process, production gas, temperatures and energy efficiency. Int. J. Coal. Sci. Technol 2021, 8, 1–14. [Google Scholar] [CrossRef]
- Xu, Y.; Li, H.; Guo, G.; Liu, X. Stability analysis of hyperbolic coal pillars with peeling and high temperature effects. Energy Explor. Exploit. 2020, 38, 1574–1588. [Google Scholar] [CrossRef]


| Type of Rock | Parameter | Temperature, t (°C) | ||||
|---|---|---|---|---|---|---|
| 20 | 300 | 600 | 900 | 1200 | ||
| Sandstone dry | Cs, (MPa) | 61.2 | 110.6 | 83.6 | 42.8 | 21 |
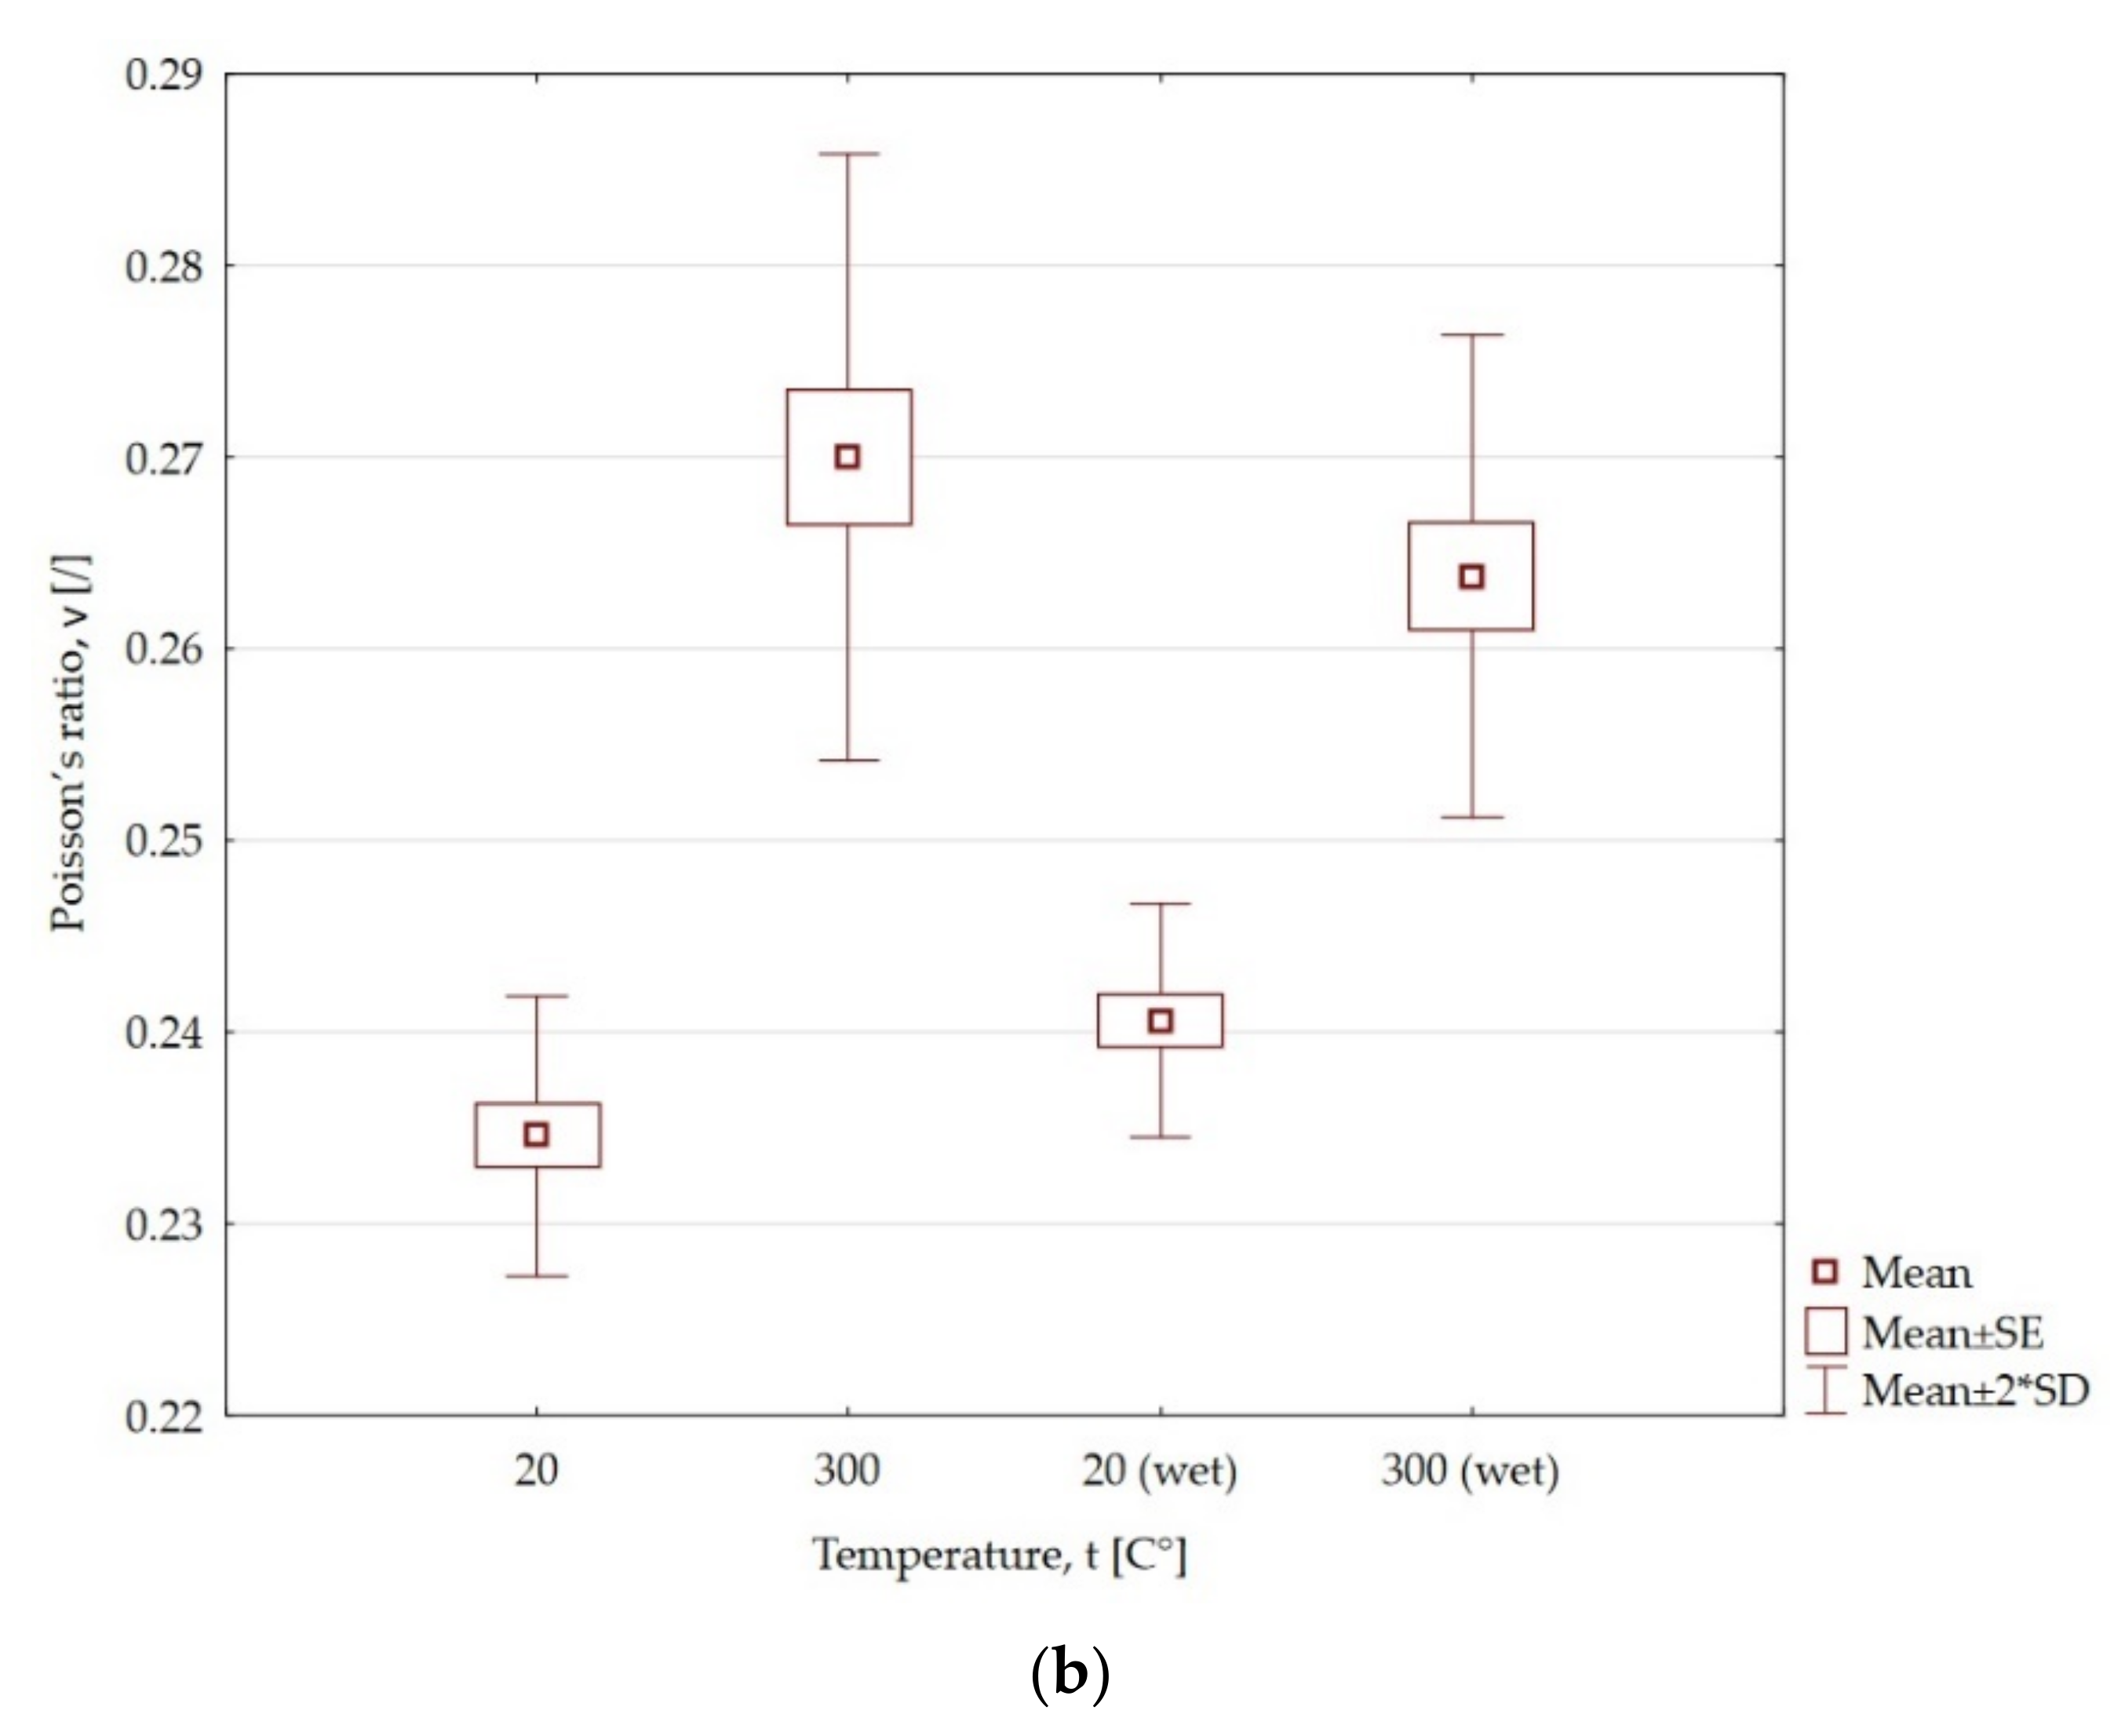
| ν | 0.241 | 0.196 | 0.215 | 0.256 | 0.284 | |
| Sandstone wet | Cs, (MPa) | 59.6 | 103 | 64.2 | 23.4 | 2.54 |
| ν | 0.238 | 0.18 | 0.202 | 0.240 | 0.294 | |
| Claystone dry | Cs, (MPa) | 31.8 | 6.2 | |||
| ν | 0.234 | 0.27 | ||||
| Claystone wet | Cs, (MPa) | 26.8 | 1.78 | |||
| ν | 0.240 | 0.263 | ||||
| Channel Width, (m) | Temperature Impact Range (m) | The Maximum Extent of the Rock Destruction Zone around the Gasification Channel for a Dry Rock Mass (m) | The Maximum Extent of the Rock Destruction Zone around the Gasification Channel for a Wet Rock Mass (m) | |||||
|---|---|---|---|---|---|---|---|---|
| 1200 °C | 900 °C | 600 °C | 300 °C | Roof | Floor | Roof | Floor | |
| 10 | 0.5 | 1.0 | 1.5 | 2.0 | 4.51 | 4.36 | 5.0 | 4.9 |
| 1.0 | 2.0 | 3.0 | 4.0 | 4.58 | 4.47 | 5.18 | 5.08 | |
| 1.5 | 3.0 | 4.5 | 6.0 | 4.63 | 4.54 | 5.52 | 5.32 | |
| 20 | 0.5 | 1.0 | 1.5 | 2.0 | 8.96 | 8.60 | 9.75 | 9.23 |
| 1.0 | 2.0 | 3.0 | 4.0 | 9.33 | 8.87 | 10.58 | 9.96 | |
| 1.5 | 3.0 | 4.5 | 6.0 | 9.49 | 9.04 | 10.92 | 10.30 | |
| 30 | 0.5 | 1.0 | 1.5 | 2.0 | 14.06 | 12.91 | 15.27 | 13.98 |
| 1.0 | 2.0 | 3.0 | 4.0 | 14.29 | 13.43 | 16.09 | 15.08 | |
| 1.5 | 3.0 | 4.5 | 6.0 | 14.72 | 13.70 | 16.83 | 15.58 | |
Publisher’s Note: MDPI stays neutral with regard to jurisdictional claims in published maps and institutional affiliations. |
© 2021 by the authors. Licensee MDPI, Basel, Switzerland. This article is an open access article distributed under the terms and conditions of the Creative Commons Attribution (CC BY) license (https://creativecommons.org/licenses/by/4.0/).
Share and Cite
Skrzypkowski, K.; Zagórski, K.; Zagórska, A. Determination of the Extent of the Rock Destruction Zones around a Gasification Channel on the Basis of Strength Tests of Sandstone and Claystone Samples Heated at High Temperatures up to 1200 °C and Exposed to Water. Energies 2021, 14, 6464. https://doi.org/10.3390/en14206464
Skrzypkowski K, Zagórski K, Zagórska A. Determination of the Extent of the Rock Destruction Zones around a Gasification Channel on the Basis of Strength Tests of Sandstone and Claystone Samples Heated at High Temperatures up to 1200 °C and Exposed to Water. Energies. 2021; 14(20):6464. https://doi.org/10.3390/en14206464
Chicago/Turabian StyleSkrzypkowski, Krzysztof, Krzysztof Zagórski, and Anna Zagórska. 2021. "Determination of the Extent of the Rock Destruction Zones around a Gasification Channel on the Basis of Strength Tests of Sandstone and Claystone Samples Heated at High Temperatures up to 1200 °C and Exposed to Water" Energies 14, no. 20: 6464. https://doi.org/10.3390/en14206464
APA StyleSkrzypkowski, K., Zagórski, K., & Zagórska, A. (2021). Determination of the Extent of the Rock Destruction Zones around a Gasification Channel on the Basis of Strength Tests of Sandstone and Claystone Samples Heated at High Temperatures up to 1200 °C and Exposed to Water. Energies, 14(20), 6464. https://doi.org/10.3390/en14206464