Article

Characteristics of Water Contaminants from Underground Coal Gasification (UCG) Process—Effect of Coal Properties and Gasification Pressure

by
Magdalena Pankiewicz-Sperka
1,*,
Krzysztof Kapusta
1,
Wioleta Basa
1 and
Katarzyna Stolecka
2
1
Department of Energy Saving and Air Protection, Główny Instytut Górnictwa, Central Mining Institute, Plac Gwarków 1, 40-166 Katowice, Poland
2
Department of Power Engineering and Turbomachinery, Silesian University of Technology, Konarskiego 18, 44-100 Gliwice, Poland
*
Author to whom correspondence should be addressed.
Energies 2021, 14(20), 6533; https://doi.org/10.3390/en14206533
Submission received: 4 August 2021 / Revised: 30 September 2021 / Accepted: 4 October 2021 / Published: 12 October 2021

Abstract

:
One of the most important issues during UCG process is wastewater production and treatment. Condensed gasification wastewater is contaminated by many hazardous compounds. The composition of the generated UCG-derived wastewater may vary depending on the type of gasified coal and conditions of the gasification process. The main purpose of this study was a qualitative and quantitative characterization of the UCG wastewater produced during four different UCG experiments. Experiments were conducted using semi-anthracite and bituminous coal samples at two distinct pressures, i.e., 20 and 40 bar. The conducted studies revealed significant relationships between the physicochemical composition of the wastewater and the coal properties as well as the gasification pressure. The strongest impact is noticeable in the case of organic pollutants, especially phenols, BTEX and PAH’s. The most abundant group of pollutants were phenols. Conducted studies showed significantly higher concentration levels for bituminous coal: 29.25–49.5 mg/L whereas for semi-anthracite effluents these concentrations were in much lower range 2.1–29.7 mg/L. The opposite situation occurs for BTEX, higher concentrations were in wastewater from semi-anthracite gasification: 5483.1–1496.7 µg/L, while in samples from bituminous coal gasification average BTEX concentrations were: 2514.3–1354.4 µg/L. A similar relationship occurs for the PAH’s concentrations. The higher values were in case of wastewater from semi-anthracite coal experiments and were in range 362–1658 µg/L while from bituminous coal gasification PAH’s values are in lower ranges 407–1090 µg/L. The studies conducted have shown that concentrations of phenols, BTEX and PAH’s decrease with increasing pressure. Pearson’s correlation analysis was performed to enhance the interpretation of the obtained experimental data and showed a very strong relationship between three parameters: phenols, volatile phenols and CODcr.

1. Introduction

Nowadays meeting the challenges of energy supply safety and provision of competitive energy costs is one of the most important challenges in the energy sector today. Despite the current ecological trends towards shifting to renewable energy and green resources, fossil fuels and coal will still be a major source of energy in a near future [1,2]. Coal has been and still is one of the most crucial primary energies and contributes approximately 65% of the total fossil fuel reserves in the world [3]. It is estimated that 45% of global energy demand will be covered by coal consumption by 2030 [2,4]. However, conventional coal mining has become more difficult and controversial. Ecological and economic factors stimulate searching for new ways and solutions for use of coal reserves. One of them is underground coal gasification (UCG) which offers many potential advantages over the traditional mining methods [5,6]. UCG is a method of in-situ (directly in the underground coal seam) thermochemical coal conversion into a synthetic gas [7,8,9]. The basis of the UCG process is direct injection of gasifying reagents to the ignited coal seam and receiving the gas product at the surface [10]. Compared to traditional mining UCG process has lower surface impact and hence may contribute to the reduction of air pollutants and greenhouse gas emission [11]. There are several process techniques for the UCG described in detail in the literature [11,12,13,14]. The final gas composition is mainly H2, CH4, CO and CO2. The most desirable product for UCG process is methane, which strongly improve calorific value of gas [1,15]. Methane is formed in methanation reaction and directly from solid carbon in hydrogenation reaction [1]:
CO + 3H2 → CH4 + H2O (ΔH= −206 kJ/mol)
C + 2H2 → CH4 (ΔH= −91 kJ/mol)
Methane rich gas called synthetic natural gas (SNG) can be used as a chemical feedstock or as a fuel for power generation [1,16]. SNG seems to be a future fuel and an essential component in the energy production, which will make several energy-intense industries more efficient and sustainable, while reducing their carbon footprint. However, every thermochemical coal processing technology is associated with environmental impact assessment. One of the most important issues is wastewater production and its treatment. The raw UCG product gas, apart from tar compounds and particulates (coal and ash) contains water vapour, mainly derived from the evaporation of coal moisture, the coal pyrolysis (pyrogenic water) or from hydrogen combustion. These gas components tend to condense onto the cooler parts of the facilities, such as the internal surfaces of gas pipelines or in the gas-treatment module particular devices (e.g., water scrubber). These condensed processing wastewater is contaminated by many hazardous compounds such as polycyclic aromatic hydrocarbons (PAHs), phenols, monoaromatic compounds including benzene, toluene, ethylbenzene and xylene [10,17,18,19,20]. Heavy metals are another group of UCG-derived contaminants [10,17,18]. Due to its specific nature, the UCG wastewater requires an appropriately tailored treatment technique. In 1988 Bryant et al. evaluate the biological treatability of wastewater from the UCG pilot installation in Hanna, Wyoming [21]. Zhang et al. propose pretreatment of wastewater generated during coal gasification by acidification demulsion [22]. A large number of toxic compounds present in UCG wastewater are difficult to decompose if only biological methods are used [23]. Thomas et al. presents the possibility of phenol removal from UCG effluents by using coagulation-flocculation and the H2O2/UV Process [24]. Treatment of coal gasification wastewater by catalytic oxidation with trace ozone is another promising technique [25]. In recent years there have been several new developments involving biological coupling processes to treat coal gasification wastewater. Biological coupling treatment methods including: conventional biological processes, the combination of adsorption and biotechnology processes, biological enhancement technologies, co-metabolism technologies and the combination of advanced oxidation and biotechnology [23,24,25,26,27,28,29,30]. The development of an appropriate treatment method to remove pollutants from UCG wastewater is of utmost importance for the successful implementation of this technology. However, the composition of the generated UCG-derived wastewater may vary depending on the type of gasified coal and conditions of the gasification process.
The main aim of the study was to conduct the qualitative and quantitative characterization of UCG wastewater generated during four different ex situ UCG experiments. The effluents were collected during the experiments in order to correlate the compositions and concentrations of produced contaminants with the coal properties (coal type) and gasification conditions.

2. Materials and Methods

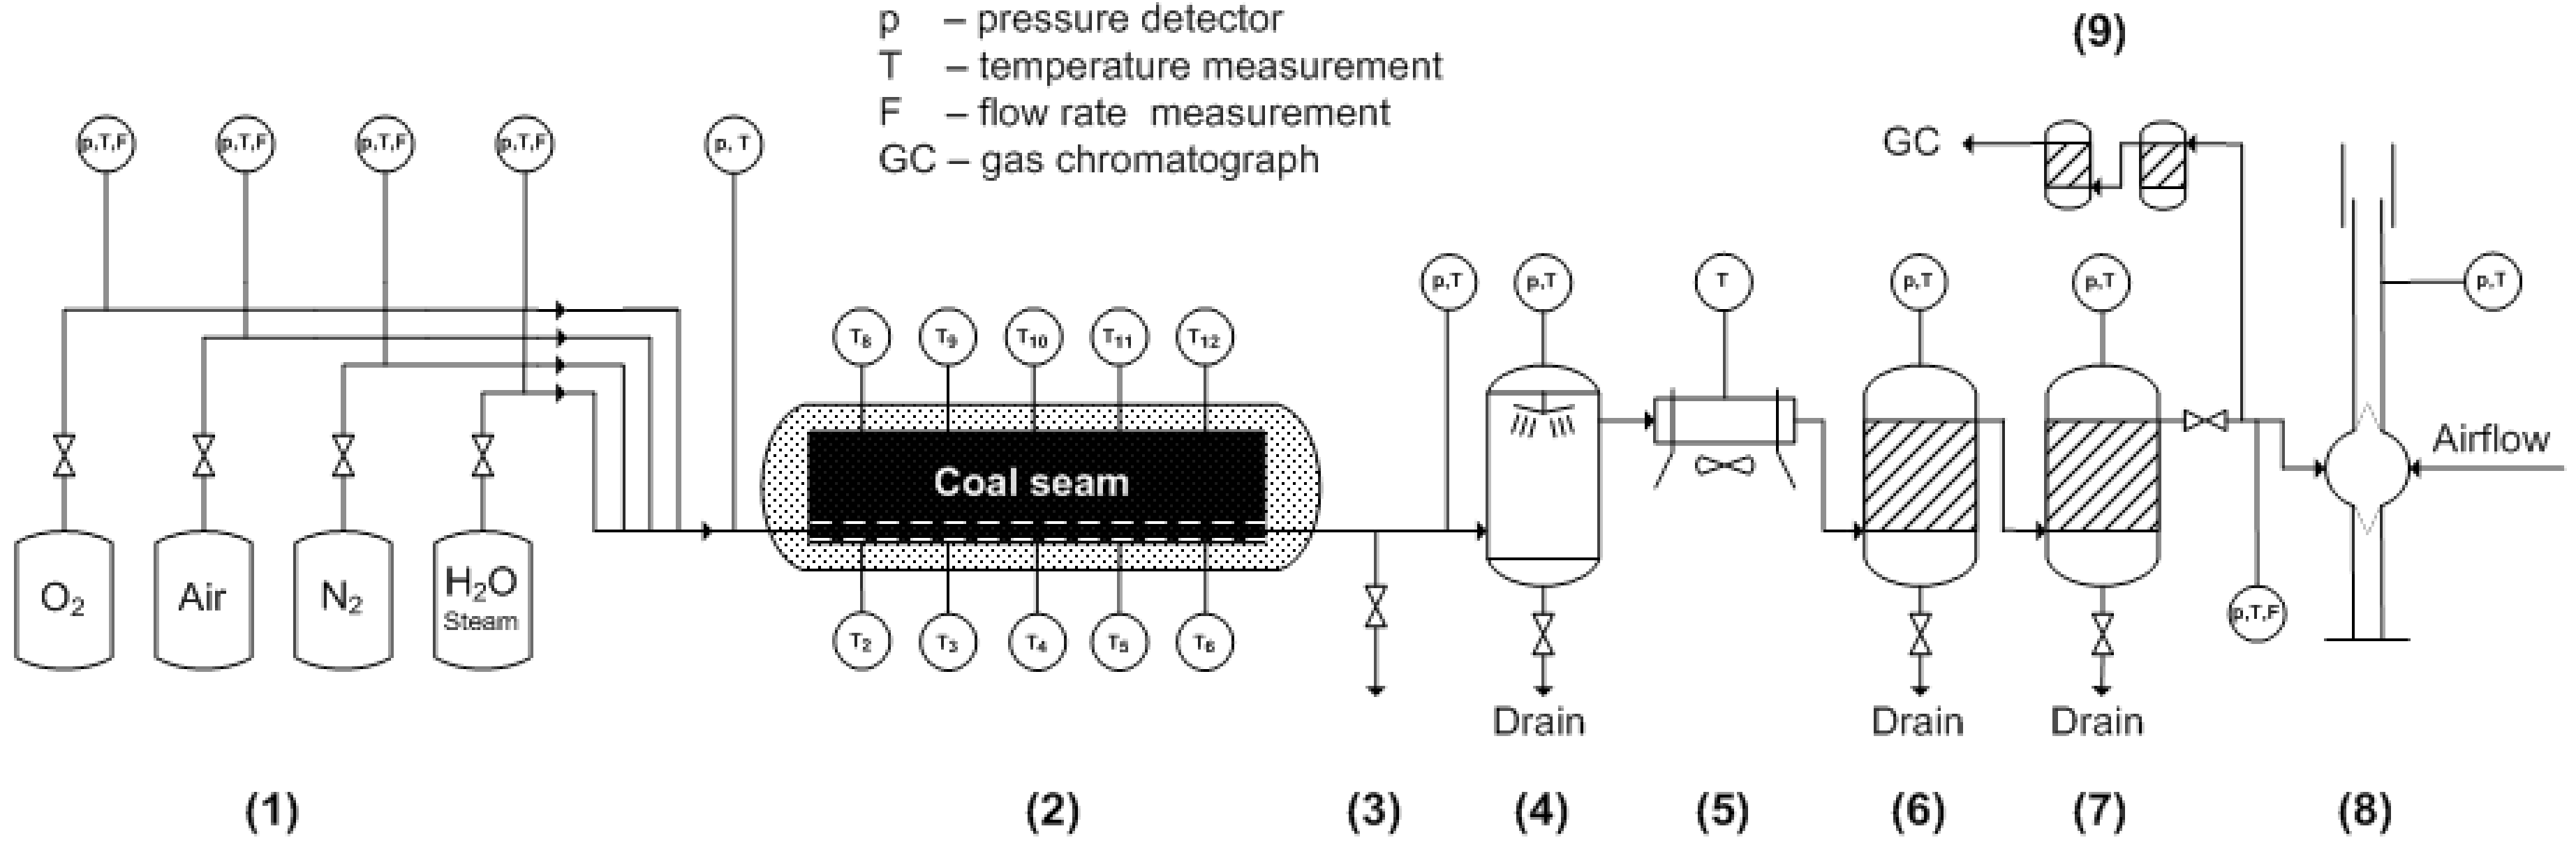
2.1. Coal Samples and UCG Experiments

The four UCG experiments were carried out in an ex situ UCG installation located in the Clean Coal Technology Centre of the Central Mining Institute (Mikołów, Poland). The experimental installation enables simulation of the UCG process in surface conditions. The schematic view of the installation and wastewater sampling point are presented in Figure 1 and Figure 2.
Experiments were conducted using two different coal samples. Coal samples were gathered from two various locations. The first semi-anthracite “Six feet” coal was obtained from an open cast coal mine near Merthyr Tydfil (South Wales, UK) and the second one bituminous coal was obtained from the “Wesoła” coal mine located in Mysłowice (Upper Silesia, Poland). Detailed parameters of used coals are presented in Table 1. The raw coal samples were tested for 18 elements, including selected metals and metalloids being considered the most important for the aquatic environment. The results obtained are presented in Table 2.
All gasification tests were conducted for a period of 96 h and under two distinct pressure regimes—20 and 40 bar. The general summary of the UCG experiments conducted is presented in Table 3.
To investigate the effect of coal type and gasification pressure the oxidant supply rates were the same in all experiments. During first 24 h of the process, oxygen was used as a gasifying agent, with constant flow5 Nm3/h. After 24 h the processes were carried out with oxygen and water with flow ratio 5 Nm3/h and 2.5 kg/h respectively.

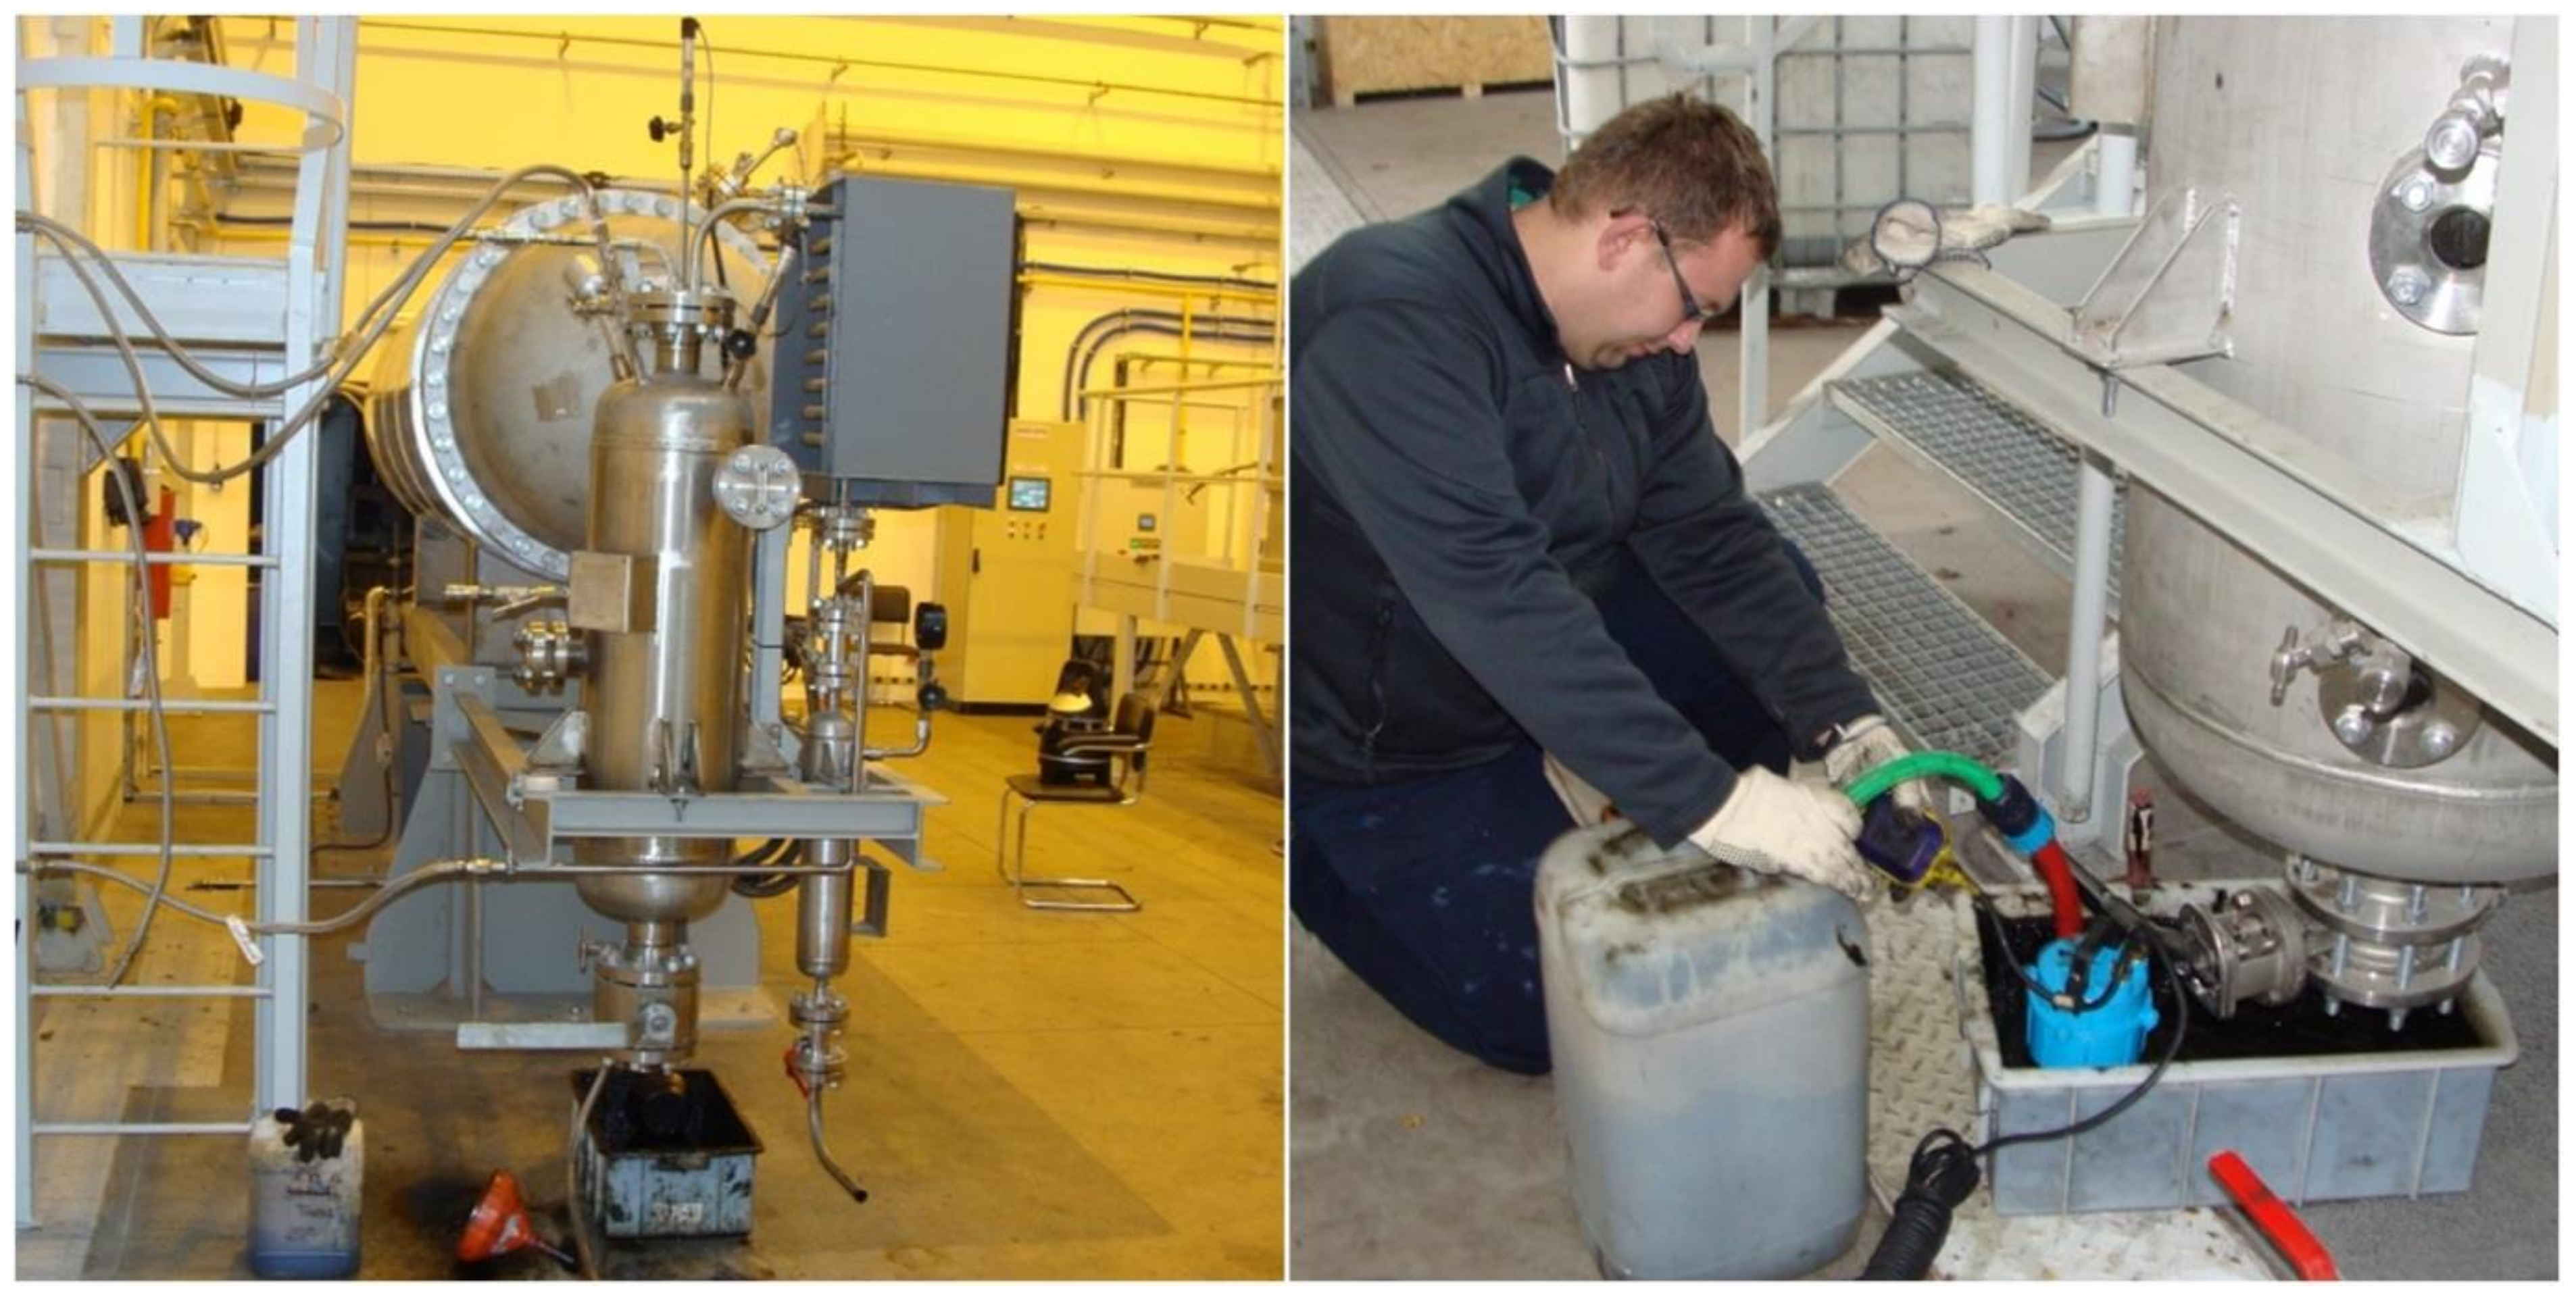
2.2. Post-Processing Water Sampling

The UCG effluents produced in water scrubber were collected after completion of each gasification experiment. They represented the average sample of wastewater for given gasification experiment. After sampling, the wastewater were transported to the laboratory for chemical analyses. Coal tars and other undissolved residues were removed by vacuum filtration WhatmanTM Glass Microfiber Filters GF/CTM (GE Healthcare UK Limited, Hatfield, UK), and filtrates were subsequently stored at 4 °C until analysed.

2.3. Chemical Analyses

The chemical analyses were carried out according to standard analytical methods. The conductivity, pH and CODCr (chemical oxygen demand) were determined as typical nonspecific industrial wastewater parameters. Following inorganic parameters were also determined: total ammonia nitrogen, chlorides, cyanides, sulphates, sulphides and 17 metal and metalloid trace elements (Mn, Fe, Sb, As, B, Cr, Zn, Al, Cd, Co, Cu, Mo, Ni, Pb, Hg, Se, Ti). Organic analysis included benzene with its three alkyl homologues: toluene, ethylbenzene and xylene (BTEX), total phenols and 15 polycyclic aromatic hydrocarbons (PAHs). To determine pH and conductivity potentiometry and conductometry methods were used according to PN-EN ISO 10523: 2012 and PN-EN 27888:1999 standards. CODCr index was determined by spectrophotometric method according to PN-ISO 15705: 2005. Ammonia nitrogen was determined by Flow Injection Analysis (FIA) with gaseous diffusion and spectrophotometric detection according to PN-EN ISO 11732: 2007). The chlorides were determined according to PN-ISO 9297: 1994. The cyanides and the volatile phenols were determined by segment flow analysis (SFA) with spectrophotometric detection according to PN-EN ISO 14403-2:2012 and PN-EN ISO 14402:2004. Sulphates were determined according to PN-ISO 9280: 2002. Flow Injection Analysis (FIA) with spectrophotometric detection was used to determined sulphides. To determined metals and metalloid trace elements inductively coupled plasma-optical emission spectroscopy (ICP-OES) was used (PN-EN ISO 11885: 2009). For the BTEX and phenols analysis the Agilent Technologies 7890A chromatograph coupled with a static headspace auto sampler Agilent 7697A and FID detector was applied. The chromatographic column was DB-5MS (30 m, 0.25 mm, 0.5 µm). For determination of PAHs high-performance liquid chromatography was applied using Agilent Technologies HPLC Series chromatograph equipped with fluorescence detector on Agilent ZORBAX Eclipse PAH column (3.0 mm × 250 mm, 5 µm).

2.4. Linear Correlation Analysis

Pearson’s correlation analysis was performed to enhance the interpretation of the obtained experimental data. It is known as a valuable method of measuring the association between variables data because it is based on the method of covariance. Pearson’s correlation analysis gives information about the magnitude of the correlation and direction of the relationship. The values of the Pearson coefficient “r” can fluctuate from −1 to 1. An r = −1 indicates a perfect negative linear relationship, an r = 0 indicates no linear relationship, and an r = 1 indicates a perfect positive linear relationship between variables. The closer the indicator is to 1, the greater the correlation occurs. In statistical analysis, it is assumed that the values >0.7 indicating significant correlation between the variables. Input data were physicochemical parameters of obtained wastewater samples from all four UCG experiments.

3. Results and Discussion

The average physicochemical characteristics of the post processing water samples obtained during all four UCG experiments are presented in the Table 4. Conducted study revealed significant differences in the qualitative and quantitative characteristics of the tested water samples. The differences obtained were related to both the type of the coal used and the applied gasification pressure. The results of the Pearson’s correlation analysis are presented in Table 5. The values of the Pearson coefficient >0.7 are bolded.

3.1. Coal Type Effect

As can be seen from the Table 4 all analysed water samples exhibit high values of the CODCr parameter, which is typical for effluents from the thermochemical processing of coal. The much higher CODCr values were observed in water samples from gasification of bituminous coal, ranged from 185.9 mg/LO2 to 322.7 mg/LO2, while for semi-anthracite coal this parameter was in the range from 48.6 mg/LO2 to 151.6 mg/LO2. pH of analysed water samples was slightly higher for semi-anthracite experiments, fluctuating within 5.2–6.4 level and 4.9–5.3 for bituminous coal. Ammonia nitrogen levels for bituminous coal remained relatively constant from 95.7 mg/L to 96.4 mg/L, while for semi-anthracite coal wastewater there was a wide concentration range from 11.7 mg/L to 160.1 mg/L. This situation is determined by pH values, which were in a wider range and fluctuated more during the gasification of semi-anthracite coal. For chlorides there was the opposite situation and in effluents from gasification of semi-anthracite coal concentrations were in the lower range 11.2–11.7 mg/L while for bituminous coal wastewater levels were higher and fluctuated in a wider range from 29.2 mg/L to 45.9 mg/L. In all wastewater samples low concentration levels of cyanides and sulphides were observed. Sulphates levels were relatively higher for wastewater from bituminous coal gasification and were from 42.9 mg/L to 53.0 mg/L while for semi-anthracite coal concentration values were in range of 33.5–47.7 mg/L. The conducted studies have shown concentrations of metals and metalloids in all studied water samples were at very low levels (Table 4). Among the 17 of metals and metalloids, 9 of them (Mn, As, Cr, Cd, Co, Cu, Mo, Hg and Ti) were identified in concentrations below the lower detection limit or in an amount not exceeding 0.036 mg/L (for As). For the rest metals and metalloids concentrations were above lower detection limits, but still at very low levels. While in raw coals the highest values were for Mn and were 218 mg/kg and 357 mg/kg for semi-anthracite and bituminous coal respectively, the highest values in effluents were observed for Fe. For semi-anthracite wastewater concentrations varied from 0.284 to 0.823 mg/L, while for bituminous effluents Fe levels were lower and range from 0.131 mg/L to 0.245 mg/L. Concentrations of metals and metalloids occurring in the raw coal do not directly affect the composition of the wastewater generated during the UCG process. This is due to the fact that their concentrations are dependent on the solubility of the individual elements, which varies with pH and the presence of other compounds (background) in the sample. The wastewater which are formed during the process is water coming from condensation onto the cooler parts of the installations (e.g., in particular devices of the gas-treatment module). Composition of obtained wastewaters is therefore mainly determined by organic contaminants originating from the tars which are generated during the gasification process. Therefore, the studies carried out confirmed that type of coal used for gasification experiments has a significant impact on concentration levels of organic compounds. Among all pollutants, organic compounds (phenols, BTEX, PAH) constituted the most significant group of contaminants in UCG wastewater samples. Comparison of selected organic contaminants concentrations in the wastewater from gasification experiments are presented in Figure 3.
As can be seen from the Figure 3 due to high water affinity, the most abundant group of pollutants in analysed water samples were phenols. Conducted studies showed significantly higher concentration levels for bituminous coal wastewater, with values from 29.25 to 49.5 mg/L whereas for semi-anthracite effluents these concentrations were in much lower range 2.1–29.7 mg/L. An analogous situation exists for volatile phenols, where average concentrations in bituminous coal wastewater were 17 and 24 mg/L at 20 and 40 bar, while for semi-anthracite coal wastewater the average concentrations were proportionally lower 8.45 and 0.87 at 20 and 40 bar respectively. However the opposite situation occurs for BTEX levels. The conducted studies showed that higher concentrations occurs in wastewater from semi-anthracite gasification. BTEX average amounts are 5483.1 µg/L for 20 bar experiment and 1496.7 µg/L for 40 bar experiment, while in samples from bituminous coal gasification average BTEX concentrations were in lower range 2514.3–1354.4 µg/L. A similar relationship can be found for the PAH’s concentrations. The higher values 362–1658 µg/L occurs in case of wastewater from semi-anthracite coal experiments. For wastewater from bituminous coal gasification PAH’s values are in lower ranges 407–1090 µg/L.

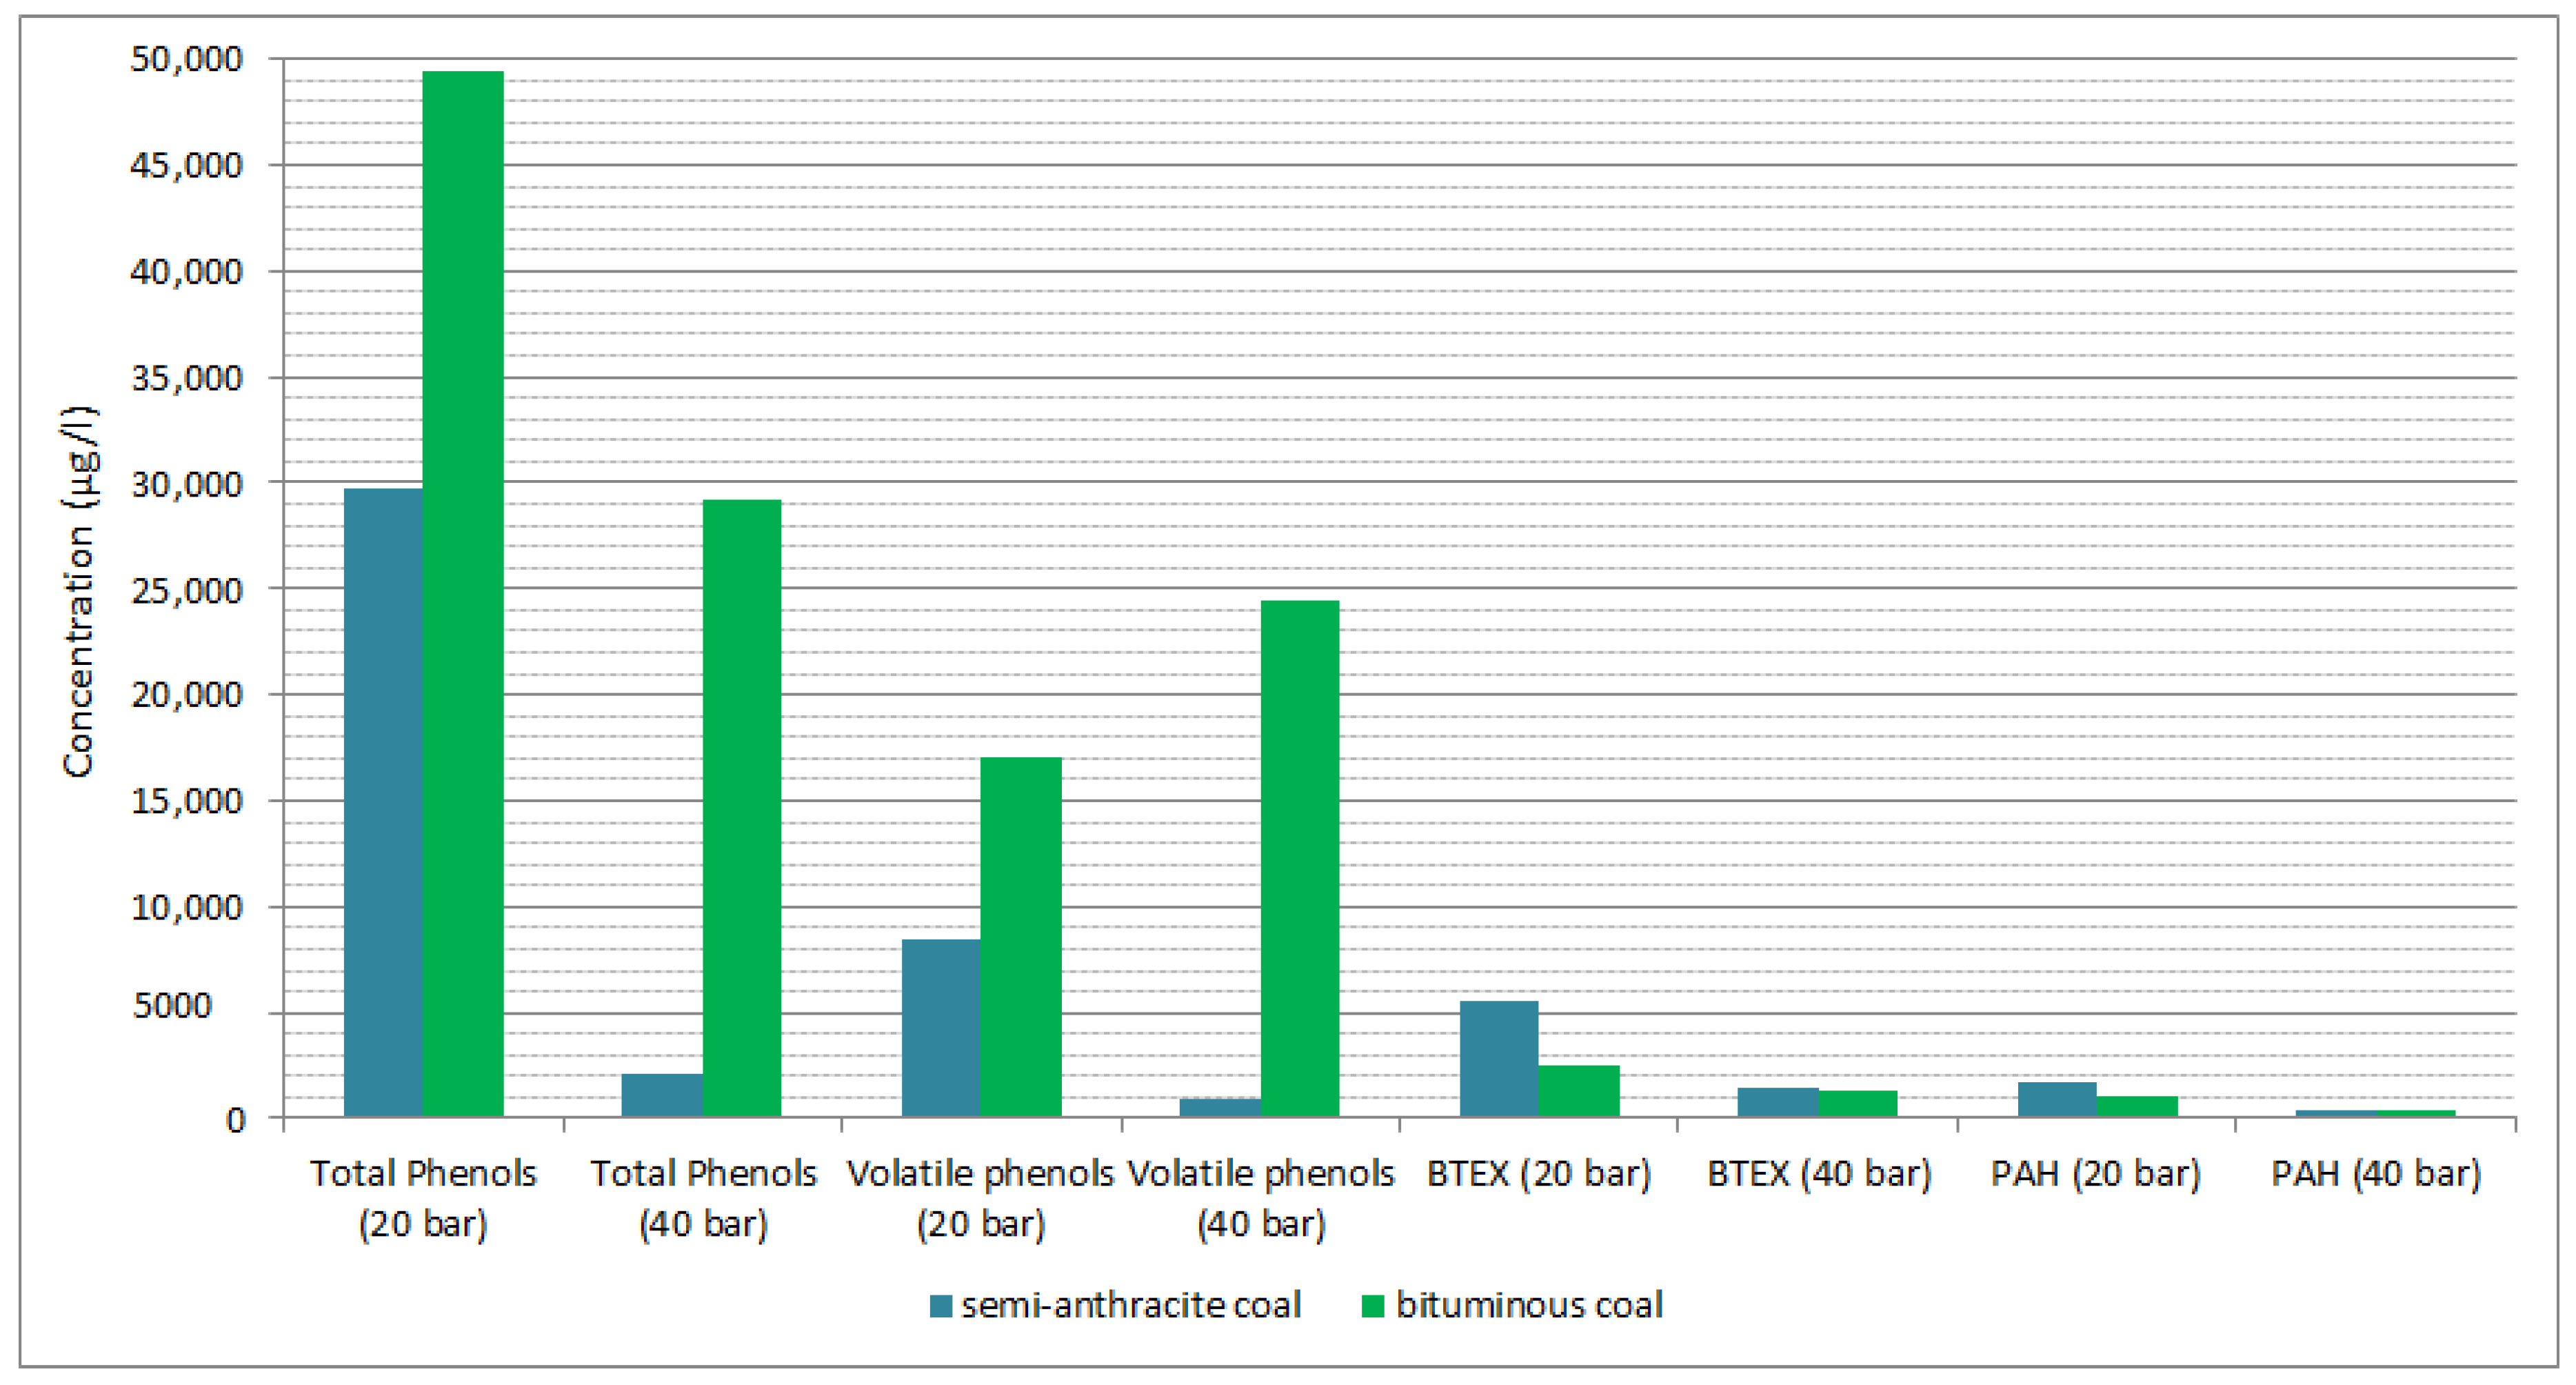
3.2. Effect of Gasification Pressure

The conducted studies revealed some dependencies between coal gasification pressure and physicochemical composition of analysed post-processing water samples. It was observed that pressure affects such parameters as chloride and sulphate concentrations. As can be seen from Table 4 chloride release increases along with increasing pressure, especially for bituminous coal effluents, where chlorides levels were 29.18 mg/L and 45.94 mg/L for 20 and 40 bar respectively. The same situation occurs for sulphates concentrations. For 20 bar pressure sulphates levels were 33.5 mg/L for bituminous coal and 42.9 mg/L for semi-anthracite coal effluents. When process pressure increased to 40 bar, concentrations were also higher and were 47.7 mg/L and 53.0 mg/L for bituminous and semi-anthracite coal respectively.
Just as it was in the case of coal impact the impact of pressure is especially noticeable in the case of organic compounds such as phenols, BTEX and PAH. Comparison of selected wastewater organic contaminants from gasification of semi-anthracite and bituminous coal are presented in Figure 4.
The studies conducted have shown that concentrations of phenols decrease with increasing pressure. When gasification pressure was lower (20 bar) phenols concentrations were in the field of 29.7 mg/L and 49.46 mg/L for semi-anthracite and bituminous coal respectively. Whereas in the case of the high-pressure experiments, there was more than 10-fold decrease in phenols concentration for hard coal and almost halved decrease for bituminous coal, reaching values 2.14 mg/L and 29.25 mg/L respectively. This significant decrease in the concentration of phenols with the increase in gasification pressure resulted in a significant decrease in the value of CODCr parameter, which is strongly correlated with the concentration of phenols (Table 5). The same situation occurred with the BTEX values and with increasing pressure there were large decreases in BTEX concentrations. In the case of 20 bar hard coal gasification process, the average BTEX values in the studied effluents were 5483.1 µg/L, while for the high-pressure 40 bar process these values decreased more than threefold to 1496.7 µg/L. For effluents from bituminous coal gasification, the decrease was slightly lower, with BTEX values of 2514.2 µg/L at 20 bar and 1354.4 µg/L at 40 bar, respectively. The effect of pressure was also observed for PAH levels. As the pressure increases, there is a large decrease in PAH concentration in the studied wastewater samples from all four experiments. In the case of semi-anthracite coal experiment there is a decrease from 1658.0 µg/L to 362 µg/L. In the case of bituminous coal the difference is also significant, for the 20 bar experiment the PAH value was 1090.3 µg/L while for the 40 bar experiment the average value was 407.2 µg/L. For all discussed organic compounds groups the same dependence occurs, with the increase of pressure their concentration in the studied effluents decreases. It can be explained by volatility of these compounds. At lower pressure more of them are dissolved in the water phase. However, as the pressure increases, a greater release of the compounds into UCG gas takes place.

3.3. Pearson’s Correlation Analysis

Correlation analysis (Table 5) showed a strong relationship between the conductivity of the studied effluents and the level of ammonia nitrogen. The Pearson’s correlation coefficient was 0.99 which indicates an almost linear relationship between these two parameters for all four gasification experiments. Furthermore, correlation analysis showed a very strong relationship between three parameters: phenols, volatile phenols and CODcr. The correlation coefficients were 0.87 and 0.75 for CODCr—phenols volatile and CODCr—total phenols respectively. On the other hand, correlation analysis showed no significant dependence between CODCr parameter and other toxic organic compounds concentrations such as BTEX or PAH. Although high toxicity of these compounds, the general toxicity of gasification wastewater is mainly determined by concentration of phenols [17]. The main reason for this may be the levels of BTEX and PAH concentrations, which are several times and in some cases even several dozen times lower than the levels of phenols. For metals and metalloids no significant correlations were observed. This can be explained by the low concentrations levels in studied wastewater samples. Only for Se correlation analysis showed a high correlation coefficient between Se and conductivity (r = 0.87), Se and NH4+ (r = 0.83) and Se—volatile phenols (r = 0.83).

4. Conclusions

The studies conducted revealed that the type of coal used and gasification pressure have a significant impact on the wastewater parameters. The conducted studies on the gasification effluents revealed significant relationships between the physicochemical composition of the wastewater and the coal properties as well as the gasification pressure. Regarding the impact of the used coal, influence on parameters such as pH and chloride can be observed. The pH of the obtained water samples was slightly higher for the semi-anthracite coal, whereas chloride levels were higher for effluents from gasification of bituminous coal. The water samples from bituminous coal gasification showed significantly higher levels of COD parameter. The studied water samples were characterised by a high concentration of organic compounds, therefore the strongest impact is noticeable in the case of these pollutants, especially volatile phenols, phenols, BTEX and PAH. Concentrations of volatile phenols and phenols were much higher for bituminous coal. However, for the BTEX and PAH levels, the opposite situation was observed and higher concentrations were in the case of wastewater from gasification of semi-anthracite coal. Gasification pressure has also noticeable impact on the composition of obtained gasification wastewater. As can be seen from the presented data, there is a greater release of chlorides along with increasing pressure, especially in the case of bituminous coal. The same situation also occurs for sulphates concentrations. As well as for the impact of the coal type, gasification pressure impact is the most significant in the case of organic compounds. As has been shown, their concentrations are inversely proportional to the gasification pressure. The conducted analysis showed that among the three main groups of organic pollutants: phenols, BTEX and PAHs, phenols were present at the highest concentrations. Therefore, it can be assumed that phenolic compounds will have the greatest impact on the toxicity level of the tested UCG wastewater. Correlation analysis showed also a strong relationship between the conductivity of the studied water samples and the level of ammonia nitrogen. The Pearson’s correlation coefficient for these two parameters was 0.99 which indicates an almost linear relationship between them. The conducted research has shown that the composition of mineral matter of raw coals does not directly affect the composition of the UCG wastewater. This is because the concentrations of metals and metalloids are strongly pH dependent. Therefore, the composition of the obtained wastewater is determined mainly by organic pollutants derived from tars, which are generated in the gasification process. The conducted research has shown that UCG wastewater contains many hazardous pollutants and requires the selection of an appropriate treatment method, for example, such as for coking wastewater. The presented results can help in the development of an appropriate UCG wastewater treatment strategy depending on the coal used and gasification parameters.

Author Contributions

M.P.-S.: Conceptualization, Writing—original draft; K.K.: Conceptualization, Methodology, Project Administration, Funding Acquisition; W.B.: Experiments, Visualization; K.S.: Writing—review and editing, Visualization. All authors have read and agreed to the published version of the manuscript.

Funding

This work was a part of the MEGAPlus project supported by the EU Research Fund for Coal Steel, under the Grant Agreement number 800774—MEGAPlus—RFCS-2017 and Polish Ministry of Science and Higher Education under Grant Agreement No. 3996/FBWiS/2018/2.

Institutional Review Board Statement

Not applicable.

Informed Consent Statement

Not applicable.

Data Availability Statement

Supplementary data associated with this article can be found in the online version at https://doi.org/10.3390/en13061334 (accessed on 10 October 2021).

Conflicts of Interest

The authors declare no conflict of interest.

References

  1. Kapusta, K.; Wiatowski, M.; Stańczyk, K.; Zagorscak, R.; Thomas, H.R. Large-scale experimental investigations to evaluate the feasibility of producing methane-rich gas (SNG) through under-ground coal gasification process. Effect of coal rank and gasification pressure. Energies 2020, 13, 1334. [Google Scholar] [CrossRef] [Green Version]
  2. Knapp, R. Environmental challenges for the global coal industry. World Coal Institute, Coal/ Power Focus. Asian J. Min. 2000, 208, 15–18. [Google Scholar]
  3. Chen, L.; Li, C.; Xu, B.; Xing, B.; Yi, G.; Huang, G.; Zhang, C.; Liu, J. Microbial degradation of organic pollutants in groundwater related to underground coal gasification. Energy Sci. Eng. 2019, 7, 2098–2111. [Google Scholar] [CrossRef] [Green Version]
  4. Balat, M. Status of Fossil Energy Resources: A Global Perspective. Energy Sources Part B Econ. Plan. Policy 2007, 2, 31–47. [Google Scholar] [CrossRef]
  5. Kapusta, K.; Stańczyk, K. Pollution of water during underground coal gasification of hard coal and lignite. Fuel 2011, 90, 1927–1934. [Google Scholar] [CrossRef]
  6. Xu, M.; Xin, L.; Liu, W.; Hu, X.; Cheng, W.; Li, C.; Wang, Z. Study on the physical properties of coal pyrolysis in underground coal gasification channel. Powder Technol. 2020, 376, 573–592. [Google Scholar] [CrossRef]
  7. Wiatowski, M.; Kapusta, K. Evolution of tar compounds in raw gas from a pilot-scale underground coal gasification (UCG) trial at Wieczorek mine in Poland. Fuel 2020, 276, 118070. [Google Scholar] [CrossRef]
  8. Bhutto, A.; Bazmi, A.; Zahedi, G. Underground coal gasification: From fundamentals to applications. Prog. Energy Combust. Sci. 2013, 39, 189–214. [Google Scholar] [CrossRef]
  9. Khadse, A.; Qayyumi, M.; Mahajani, S.; Aghalayam, P. Underground coal gasification: A new clean coal utilization technique for India. Energy 2007, 32, 2061–2071. [Google Scholar] [CrossRef]
  10. Pankiewicz-Sperka, M.; Stańczyk, K.; Płaza, G.; Kwaśniewska, J.; Nałęcz-Jawecki, G. Assessment of the chemical, microbiological and toxicological aspects of post-processing water from under-ground coal gasification. Ecotoxicol. Environ. Saf. 2014, 108, 294–301. [Google Scholar] [CrossRef]
  11. Yang, D.; Koukouzas, N.; Green, M.; Sheng, Y. Recent development on underground coal gasifica-tion and subsequent CO2 storage. J. Energy Inst. 2016, 89, 469–484. [Google Scholar] [CrossRef]
  12. Perkins, G. Underground coal gasification. Part I: Field demonstrations and proces performance. Prog. Energy Combust. Sci. 2018, 67, 158–187. [Google Scholar] [CrossRef]
  13. Wiatowski, M.; Kapusta, K.; Świądrowski, J.; Cybulski, K.; Ludwik-Pardała, M.; Grabowski, J.; Stańczyk, K. Technological aspects of underground coal gasification in the Experimental “Barbara” Mine. Fuel 2015, 159, 454–462. [Google Scholar] [CrossRef]
  14. Shafirovich, E.; Varma, A. Underground Coal Gasification: A Brief Review of Current Status. Ind. Eng. Chem. Res. 2009, 48, 7865–7875. [Google Scholar] [CrossRef]
  15. Kopyscinski, J.; Schildhauer, T.J.; Biollaz, S.M. Production of synthetic natural gas (SNG) from coal and dry biomass–A technology review from 1950 to 2009. Fuel 2010, 89, 1763–1783. [Google Scholar] [CrossRef]
  16. van der Meijden, C.M.; Veringa, H.J.; Rabou, L.P. The production of synthetic natural gas (SNG): A comparison of three wood gasification systems for energy balance and overall efficiency. Biomass-Bioenergy 2010, 34, 302–311. [Google Scholar] [CrossRef]
  17. Kapusta, K.; Stańczyk, K. Chemical and toxicological evaluation of underground coal gasification (UCG) effluents. The coal rank effect. Ecotoxicol. Environ. Saf. 2015, 112, 105–113. [Google Scholar] [CrossRef] [PubMed]
  18. Strugała –Wilczek, A.; Basa, W.; Kapusta, K.; Soukup, K. In situ sorption phenomena can mitigate potential negative environmental effects of underground coal gasification (UCG)—An experimental study of phenol removal on UCG-derived residues in the aspect of contaminant retardation. Eco-Toxicol. Environ. Saf. 2021, 208, 111710. [Google Scholar] [CrossRef] [PubMed]
  19. Grabowski, J.; Korczak, K.; Tokarz, A. Aquatic risk assessment based on the results of research on mine waters as a part of a pilot underground coal gasification process. Process. Saf. Environ. Prot. 2020, 148, 548–558. [Google Scholar] [CrossRef]
  20. Smoliński, A.; Stańczyk, K.; Kapusta, K.; Howaniec, N. Chemometric study of the ex situ under-ground coal gasification wastewater experimental data. Water Air Soil Pollut. 2012, 223, 5745–5758. [Google Scholar] [CrossRef] [Green Version]
  21. Bryant, C.W.; Cawein, C.C.; King, P.H. Biological Treatability of In Situ Coal Gasification Wastewater. J. Environ. Eng. 1988, 114, 400–414. [Google Scholar] [CrossRef]
  22. Zhang, W.; Ma, J.; Yang, S.; Zhang, T.; Li, Y. Pretreatment of Coal Gasification Wastewater by Acidification Demulsion. Chin. J. Chem. Eng. 2006, 14, 398–401. [Google Scholar] [CrossRef]
  23. Shi, J.; Han, Y.; Xu, C.; Han, H. Biological coupling process for treatment of toxic and refractory compounds in coal gasification wastewater. Rev. Environ. Sci. Bio/Technol. 2018, 17, 765–790. [Google Scholar] [CrossRef]
  24. Thomas, M.; Zdebik, D.; Niewiara, E. Removing Phenols from Post-Processing Wastewater Originating from Underground Coal Gasification Using Coagulation-Flocculation and the H2O2/UV Process. Pol. J. Environ. Stud. 2018, 27, 2757–2763. [Google Scholar] [CrossRef]
  25. Zhang, G.; Wan, X.; Li, W.; Yang, Y.; Wang, L. Advanced treatment of coal gasification wastewater by catalytic oxidation with trace ozone. Chin. J. Environ. Eng. 2013, 7, 263–267. [Google Scholar]
  26. Oller, I.; Malato, S.; Sánchez-Pérez, J.A. Combination of Advanced Oxidation Processes and bio-logical treatments for wastewater decontamination—A review. Sci. Total. Environ. 2011, 409, 4141–4166. [Google Scholar] [CrossRef]
  27. Li, P.; Ailijiang, N.; Cao, X.; Lei, T.; Liang, P.; Zhang, X.; Huang, X.; Teng, J. Pretreatment of coal gasification wastewater by adsorption using activated carbons and activated coke. Colloids Surf. A: Physicochem. Eng. Asp. 2015, 482, 177–183. [Google Scholar] [CrossRef]
  28. Priyadharshini, S.; Bakthavatsalam, A. A comparative study on growth and degradation behavior of C. pyrenoidosa on synthetic phenol and phenolic wastewater of a coal gasification plant. J. Environ. Chem. Eng. 2019, 7, 103079. [Google Scholar] [CrossRef]
  29. Oberoi, A.S.; Philip, L. Performance evaluation of attached biofilm reactors for the treatment of wastewater contaminated with aromatic hydrocarbons and phenolic compounds. J. Environ. Chem. Eng. 2017, 5, 3852–3864. [Google Scholar] [CrossRef]
  30. Wang, W.; Han, H.; Yuan, M.; Li, H.; Fang, F.; Wang, K. Treatment of coal gasification wastewater by a two-continuous UASB system with step-feed for COD and phenols removal. Bioresour. Technol. 2011, 102, 5454–5460. [Google Scholar] [CrossRef] [PubMed]
Figure 1. Schematic view of the ex-situ high pressure UCG installation. Reproduced from K. Kapusta et al. [1]. (1) reagent supply system, (2) gasification reactor, (3) tar sampling point, (4) water scrubber—wastewater sampling point, (5) air cooler for process gas, (6,7) gas separators, (8) thermal combustor, (9) gas purification module for GC analysis.
Energies 14 06533 g001
Figure 2. Water scrubber—wastewater sampling point.
Energies 14 06533 g002
Figure 3. Concentrations of selected organic contaminants in wastewater from gasification experiments—coal type impact.
Energies 14 06533 g003
Figure 4. Comparison of selected wastewater organic contaminants from gasification of semi-anthracite and bituminous coal—pressure impact ((s)—semi-anthracite coal; (b)—bituminous coal).
Energies 14 06533 g004
Table 1. Characteristics of coals used for the UCG experiments.
Coal
Parameter“Six-Feet” Semi-Anthracite“Wesoła” Bituminous
As received
Total Moisture Wtr, %1.15 ± 0.403.60 ± 0.40
Ash Atr, %4.61 ± 0.308.74 ± 40
Volatiles Vr, %9.92 ± 0.1227.67 ± 0.50
Total Sulphur Str, %1.55 ± 0.040.31 ± 0.02
Calorific value Qir, kJ/kg33,416 ± 22028,798 ± 200
Analytical
Moisture Wa, %0.84 ± 0.302.18 ± 0.27
Ash Aa, %4.62 ± 0.308.87 ± 0.63
Volatiles Va, %9.95 ± 0.1328.08 ± 0.92
Combustion Heat Qsa, kJ/kg34,414 ± 22830,317 ± 161
Calorific value Qia, kJ/kg33,527 ± 22129,258 ± 201
Total Sulphur Sa, %1.55 ±0.040.31 ± 0.08
Carbon Cta, %87.31 ± 0.6675.35 ± 1.13
Hydrogen Hta, %3.97 ± 0.284.61 ±0.40
Nitrogen Na, %1.29 ± 0.121.20 ± 0.22
Oxygen Oda, %0.50 ± 0.057.65 ± 0.1
Specific Gravity, g/cm31.35 ± 0.0281.40 ±0.018
Vitrinite reflectance, Ro, %1.67 ± 0.030.91 ± 0.03
Vitrinite, V, vol.%72 ± 659 ± 6
Liplinite, L, vol.%0 ± 16 ± 4
Inertinite, I, vol.%28 ± 335 ± 7
Mineral matter, MM, vol.%2 ± 14 ± 3
Table 2. Concentrations of metals and metalloids in raw coals.
Element“Six-Feet” Semi-Anthracite“Wesoła” Bituminous
mg/kg (ppm)
As100
B1418
Cd01
Co100.5
Cr730.3
Cu2513
Hg0.220.02
Mn218357
Mo40.1
Ni522.6
Pb270.8
Sb170.4
Se02.2
Zn148.1
% mass
Al1.050.07
Fe1.041.43
K0.090.002
Ti0.040.001
Table 3. General summary of UCG experiments [1].
Coal TypeSemi-Anthracite “Six Feet” (South Wales, UK)Semi-Anthracite “Six Feet” (South Wales, UK)Bituminous “Wesoła” Coal (Upper Silesia, Poland)Bituminous “Wesoła” Coal (Upper Silesia, Poland)
Gasification ReagentO2/H2OO2/H2OO2/H2OO2/H2O
Gasification Pressure, bar20402040
Experiment duration96969696
Average Gas Production Rate, Nm3/h9.09.49.39.4
Gas Yield, Nm3/kg of coal consumed1.981.981.771.70
Gas calorific value, Q, MJ/Nm311.712.19.210.4
Coal gasified, kg436.1455.5504.0530.2
Total wastewater production, kg46.538.667.355.2
Table 4. Average values of physicochemical parameters determined in the UCG effluents from semi-anthracite and bituminous coal experiments.
ParametersUnitSemi-Anthracite CoalBituminous Coal
20 Bar40 Bar20 Bar40 Bar
pHpH6.45.25.34.9
ConductivityµS/cm1228.38253.389421006.71
CODCrmg/L O2151.6348.63322.71185.91
Ammonia nitrogenmg/L N160.1111.6896.4195.74
Chloridesmg/L11.1511.6829.1845.94
Cyanidesmg/L1.111.431.70.87
Total phenols volatilemg/L8.450.8717.0424.46
Sulphatesmg/L33.5147.6642.8652.97
Sulphidesmg/L1.040.040.970.02
Mnmg/L0.0170.0210.0180.012
Femg/L0.8230.2840.1310.245
Sbmg/L0.0360.1210.0640.013
Asmg/L0.036<0.02<0.01<0.01
Bmg/L0.0720.0560.1300.252
Crmg/L0.0130.0120.0100.006
Znmg/L0.0210.4990.3200.200
Almg/L0.0310.0460.0290.023
Cdmg/L<0.00050.001<0.0005<0.0005
Comg/L0.0040.003<0.003<0.003
Cumg/L0.0050.0100.0090.002
Momg/L0.005<0.0050.026<0.005
Nimg/L0.0980.3120.0510.027
Pbmg/L<0.0050.0640.0460.060
Hgmg/L<0.0005<0.0005<0.0005<0.0005
Semg/L0.0160.0170.0360.027
Timg/L<0.00050.0010.001<0.0005
Total BTEXµg/L5483.131496.732514.321354.37
Including benzeneµg/L4156.081341.432196.751059.07
Total PAHµg/L1657.98361.991090.34407.2
Including Naphthaleneµg/L1321.25320.88905305.74
Total Phenolsmg/L29.732.1449.4629.25
Table 5. Pearson correlation matrix—results of the linear correlation analysis of physicochemical parameters of UCG wastewater.
pHCond.CODCrNH4+ClCNVolatile PhenolsSO42−S2−FeBZnAlNiPbSeBTEXPAHPhenols
pH1.00
Cond.0.551.00
CODCr0.200.561.00
NH4+0.630.990.531.00
Cl−0.57−0.070.23−0.161.00
CN0.190.000.190.02−0.111.00
Volatile phenols0.390.770.870.750.070.181.00
SO42−−0.640.050.10−0.020.33−0.140.041.00
S2−0.310.440.130.46−0.140.020.150.131.00
Fe−0.10−0.15−0.14−0.16−0.030.04−0.150.040.061.00
B−0.160.590.570.520.41−0.250.650.40−0.07−0.131.00
Zn−0.57−0.55−0.44−0.56−0.02−0.02−0.460.30−0.34−0.20−0.191.00
Al−0.49−0.18−0.13−0.230.280.24−0.100.59−0.21−0.060.020.531.00
Ni−0.26−0.28−0.35−0.27−0.170.23−0.280.34−0.070.45−0.240.500.661.00
Pb−0.71−0.30−0.15−0.350.36−0.33−0.220.60−0.21−0.040.220.580.580.381.00
Se0.350.870.610.830.090.030.830.140.25−0.100.66−0.41−0.11−0.25−0.141.00
BTEX0.350.210.180.22−0.160.350.21−0.200.450.66−0.21−0.50−0.210.16−0.440.161.00
PAH0.370.630.310.64−0.07−0.120.320.150.89−0.090.16−0.50−0.25−0.28−0.240.370.351.00
Phenols0.430.670.750.66−0.090.310.83−0.060.34−0.080.38−0.53−0.18−0.32−0.340.630.390.501.00
Publisher’s Note: MDPI stays neutral with regard to jurisdictional claims in published maps and institutional affiliations.

