Article

Chiller Optimization Using Data Mining Based on Prediction Model, Clustering and Association Rule Mining

1
Graduate Institute of Precision Manufacturing, National Chin-Yi University of Technology, Taichung 41170, Taiwan
2
Refrigeration, Air Conditioning and Energy Engineering Department, National Chin-Yi University of Technology, Taichung 41170, Taiwan
*
Author to whom correspondence should be addressed.
Energies 2021, 14(20), 6494; https://doi.org/10.3390/en14206494
Submission received: 24 August 2021 / Revised: 1 October 2021 / Accepted: 5 October 2021 / Published: 11 October 2021
(This article belongs to the Special Issue Big Data and Advanced Analytics in Energy Systems and Applications)

Abstract

:
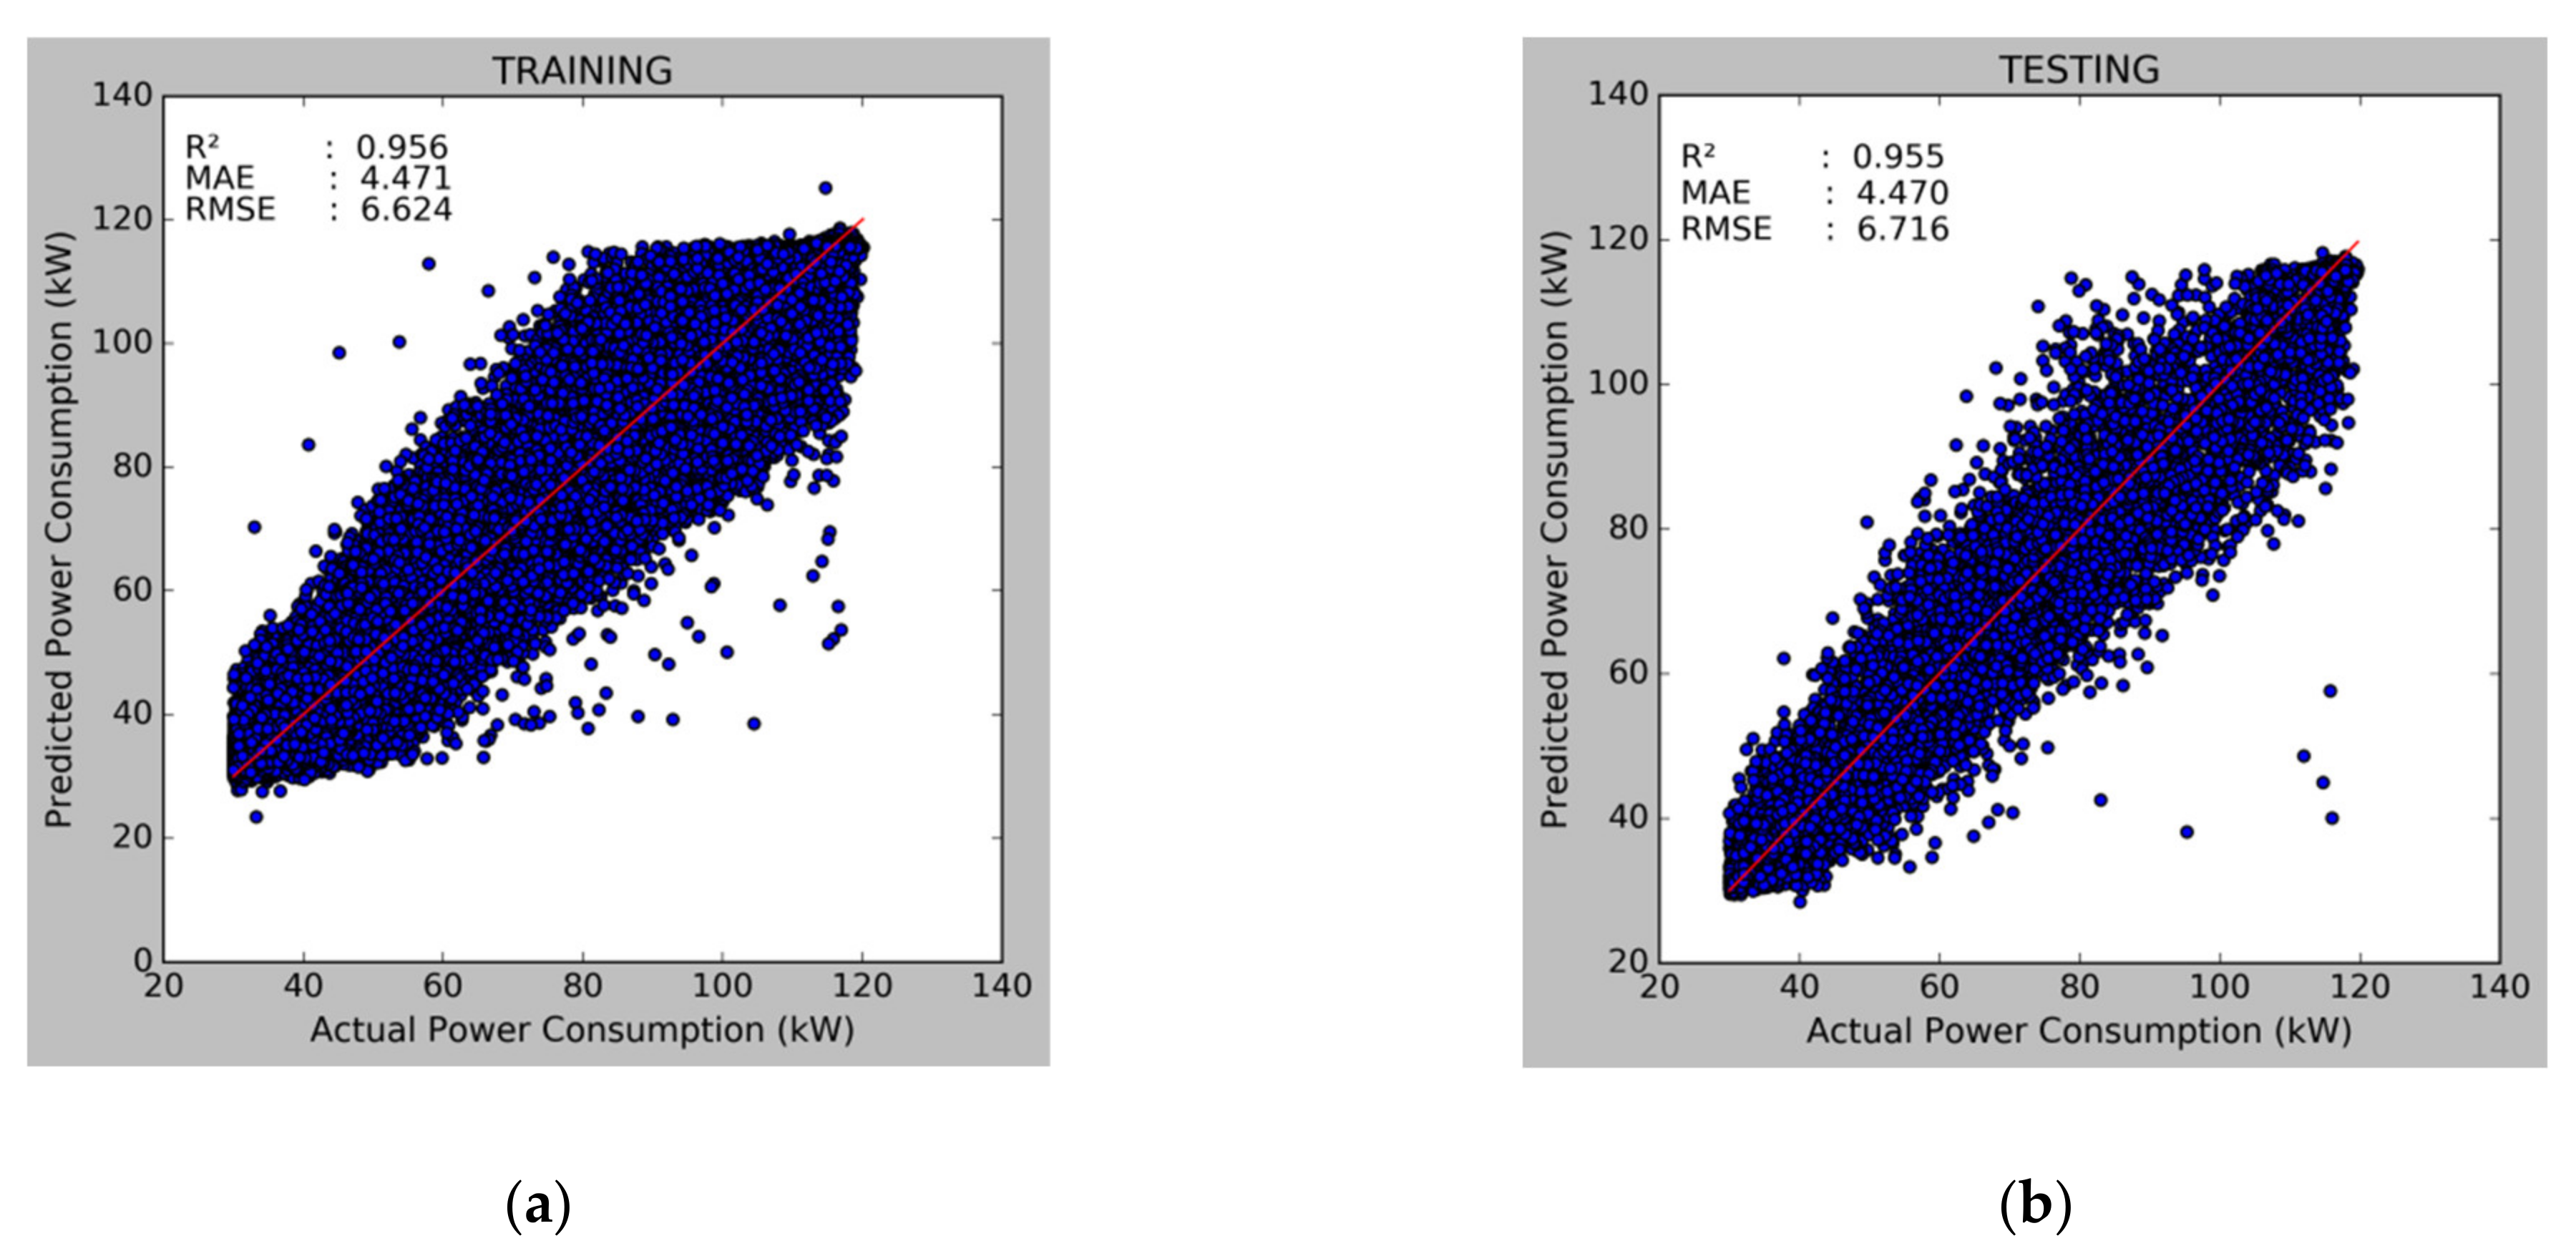
The chiller is the major energy consuming HVAC component in a building. Currently, huge chiller data is easy to obtain due to Internet of Things (IoT) technology development. In order to optimize the chiller system, this study presents a data mining technique that utilizes the available chiller data. The data mining techniques used are prediction model, clustering analysis, and association rules mining (ARM) analysis. The dataset was collected every minute for a year from a water-cooled chiller at an institutional building in Taiwan and from meteorological data. The power consumption prediction model was built using deep neural networks with 0.955 of R 2 , 4.470 of MAE, and 6.716 of RMSE. Clustering analysis was performed using the k-means algorithm and ARM analysis was performed using Apriori algorithm. Each cluster identifies those operational parameters that have strong association rules with high performance. The operational parameters from ARM were simulated using the prediction model. The simulation result shows that the ARM operational parameters can successfully save the energy consumption by 22.36 MWh or 18.17% in a year.

1. Introduction

Heating, ventilating, and air conditioning (HVAC) systems are needed for human thermal comfort and industrial processes [1]. However, it consumes approximately 45% of building sector energy [2]. The chiller is the major energy consumer consuming 25–40% of the total amount of building energy consumption [3,4,5]. Therefore, chiller system optimization is essential to reduce energy consumption [6].
Currently, huge chiller data is easy to obtain due to Internet of Things (IoT) technology development [6]. The data must be utilized properly by analyzing it to improve energy efficiency [7]. Data mining (DM) is an advanced, promising technology to solve complex dataset problem [8,9]. In general, there are two types of data mining, i.e., predictive data mining (PDM) and descriptive data mining (DDM). PDM is also known as supervised learning, a learning technique where the program is given labeled data. It identifies the relationship between the input and output variables. Meanwhile, DDM is also known as unsupervised learning, a learning technique where the program is given unlabeled data. It discovers the patterns and association relationships among the data variables [10,11].
The DM technique has been successfully applied in various fields, such as healthcare [12,13], manufacturing [14,15,16], financial [17,18], telecommunication [19,20], etc. The DM techniques are also applied in buildings. Xiao et al. [21] improved the building operational performance using DM techniques based on clustering and ARM for analyzing the large building automation system (BAS) dataset. There are four interesting rules used to improve building performance. The results show that the DM technique is valuable for knowledge discovery in the BAS dataset. Qiu et al. [22] used DM techniques to identify the rules for buildings. There are three case studies, with two of them implemented in chiller systems. Based on those two references about DM techniques in buildings, it was revealed that most of the interesting rules for buildings came from HVAC systems; especially chiller systems.
Some researchers also applied DM techniques to specific HVAC systems, usually carried out for prediction [4], pattern identification [8], optimization [23], fault detection and diagnosis (FDD) [24,25], and performance assessment [26]. One of the most powerful DM tools is the association rule mining (ARM) method, used to analyze numerous data to identify the interesting rules in the database. Li et al. [8] identified variable refrigerant flow (VRF) energy consumption patterns under various part loads and refrigerant charge conditions using clustering and ARM. The results can be used to estimate energy saving potential. Zhang et al. [11] revealed HVAC system operational problems using an improved ARM-based method. The results show that the proposed data preprocessing approaches are effective in outlier identification and data transformation. Guo et al. [27] presented the optimized neural network for VRF system fault diagnosis in heating mode using the ARM method. The results show that ARM method is feasible to optimize the feature sets for fault diagnosis. The references above revealed that the ARM is successfully used in HVAC systems. Several studies combined the ARM with clustering analysis to identify the pattern. The ARM and clustering analysis are types of DDM. The k-means algorithm was often used to perform the clustering analysis and the Apriori algorithm was often used to perform the ARM analysis. Since the ARM can only handle the categorical data, clustering analysis is required in advance to group or cluster the dataset [6,8,9,21].
Besides DDM, PDM is also widely used for HVAC systems, especially chiller systems. The power consumption prediction model based on neural networks is a type of PDM that can be implemented to evaluate the chiller performance in advanced control and optimization. Nisa et al. [4] predict chiller power consumption using neural network model and thermodynamic model. The result indicates that neural network is more accurate than the thermodynamic model. Sha et al. [28] predicted chiller energy consumption based on degree day. The support vector regression (SVR), and artificial neural network (ANN) have better performance than multivariable linear regression (MLR). Moreover, Alizadeh et al. [29] proposed a method to build an ensemble of surrogates (EoS) that is both accurate and less computationally expensive. The results show that EoS is accurate than individual surrogates even when fewer data points are used, so computationally efficient with relatively insensitive predictions.
The chiller system optimization using data mining has been carried out. Wang et al. [23] proposed a data-mining powered event-driven optimal control (EDOC) for improving the optimal control of the chiller system. The results can improve the energy-saving percentage by 0.9–4.6% compared with the traditionally used time-driven optimal control strategy. Zhou et al. [6] optimized the chiller plant operational parameters to improve its operating efficiency based on ARM. The simulation results show that the chiller energy consumption is reduced after optimization by 11.60% in summer and 13.33% in winter. Revising operational parameters is one way to improve system performance which requires a detailed energy audit involving extensive expertise and manual analyses. Unfortunately, manual analysis can miss important information and consume a lot of time. Otherwise, the DM technique provides a deeper understanding of the chiller operational parameter, leading to more energy-saving opportunities [23].
The above references show that the ARM and clustering analysis combination was successfully implemented to identify interesting rules or patterns from HVAC systems, where it has great potential for chiller optimization. Meanwhile, neural networks can be used to predict chiller power consumption. Although data mining techniques are successfully applied for chiller optimization, there are no research reports yet that simulate the ARM results using a prediction model for chiller power consumption based on a neural network. In fact, the neural network has high accuracy for prediction models and has great potential to simulate chiller power consumption. Therefore, this paper proposes chiller optimization using data mining based on a prediction model, clustering, and ARM analysis. The prediction model is built to predict power consumption based on operational parameters. Meanwhile, clustering analysis is required in advance to group or cluster the dataset. The clustering results will be used in ARM analysis to identify the interesting rules in the chiller database, finding the operational parameters that affect the high performance. When the operational parameters from the ARM result are obtained, the results will simulate using the prediction model to know if those new operational parameters can reduce the power consumption or not. The objectives of this paper are: (1) to build a chiller power consumption prediction model based on operational parameters, (2) to cluster the data for further use in ARM analysis, (3) to identify the interesting rules in the database and the operational parameters that affect the high performance using ARM analysis, and (4) simulate the operational parameters from ARM results using the prediction model.
This paper is organized as follows: Section 2 provides the framework for the proposed methodology, including the basic prediction model, clustering, and ARM analysis concepts; Section 3 demonstrates the experimental details including the parameter set up, results, and the discussions; Section 4 presents our conclusion and future works.

2. Methodology

The proposed methodology framework is illustrated in Figure 1. It generally consists of four steps: data collection, data preprocessing, data mining techniques, and simulation optimization. The details for each step are described below:

2.1. Data Collection

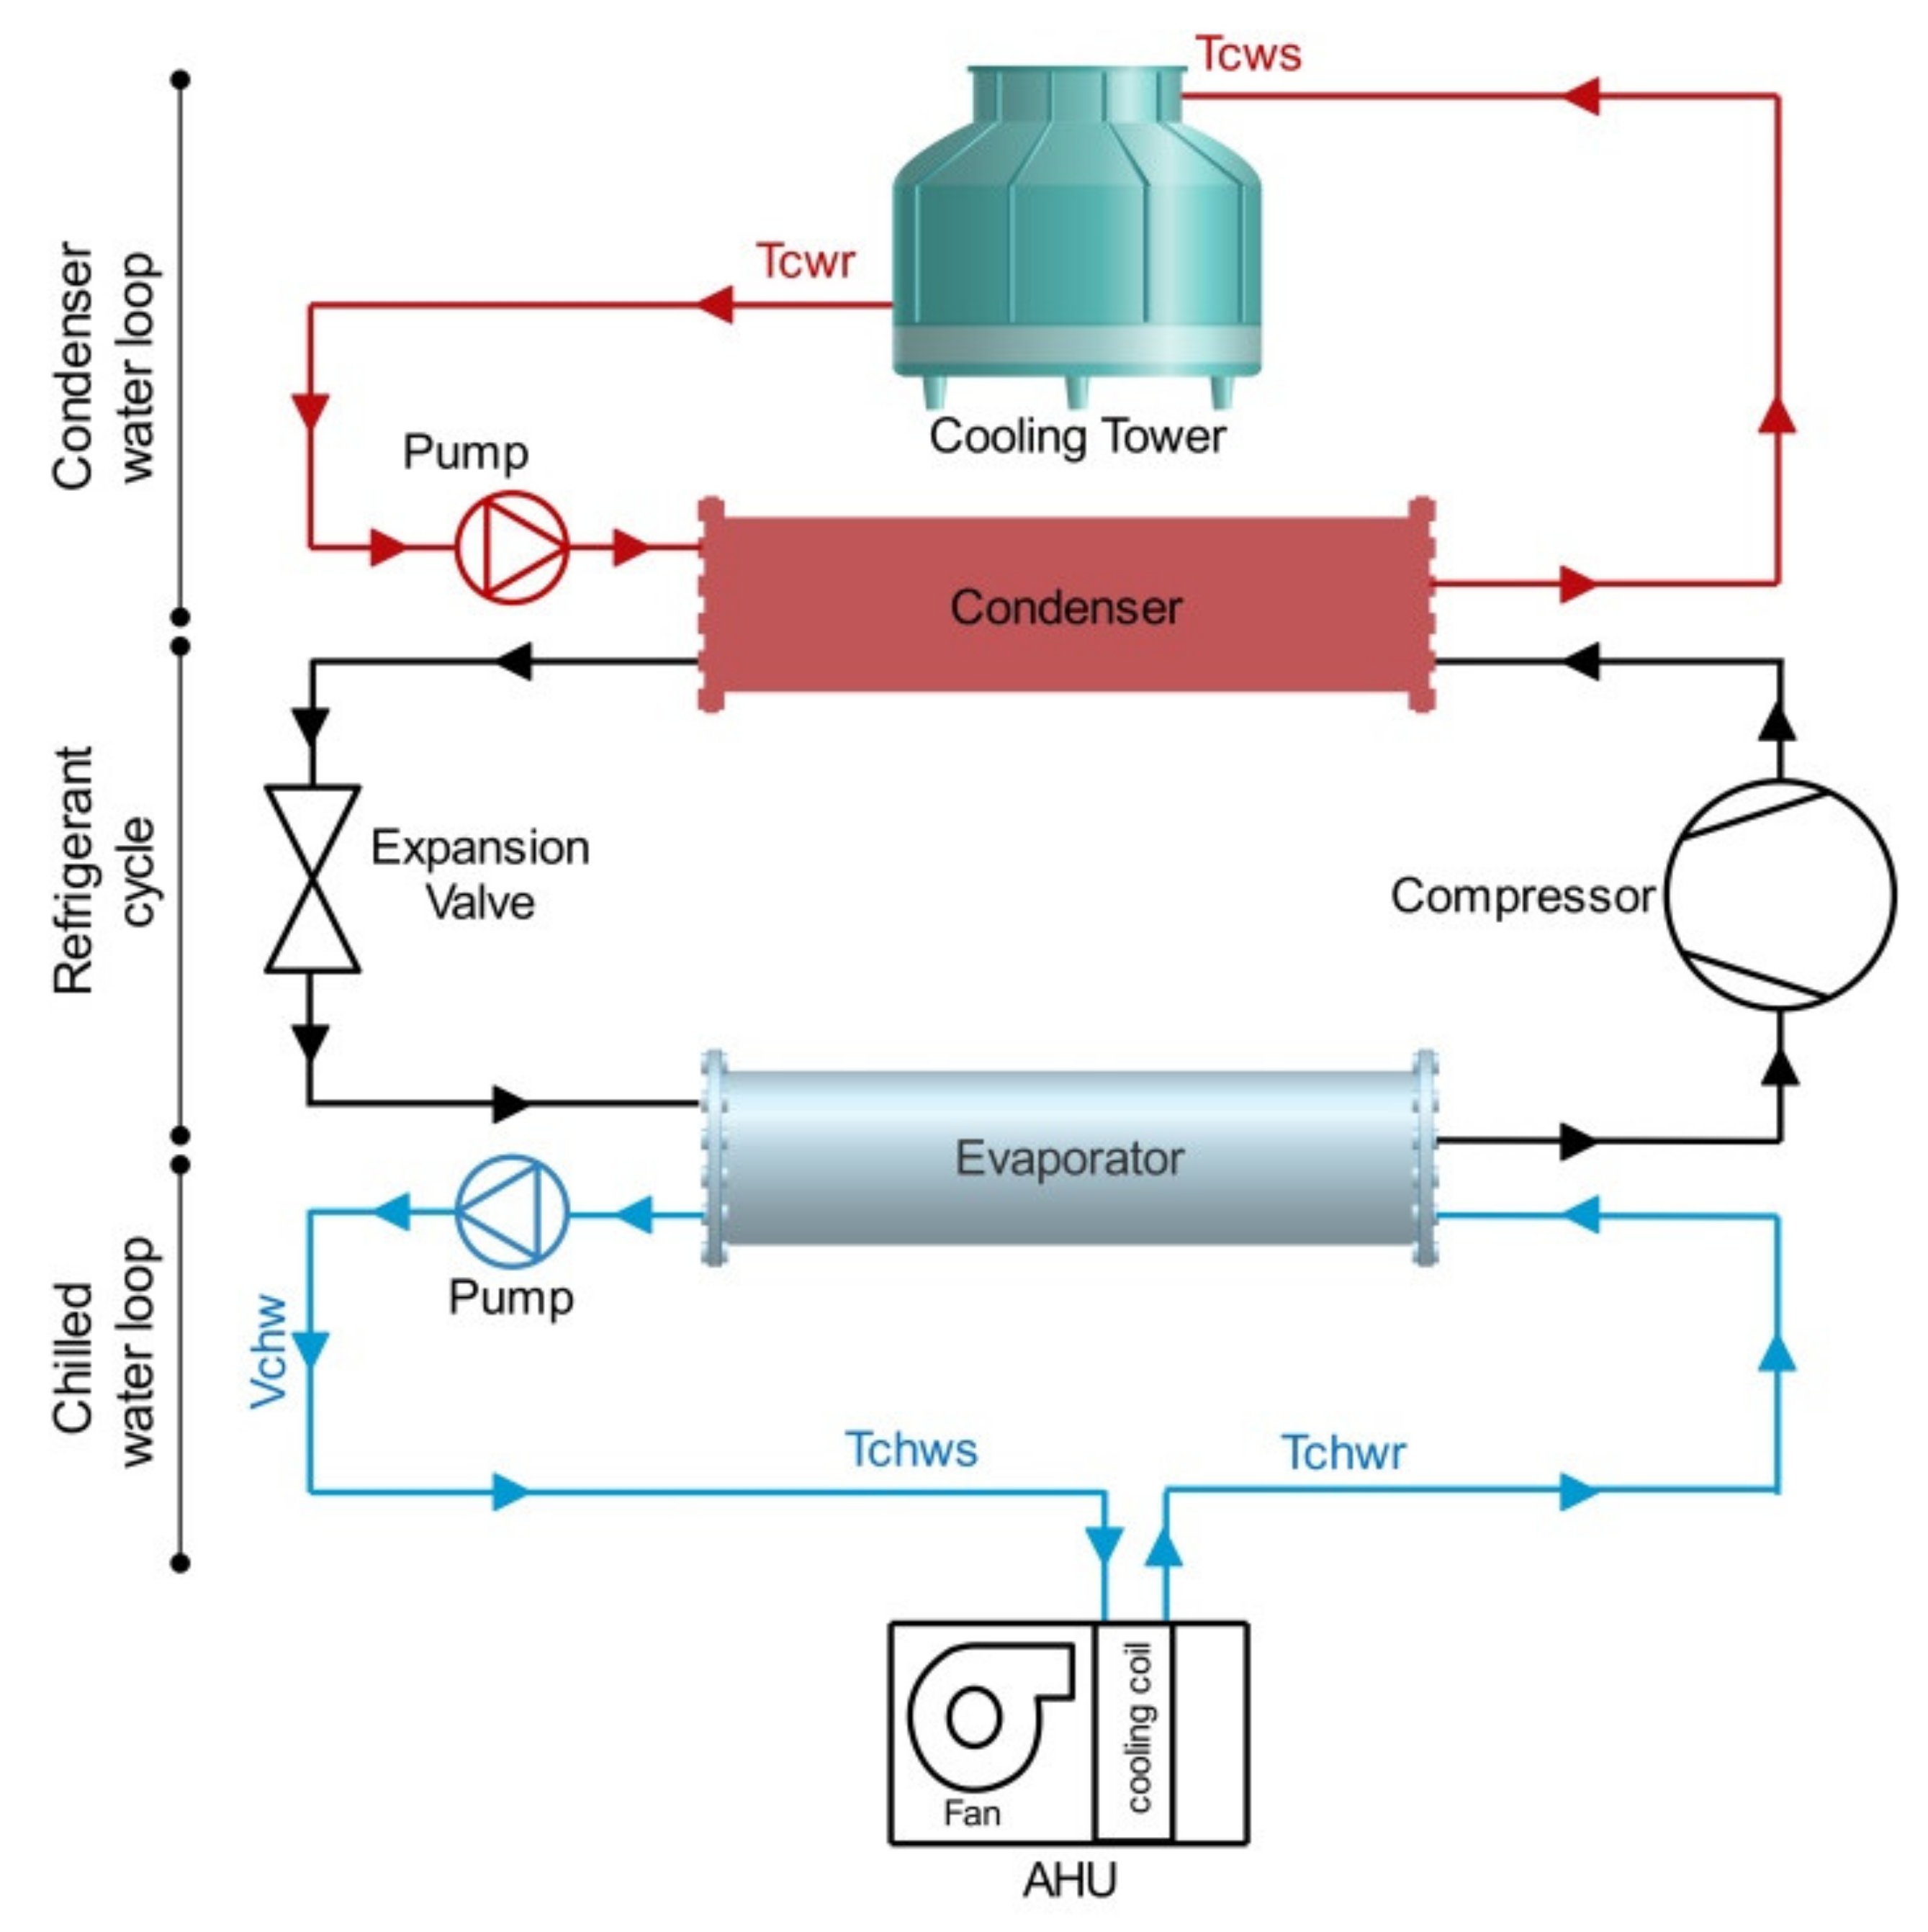
The dataset is collected from a water-cooled chiller system at an institutional building in Taiwan and from meteorological data collected every minute for a year. The water-cooled chiller is a part of the HVAC system that produces chilled water to transfer the heat from an internal environment to an external environment. It uses a cooling tower to transfer heat from the condenser into the atmosphere. The water-cooled chiller system diagram and the measurement points are shown in Figure 2. The figure consists of a refrigerant cycle and two kinds of heat transfer loops: a condenser water loop and an evaporator water loop. In the refrigerant cycle, the refrigerant flows into the compressor where it increases the refrigerant pressure and temperature. The hot vapor refrigerant from the compressor flows into the condenser where it transfers heat from the refrigerant into the condenser water which causes the refrigerant to condense from vapor form into liquid form. From the condenser, the liquid refrigerant flows into the expansion valve, where it causes a decrease in the liquid refrigerant temperature and pressure. The cold liquid refrigerant then moves into the evaporator. In the evaporator, the refrigerants gains heat from the evaporator water, causing the refrigerant to vaporize. The refrigerant vapor returns to the compressor to repeat the cycle. In the condenser water loop, the water absorbs heat from the refrigerant in the condenser. Hot water from the condenser is pumped into a cooling tower where water and air are allowed to come into contact with each other to decrease the hot water temperature. The cold water is then pumped back into the condenser. In the evaporator water loop, the water transfers heat into the refrigerant in the evaporator. The cold water from the evaporator is pumped into the cooling coil where it absorbs heat from the internal air environment. The water is then pumped back into the evaporator. The measured data from the chiller system are the chilled water flowrate ( V c h w ), chilled water supply temperature ( T c h w S ), chilled water return temperature ( T c h w R ), cooling water supply temperature ( T c w S ), cooling water return temperature ( T c w R ), and power consumption (P). Three data points were added, the cooling water temperature difference ( Δ T c w ) obtained from the difference between T c w R and T c w S , the chiller cooling capacity ( Q c ) and coefficient of performance (COP) are obtained using Equations (1) and (2).
Q c = V c h w   .   ρ   .   C p   .   T c h w r T c h w s  
C O P = Q c P
where ρ and C p are the water density and water specific heat. The weather affects the chiller energy consumption. Since outdoor temperature ( T o a ) and humidity ( R H o a ) sensors in the system area were not installed, those data were obtained from meteorological data where the sensor distance to the chiller system is about three kilometers.

2.2. Data Preprocessing

Data preprocessing is a crucial step before data is used in data mining techniques. The important things in data preprocessing used in this study are data cleaning, data splitting, and data scaling.

2.2.1. Data Cleaning

Data cleaning is implemented to remove or modify irrelevant or missing values. In a real case, it is not improbable that the data might contain inconsistent or incomplete data. The corrupted data causes poor or inaccurate results [30]. Therefore, data cleaning was applied in this study. There are 96,888 data points after applying data cleaning.

2.2.2. Data Splitting

For the prediction model, the data needs to be split randomly into three parts, 70% for training data, 15% for validation data, and 15% for testing data. Meanwhile, data for clustering and ARM analysis do not apply data splitting.

2.2.3. Data Scaling

Data scaling is applied to avoid the models being dominated by large or small data ranges. There are two general techniques to scaling data, standardization and normalization. Standardization is the technique where the data values are centered on the mean with standard deviation. Therefore, the mean of all data becomes zero. While normalization is the technique where the data values are shifted and rescaled between 0 and 1. Equations (3) and (4) are the standardization and normalization formulas, respectively.
x s t a n d i = x i x ¯ s
x n o r m i = x i x m i n x m a x x m i n
where, x s t a n d i , x n o r m i , x i , x ¯ , s, x m a x and x m i n are the standardized data, normalized data, observed data, sample mean, standard deviation, smallest value, and largest value, respectively.

2.3. Data Mining Techniques

There are three data mining techniques used in this study: prediction model, clustering analysis, and association rules mining (ARM) analysis.

2.3.1. Prediction Model

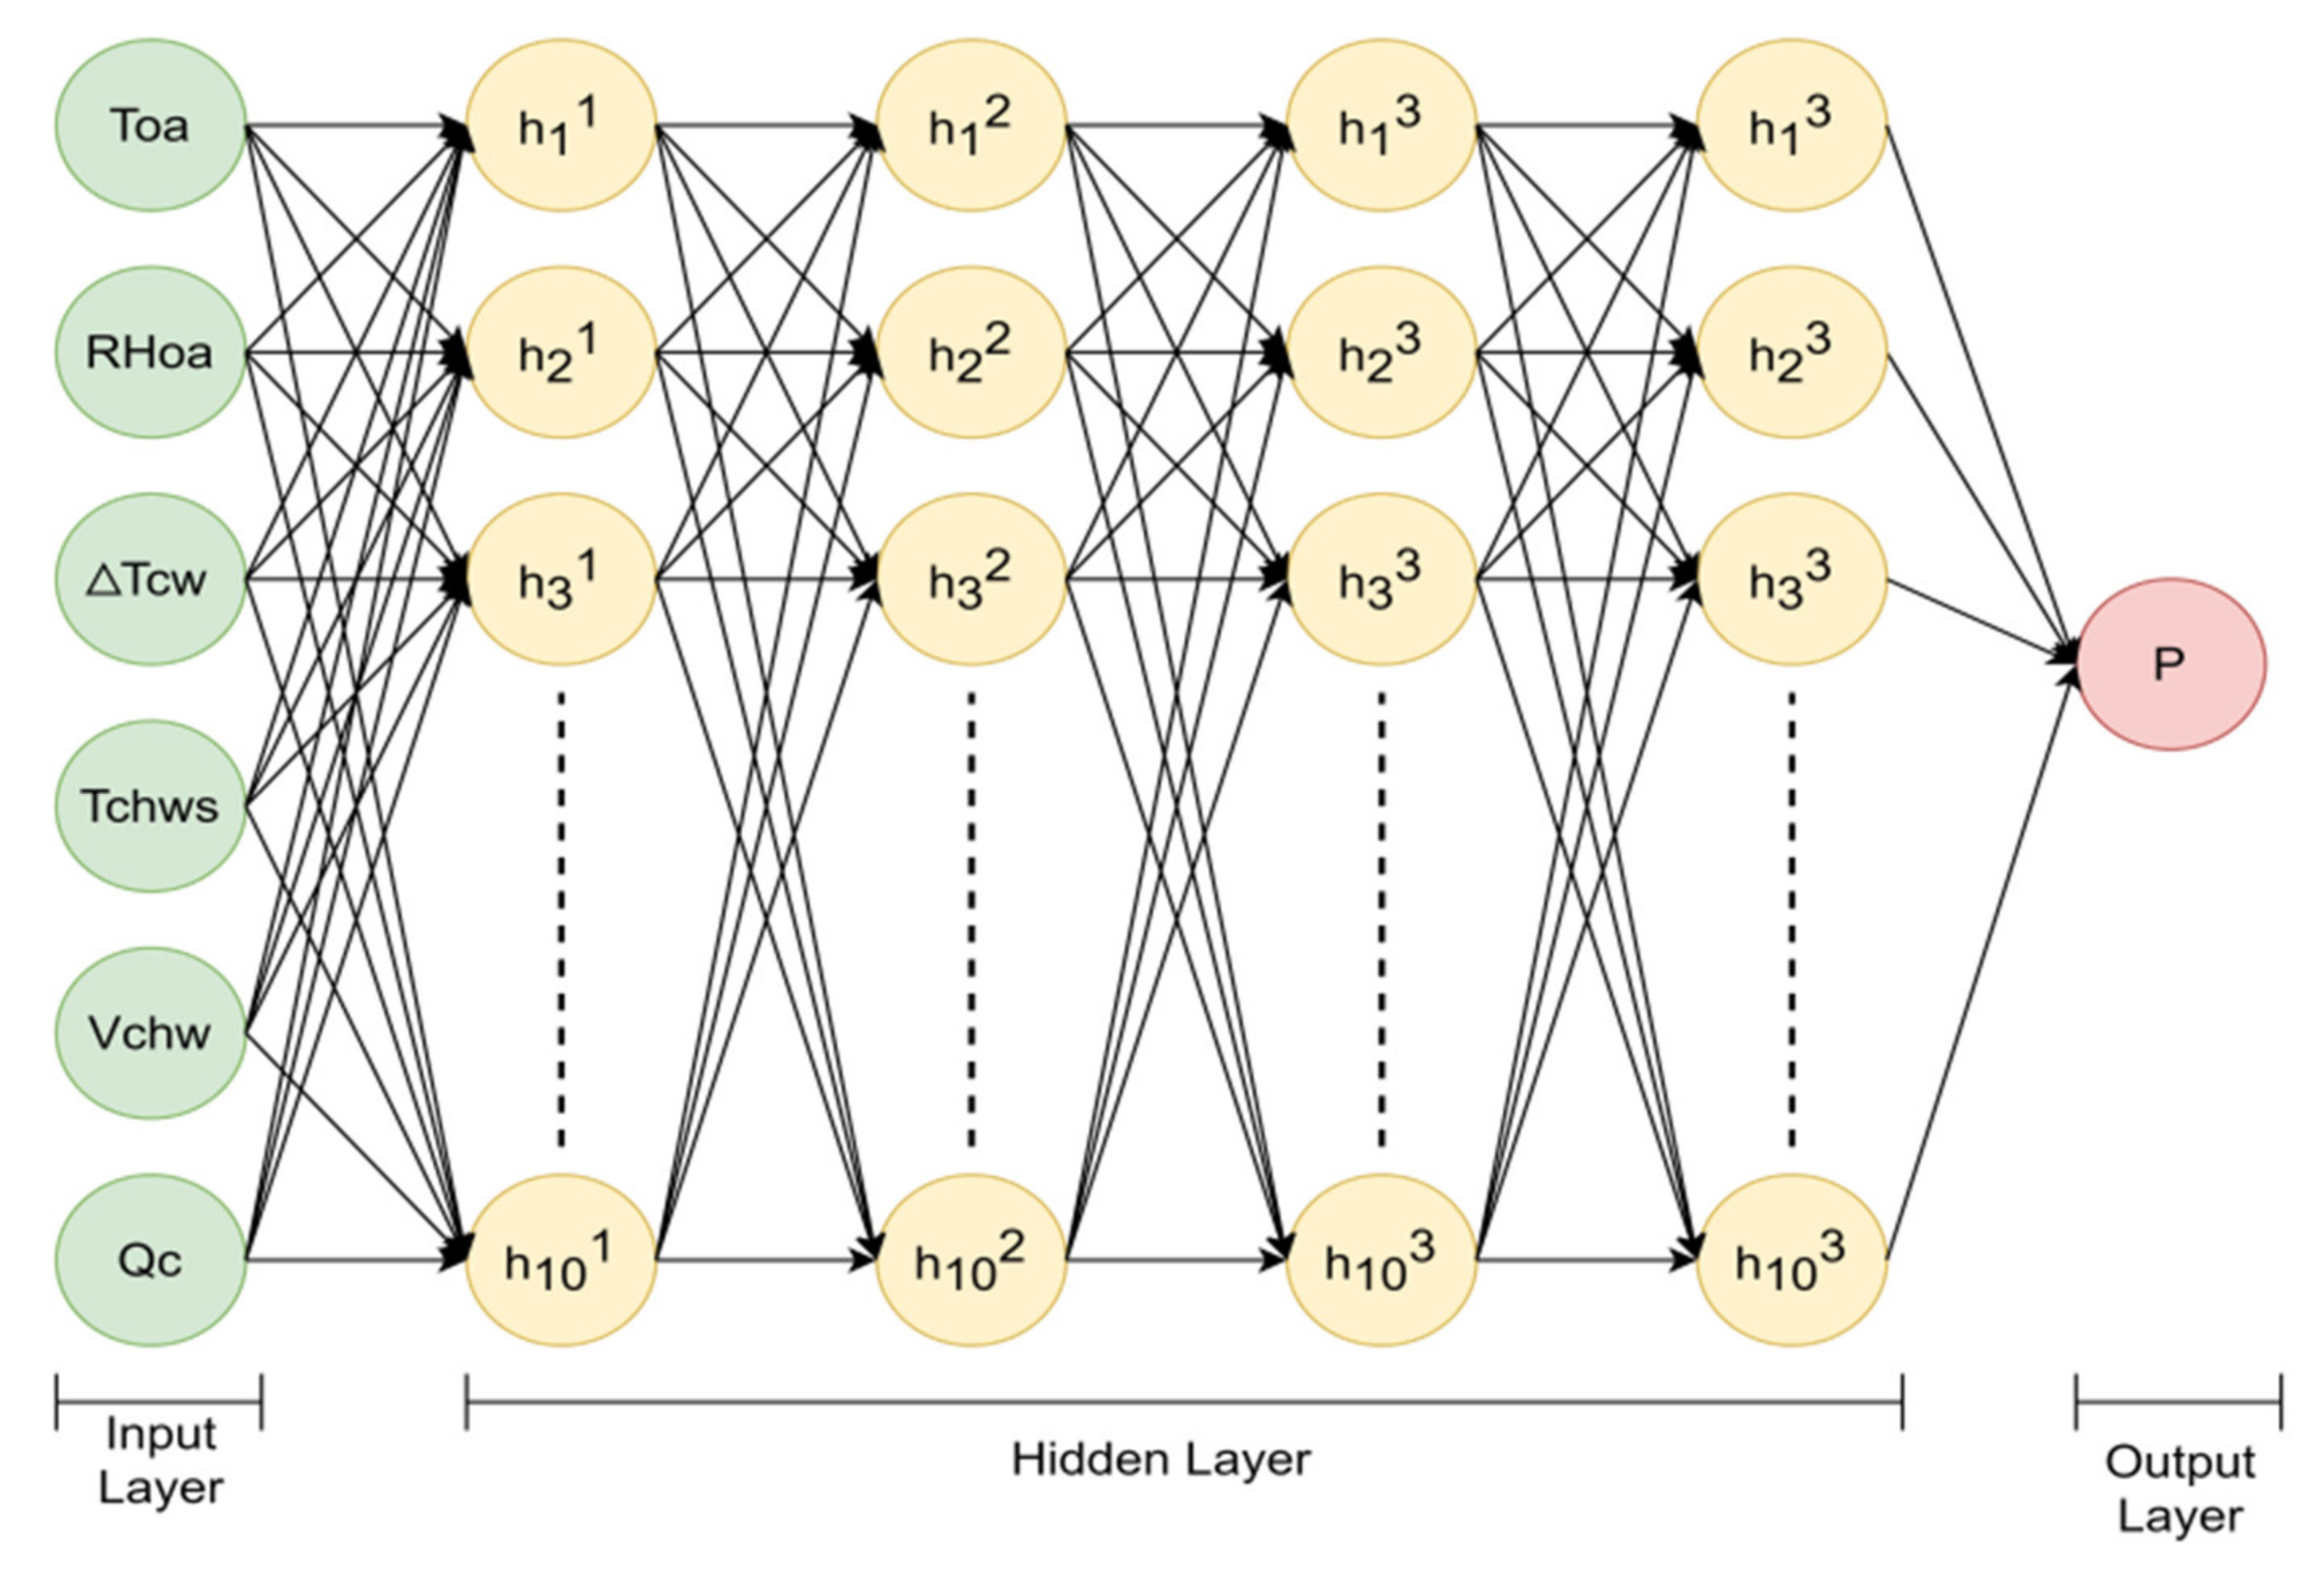
The power consumption prediction model was built using the deep neural network (DNN) technique in this study. DNN is an artificial neural network that is used to perform complex tasks and has multiple layers and multiple nodes [31]. Figure 3 shows the DNN architecture used in this study. It describes that the input layer consists of six neurons, and there are four hidden layers that consist of ten neurons in each layer. The output layer consists of one neuron. The neuron’s output is represented in Equation (5). Where y is neuron’s output, f is activation function, x i is the input variable, w i is the weight, and b is bias. The activation function used in this study is the Rectifier Linear Unit (ReLU) described in Equation (6). It means that the function returns 0 for a negative value, and returns x for a positive value [32]. However, the weight and bias are parameters that can be learned during the training model. The goal of training a network is to reduce the loss or error between the output algorithm and the actual value from measurement.
y = f i x i w i + b
f x = max x , 0
Three performance metrics were selected to assess the model, which are coefficient of determination (R2), mean absolute error (MAE), and root mean square error (RMSE), formulated in Equations (7)–(9), where N , Y i , P i , and Y ¯ are the number of samples, actual value, predictive value, and average actual value, respectively. The coefficient of determination is scale independent and the value is usually between 0 and 1, but it possible to have a negative value because the model can be arbitrarily worse. The value 1 means that the model is without error. The MAE and RMSE are scale-dependent which cannot be used to evaluate performance against other studies.
R 2 = 1 i = 1 N Y i P i 2 i = 1 N Y i Y ¯ 2
MAE = 1 N i = 1 N Y i P i
RMSE = 1 N i = 1 N Y i P i 2 2

2.3.2. Clustering Analysis

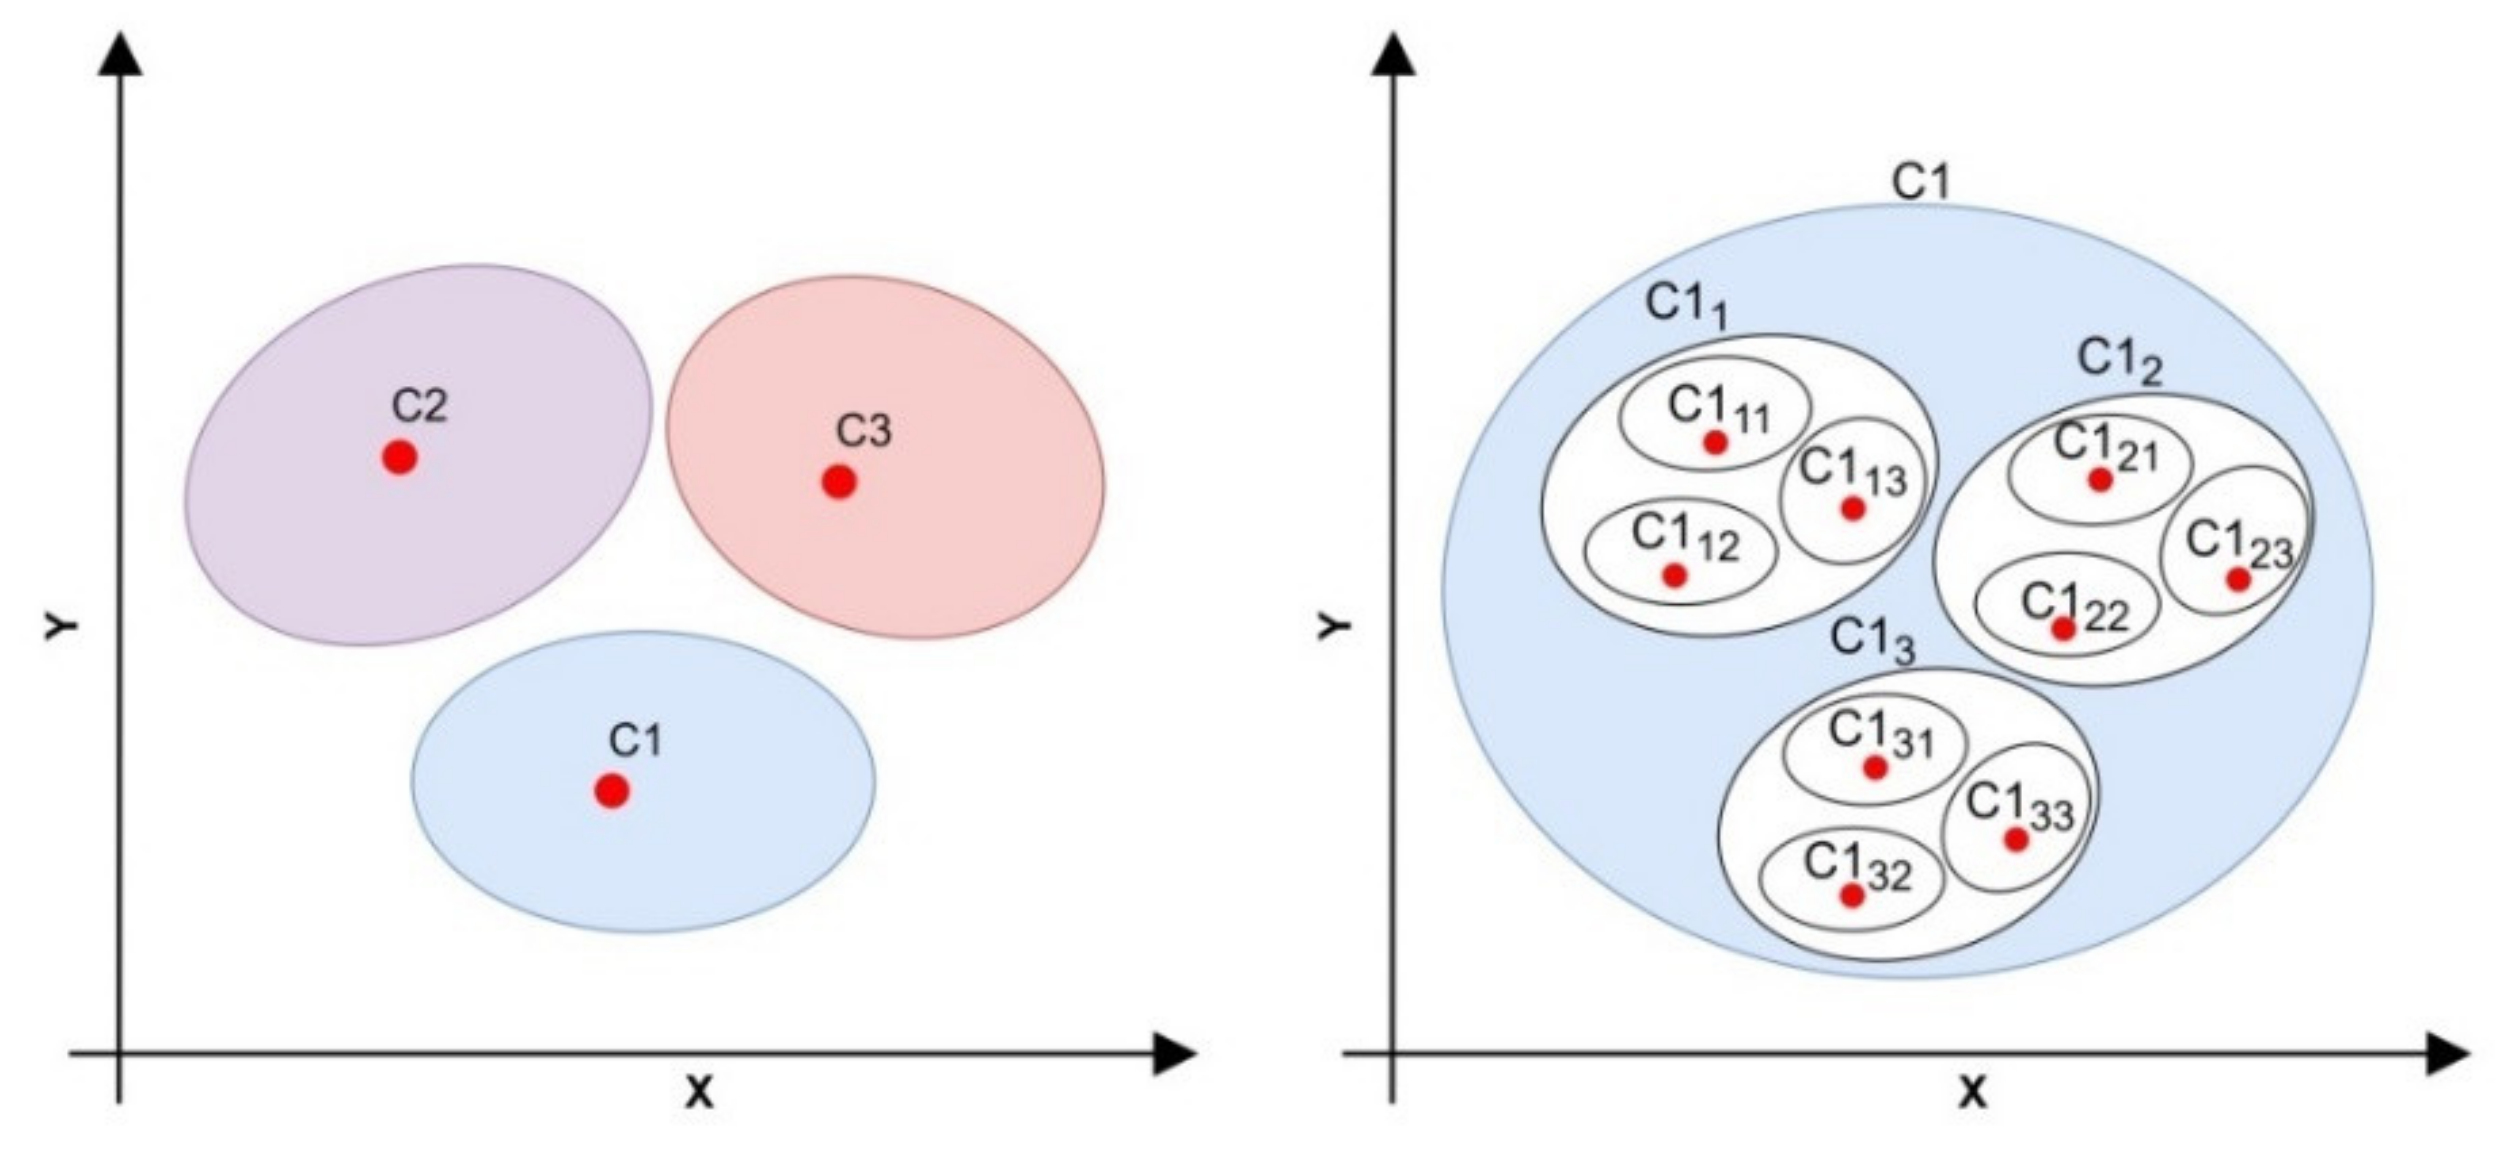
Since ARM analysis can only handle categorical data, clustering analysis is required in advance to group or cluster the dataset. Clustering analysis is the task to grouping the data into meaningful groups, so that the data in the same cluster are highly similar, and the data in different clusters are very distinct [6,22]. Cluster analysis has been applied to a variety field such as marketing, crime prevention, educational sector, medicine, and biology [22]. A multi-layer k-means algorithm was selected to perform the clustering analysis [33]. The multi-layer k-means algorithm result is better than a traditional k-means algorithm. The K-means algorithm is a popular clustering method, simple to implement, knows limitations, and has excellent fine-tuning capabilities. However, it is vulnerable to outliers and noise data which can reduce the clustering analysis accuracy [34]. Therefore, the multi-layer k-means algorithm has been applied to solve these problems. Figure 4 describes the multi-layers k-means algorithm. The left side shows that the data is clustered into three (k = 3), C1, C2, and C3. Since multi-layer k-means is applied, each cluster needs to be further clustered into several small clusters (sub-clusters). The right side takes C1 samples which are clustered into sub-clusters and further clustered into sub-sub-clusters. Equation (10) explains the k-means clustering algorithm objective. Where, k, n, x i , c j are the number of clusters, number of cases, case i, and centroid for cluster j. The silhouette method was used to determine the number of clusters (k) in the k-means algorithm as formulated in Equation (11), where d o u t x indicates the smallest average distance between point x and all points in another cluster, and d i n x indicates the average distance between point x and all other points in the same cluster. The range silhouette score is between −1 to 1. A higher score indicates better clustering performance [35]. The centroid is the mean of a variable for the observations in the cluster.
J = j = 1 k i = 1 n x i j c j 2
s x = m i n   d o u t x d i n x m a x   d i n x ,   d o u t x  

2.3.3. Association Rules Mining (ARM) Analysis

ARM is one of the most powerful DM tools for analyzing numerous data to identify the interesting rules in the database. It has been widely employed to discover energy-saving knowledge in HVAC systems [11]. In this study, the ARM is used to identify the optimum chiller operational parameters. The Apriori algorithm was selected to perform the ARM analysis. It can only handle categorical data such as high, medium, and low. There are three measures for evaluating and determining which rules are significant: support, confidence, and lift. Support indicates how frequently an association rule appears in a dataset. Confidence indicates the accuracy or strength of an association rule. Lift indicates the statistical dependence between X and Y in each rule [36]. Those three measures are defined in Equations (12)–(14). Where X is the antecedent or left-hand-side, Y is consequent or right-hand-side.
S u p p o r t   X Y = P X Y
C o n f i d e n c e   X Y = P X | Y = P X Y P X
L i f t   X Y = C o n f i d e n c e   X Y S u p p o r t   Y = P X | Y P Y  
where, P X Y is the probability X and Y appears in the same time frame, P X | Y is the probability that Y occurs when X occurs, P X is the probability that X appears in the dataset, and P Y is the probability that Y appears in the dataset.
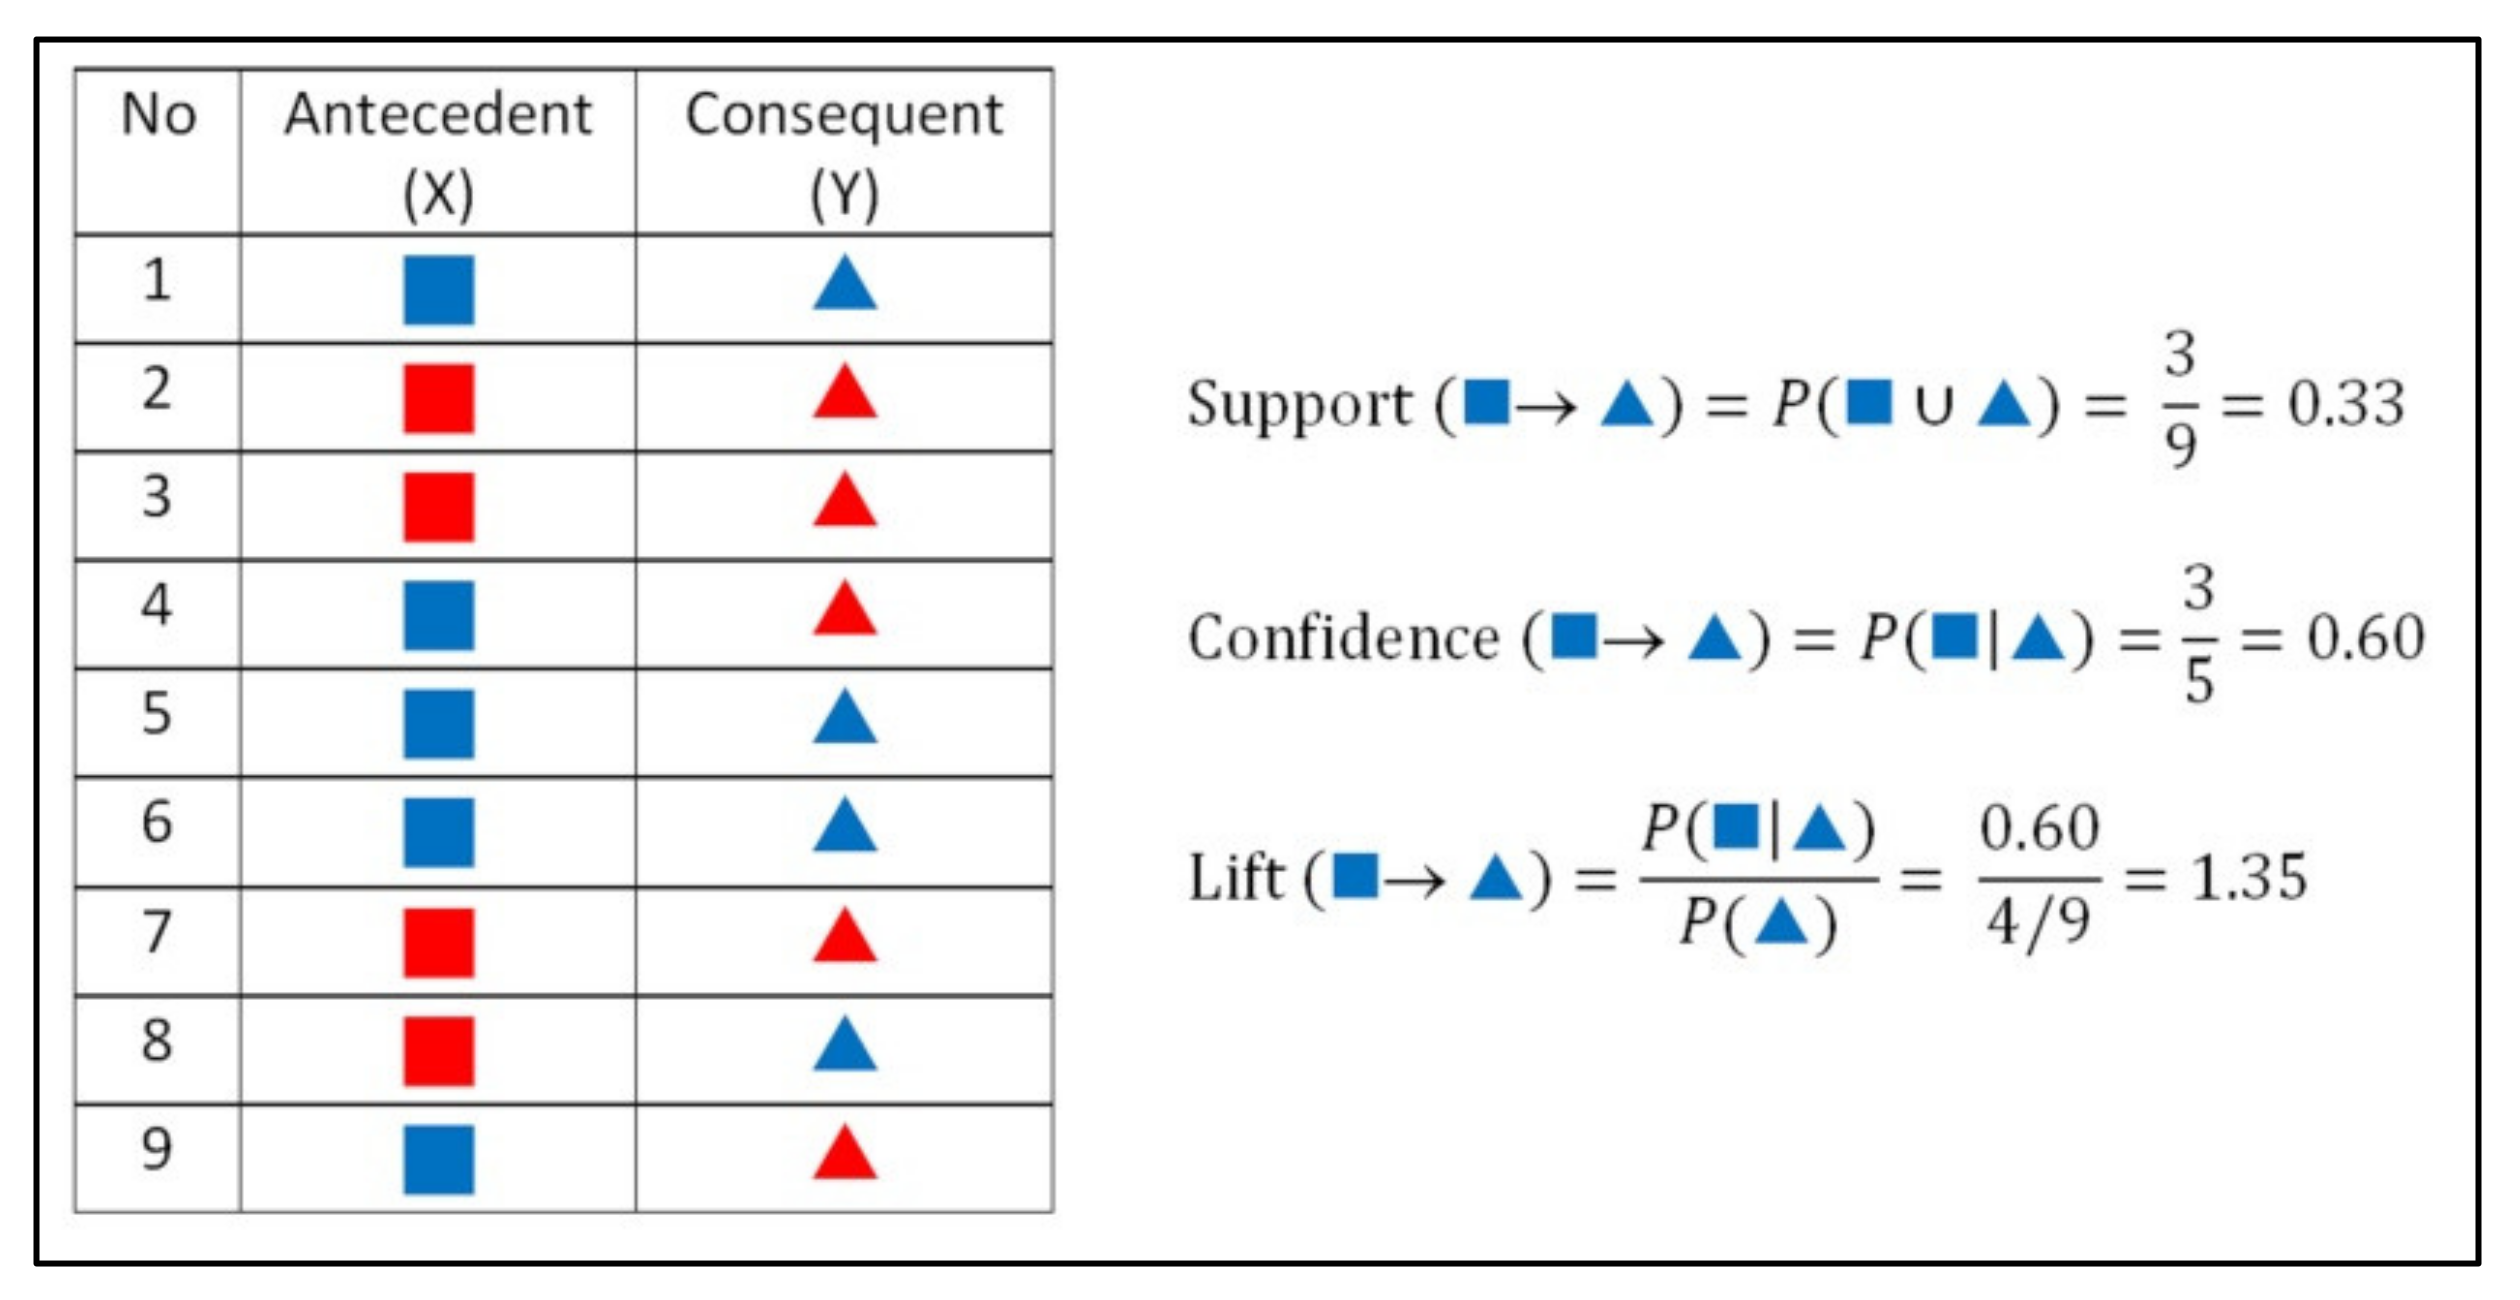
Figure 5 illustrate the description of ARM measures. There is a table that contains examples of X and Y data. The blue squares and blue triangles are assumed as the X and Y values, respectively, and are evaluated using the support, confidence, and lift.

2.4. Simulation Optimization

Simulation optimization is performed to compare chiller power consumption using the actual operational parameters and ARM results. The operational parameters from ARM results will be simulated to predict chiller power consumption using the constructed prediction model. When the predicted power consumption value is smaller than that using the actual operational parameters, the optimization technique is successfully performed and the ARM results can be implemented into the system.

3. Result and Discussion

3.1. Software and Hardware

The software used for these experiments are Python 3.6.10, Tensorflow 2.1.0 version, and Win10 Pro 64-bit operating system. There are several main libraries provided by the python programming language to support this research, which are: Keras [37] to build the prediction model using deep neural networks, scikit-learn [38] to perform clustering analysis using the k-means algorithm, and mlxtend [39] to perform ARM analysis using the Apriori algorithm.

3.2. Prediction Model

Chiller power consumption prediction was built using DNN algorithm from Keras deep learning library. The model used six input variables, T o a , R H o a , Δ T c w , T c h w S , V c h w , and Q c . The DNN model architecture used in this study is shown in Figure 3. Four hidden layers and ten nodes were selected in each hidden layer. The model has one variable in the output layer which is the chiller power consumption itself. A dropout rate of 0.01 is applied to avoid overfitting after the first, second, and third hidden layers. The hyper-parameters need to be defined before training the model. ReLU is selected as the activation function. The epochs are set to 500 and the batch size number is set to 60. The optimizer used was adam and the loss function used the mean squared error. After the prediction model was built, the data were plotted and the model assessed. Figure 6 shows the scatter plots and the model assessment of (a) training and (b) testing to compare the actual and predicted power consumption. Figure 6a used the data during training, 85% of the total data. The model performance has 0.956 of R2, 4.471 of MAE, and 6.624 of RMSE. Figure 6b used the testing data, 15% of the total data. The model performance has 0.955 of R2, 4.470 of MAE, and 6.716 of RMSE. The prediction model is ready to use.

3.3. Clustering Analysis

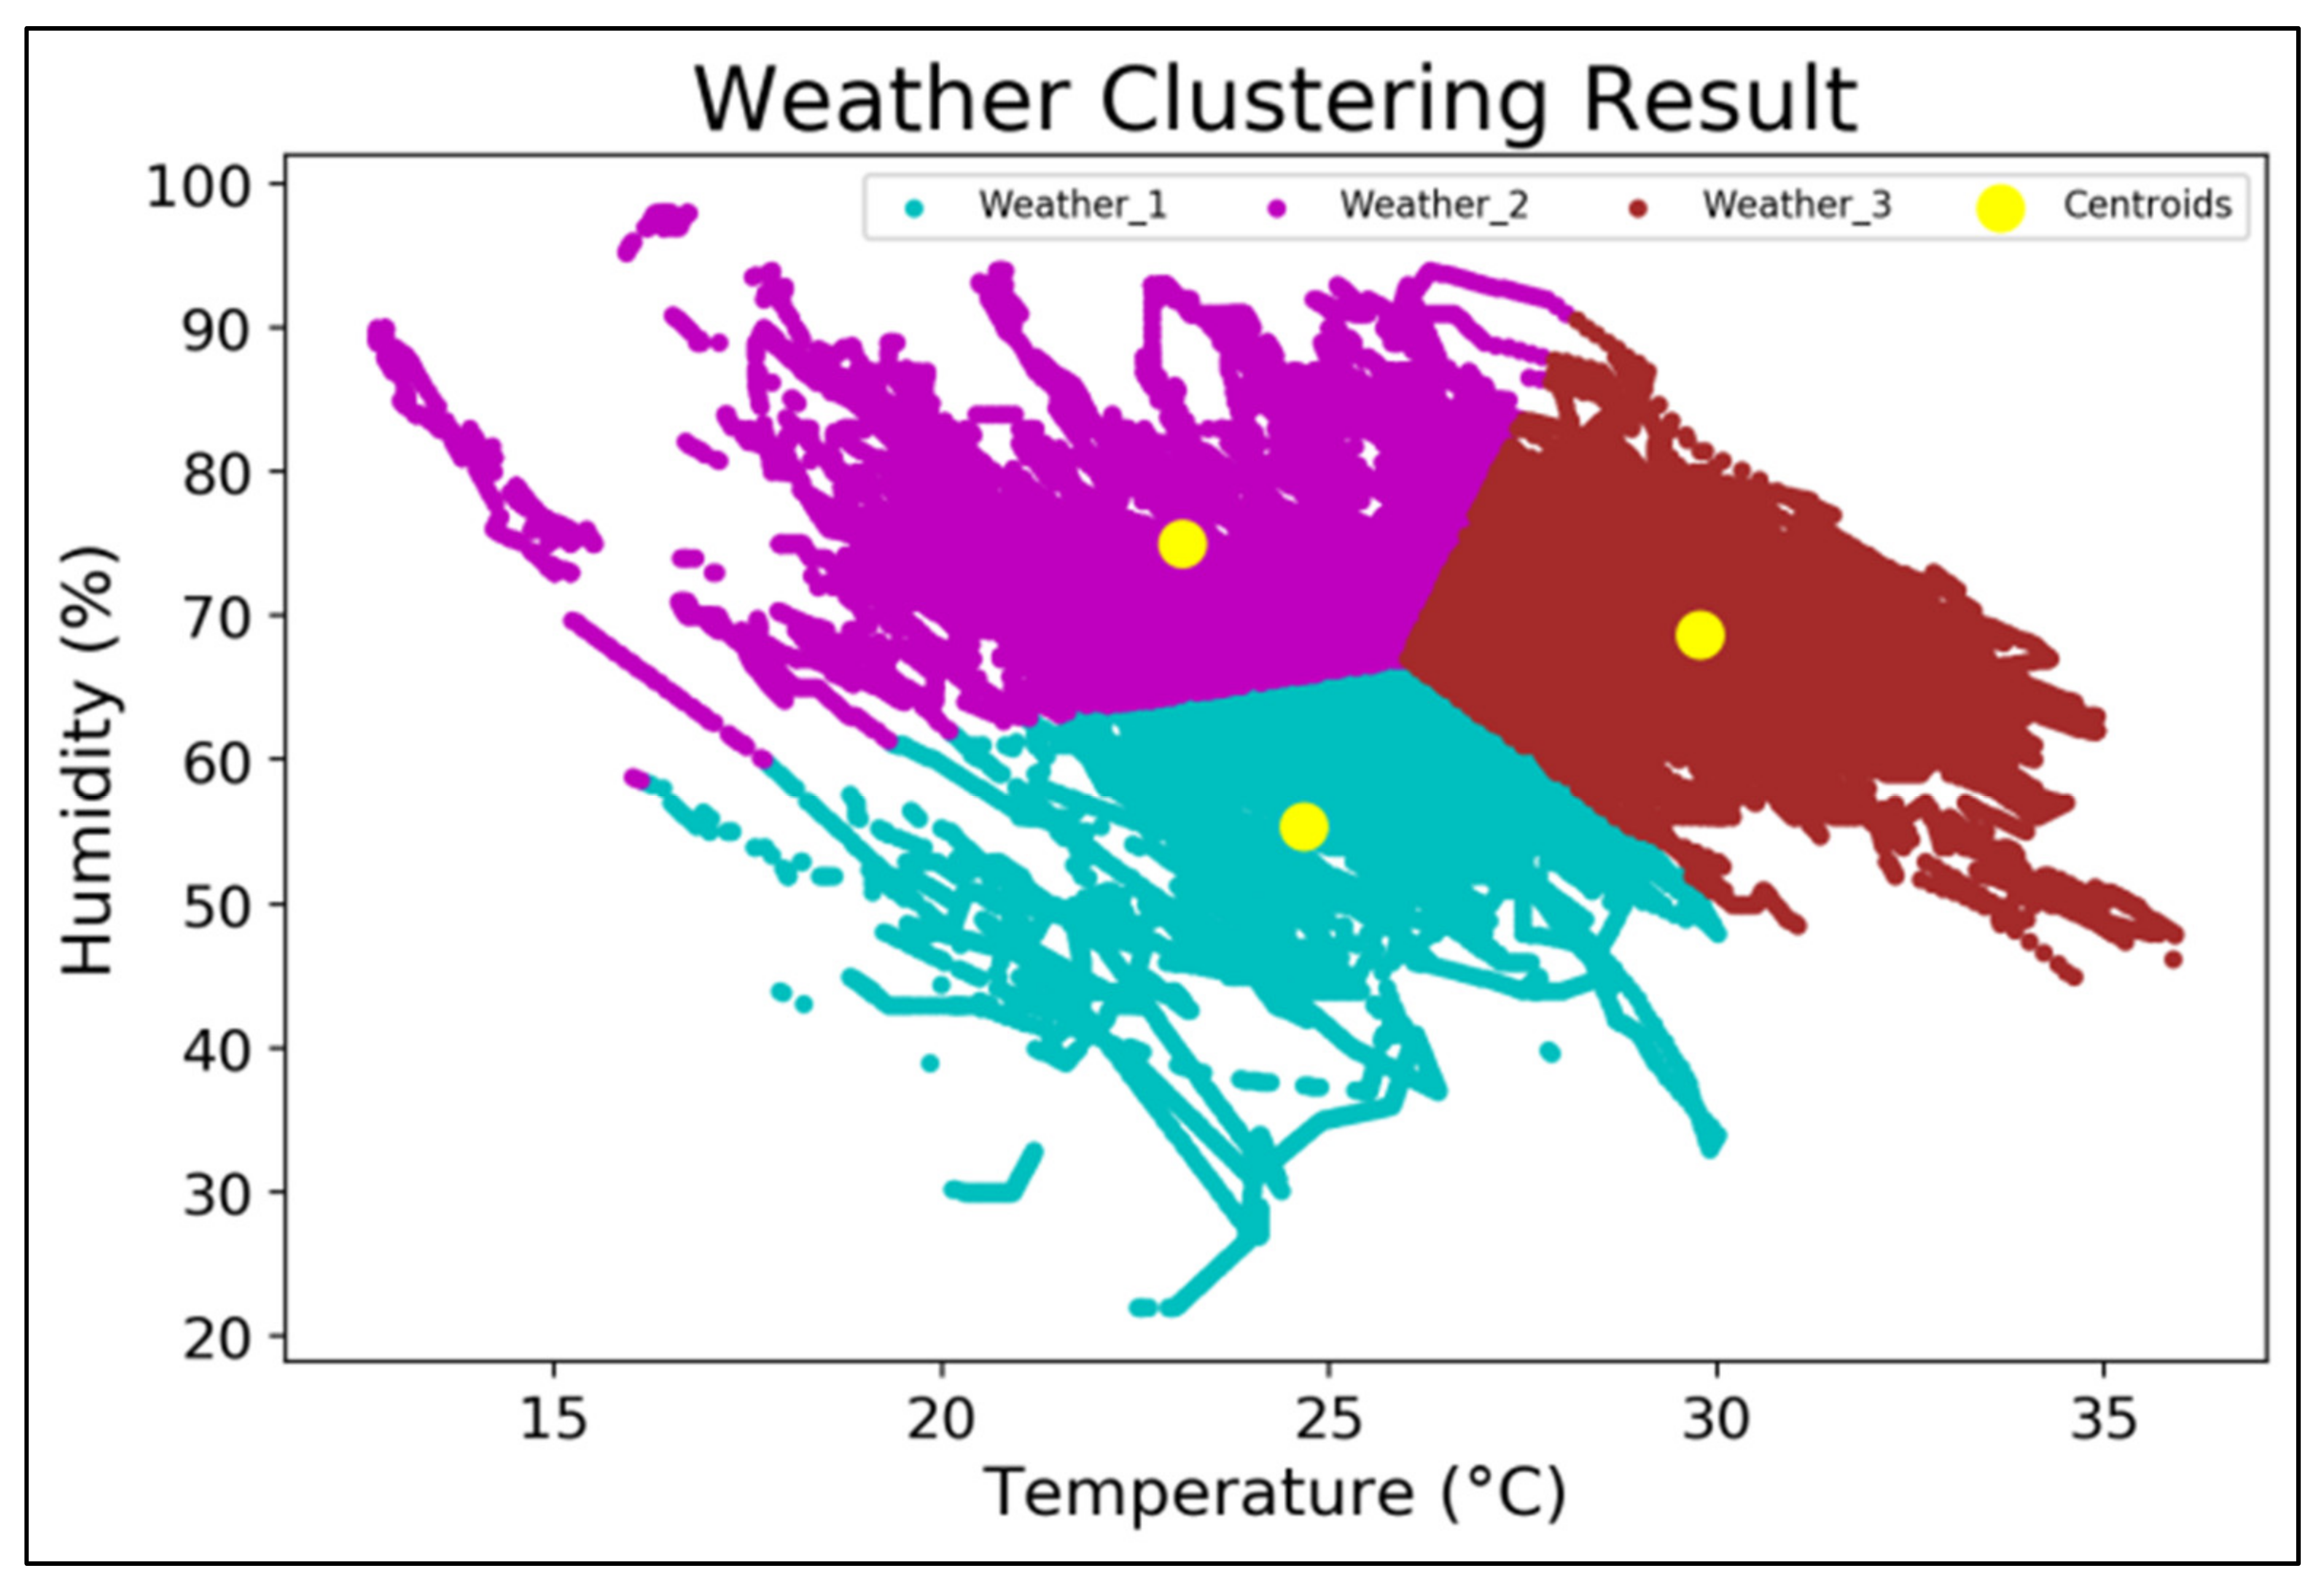
The silhouette method was performed to determine the best number of clusters for weather data. Based on the silhouette method, the best number of clusters for the weather data is three. The weather data used are outdoor air temperature and humidity. The clustering analysis is performed using k-means algorithm from scikit-learn library. The parameters need to set before fitting the k-means to the data. Number of clusters is set to three. The method for initialization used k-means++ and the random state is set to 28. The other parameters were set to the default setting. Figure 7 shows the weather clustering result. Each cluster has the centroid. The centroid of weather_1 is 24.67 °C with 55.33%, weather_2 is 23.10 °C with 75.04%, and weather_3 is 29.77 °C with 68.68%. The data in the same weather cluster needs to be further clustered based on the three chiller cooling capacities: low, medium, and high capacities. Each capacity also needs to be further clustered based on the three classes of COP: low, medium, and high.

3.4. Association Rules Mining (ARM) Analysis

The data were filtered first before applying the clustering result into the ARM analysis. Since we wanted to identify the knowledge affecting high performance, only data belonging to the cluster of high COP were used for ARM analysis and the others data were ignored. ARM analysis was performed to identify the operational parameters that have strong association rules against high COP. The operational parameters that want to be identified are Δ T c w , T c h w S , and V c h w values. The ARM analysis is performed using Apriori algorithm from mlxtend library. The minimum support, confidence, and lift are set to 0.001, 0.1, and 1.0. The others parameters are set to default setting. Table 1 describes the ARM analysis results. There are nine clusters based on weather_ID and Q c . Each cluster identified the optimal operational parameters that were selected based on the value of the assessments. The operational parameters that have the highest lift value have been adopted.

3.5. Simulation Optimization

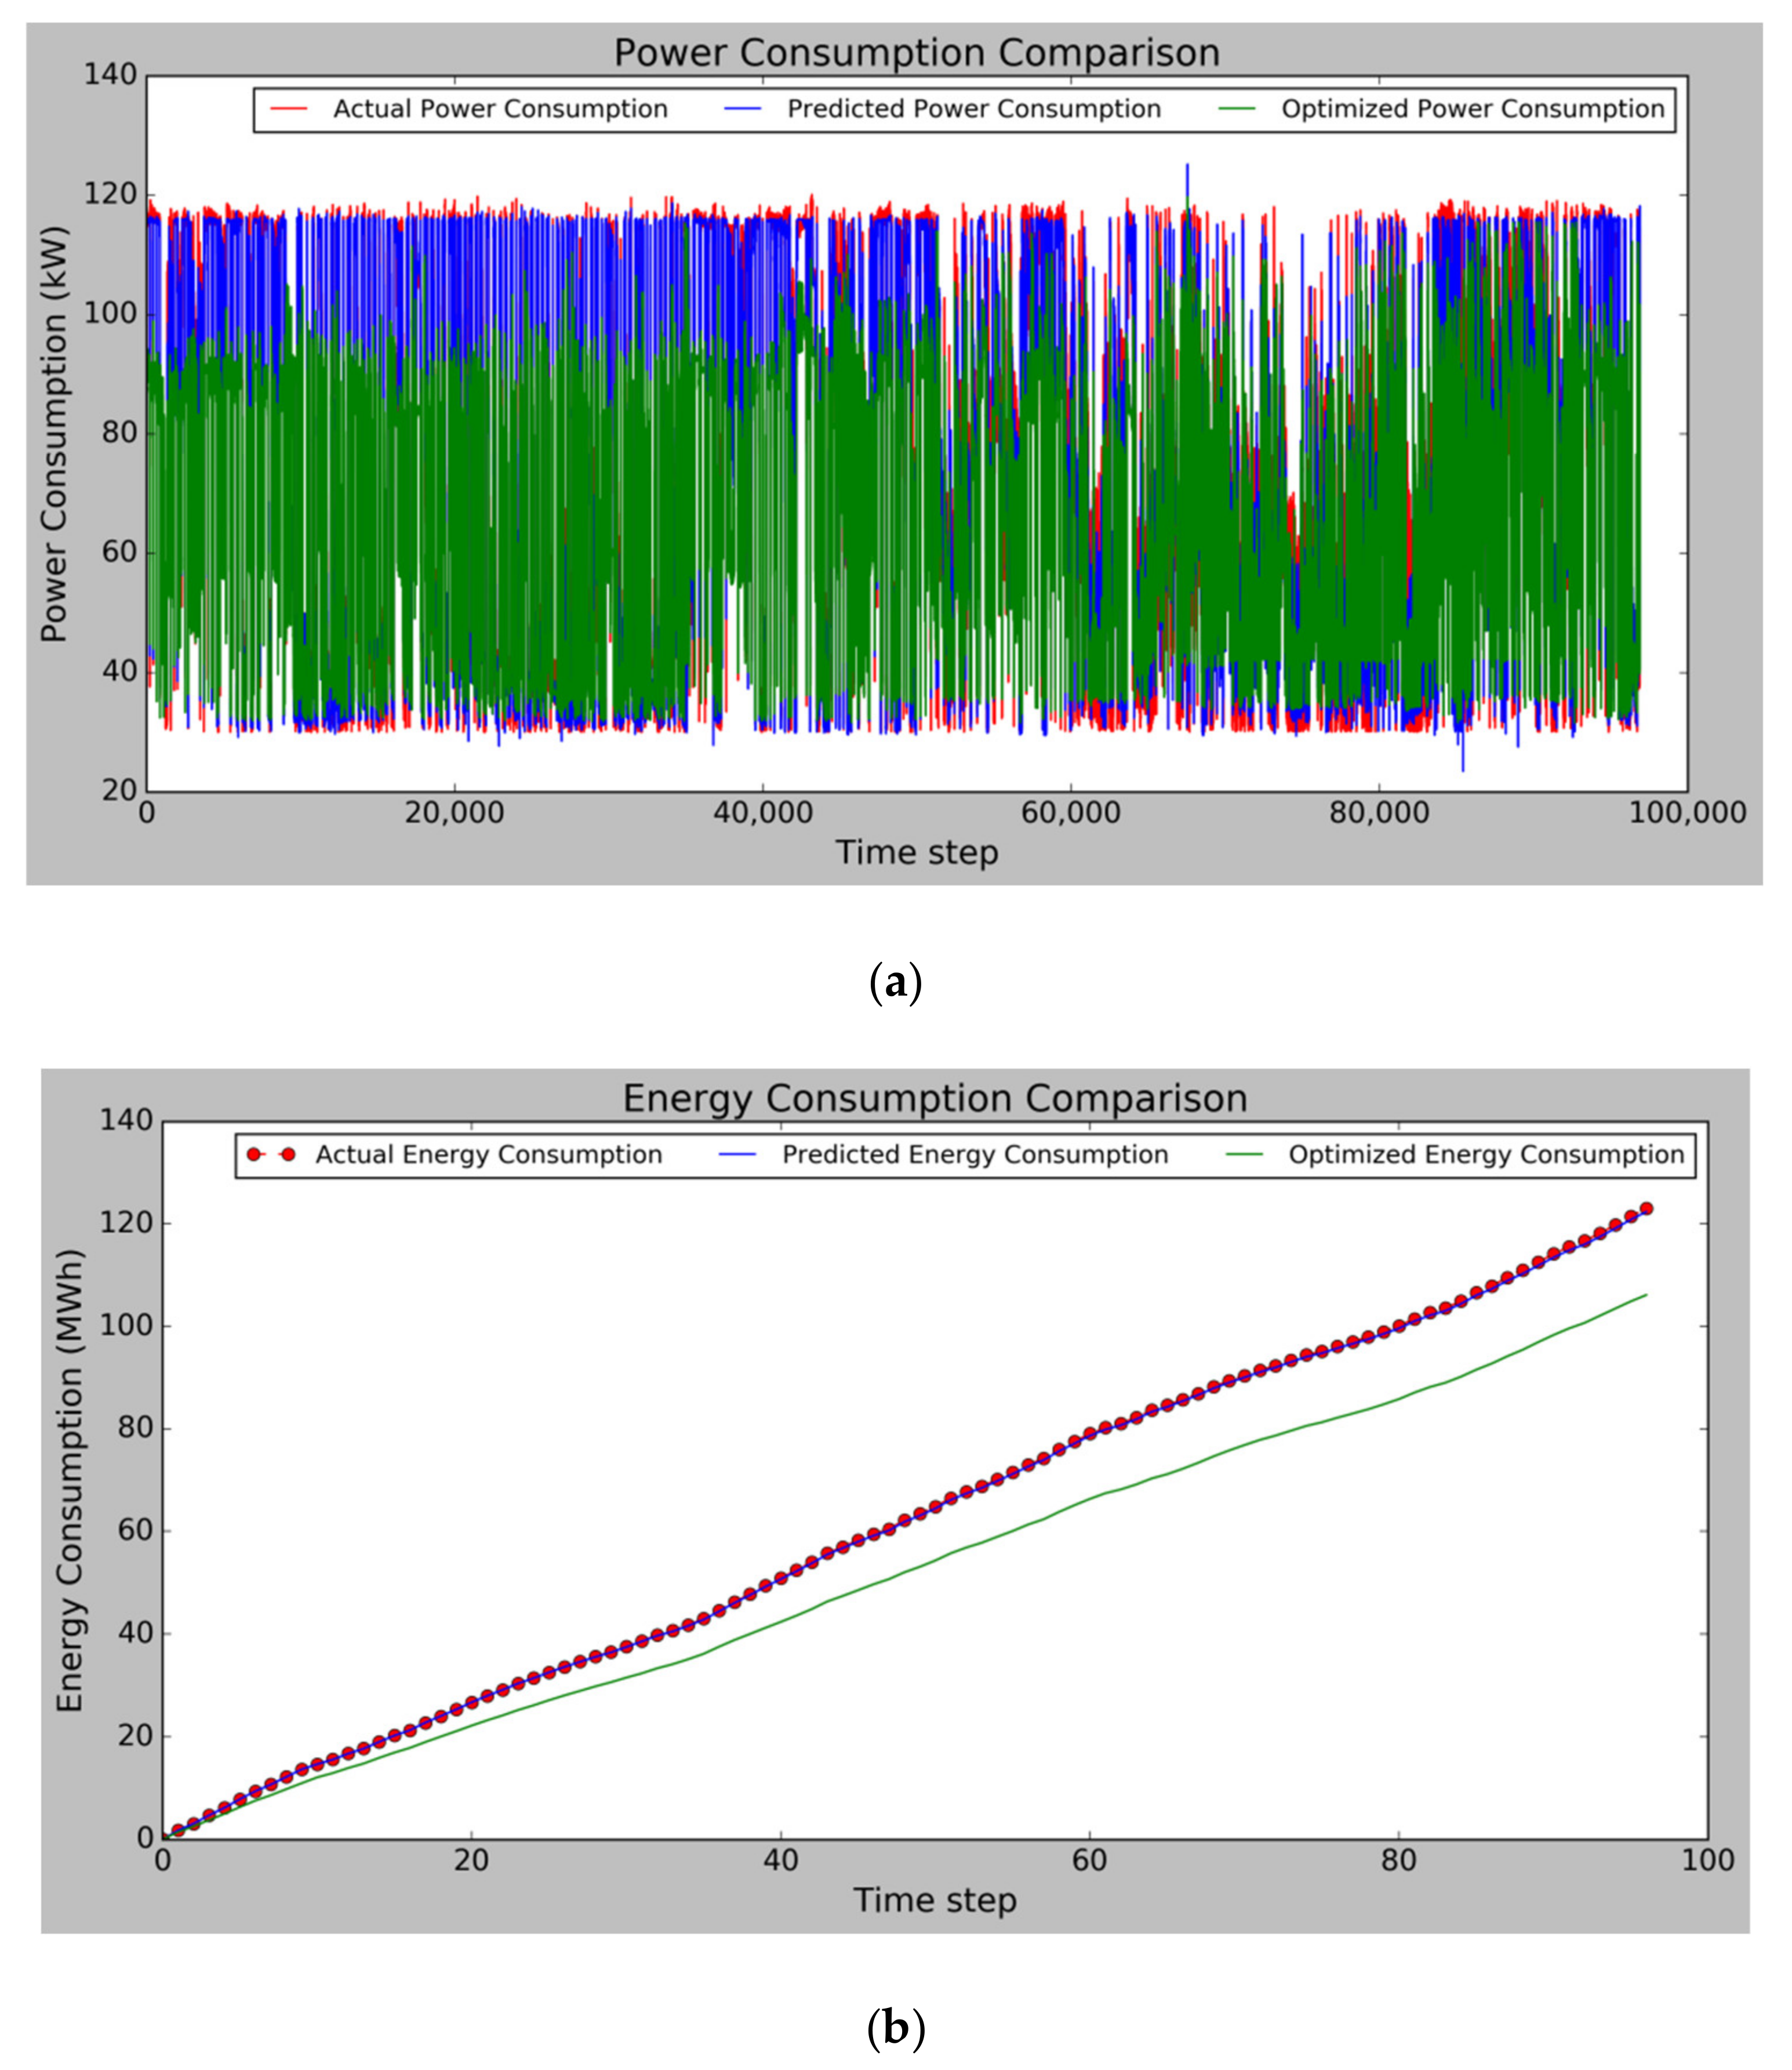
Since the power consumption prediction model has been built and the optimal operational parameters have been obtain from ARM results, the simulation optimization can be performed. The operational parameters from the ARM result were simulated using the power consumption prediction model. The prediction model needs six inputs to predict the chiller power consumption. Three inputs, which are T o a , R H o a , and Q c , used the actual value from the measurement. Meanwhile, the other three inputs, which are Δ T c w , T c h w S , and V c h w , used the value from the ARM results. The power consumptions in kW were converted to the energy consumption in MWh. Table 2 described the simulation optimization result. Several sample data were used. Three energy consumption results are written in the table. The actual energy consumption is the total energy gain from the measurement. The predicted power consumption is gained from the prediction model result built using the original operational parameters. However, the optimized power consumption is gained from the result of the prediction model built using the operational parameters from the ARM result. Energy savings were calculated. It represents the energy-saving percentage that has been optimized.
Figure 8a shows the power consumption comparison in all weathers or in a whole year. The red, blue, and green lines indicate the actual, predicted, and optimized power consumption, respectively. From the figure, the overall optimized power consumption is below the actual and predicted power consumption. Figure 8b shows the energy consumption comparison in a year. The red dot indicates the actual energy consumption, blue line indicates the predicted energy consumption, and the green line indicates the optimized energy consumption. From the figure, the overall optimized energy consumption is below the actual and predicted energy consumption. The distance difference between the green and blue lines represents that energy-saving in the long term is increasing gradually.

3.6. Discussion

The chiller power consumption is affected by weather conditions ( T o a and R H o a ) and chiller cooling capacity ( Q c ). In one year, the weather is fickle and uncontrollable. The cooling capacity also varies depending on the cooling load on the building. These three parameters are fixed values and uncontrollable. In addition, chiller power consumption is also affected by Δ T c w , T c h w S , and V c h w . However, these three parameters are controllable. Therefore, the chiller can be optimized by setting the optimal operational parameter.
The results from data mining techniques illustrate how the chiller data and meteorological data can be used to optimize the chiller system. First, the prediction model was built using six inputs: T o a , R H o a ,   Q c , Δ T c w , T c h w S , and V c h w to predict the chiller power consumption. Second, the data were clustered based on T o a , R H o a , and Q c ; nine total clusters. The operational parameters were categorized as low, medium and high because the ARM can only handle the categorical data. Third, each cluster was performed by ARM analysis to identify the operational parameter value that affect to the low power consumption. Finally, the operational parameter values from ARM were simulated by the prediction model without changing the T o a , R H o a , and Q c .
As mentioned in the literature review, clustering and ARM are often used to identify patterns. Most of the literature only identifies patterns of HVAC systems without simulating the results. However, these results need to be proven by simulation because the ARM operational parameters are the categorical data and only valid to the centroid value. Although there are other studies simulating the operational parameters from the ARM result, that study did not use the neural network model. While, the neural network algorithm has a high performance in a prediction model and the accuracy of the prediction model can be known from the performance assessments.
The clustering and ARM are also applied in this study. The results showed that clustering and ARM successfully identify the operational parameter values that affect low power consumption. Compared to other studies, the results of this paper were proven by simulation using the power consumption prediction model based on neural network. The simulation results show that the operational parameters from ARM can reduce power consumption. The power consumption using operational parameters from ARM results is generally lower than the original operational parameters.

4. Conclusions and Future Work

This paper proposed chiller optimization using DM. Three DM techniques were adopted, prediction model, clustering, and association rule mining. The dataset was collected from a water-cooled chiller at an institutional building in Taiwan and from meteorological data every minute for a year. Following major conclusions can be drawn:
  • The power consumption prediction model was built using the DNN algorithm. There are six inputs: T o a , R H o a , Q c , Δ T c w , T c h w S , and V c h w . The model performance evaluations are 0.955 of R 2 , 4.470 of MAE, and 6.716 of RMSE.
  • The clustering analysis used the k-means algorithm to cluster the data into nine conditions based on weather and cooling capacity. The COP and the operational parameters ( T c h w S , V c h w , and Δ T c w ) were also clustered into three: high, medium, and low. The clustering analysis results are applied to the ARM analysis.
  • The ARM analysis was performed using the Apriori algorithm. The nine conditions identify the operational parameters that have strong association rules with high COP. The minimum support, confidence and lift are set to 0.001, 0.1, and 1.0.
  • The operational parameters from ARM were simulated using the prediction model. The simulation result shows that the operational parameters from ARM consume 100.68 MWh in a year. The actual operational parameters were also simulated by the prediction model. It consumes 123.04 MWh in a year. This simulation revealed that the operational parameters from ARM can successfully save energy consumption by 22.36 MWh or 18.17% in a year.
In future work, the authors would like to apply new operational parameters to the chiller system to prove that these operational parameters can reduce power consumption. The outdoor temperature ( T o a ) and humidity ( R H o a ) sensor will be installed. The measured T o a and R H o a will be clustered to weather_ID. The Δ T c w , T c h w S , and V c h w of the chiller system will be controlled based on the weather_ID and the chiller cooling capacity. If the power consumption is proven to decrease, these techniques will be applied in future study to optimize the air handling unit (AHU). A damper opening percentage and CO2 sensor will be installed to collect the data. The purpose is to identify the optimum damper opening percentage based on CO2 value. In addition, this method can be applied to refrigeration systems.

Author Contributions

Conceptualization, Y.-D.K.; methodology, E.C.N.; software, E.C.N.; validation, C.-C.L.; formal analysis, Y.-D.K.; investigation, Y.-D.K. and E.C.N.; resources, Y.-D.K. and C.-C.L.; data curation, E.C.N. and C.-C.L.; writing—original draft preparation, E.C.N.; writing—review and editing, E.C.N. and Y.-D.K.; visualization, C.-C.L.; supervision, E.C.N.; project administration, C.-C.L.; funding acquisition, Y.-D.K. All authors have read and agreed to the published version of the manuscript.

Funding

This research was funded by Ministry of Science and Technology of Taiwan, grant number MOST 109-2221-E-167-006.

Institutional Review Board Statement

Not applicable.

Informed Consent Statement

Not applicable.

Data Availability Statement

The data are not publicly available.

Acknowledgments

The authors thank the Ministry of Science and Technology (MOST) of Taiwan and Kesha High Technology Co., Ltd., Taichung city, Taiwan.

Conflicts of Interest

The authors declare no conflict of interest.

References

  1. Lu, J.-T.; Chang, Y.-C.; Ho, C.-Y. The Optimization of Chiller Loading by Adaptive Neuro-Fuzzy Inference System and Genetic Algorithms. Math. Probl. Eng. 2015, 2015, e306401. [Google Scholar] [CrossRef] [Green Version]
  2. Liu, T.; Xu, C.; Guo, Y.; Chen, H. A Novel Deep Reinforcement Learning Based Methodology for Short-Term HVAC System Energy Consumption Prediction. Int. J. Refrig. 2019, 107, 39–51. [Google Scholar] [CrossRef]
  3. Sala-Cardoso, E.; Delgado-Prieto, M.; Kampouropoulos, K.; Romeral, L. Predictive Chiller Operation: A Data-Driven Loading and Scheduling Approach. Energy Build. 2020, 208, 109639. [Google Scholar] [CrossRef]
  4. Chaerun Nisa, E.; Kuan, Y.-D. Comparative Assessment to Predict and Forecast Water-Cooled Chiller Power Consumption Using Machine Learning and Deep Learning Algorithms. Sustainability 2021, 13, 744. [Google Scholar] [CrossRef]
  5. Yu, J.; Liu, Q.; Zhao, A.; Qian, X.; Zhang, R. Optimal Chiller Loading in HVAC System Using a Novel Algorithm Based on the Distributed Framework. J. Build. Eng. 2020, 28, 101044. [Google Scholar] [CrossRef]
  6. Zhou, X.; Wang, B.; Liang, L.; Yan, J.; Pan, D. An Operational Parameter Optimization Method Based on Association Rules Mining for Chiller Plant. J. Build. Eng. 2019, 26, 100870. [Google Scholar] [CrossRef]
  7. Wang, Y.; Li, K.; Gan, S.; Cameron, C. Analysis of Energy Saving Potentials in Intelligent Manufacturing: A Case Study of Bakery Plants. Energy 2019, 172, 477–486. [Google Scholar] [CrossRef]
  8. Li, G.; Hu, Y.; Chen, H.; Li, H.; Hu, M.; Guo, Y.; Liu, J.; Sun, S.; Sun, M. Data Partitioning and Association Mining for Identifying VRF Energy Consumption Patterns under Various Part Loads and Refrigerant Charge Conditions. Appl. Energy 2017, 185, 846–861. [Google Scholar] [CrossRef]
  9. Xu, Y.; Yan, C.; Shi, J.; Lu, Z.; Niu, X.; Jiang, Y.; Zhu, F. An Anomaly Detection and Dynamic Energy Performance Evaluation Method for HVAC Systems Based on Data Mining. Sustain. Energy Technol. Assess. 2021, 44, 101092. [Google Scholar] [CrossRef]
  10. Fan, C.; Xiao, F. Assessment of Building Operational Performance Using Data Mining Techniques: A Case Study. Energy Procedia 2017, 111, 1070–1078. [Google Scholar] [CrossRef]
  11. Zhang, C.; Xue, X.; Zhao, Y.; Zhang, X.; Li, T. An Improved Association Rule Mining-Based Method for Revealing Operational Problems of Building Heating, Ventilation and Air Conditioning (HVAC) Systems. Appl. Energy 2019, 253, 113492. [Google Scholar] [CrossRef]
  12. Jayasri, N.P.; Aruna, R. Big Data Analytics in Health Care by Data Mining and Classification Techniques. ICT Express 2021, S2405959521000849. [Google Scholar] [CrossRef]
  13. Dietler, D.; Loss, G.; Farnham, A.; de Hoogh, K.; Fink, G.; Utzinger, J.; Winkler, M.S. Housing Conditions and Respiratory Health in Children in Mining Communities: An Analysis of Data from 27 Countries in Sub-Saharan Africa. Environ. Impact Assess. Rev. 2021, 89, 106591. [Google Scholar] [CrossRef]
  14. Chen, S.; Li, X.; Liu, R.; Zeng, S. Extension Data Mining Method for Improving Product Manufacturing Quality. Procedia Comput. Sci. 2019, 162, 146–155. [Google Scholar] [CrossRef]
  15. Dogan, A.; Birant, D. Machine Learning and Data Mining in Manufacturing. Expert Syst. Appl. 2021, 166, 114060. [Google Scholar] [CrossRef]
  16. Guo, Y.; Wang, N.; Xu, Z.-Y.; Wu, K. The Internet of Things-Based Decision Support System for Information Processing in Intelligent Manufacturing Using Data Mining Technology. Mech. Syst. Signal. Process. 2020, 142, 106630. [Google Scholar] [CrossRef]
  17. Al-Hashedi, K.G.; Magalingam, P. Financial Fraud Detection Applying Data Mining Techniques: A Comprehensive Review from 2009 to 2019. Comput. Sci. Rev. 2021, 40, 100402. [Google Scholar] [CrossRef]
  18. Kim, M. A Data Mining Framework for Financial Prediction. Expert Syst. Appl. 2021, 173, 114651. [Google Scholar] [CrossRef]
  19. Farvaresh, H.; Sepehri, M.M. A Data Mining Framework for Detecting Subscription Fraud in Telecommunication. Eng. Appl. Artif. Intell. 2011, 24, 182–194. [Google Scholar] [CrossRef]
  20. Keramati, A.; Jafari-Marandi, R.; Aliannejadi, M.; Ahmadian, I.; Mozaffari, M.; Abbasi, U. Improved Churn Prediction in Telecommunication Industry Using Data Mining Techniques. Appl. Soft Comput. 2014, 24, 994–1012. [Google Scholar] [CrossRef]
  21. Xiao, F.; Fan, C. Data Mining in Building Automation System for Improving Building Operational Performance. Energy Build. 2014, 75, 109–118. [Google Scholar] [CrossRef]
  22. Caruso, G.; Gattone, S.A.; Balzanella, A.; Di Battista, T. Cluster Analysis: An Application to a Real Mixed-Type Data Set. In Models and Theories in Social Systems. Studies in Systems, Decision and Control; Flaut, C., Hošková-Mayerová, Š., Flaut, D., Eds.; Springer: Cham, Switzerland, 2019; Volume 179, ISBN 9783030000837. [Google Scholar]
  23. Wang, J.; Hou, J.; Chen, J.; Fu, Q.; Huang, G. Data Mining Approach for Improving the Optimal Control of HVAC Systems: An Event-Driven Strategy. J. Build. Eng. 2021, 39, 102246. [Google Scholar] [CrossRef]
  24. Wang, Y.; Li, Z.; Chen, H.; Zhang, J.; Liu, Q.; Wu, J.; Shen, L. Research on Diagnostic Strategy for Faults in VRF Air Conditioning System Using Hybrid Data Mining Methods. Energy Build. 2021, 247, 111144. [Google Scholar] [CrossRef]
  25. Mirnaghi, M.S.; Haghighat, F. Fault Detection and Diagnosis of Large-Scale HVAC Systems in Buildings Using Data-Driven Methods: A Comprehensive Review. Energy Build. 2020, 229, 110492. [Google Scholar] [CrossRef]
  26. Awan, M.B.; Li, K.; Li, Z.; Ma, Z. A Data Driven Performance Assessment Strategy for Centralized Chiller Systems Using Data Mining Techniques and Domain Knowledge. J. Build. Eng. 2021, 41, 102751. [Google Scholar] [CrossRef]
  27. Guo, Y.; Li, G.; Chen, H.; Wang, J.; Guo, M.; Sun, S.; Hu, W. Optimized Neural Network-Based Fault Diagnosis Strategy for VRF System in Heating Mode Using Data Mining. Appl. Therm. Eng. 2017, 125, 1402–1413. [Google Scholar] [CrossRef]
  28. Sha, H.; Xu, P.; Hu, C.; Li, Z.; Chen, Y.; Chen, Z. A Simplified HVAC Energy Prediction Method Based on Degree-Day. Sustain. Cities Soc. 2019, 51, 101698. [Google Scholar] [CrossRef]
  29. Alizadeh, R.; Jia, L.; Nellippallil, A.B.; Wang, G.; Hao, J.; Allen, J.K.; Mistree, F. Ensemble of Surrogates and Cross-Validation for Rapid and Accurate Predictions Using Small Data Sets. AIEDAM 2019, 33, 484–501. [Google Scholar] [CrossRef]
  30. Awan-Ur-Rahman What Is Data Cleaning? How to Process Data for Analytics and Machine Learning Modeling? Available online: https://towardsdatascience.com/what-is-data-cleaning-how-to-process-data-for-analytics-and-machine-learning-modeling-c2afcf4fbf45 (accessed on 23 August 2021).
  31. Kim, M.; Jung, S.; Kang, J. Artificial Neural Network-Based Residential Energy Consumption Prediction Models Considering Residential Building Information and User Features in South Korea. Sustainability 2019, 12, 109. [Google Scholar] [CrossRef] [Green Version]
  32. Wang, Y. Convolutional Neural Network Based Malignancy Detection of Pulmonary Nodule on Computer Tomography. Ph.D. Thesis, University of Saskatchewan, Saskatoon, SK, Canada, 2018. [Google Scholar] [CrossRef]
  33. Chen, C.-W.; Li, C.-C.; Lin, C.-Y. Combine Clustering and Machine Learning for Enhancing the Efficiency of Energy Baseline of Chiller System. Energies 2020, 13, 4368. [Google Scholar] [CrossRef]
  34. Yu, S.-S.; Chu, S.-W.; Wang, C.-M.; Chan, Y.-K.; Chang, T.-C. Two Improved K-Means Algorithms. Appl. Soft Comput. 2018, 68, 747–755. [Google Scholar] [CrossRef]
  35. Yu, X.; Ergan, S.; Dedemen, G. A Data-Driven Approach to Extract Operational Signatures of HVAC Systems and Analyze Impact on Electricity Consumption. Appl. Energy 2019, 253, 113497. [Google Scholar] [CrossRef]
  36. Yan, L.; Qian, F.; Li, W. Research on Key Parameters Operation Range of Central Air Conditioning Based on Binary K-Means and Apriori Algorithm. Energies 2018, 12, 102. [Google Scholar] [CrossRef] [Green Version]
  37. Keras: The Python Deep Learning API. Available online: https://keras.io/ (accessed on 23 August 2021).
  38. Scikit-Learn: Machine Learning in Python—Scikit-Learn 0.24.2 Documentation. Available online: https://scikit-learn.org/stable/ (accessed on 23 August 2021).
  39. Apriori—Mlxtend. Available online: http://rasbt.github.io/mlxtend/user_guide/frequent_patterns/apriori/ (accessed on 23 August 2021).
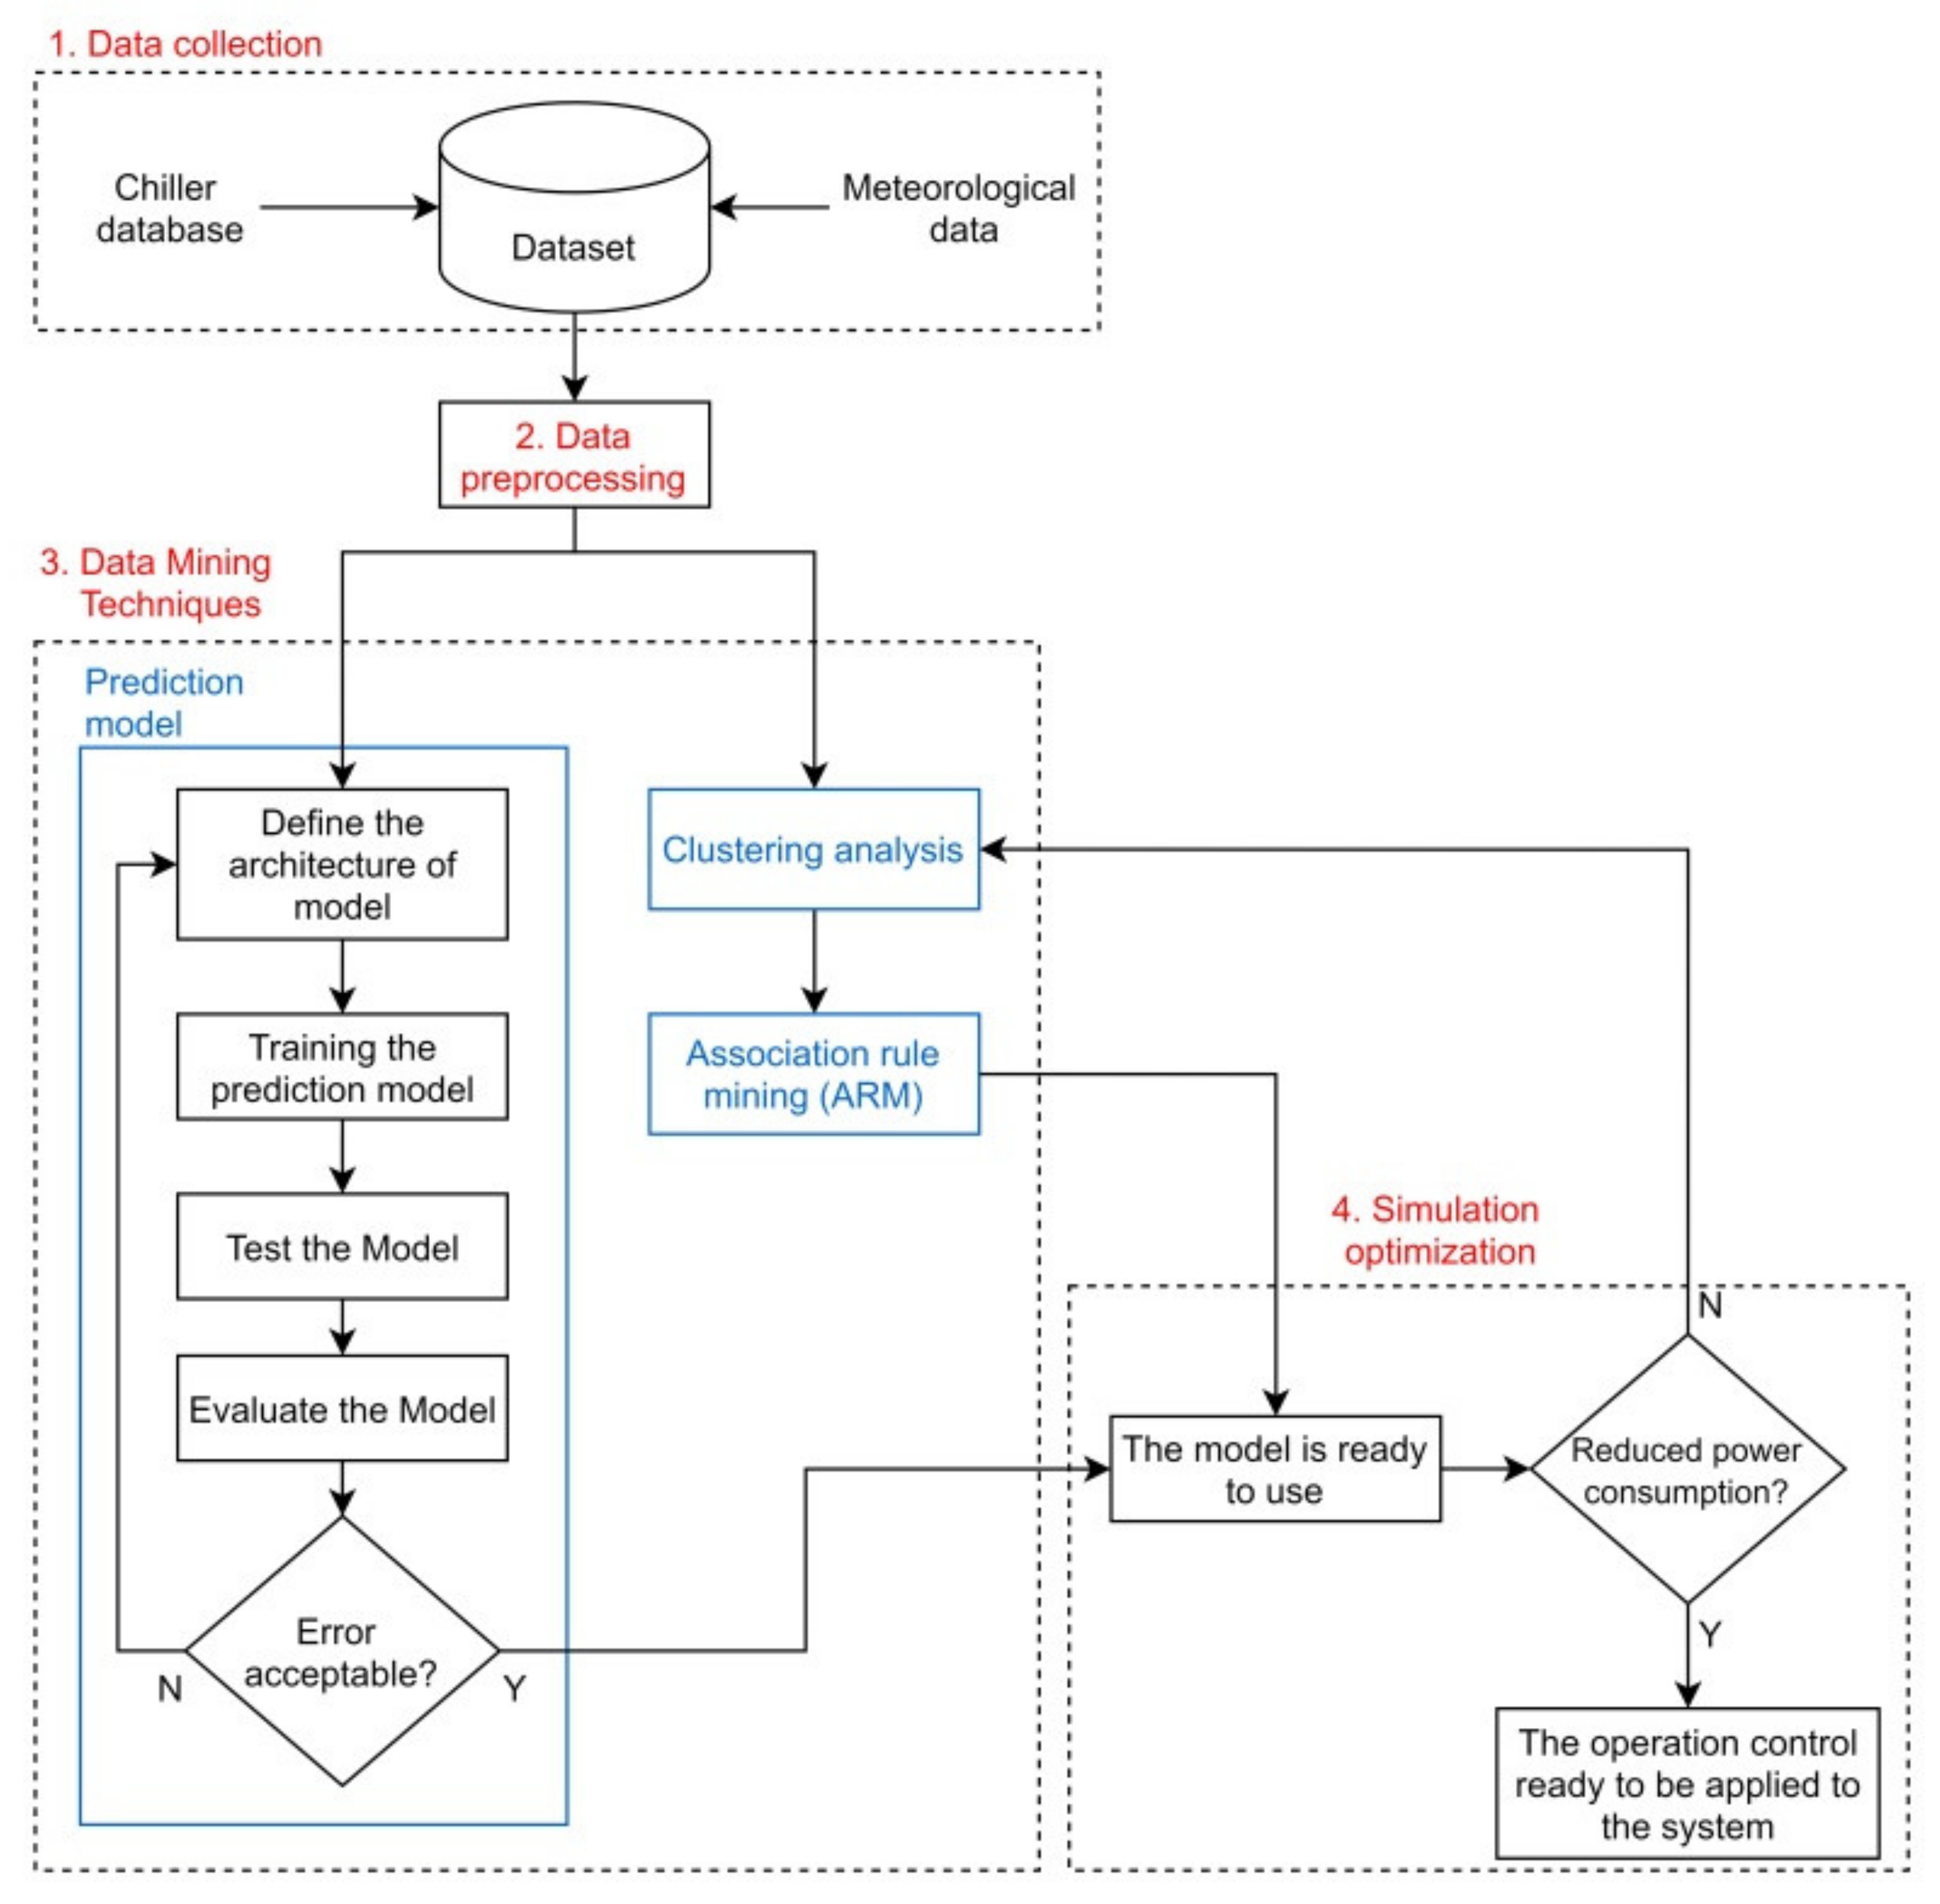
Figure 1. The proposed methodology framework.
Energies 14 06494 g001
Figure 2. Water-cooled chiller system diagram and the measurement points [4].
Energies 14 06494 g002
Figure 3. Power consumption prediction model using DNN [4].
Energies 14 06494 g003
Figure 4. Multi-layers k-means algorithm.
Energies 14 06494 g004
Figure 5. The descriptions of ARM measures.
Energies 14 06494 g005
Figure 6. The scatter plots between the actual and predicted power consumption and the model assessment: (a) training, (b) testing.
Energies 14 06494 g006
Figure 7. Weather clustering result using k-means algorithm.
Energies 14 06494 g007
Figure 8. The comparison of actual, predicted, and optimized: (a) power consumption, (b) energy consumption.
Energies 14 06494 g008
Table 1. Association rules mining result of optimum operational parameters.
AntecedentConsequentAssessments
Weather ID Q c 1   ( kW ) COP T c h w s ( ° C ) Δ T c w ( ° C ) V c h w ( CMH ) Support (%)Confidence (%)Lift
1 (24.67 °C, 55.33%)<49810.714.93.31156.6716.862.06
498–70712.513.93.11153.2918.471.89
>70711.313.75.11159.2721.731.70
2 (23.10 °C, 75.04%)<45311.317.12.11144.5614.082.92
453–67313.916.23.41179.3219.051.65
>6731.513.94.31154.2422.734.44
3 (29.77 °C, 68.68%)<4158.511.92.010021.0024.631.12
415–66412.918.13.91170.3011.616.09
>6649.417.34.81182.9124.263.71
1  Q c = cooling capacity of chiller.
Table 2. Simulation optimization results.
Sample DataTotal DataEnergy Consumption (MWh)Energy Saving (%)
ActualPredictedOptimized
Weather_117,47622.5022.3721.593.49
Weather_232,40737.6537.3632.7612.31
Weather_347,00563.5263.3152.4317.19
All Weather96,888123.68123.04100.6818.17
Publisher’s Note: MDPI stays neutral with regard to jurisdictional claims in published maps and institutional affiliations.