Abstract
The analysis of waveforms related to transient events is an important task in power system maintenance. Currently, electric power systems are monitored by several event recorders called phasor measurement units (PMUs) which generate a large amount of data. The number of records is so high that it makes human analysis infeasible. An alternative way of solving this problem is to group events in similar classes so that it is no longer necessary to analyze all the events, but only the most representative of each class. Several automatic clustering algorithms have been proposed in the literature. Most of these algorithms use validation indexes to rank the partitioning quality and, consequently, find the optimal number of clusters. However, this issue remains open, as each index has its own performance highly dependent on the data spatial distribution. The main contribution of this paper is the development of a methodology that optimizes the results of any clustering algorithm, regardless of data spatial distribution. The proposal is to evaluate the internal correlation of each cluster to proceed or not in a new partitioning round. In summary, the traditional validation indexes will continue to be used in the cluster’s partition process, but it is the internal correlation measure of each one that will define the stopping splitting criteria. This approach was tested in a real waveforms database using the K-means algorithm with the Silhouette and also the Davies–Bouldin validation indexes. The results were compared with a specific methodology for that database and were shown to be totally consistent.
1. Introduction
Industrial networks, as well as electric power ones, play a fundamental role in the goods and services production. Reliability and security are fundamental requirements that guide the technologies development associated to these equipments. The recorded events, also called oscilographies, can represent disturbances on the system. As mentioned in the abstract, these oscillographic databases are immense and the scientific community has been working on this topic to find solutions that allow a better use them for knowledge generation purposes. Works [1,2,3] are prominent examples in the literature.
The authors of [4] made a primary classification (Table 1) of main disturbances that may affect power systems. The massive instrumentation of these networks has motivated research in data analysys for the development of predictive maintenance strategies. Refs. [5,6] bring an extensive literature review of machine learning methods applied to this theme.

Table 1.
Primary classification of the main electrical disturbances.
Machine Learning is a research area dedicated to knowledge extraction from databases to decision making support. Two distinct branches of research are derived from Machine Learning: supervised and unsupervised learning. In the first, the data are labeled; that is, there is prior knowledge about the desired system output. In the second, there is no prior information about the relationship between the data and the system’s response.
Clustering is considered one of the most relevant approaches in unsupervised learning because it deals with database partition [7] in unknown scenarios. In many cases clustering is the starting point of a complex knowledge extraction process. In short, clustering is a procedure of grouping objects according to their similarity, that is, similar objects will belong to the same cluster.
In case of electrical power networks, the unlabeled data generation rate from massive instrumentation is much higher than the human analysis capacity. The clustering can reduce the dimensionality of the problem by grouping oscillographic records in similar classes, allowing the experts to focus only on the most characteristic events. Several research lines have been engaged in the development of automatic clustering methods.
Still on this issue, several researchers have engaged to proposing metrics (or validations indexes) that support clustering schemes. The authors of [8,9] propose density-based algorithms. The performance of these techniques is highly dependent on very large data volumes as shown in the work of [10]. Refs. [11,12] highlight the proximity of events as a grouping metric.
The validation indexes for clustering are divided into two categories: external and internal [13]. External indexes use a standard (labeled) test set to rank the results. Internal ones, on the other hand, refer to the analysis of the intrinsic information of the database itself. The second option was chosen in this work because, in general, real oscillographic records are totally unlabelled.
This work proposes a hybrid technique using a proximity-based validation index for clustering in the attribute space. In the time series representation space, a similarity-based confidence metric was used to check whether clusters need a new partitioning round. This metric was calculated by cross-correlation between individual events and the most representative waveform. This proposal proved to be quite adequate for grouping time series.
This paper is organized as follows. Section 2 gives a brief description of the main works related to the clustering problem. Section 3 details the clustering algorithm and validation indexes used in this work. Section 4 explores a case where simultaneous application of same clustering technique to an oscillographic database and a labeled subset of it yields completely inconsistent results. Section 5 describes the proposal of using cross-correlation as a confidence metric to complement traditional clustering validation indexes. Section 6 presents the results of applying the proposed methodology, comparing and validating them with those ones obtained from a specific methodology. Finally, Section 7 presents conclusions of this work, as well as some suggestions for future works.
2. Related Works
The scientific community has been dedicated to the development of algorithms and evaluation metrics related to the clustering problem. Despite the huge amount of published works, an independent approach to the database’s intrinsic characteristics has not yet been found, resulting in a large number of particular solutions, each one with its advantages and disadvantages.
Therefore, it is necessary to verify the different methodologies used, in order to facilitate the algorithm’s understanding, as well as the metrics used for their evaluations.
Ref. [7] presents a very broad classification of the main clustering alternatives proposed in the literature. That paper also points out the advantages and disadvantages of each algorithm. Table 2 summarizes these categories with examples of their implementations.
Table 2.
Clustering Algorithms Categories.
Recent works have proposed complex algorithms to overcome the weaknesses presented by their predecessors. However, such alternatives come at a high computational cost. The work of [38] proposes clustering and validation process based on graphs theory. The graphs are generated from an iterative process where clusters are recursively divided in two via principal component analysis. Finally a minimum spanning tree is constructed and used to estimate cluster quality from the distance between centroids. The authors state that this new approach overcomes limitations of traditional algorithms and it is effective for partitions of different shapes and sizes.
Ref. [39] argue that traditional clustering algorithms such as K-means and DBSCAN [40] are uneffective for partitioning geometrically indistinguishable databases (e.g., databases with the same mean and different variances). Authors propose the use of Kullback–Leibler Divergence [41] as a similarity metric to be integrated in density-based clustering techniques. The high computational cost of this implementation was minimized by using the Gauss Transform for density estimation. The proposed technique were validated considering a synthetic database using two distribution types: Gaussian and Inverse Gaussian.
A new separation measure for clustering was proposed in [42]. The non-Gaussianity of a mixture of Gaussians to evaluate the difference between two clusters was explored. Authors applied the Quadratic Rényi Entropy [43] to establish an analytical solution to diferentiate merged gaussians. This new method was tested on complex data sets, synthetic and real. Despite the good performance, the authors did not make it clear what the computational cost is for less complex databases. The methodology integration with different clustering algorithms has not been explored either.
The work of [44] presents a methodology for automatic analysis of disturbances in power plants, based on fuzzy reasoning. The purpose of the system is to support people responsible for pre-classifying data and also diagnosing relevant occurrences. In general, the authors propose the decomposition of voltage and current transients in symmetrical components to feed the fuzzy classification logic. Although the results demonstrate an excellent performance, the work limited the search space to three types of failures, not making clear its applicability to other disturbances.
Ref. [45] presented a methodology to improve the efficiency of hierarchical clustering. Instead of clustering on individual data objects, the hierarchy was based on a group of sub-clusters created by a partitional method like K-means. The results showed a significant reduction in computational cost besides of high correlation with the results based on the hierarchization performed using database without any preprocessing. However, the work does not address any alternative to automate the clustering process.
The authors of [46] proposed a new algorithm based on graph connectivity concept. Such an approach uses geodesic distance [47] as a measure of dissimilarity which defines the vertices that will be connected by edges. The algorithm showed good performance in synthetic databases built with different distributions, but still kept the number of clusters as an input parameter.
The works of [48,49] bring a semi-supervised approach to the classification of oscilographies, ie a labeled database is needed for the classification of known disturbances and the respective indication of novelties. The purpose of this work does not depend on prior knowledge of the database.
3. Clustering Approach
The algorithm chosen for data clustering was the traditional K-Means [14]. This choice is justified because it is an algorithm widely evaluated by the scientific community, in addition to being easy to implement. These qualifications allow the exploration of a large and reliable database for comparison and analysis.
The clustering process performed by K-Means consists of the initial definition of K centroids and the assignment of events (vectors of attributes), which are being inserted as input, to the cluster with the nearest centroid. As the objects are inserted and assigned to the clusters, the centroids are updated until they have no or little changes.
As previously mentioned, the allocation of objects to a given cluster is based on proximity to the centroids, measured according to a specific function. Different distance metrics can be applied according to the data nature. Among them, the chosen one was the Euclidean distance. In this context, each database event can be represented by a point in the euclidean space, whose coordinates correspond to their respective attributes.
The process of assigning objects to the clusters and updating centroids is iterative and the objective function is the so-called Sum of Squared Errors (SSE), in which errors are measured as the Euclidean distances from each point to the nearest centroid as shown in Equation (1).
where:
- K is the number of clusters;
- x is a object represented by a attributes vector;
- i-th cluster;
- is Euclidean distance function;
- is the centroid of .
The centroids correspond to the average of the attribute vectors that represent the objects in each cluster. The respective update function is presented by Equation (2).
where:
- x is object (point in euclidean space);
- i-th cluster;
- centroid of ;
- number of objects in .
In summary, the goal is to obtain centroids that minimize the SSE value, that is, the best separation of the objects and the best representation points (centroids) of each cluster. However, regardless of seeking the minimization of SSE, the K-Means algorithm does not guarantee to reach global minimum, that is, the best possible result of separating events, since it depends on centroids initialization and the optimization process does not consider all possible combinations of the initial centroids.
3.1. Clustering Validation Indices
As previously presented in Section 1, external validation metrics are applied, preferably, when there is a prior knowledge about database. However, due to the lack of such information in many real data sets, internal validation metrics are more widely used. These indices are based on the characteristics of coherence(maximizing the intragroup similarity) or groups separation (maximizing the intergroup dissimilarity) [50].
There are several validation indices, based on metrics described above. Among others, the Silhouette Index, Davies–Bouldin Index (DB), Dunn Index, and Calinski–Harabasz Index can be cited [51]. These indices, based on intrinsic knowledge of dataset, generate values that correctly interpreted indicate how good the results were, as well as, in some cases, the optimal number of clusters.
The following are the two indices used in this work:
3.1.1. Silhouette Index
The Silhouette Index is applied in cases of exclusive partitional grouping and takes into account measures of coherence and separation of events in a cluster [50]. To obtain the individual Silhouette value of each event, Equation (3) is used.
where:
- i represents the a object in database;
- is the average distance between object i and all objects of the same cluster;
- is the average distance between object i and all objects out of its cluster;
- is the normalization factor.
The Silhouette Index ranges between [−1,1] and is characterized by having high values (closer to 1) when an object i exhibits greater degree of belonging to its own cluster. Otherwise this index tends to approach −1. Therefore, high Silhouette values reflect good solutions for clustering process [50].
3.1.2. Davies–Bouldin (DB) Index
The Davies–Bouldin Index takes into account the intergroup distance, i.e., how far the clusters are from each other, and intragroup distance, that is, the compactness of each cluster [52,53]. To obtain DB Index, Equation (4) is used.
where:
- and are variances of clusters m and n, respectively;
- K is the number of clusters;
- is the distance between clusters m and n.
Cluster variance is related to the intragroup distance, that is, based on the distance between each cluster event and its respective centroid. The distance between clusters is related to the intergroup distance, i.e., based on the distance between centroids [52,53].
In general terms, good clustering results are achieved by obtaining cohesive and well-separated clusters characterized by having small DB values [53].
4. Problem Identification
The problem arose from the need to analyze a database with 52,299 oscillographic records from a substation of the Brazilian Electric Power System (EPS). After intense and time-consuming manual work, only 438 records were analyzed and partitioned in four classes of known events. Then, the same data subset was submitted to clustering using the K-means algorithm, configured to generate four clusters. The clusters composition coincided perfectly with the separation made by experts.
Considering that this new labeled database has less than of all events and that a supervised classification method (e.g., artificial neural network) would require more than records for training, this alternative, as well as the analysis of all events became impracticable. To start the investigation of this problem, two approaches were compared:
- Performing clustering on entire database using the same technique used on labeled subset;
- Assigning events from original database to the clusters of reduced subset. An event would be assigned to a cluster if it was inside of a virtual sphere represented by cluster’s centroid and its radius. Otherwise it would belong a new particular cluster.
4.1. Database
The database used in this work was provided by the Electric Energy Research Center (CEPEL). This basis is constituted by transient voltage events collected in a substation of Brazilian EPS. Signals were sampled at 1MHz in one second time window, that is, each event was characterized by 1,000,000 samples. It is important to emphasize that the fundamental component was filtered by the system acquisition before signal recording. The instrumentation installed at each stage produced different attenuation levels and therefore it was necessary to establish a scale factor for the measurements uniformization.
It is noteworthy that the consistency of the data was guaranteed by the mentioned institution. If there was no such guarantee, the work proposals [54,55] could be applied.
4.2. Attributes Extraction
Three attributes were elected to be processed: the maximum signal excursion, its RMS value and its energy. Before the extraction itself, the scaling factor was applyed and the DC component was also suppressed in order to eliminate signal offset.
The maximum excursion () was obtained by subtracting the maximum and minimum values of the amplitude of each recorded event.
- N is sample’s length;
- is teh n-sample.
The attributes extraction allowed the database transformation in such a way that each event, previously characterized by 1,000,000 samples, became a three-dimensional vector (point in Euclidean space).
In order to ensure that all attributes will have the same influence on the clustering process, the Z-Score [51] standardization was applied. Equation (7) defines the calculation procedure for this normalization.
where:
- is attribute normalized value;
- A attribute original value;
- is tha attribute means value;
- is attribute standard deviation.
After this process, each database attribute had zero mean and unit variance, without changing the database shape.
4.3. Preliminary Clustering Results
As previously mentioned, the K-Means algorithm was chosen to test the proposed methodology. The K-Means configuration was as follows:
- Minimum number of clusters: 2.
- Maximum number of clusters: 30.
- Initialization of centroids: K-Means ++ [58].
- Maximum number of iterations: 500.
- Distance function: Euclidean.
The best number of clusters was found using Silhouette and Davies–Bouldin (DB) validation indexes. The original database is composed of 52,299 oscilographies and the reduced (initial) subset is formed with 438 ones. As shown in Figure 1, the best results of reduced subset partitioning, for both indexes, produced four clusters whose composition can be observed in Table 3.
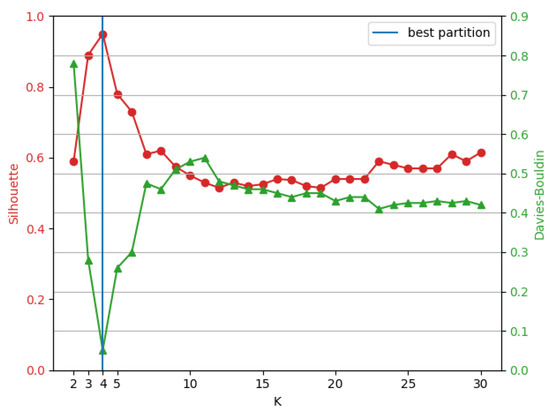
Figure 1.
Clustering evaluation for 438 events.
Table 3.
Clustering result.
It would be expected that aplying the same approach on entire database provided at least the same number of clusters as was obtained from reduced labeled database since it is a subset from original one. However, as shown in Figure 2, the two validation indices indicated only two clusters as the best clustering result. The composition of each cluster can be seen in Table 4.
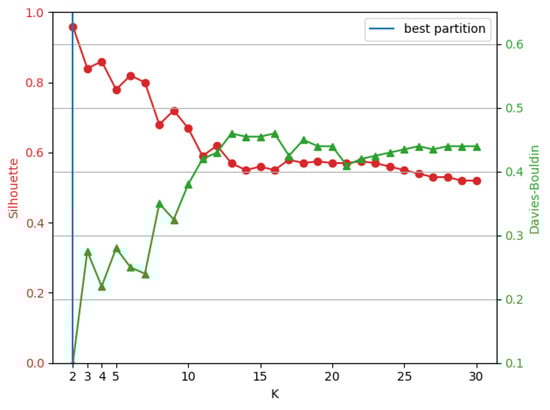
Figure 2.
Clustering evaluation for 52,299 events.
Table 4.
Clustering for 52,299 events.
Following the planned procedure, an attempt was made to clustering the entire database using the supporting spheres obtained from the reduced subset. As stated before, each data object that was within a virtual cluster sphere would be assigned to this cluster and all events that did not match this rule would be grouped into a particular new cluster. The results presented in Table 5 show that of the events were not allocated to supporting spheres, suggesting a generalization of the solution for objects outside the reduced database.
Table 5.
Assigning data events to support clusters.
It should be noted that the maximum and minimum points in Figure 2 are not as evident as those in Figure 1, suggesting a certain weakness in the criterion adopted to discover the optimal value of “k”. To investigate this problem in depth, it was decided to use the methodology proposed by [59] which, in short, uses a variant of Bayesian Information Criterion (BIC) to determine the optimal value of K in a clustering process.
BIC index is calculated as Equation (8)
where:
- m is the number of clusters;
- n is the size of dataset;
- is the size of ith cluster;
- d degree of freedom.
Under identical spherical Gaussian assumption, maximum BIC value is related to optimal number of clusters. Nevertheless this assumption does not reflect the reality of oscillographic records whose partitions can take completely different forms. In general, there is an initial asymptotic growth of BIC with high angular coefficient and from a certain value, the index keeps growing but slower. This tipping point is called the “BIC knee” that represents the threshold value for finding the best solution for the clustering process. Numerous techniques for finding this “knee” are presented in the literature.
The procedures for using this technique can be summarized as follows:
- 1.
- Record p BIC values for K range (number of clusters) to be investigated;
- 2.
- Calculate and record angular coefficients of lines passing through the point related to the first calculated BIC and other recorded values;
- 3.
- Normalize both sequences to be on the same scale;
- 4.
- Find the intersection point of curves formed by the two normalized sequences.
The last step of these procedures provides the upper limit of the BIC range that needs to be analyzed. With this information, it is defined that optimal BIC is the maximum value found in the new range, excluding the upper limit.
Figure 3 shows the result of applying the described technique to determine the upper limit of clusters related to the partitioning of original database.
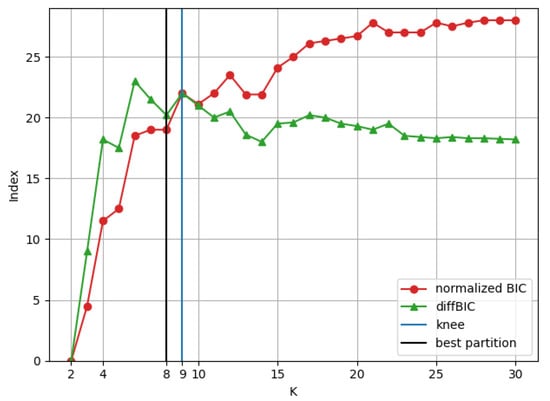
Figure 3.
K range difinition by normalized BIC.
According to Figure 3, the two curves intersect at a point corresponding to . This is considered the “knee” of the BIC growth curve and, therefore, it can be concluded that such methodology points to eight clusters as the optimal solution.
The previous results can be summarized in the following sequence:
- 1.
- The validation indexes accurately indicated the four groupings contained in a reduced and labeled subset of the original database.
- 2.
- The clustering of the original base, using the same validation indexes applied in the first experiment, produced a completely incoherent result, that is, only two clusters.
- 3.
- The attempt to use the supporting spheres obtained in the first experiment to cluster the original database proved inadequate, since most events occurred outside them.
- 4.
- Using a BIC-based metric to choose the optimal number of clusters for the original database indicated that validation indices might be unreliable.
5. Methodology
The methodology used in this work derives from final considerations of previous section. As the validation indexes are based on statistical methods or related to similarity/dissimilarity measures, the results are very dependent on the spatial distribution of each data set. Thus, if a subset of a database has a spatial distribution that does not reflect the global distribution, its clustering will produce a partition pattern inconsistent with that produced when the entire database was used.
Now it is necessary to answer this question of how to measure the reliability of the clustering validation index. In other words: how can we check if the events belonging to a cluster are similar enough?
Cross-correlation emerges as a suitable technique for such verification, since it is a similarity measure of two sequences. In general terms, the cross-correlation of two vectors x and y can be expressed by Equation (9):
However, comparing cross-correlation values only makes sense when the energy levels of the two signals have the same order of magnitude. Therefore, it is necessary to use a scale factor to normalize the two vectors. Equation (10) presents this procedure.
The upper limit of normalized cross-correlation occurs when the two vectors are identical. On the other hand, the lower limit of this metric is achieved when the two sequences are totally uncorrelated, i.e., when the vectors are reversed.
It should be noted that another metric very similar to Equation (10) could also be used. It is the Modal Assurance Criterion (MAC), presented in [60,61]. It is nothing more than the square of Equation (10). MAC values close to 1 indicate strong similarity, while those close to 0 indicate low similarity.
The previous definitions considered the cross-correlation as a static overlap of two vectors. Thinking of this metric as a coherent similarity value, they must be in phase. However, there is no guarantee that all recording triggers have been aligned. Thus, it is necessary to evaluate this metric by making a dynamic overlap by shifting one of the vectors. The result will be the maximum value found. Equation (11) presents this metric:
where:
- N is the dimension of vectors;
- n is the index of vectors;
- k is the shift parameter.
It remains to determine how to apply this metric to evaluate the cluster confidence level. This paper proposes the use of normalized mean cross-correlation value between the most representative event of the cluster, and others. The most representative event is considered the one closest to the centroid.
Clusters with low cross-correlation values will be subjected to clustering process again.
In general terms, the proposed methodology can be summarized by the Algorithm 1.
| Algorithm 1 New Clustering Approach |
Input: data, tolerance Output: goodClusterList
|
6. Results
The results to be explored in this section refer to the application of the methodology (Section 5) in two databases: the original set of 52,299 oscillographic records from a Brazilian EPS substation and a subset of it (438 waveforms), whose events were previously classified by experts.
For an intuitive view of the data, Figure 4 presents four types of disturbances from the set of oscillographies that are visually distinguishable.
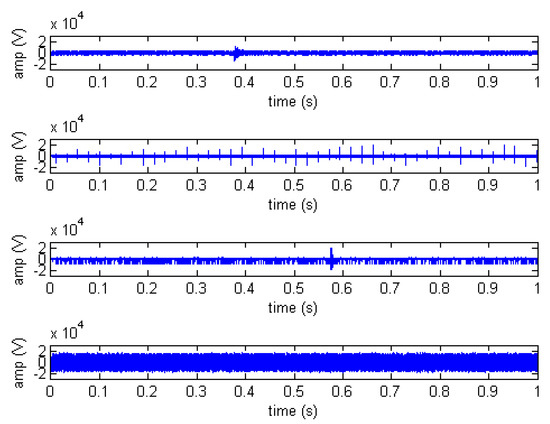
Figure 4.
Different disturbances examples of database.
6.1. Scenario 1: Database Subset
As presented in Section 4, the best Silhouette validation index was that corresponded to .
The results presented in Table 6 show that all clusters in this scenario presented high cross-correlation values indicating high confidence level of clustering process. Considering that the clustering result reflects exactly the previous classification of subset, this confidence level was coherent.
Table 6.
Clustering confidence level evaluation for 438 osciligraphies.
6.2. Scenario 2: Complete Database
The partitioning evaluation of complete database pointed to 2 as the best K, for an average Silhouette index of . This value is slightly higher than that found in the labeled subset evaluation. However, the number of clusters was totally inconsistent, since it was already known that there were at least four classes of events.
Regarding the cross-correlation metric presented in Table 7, it can be observed that cluster 1 (the largest one) presented a value approximately lower than cluster 2, indicating that the confidence level of clustering process got worse. Following the methodology proposed in the Section 5, cluster 1 must undergo a new clustering process. The results of this second round can be seen in Table 8.
Table 7.
Clustering confidence level evaluation for 52,299 osciligraphies.
Table 8.
Clustering confidence level evaluation for 51,132 osciligraphies.
As can be seen in Table 8, the cluster submitted to the clustering second round produced two new clusters. The average Silhouette index in this case was . Once again, it was observed that cluster 1 had a confidence level about lower than the second one. The iterative approach continues and cluster 1 will undergo a new partitioning round.
The highest Silhouette index value for the third clustering round was 0.7775881013. This value was found for . The results of this new clustering step are shown in Table 9.
Table 9.
Clustering confidence level evaluation for 48,098 osciligraphies.
Third clustering round produced cross-correlation values very close to 1 and variation between these metrics was no more than , giving these results high robustness and stopping iterative process.
The final result of new proposed approach is summarized in Table 10. Additionally, the clusters distribution in Euclidean space can be observed in Figure 5. It is noteworthy that cluster was quite detached from the others and therefore, to provide a better visualization of general distribution, it was not visualized in this figure.
Table 10.
New clustering approach: 52,299 oscilographies.
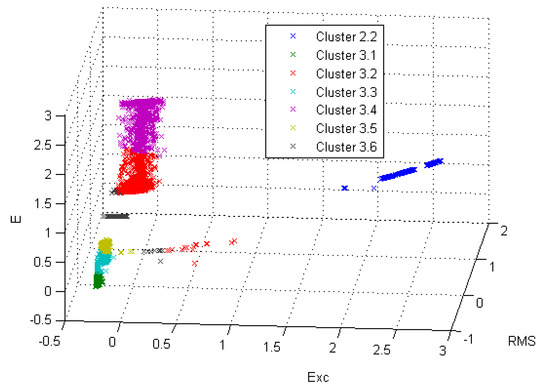
Figure 5.
Clustering result in Euclidean space.
The result of applying a confidence metric to the clustering validation process according to the methodology presented in Section 5 yielded a much more coherent result since the number of clusters increased from 2 to 8, which is higher than number of clusters found in the expert database subset clustering. In addition to the result that confirms the understanding that in practice a power substation is certainly susceptible to more than two types of transient events, it confirms the result obtained in Section 4.3, when the BIC was used as a metric for choosing the optimal number of clusters.
It is also necessary to check whether the composition of each cluster matches the clustering result by setting in advance the number of clusters.
This procedure can be done immediately by applying K-means with in the same database and comparing the results obtained with results of proposed approach. This comparison is presented in Table 11.
Table 11.
Composition comparison: New Approach vs. K-Means (K = 8).
Considering 52,299 events, 1732 had different allocation in the two clustering approaches. This variation represents less than of the total, confirming the validity of the proposal of this work.
As shown in Table 12, the cross-correlation measures for both approaches were quite similar with a slight superiority to the iterative process proposed in this paper.
Table 12.
comparison: New Approach vs. K-Means (K = 8).
7. Conclusions and Future Works
This paper addressed the difficulty of obtaining reliable clustering results, considering that shape and intrinsic properties of each database can decisively influence the performance of differents clustering algorithms and respective validation indexes.
This theme was well illustrated with simultaneous application of K-means algorithm, Silhouette and DB validation indexes to an oscillographic database and a labeled subset of it. Results were completely inconsistent although validation indices indicated optimal solutions.
A subset of a database of 52,299 oscillographic records was previously classified by experts, who found four distinct disturbances classes. The application of the K-means algorithm together with the Silhouette and Davis Boudain validation indexes reproduced an identical partitioning. The same approach applied to the entire database generated only two clusters.
A new methodology was proposed to verify the reliability of validation indexes. The metric chosen was the average value of the cross-correlation between the most representative event of a cluster and its respective neighbors. Clusters with low reliability would be subjected to a new round of partitioning. When all clusters have an acceptable reliability, the iterative process stops.
The results of applying this new methodology were quite consistent, since the non-conformities found between clustering a large database and a subset of it were repaired. In addition, the results were validated by comparing the partitions generated by the new approach with specific techniques (Refs. [14,59]) for finding an optimal partitioning.
A qualitative comparison between this proposal and previous benchmarks (Figure 2 and Figure 3) is visually difficult to make, since in this approach each cluster is evaluated individually, while in traditional methods the quality of all partitioning is evaluated. Another advantage of the methodology proposed in this work is that there is no dependence on the geometry of the clusters, which is a basic premise for BIC proper functioning.
It can be concluded that the methodology proposed in this work represents a first step for development of algorithms and validation indexes immune to particular database features. Investigating other approaches to applying cross-correlation as a confidence metric and exploring results with more robust techniques for extracting and selecting attributes are some alternatives for future works.
Author Contributions
Conceptualization, V.H.F.; methodology, A.d.C.P. and B.S.R.; software, A.d.C.P. and B.S.R.; validation, V.H.F. and A.d.C.P.; formal analysis, A.d.C.P. and B.S.R.; investigation, V.H.F., A.d.C.P., B.S.R. and D.S.d.S.; resources, D.S.d.S.; data curation, D.S.d.S.; writing—original draft preparation, A.d.C.P.; writing—review and editing, V.H.F. and A.d.C.P.; visualization, V.H.F. and A.d.C.P.; supervision, V.H.F. and A.d.C.P.; project administration, V.H.F. All authors have read and agreed to the published version of the manuscript.
Funding
This research was funded by the FAPERJ E03/2017 (Programa Jovem Cientista do Nosso Estado) n. 203.292/2017.
Institutional Review Board Statement
Not applicable.
Informed Consent Statement
Not applicable.
Data Availability Statement
Not applicable.
Conflicts of Interest
The authors declare no conflict of interest.
References
- Wang, M.H.; Yau, H.T. New Power Quality Analysis Method Based on Chaos Synchronization and Extension Neural Network. Energies 2014, 7, 6340–6357. [Google Scholar] [CrossRef]
- Louro, M.; Ferreira, L. Underground MV Network Failures’ Waveform Characteristics—An Investigation. Energies 2021, 14, 1216. [Google Scholar] [CrossRef]
- Moon, S.K.; Kim, J.O.; Kim, C. Multi-Labeled Recognition of Distribution System Conditions by a Waveform Feature Learning Model. Energies 2019, 12, 1115. [Google Scholar] [CrossRef]
- Xie, S.; Xiao, F.; Ai, Q.; Zhou, G. Classification of Underlying Causes of Power Quality Disturbances Using Data Fusion. In Proceedings of the 2018 International Conference on Power System Technology (POWERCON), Guangzhou, China, 6–8 November 2018; pp. 4118–4123. [Google Scholar]
- Carvalho, T.P.; Soares, F.A.; Vita, R.; Francisco, R.d.P.; Basto, J.P.; Alcalá, S.G. A systematic literature review of machine learning methods applied to predictive maintenance. Comput. Ind. Eng. 2019, 137, 106024. [Google Scholar] [CrossRef]
- Zonta, T.; da Costa, C.A.; da Rosa Righi, R.; de Lima, M.J.; da Trindade, E.S.; Li, G.P. Predictive maintenance in the Industry 4.0: A systematic literature review. Comput. Ind. Eng. 2020, 150, 106889. [Google Scholar] [CrossRef]
- Xu, D.; Tian, Y. A Comprehensive Survey of Clustering Algorithms. Ann. Data Sci. 2015, 2, 165–193. [Google Scholar] [CrossRef]
- Chen, Z.; Chang, D.; Zhao, Y. An automatic clustering algorithm based on region segmentation. IEEE Access 2018, 6, 74247–74259. [Google Scholar] [CrossRef]
- Wang, G.; Song, Q. Automatic clustering via outward statistical testing on density metrics. IEEE Trans. Knowl. Data Eng. 2016, 28, 1971–1985. [Google Scholar] [CrossRef]
- Lazzaretti, A.E.; Ferreira, V.H.; Neto, H.V. New Trends in Power Quality Event Analysis: Novelty Detection and Unsupervised Classification. J. Control. Autom. Electr. Syst. 2016, 27, 718–727. [Google Scholar] [CrossRef]
- Pedrycz, W.; Loia, V.; Senatore, S. P-FCM: A proximity—Based fuzzy clustering. Fuzzy Sets Syst. 2004, 148, 21–41. [Google Scholar] [CrossRef]
- Ghiassi, M.; Saidane, H.; Oswal, R. YAC2: An α-proximity based clustering algorithm. Expert Syst. Appl. 2021, 167, 114138. [Google Scholar] [CrossRef]
- Rendón, E.; Abundez, I.; Arizmendi, A.; Quiroz, E.M. Internal versus External cluster validation indexes. Int. J. Comput. Commun. 2011, 5, 27–34. [Google Scholar]
- Jain, A.K. Data clustering: 50 years beyond K-means. Pattern Recognit. Lett. 2010, 31, 651–666. [Google Scholar] [CrossRef]
- Park, H.S.; Jun, C.H. A simple and fast algorithm for K-medoids clustering. Expert Syst. Appl. 2009, 36, 3336–3341. [Google Scholar] [CrossRef]
- Pelleg, D.; Moore, A. X-means: Extending K-means with Efficient Estimation of the Number of Clusters. arXiv 2015, arXiv:1011.1669v3. [Google Scholar]
- Van der Laan, M.J.; Pollard, K.S.; Bryan, J. A new partitioning around medoids algorithm. J. Stat. Comput. Simul. 2003, 73, 575–584. [Google Scholar] [CrossRef]
- Han, J.; Kamber, M.; Pei, J. Data Mining: Concepts and Techniques; Elsevier: Waltham, MA, USA, 2012. [Google Scholar]
- Ng, R.T.; Han, J. CLARANS: A method for clustering objects for spatial data mining. IEEE Trans. Knowl. Data Eng. 2002, 14, 1003–1016. [Google Scholar] [CrossRef]
- Zhang, T.; Ramakrishnan, R.; Livny, M. BIRCH: An Efficient Data Clustering Method for Very Large Databases. ACM SIGMOD Rec. 1996, 25, 103–114. [Google Scholar] [CrossRef]
- Guha, S.; Rastogi, R.; Shim, K. CURE: An efficient clustering algorithm for large databases. Inf. Syst. 2001, 26, 35–58. [Google Scholar] [CrossRef]
- Guha, S.; Rastogi, R.; Shim, K. Rock: A robust clustering algorithm for categorical attributes. Inf. Syst. 2000, 25, 345–366. [Google Scholar] [CrossRef]
- Barton, T.; Bruna, T.; Kordik, P. Chameleon 2: An improved graph-based clustering algorithm. ACM Trans. Knowl. Discov. Data 2019, 13, 10. [Google Scholar] [CrossRef]
- Suganya, R.; Shanthi, R. Fuzzy C-Means Algorithm—A Review. Int. J. Sci. Res. Publ. 2012, 2, 1. [Google Scholar]
- Dave, R.N.; Bhaswan, K. Adaptive Fuzzy c-Shells Clustering and Detection of Ellipses. IEEE Trans. Neural Netw. 1992, 3, 643–662. [Google Scholar] [CrossRef]
- Yager, R.R.; Filev, D.P. Approximate Clustering via the Mountain Method. IEEE Trans. Syst. Man Cybern. 1994, 24, 1279–1284. [Google Scholar] [CrossRef]
- Ware, V.S.; Bharathi, H.N. Study of Density based Algorithms. Int. J. Comput. Appl. 2013, 69, 1–4. [Google Scholar]
- Ester, M.; Kriegel, H.P.; Sander, J.; Xu, X. A Density-Based Algorithm for Discovering Clusters in Large Spatial Databases with Noise. In Proceedings of the 2nd International Conference on Knowledge Discovery and Data Mining, Portland, OR, USA, 2–4 August 1996. [Google Scholar]
- Ankerst, M.; Breunig, M.M.; Kriegel, H.P.; Sander, J. OPTICS: Ordering Points to Identify the Clustering Structure. ACM SIGMOD Rec. 1999, 28, 49–60. [Google Scholar] [CrossRef]
- Comaniciu, D.; Meer, P. Mean shift: A robust approach toward feature space analysis. IEEE Trans. Pattern Anal. Mach. Intell. 2002, 24, 603–619. [Google Scholar] [CrossRef]
- Sharan, R.; Shamir, R. CLICK: A clustering algorithm with applications to gene expression analysis. In Proceedings of the 8th International Conference on Intelligent Systems for Molecular Biology, La Jolla/San Diego, CA, USA, 19–23 August 2000. [Google Scholar]
- Bateni, M.H.; Behnezhad, S.; Derakhshan, M.; Hajiaghayi, M.T.; Kiveris, R.; Lattanzi, S.; Mirrokni, V. Affinity clustering: Hierarchical clustering at scale. In Proceedings of the 31st International Conference on Neural Information Processing Systems, Long Beach, CA, USA, 4–9 December 2017. [Google Scholar]
- Shah, M.; Nair, S. A Survey of Data Mining Clustering Algorithms. Int. J. Comput. Appl. 2015, 128, 1–5. [Google Scholar] [CrossRef]
- Jafar, O.M.; Sivakumar, R. Ant-based Clustering Algorithms: A Brief Survey. Int. J. Comput. Theory Eng. 2010, 2, 787–796. [Google Scholar] [CrossRef]
- Rana, S.; Jasola, S.; Kumar, R. A review on particle swarm optimization algorithms and their applications to data clustering. Artif. Intell. Rev. 2011, 35, 211–222. [Google Scholar] [CrossRef]
- Amiri, B.; Fathian, M.; Maroosi, A. Application of shuffled frog-leaping algorithm on clustering. Int. J. Adv. Manuf. Technol. 2009, 45, 199–209. [Google Scholar] [CrossRef]
- Karaboga, D.; Ozturk, C. A novel clustering approach: Artificial Bee Colony (ABC) algorithm. Appl. Soft Comput. J. 2011, 11, 652–657. [Google Scholar] [CrossRef]
- Rojas-Thomas, J.C.; Santos, M.; Mora, M. New internal index for clustering validation based on graphs. Expert Syst. Appl. 2017, 86, 334–349. [Google Scholar] [CrossRef]
- Sathiya, S.; Vadivelan, A.G. Clustering uncertain data based on probability distribution similarity. Int. J. Appl. Eng. Res. 2015, 25, 751–763. [Google Scholar]
- Schubert, E.; Sander, J.; Ester, M.; Kriegel, H.P.; Xu, X. DBSCAN revisited, revisited: Why and how you should (still) use DBSCAN. ACM Trans. Database Syst. 2017, 42, 19. [Google Scholar] [CrossRef]
- Clim, A.; Zota, R.D.; Tinica, G. The kullback-leibler divergence used in machine learning algorithms for health care applications and hypertension prediction: A literature review. Procedia Comput. Sci. 2018, 141, 448–453. [Google Scholar] [CrossRef]
- Martins, A.; Duarte, A.; Dantas, J.; Principe, J. A New Clustering Separation Measure Based on Negentropy. J. Control. Autom. Electr. Syst. 2015, 26, 28–45. [Google Scholar] [CrossRef]
- Källberg, D.; Leonenko, N.; Seleznjev, O. Statistical estimation of quadratic Rényi entropy for a stationary m-dependent sequence. J. Nonparametric Stat. 2014, 26, 385–411. [Google Scholar] [CrossRef]
- Moreto, M.; Cieslak, D.A.G. Fuzzy Inference System to Automatic Fault Classification in Power Plants. IEEE Lat. Am. Trans. 2016, 14, 746–751. [Google Scholar] [CrossRef]
- Bouguettaya, A.; Yu, Q.; Liu, X.; Zhou, X.; Song, A. Efficient agglomerative hierarchical clustering. Expert Syst. Appl. 2015, 42, 2785–2797. [Google Scholar] [CrossRef]
- Li, Y.F.; Lu, L.H.; Hung, Y.C. A new clustering algorithm based on graph connectivity. Adv. Intell. Syst. Comput. 2019, 858, 442–454. [Google Scholar]
- Király, A.; Vathy-Fogarassy, Á.; Abonyi, J. Geodesic distance based fuzzy c-medoid clustering—Searching for central points in graphs and high dimensional data. Fuzzy Sets Syst. 2016, 286, 157–172. [Google Scholar] [CrossRef]
- Lazzaretti, A.E.; Ferreira, V.H.; Neto, H.V.; Toledo, L.F.; Pinto, C.L. A new approach for event classification and novelty detection in power distribution networks. In Proceedings of the 2013 IEEE Power & Energy Society General Meeting, Vancouver, BC, Canada, 21–25 July 2013. [Google Scholar]
- Lazzaretti, A.E.; Tax, D.M.J.; Vieira Neto, H.; Ferreira, V.H. Novelty detection and multi-class classification in power distribution voltage waveforms. Expert Syst. Appl. 2016, 45, 322–330. [Google Scholar] [CrossRef]
- Tan, P.N.; Steinbach, M.; Karpatne, A.; Kumar, V. Introduction to Data Mining, 2nd ed.; Pearson: London, UK, 2018. [Google Scholar]
- Haykin, S.S. Neural Networks and Learning Machines, 3rd ed.; Pearson Education: Upper Saddle River, NJ, USA, 2009. [Google Scholar]
- Davies, D.L.; Bouldin, D.W. A Cluster Separation Measure. IEEE Trans. Pattern Anal. Mach. Intell. 1979, PAMI-1, 224–227. [Google Scholar] [CrossRef]
- Flann, N.; Recker, M.; Xu, B.; Qi Xiaojun an Ye, L. Clustering Educational Digital Library Usage Data: A Comparison of Latent Class Analysis and K-Means Algorithms. J. Educ. Data Min. 2013, 5, 38–68. [Google Scholar]
- Chen, Y.; Avitabile, P.; Page, C.; Dodson, J. A polynomial based dynamic expansion and data consistency assessment and modification for cylindrical shell structures. Mech. Syst. Signal Process. 2021, 154, 107574. [Google Scholar] [CrossRef]
- Chen, Y.; Avitabile, P.; Dodson, J. Data Consistency Assessment Function (DCAF). Mech. Syst. Signal Process. 2020, 141, 106688. [Google Scholar] [CrossRef]
- Ribeiro, P.F.; Silveira, P.M.; Duque, C.A.; Cerqueira, A.S. Power Systems Signal Processing for Smart Grids, 1st ed.; Wiley: Hoboken, NJ, USA, 2014. [Google Scholar]
- Haykin, S. Signals and Systems, 2nd ed.; Wiley: New York, NY, USA, 2002; p. 802. [Google Scholar]
- Arthur, D.; Vassilvitskii, S. K-means++: The advantages of careful seeding. In Proceedings of the Annual ACM-SIAM Symposium on Discrete Algorithms, New Orleans, LA, USA, 7–9 January 2007. [Google Scholar]
- Zhao, Q.; Xu, M.; Fränti, P. Knee point detection on bayesian information criterion. In Proceedings of the 2008 20th IEEE International Conference on Tools with Artificial Intelligence, Dayton, OH, USA, 3–5 November 2008; pp. 431–438. [Google Scholar]
- Chen, Y.; Logan, P.; Avitabile, P.; Dodson, J. Non-Model Based Expansion from Limited Points to an Augmented Set of Points Using Chebyshev Polynomials. Exp. Tech. 2019, 43, 521–543. [Google Scholar] [CrossRef]
- Chen, Y.; Escalera Mendoza, A.S.; Griffith, D.T. Experimental and numerical study of high-order complex curvature mode shape and mode coupling on a three-bladed wind turbine assembly. Mech. Syst. Signal Process. 2021, 160, 107873. [Google Scholar] [CrossRef]


Publisher’s Note: MDPI stays neutral with regard to jurisdictional claims in published maps and institutional affiliations. |
© 2021 by the authors. Licensee MDPI, Basel, Switzerland. This article is an open access article distributed under the terms and conditions of the Creative Commons Attribution (CC BY) license (https://creativecommons.org/licenses/by/4.0/).