Article

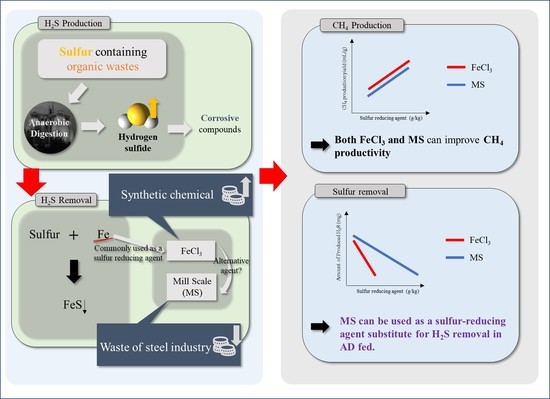
Mill Scale Addition to Reduce Hydrogen Sulfide Production in Anaerobic Digestion

1
Department of Environmental Engineering, Chungbuk National University, 1 Chungdae-ro, Seowon-Gu, Cheongju 28644, Korea
2
Seojin Energy Co., Ltd., 410, Jeongseojin-ro, Seogu, Incheon 22689, Korea
*
Author to whom correspondence should be addressed.
Energies 2021, 14(20), 6542; https://doi.org/10.3390/en14206542
Submission received: 10 September 2021 / Revised: 8 October 2021 / Accepted: 8 October 2021 / Published: 12 October 2021
(This article belongs to the Special Issue Sustainable Waste Management and Potential for Waste-to-Energy)

Abstract

:
Direct addition of sulfur-reducing agents during anaerobic digestion (AD) is very effective in controlling hydrogen sulfide (H2S) content in biogas, although one major problem is the high operational cost due to the large amount of chemicals used. The objective of this study was to remove H2S using a waste mill scale (MS) as a sulfur-reducing agent. To evaluate its feasibility, MS was added to AD fed with food waste (FW) at concentrations between 0 and 160 g MS/kg total chemical oxygen demand (TCOD) during the batch test, and the experimental results were compared to those of the batch test with the addition of iron chloride (FeCl3). Both FeCl3 and MS played an important role as electro-conductive materials in improving methane productivity by promoting direct interspecies electron transfer. An increase in H2S removal efficiency was observed with increases in both materials. In total, 30%, 60%, and 90% of H2S production based on the maximum sulfur in the form of H2S (control) was 3.7, 9.4, and 23.8 g FeCl3/kg TCOD and 13.3, 34.1, and 86.2 g MS/kg TCOD, respectively. This finding indicates that MS can be used as a sulfur-reducing agent substitute for H2S removal in AD fed with FW.

Graphical Abstract

1. Introduction

Sustainable organic waste management has become one of the greatest challenges worldwide. Anaerobic digestion (AD) is recognized as a well-established technology for the treatment of a wide range of organic matter (such as food waste, sewage sludge, agricultural residues, and livestock manure) but also for the production of biogas, which has been utilized for a combination of heat and electricity generation [1,2,3,4]. Currently, the use of biogas is moving toward new applications, such as vehicle fuels and injection into the natural gas grid. However, to utilize it widely, biogas purity is critical, which can often compromise its true economic potential [5].
Biogas mainly consists of methane (CH4) and carbon dioxide (CO2), but it also contains trace contaminants, such as hydrogen sulfide (H2S), moisture, siloxane, and ammonia, which greatly affect its purity. The most common contaminant is H2S, and its level can vary from 10 ppmv to approximately 20,000 ppmv, depending on the composition of the feedstock. H2S is mainly produced by sulfate-reducing bacteria (SRB) during the degradation of sulfur-containing organic compounds (methionine and cysteine) [6,7,8,9]. H2S is a highly corrosive and deleterious compound that causes significant damage to pipes and generators when combined with moisture [5]. Moreover, the combustion of H2S results in sulfur dioxide emissions if not removed prior to biogas utilization. H2S removal is thus necessary for the eventual utilization of biogas to protect downstream equipment and avoid the formation of harmful compounds. To date, common H2S removal technologies include physicochemical approaches either during digestion or from crude biogas [5,10,11,12,13].
H2S can be removed by the direct addition of chemical compounds such as iron salts in the form of FeCl2 or FeCl3 into the digester. These react with the produced H2S to form iron sulfide (FeS), which is an insoluble precipitate. This approach is very effective in controlling H2S content (>99%) in biogas, although one major problem is high operational costs due to the various fresh chemicals required and difficulties in recycling the used iron salt [10,14].
Recent studies have proposed that metallic iron-rich waste is a potential alternative reagent for H2S removal from biogas [15]. Mill scale (MS) is an abundant and unavoidable waste produced by the rolling mill in the steel industry (accounting for 2% of the total steel produced) [16]. According to the World Steel Association, global crude steel production in 2020 reached 1864 million tons (Mt), from which 37.3 million tons of mill scale were generated [17]. It is a very valuable metallurgical material containing approximately 65–70% of iron. It consists of mixed FeO, Fe2O3, and Fe3O4, and its chemical composition varies depending on the type of steel produced and process employed [18]. If the addition of MS effectively controls H2S levels in biogas and does not negatively affect methane productivity, it is expected to be an alternative way to reduce the operational costs of biogas desulfurization.
Based on the above research background, the purpose of this study was to investigate the possibility of using MS as a substitute for iron chloride (FeCl3) in H2S removal during anaerobic digestion of food waste (FW). Different levels of MS were applied to a batch test to compare its H2S removal performance with that of the control, in which FeCl3 was applied. In addition, we demonstrated how MS plays an important role as an electro-conductive material, improving CH4 productivity by accelerating direct interspecies electron transfer (DIET), and provided the basis for future strategies for biogas utilization.

2. Materials and Methods

2.1. Preparation of Feedstock and Inoculum

The inoculum was obtained from full-scale anaerobic digestion systems located in Cheongju, South Korea, and kept under mesophilic conditions for one week to remove leftover biodegradable matter before seeding. The pH and volatile suspended solids (VSS) of the inoculum were 5.5 ± 0.1 and 14.5 ± 0.6 g/L, respectively. FW was collected from the storage tank of a full-scale anaerobic digestion system in Chungju, South Korea and transferred to the laboratory within 2 h. The FW was ground and strained through a sieve (1 mm × 1 mm) prior to the batch tests. The organic composition of the FW and inoculum are presented in Table 1.

2.2. Batch Test

Two sets of batch tests were performed for the desulfurization potential test using 250 mL serum bottles with a working volume of 150 mL. After measuring the concentration of total chemical oxygen demand (TCOD) of the FW, it was added to a feedstock concentration of 7.5 ± 0.2 g COD/L (batch test I with addition of FeCl3) and 20 ± 0.1 g COD/L (batch test II with addition of MS), and the inoculum was added to each batch test to reach an inoculum/substrate ratio of 2 (VS basis). The rest of the working volume was filled with tap water, with no external nutrients used. Finally, FeCl3 (Samjung Co., Seoul, South Korea) was added to obtain FeCl3 concentrations of 0, 11, 22, 33, 44, 67, and 89 g FeCl3/kg TCOD in batch test I, while the MS (83% Fe content) powder (Hyundai Steel Co., Seoul, South Korea) was added with a wide range of concentrations (0, 5, 10, 20, 40, and 160 g MS/kg TCOD) in batch test II. The average density of FeCl3 and MS was 2.9 and 2.3 g/cm3.
After adding all substances, the initial pH was adjusted to 7.5 ± 0.1 by adding 3 N HCl and 3 N KOH solution, and the serum bottles were purged with N2 gas (99.99% purity) for 5 min to provide an anaerobic condition. A batch test, including a blank (adding only inoculum), was carried out in a shaking incubator (Jeio Tech, Seoul, South Korea) at 120 rpm at 38 °C. All experiments were performed in duplicate, and the experimental results are presented as average values.

2.3. Analytical Method

The CH4 content in the biogas was determined by gas chromatography (SRI 310, SRI Instrument, USA) using a thermal conductivity detector and a HayeSep T column (3 ft × 1/8’) with N2 as the mobile phase. The CH4 content was calculated using the gas composition in the headspace and total volume of biogas produced at each time interval [19]. The cumulative CH4 production curve was described by the following modified Gompertz equation [20] (Equation (1)) applied to fit the cumulative CH4 data in order to predict methane production [20]:
M t = M o × e x p { exp R o × e M o × λ t + 1 }
where M(t) is the cumulative CH4 production at cultivation time (t) (mL), Mo is the CH4 production potential (mL), Ro is the CH4 production rate (mL/d), λ is the lag period (d), and e is the Euler number (2.71828).
The chemical oxygen demand (COD) and pH were measured according to standard methods [21]. For the H2S analysis during the batch test, a ready-to-use kit (Model GV-100, GASTEC, Kanagawa, Japan) and H2S detection tubes (KITAGAWA, Kanagawa, Japan) were used, which tightly fit into the glass airlock of the bottle. The sulfur balance was determined by estimating the amount of H2S(g) and H2S(l) (Henry’s constant at 35 °C). Equations (2) and (3) define the H2S calculation:
C = ppm v × 34.08 22.4 × 273 273 + T
M = C × P × 1 / 10 6
where C = H2S compounds (mg/m3), ppmv = H2S compounds (ppmv), T = temperature of batch test (°C), M = amount of H2S (mg), and P = gas production (mL).
The relationship between H2S removal and the addition of a sulfur-reducing agent was fitted by Equation (4):
y = a + b × e x p x c
where y = amount of H2S; x = amount of injected FeCl3 and/or mill scale; and a, b, c = constant number.

3. Results and Discussion

3.1. Effect of Iron Chloride Addition on Anaerobic Digestion

The CH4 accumulation curves were well fitted by the modified Gompertz Equation (1), and all curves of R2 were higher than 95% (Figure 1). The reactor performance of batch test I in response to the FeCl3 addition is summarized in Table 2. The improvements in CH4 yield and CH4 production rate with an increase in the amount of FeCl3 injected were obtained. For example, the sample in the presence of 11 g FeCl3/kg COD showed a CH4 yield of 258 ± 4 mL CH4/g COD and a CH4 production rate of 23.1 ± 1.1 mL CH4/d, and the sample added with 44 g FeCl3/kg COD resulted in a CH4 yield of 332 ± 2 mL CH4/g COD, with a CH4 production rate of 31.8 mL CH4/d. Meanwhile, the samples with more than 89 g FeCl3/kg COD tended to slightly decrease CH4 productivity. This indicates that FeCl3 addition positively affected CH4 productivity. This result is similar to previous studies reporting that FeCl3 addition accelerated the decomposition and degradation of organic polymers by dissimilatory iron reduction anaerobic digestion [22].
Another important reason for the observed improvement in CH4 productivity was that FeCl3 acted as a selective regulator to reduce the sulfur reduction activities of sulfate-reducing bacteria. The inhibitory effect of H2S on anaerobic microorganisms in anaerobic digestion has been reported to occur in the range of 50–400 ppmv H2S [22]. In this study, the H2S content was 2520 ± 426 ppmv in the sample without the addition of FeCl3, as shown in Table 2. As the addition of FeCl3 increased, the concentration of H2S gradually decreased, accounting for 947 ± 267, 88 ± 24, and 19 ± 20 ppmv in the samples with 11, 33, and 89 g FeCl3/kg COD, respectively. According to previous study, Andriamanohiarisoamanana et al. 2018, the sulfide produced by SRB was directly precipitated by the formation of iron sulfide when FeCl3 was added to the digester [15]. The amount of precipitated iron sulfate (FeS) can be quantitatively estimated based on the reduced H2S content in biogas by adding FeCl3. The amount of H2S generated in the sample without FeCl3 addition was 2.37 ± 0.327 mg S. Meanwhile, it gradually decreased as FeCl3 increased, reaching 0.95 ± 0.062, 0.08 ± 0.020, 0.03 ± 0.009, and 0.023 ± 0.004 mg S in the sample with 11, 33, 67, and 89 g FeCl3/kg COD, respectively.
Based on the amount of decreased H2S in the presence of FeCl3, the amount of precipitated iron sulfide (FeS) was estimated as 129 ± 33, 70 ± 13, 35 ± 7, 26 ± 5 mg H2S/g FeCl3 in the sample with 11, 33, 67, and 89 g FeCl3/kg COD, respectively. From this, the amount of H2S generated was reduced as a higher amount of iron salt was injected, whereas the amount of H2S removed per unit mass of iron salt was decreased. This shows that it is necessary to inject an appropriate amount of FeCl3 according to the sulfur content in the substrate.

3.2. Effect of Mill Scale Addition on Anaerobic Digestion

Batch test II, subject to the effect of MS addition on anaerobic digestion, was performed, and the experimental results are shown in Table 3. A slight increase in CH4 yield was achieved when MS addition increased, showing 260 ± 20, 277 ± 13, and 287 ± 8 mL CH4/g TCOD at 0, 20, and 160 g MS/kg TCOD, respectively. Meanwhile, it showed a gradual enhancement in the CH4 production rate as the amount of MS was added. For example, the CH4 production rate was 36.9 ± 2.0 mL CH4/d when MS was not injected (control). On the other hand, it proportionally increased to 39.4 ± 1.6, 40.3 ± 2.2, and 56.4 ± 0.1 mL CH4/d at 5, 20, and 160 g MS/kg TCOD, respectively. This result clearly shows that the injection of MS has a positive effect on the CH4 production rate.
The results obtained from batch test II showed that MS effectively reduced H2S generation during anaerobic digestion. In the biogas, the H2S concentration in the control was 801 ± 74 ppmv. A decreased concentration of H2S was found as MS was added, reaching 703 ± 80, 510 ± 81, and 262 ± 61 ppmv, at 10, 20, and 40 g MS/kg TCOD, respectively. At a concentration of 160 g MS/kg TCOD, H2S was 29 ± 29 ppmv, showing that the achieved reduction of H2S generation was 95.9% compared to the control. A decrease in H2S content in the presence of MS is linked to a decrease in the total amount of sulfur that was formed into H2S. The total sulfur reduced by SRB was estimated to be 1.88 ± 0.010 mg in the control, while significantly decreased H2S was achieved in the samples with MS addition, showing 1.60 ± 0.045, 1.20 ± 0.007, 0.57 ± 0.092, and 0.08 ± 0.017 mg at 10, 20, 40, and 160 g MS/kg TCOD, respectively.

3.3. Performance Comparison between Iron Chloride and Mill Scale Addition

The results obtained from this study showed that both sulfur-reducing agents positively affect CH4 productivity and H2S content reduction in biogas. One of the possible reasons for CH4 productivity enhancement is the promotion of direct interspecies electron transfer (DIET) by adding electro-conductive materials. Numerous studies have demonstrated that CH4 productivity is enhanced by the addition of a variety of conductive materials that can serve as an electrical bridge to facilitate DIET [3,23,24,25]. Both FeCl3 and MS employed in this study are known as electrically conductive materials and may play positive roles on the metabolic pathway of anaerobic digestion. In addition, the improved CH4 productivity was due to the fact that both FeCl3 and MS acted as sulfur-reducing agents to decrease the H2S concentration, which often occurs in the inhibition of anaerobic microorganisms in anaerobic digestion.
However, a discrepancy in the performance between batch tests I and II was observed. This was due to the different compositions of FW used in each test. As shown in Table 1, the chemical characteristics of FW I and FW II employed in batch tests I and II are different. FW I was sampled in the winter of 2019, while FW II was sampled in the spring season of 2020. The seasonal variation in FW composition is a distinctive characteristic producing the chemical differences between FW I and FW II [26].
The SCOD/TCOD in FW I and FW II was 70.0% and 58.0%, while the sulfur content in FW I and FW II was 0.45% and 0.19%, respectively. The higher sulfur content in FW I resulted in 2520 ± 426 ppmv of H2S in the control of batch test I, which possibly had an inhibitory effect on methanogenic activity and showed a lower CH4 yield compared to that of the control in batch test II [27]. However, the enhanced CH4 yield in batch test I was much higher than that in batch test II when FeCl3 was added, indicating that the inhibitory effect of H2S on methanogenic activity gradually decreased. Meanwhile, the lower level of H2S (801 ± 74 ppmv) in the control of batch test II was mainly due to the lower content of sulfur in FW II. Its content did not severely inhibit methanogenic activity as much as the control of batch test I, and the increased CH4 yield was relatively low. However, the CH4 yield in the presence of FeCl3 in batch test I was higher compared to that of the batch test with the addition of MS. For example, a methane yield of 328 ± 16 mL CH4/g TCOD was achieved at 89 g FeCl3/kg TCOD, while it was 287 ± 8 mL CH4/g TCOD in the presence of 160 g MS/kg TCOD. This was possibly caused by the different contents of biodegradable compounds or unknown compounds included in the MS, causing microbial toxic effects in the anaerobic digestion. Therefore, further studies focused on solving these issues should be conducted.
It was found that the H2S removal efficiency increased with increasing sulfur-reducing agents. However, the H2S removal efficiencies of FeCl3 and MS were different, and FW1 and FW2 had different sulfur content. Therefore, an indirect comparison by using the theoretical value of sulfur reacted with both the sulfur-reducing agents is needed, indicating the amount of precipitated iron sulfide (FeS) based on the amount of decreased H2S in the presence of both sulfur-reducing agents. We estimated the theoretical amount of H2S reduction based on a gram of FeCl3 and MS added, and similar patterns of decreased efficiency at higher levels of both sulfur-reducing agents were observed. For example, batch test I showed 129.0 ± 32.8, 69.5 ± 12.8, and 26.4 ± 5.0 mg H2S/g FeCl3 at 11, 33, and 89 g FeCl3/kg TCOD, while 47.7 ± 1.8, 33.9 ± 0.2, and 11.2 ± 0.1 mg H2S/mg MS at 5, 20, and 160 g MS/kg TCOD, respectively. We further investigated the relationship between H2S removal and the addition of sulfur-reducing agents fitted by Equation (3), and the R2 values of both curves were over 0.98 (Figure 2). In total, 30%, 60%, and 90% of H2S production based on the maximum sulfur in the form of H2S (control) was 3.7, 9.4, and 23.8 g FeCl3/kg TCOD and 13.3, 34.1, and 86.2 g MS/kg TCOD, respectively. Comparing the amount of sulfur-reducing agents required for each target amount, the amount of MS to be added to reduce 30% of H2S production was approximately 3.6 times higher than that of FeCl3 addition.
The results of this study showed that MS can be used as a substitute for sulfur-reducing agents for H2S removal in anaerobic digestion fed with FW. However, introduction of MS into AD of FW could lead to enriching metals in the digestate, which is supposed to be spread on farming land. More research is needed to investigate the effects of MS addition on digestate and crop growth.

4. Conclusions

This study was conducted to investigate the feasibility of using waste MS to reduce the H2S content in biogas. The results showed that MS positively affected the AD process. It was found that MS plays an important role as an electro-conductive material, improving CH4 productivity by accelerating DIET—showing that the CH4 production rate was 36.9, 39.4, 40.3, and 56.4 mL CH4/d at 0, 5, 20, and 160 g MS/kg TCOD, respectively. In addition, the reduction in H2S is crucial, which increased with increasing MS content, showing 48 ± 2, 34 ± 0, and 11 ± 0 mg H2S/mg MS at 5, 20, and 160 g MS/kg TCOD, respectively. This finding indicates that MS can be used as a substitute for sulfur-reducing agents in H2S removal in anaerobic digestion fed with FW. However, a larger amount of MS is needed to achieve a compatible H2S removal efficiency obtained by the addition of FeCl3. Further studies are required to analyze the economic feasibility of MS as a sulfur-reducing agent.

Author Contributions

Writing original draft: B.-K.A.; data curation, T.-H.K.; data curation J.S.; data curation, S.-K.P.; supervision, Y.-M.Y. All authors have read and agreed to the published version of the manuscript.

Funding

This work was supported by the Korea Institute of Energy Technology Evaluation and Planning (KETEP) and the Ministry of Trade, Industry & Energy (MOTIE) of the Republic of Korea (No. 20193010160010). This work was also supported by the Korea Ministry of Environment as a Waste to Energy-Recycling Human Resource Development Project (YL-WE-19-002).

Data Availability Statement

Not applicable.

Conflicts of Interest

The authors declare no conflict of interest.

References

  1. Abubakar, B.S.U.I.; Ismail, N. Anaerobic digestion of cow dung for biogas production. ARPN J. Eng. Appl. Sci. 2014, 7, 169–172. [Google Scholar]
  2. Ho, S.H.; Yang, Z.K.; Nagarajan, D.; Chang, J.S.; Ren, N.Q. High-efficiency removal of lead from wastewater by biochar derived from anaerobic digestion sludge. Bioresour. Technol. 2017, 246, 142–149. [Google Scholar] [CrossRef] [PubMed]
  3. Duan, X.; Zhang, C.; Wang, S.; Ren, N.Q.; Ho, S.H. Graphitic biochar catalysts from anaerobic digestion sludge for nonradical degradation of micropollutants and disinfection. Chem. Eng. J. 2020, 384, 123244. [Google Scholar]
  4. Appels, L.; Baeyens, J.; Degrève, J.; Dewil, R. Principles and potential of the anaerobic digestion of waste-activated sludge. Prog. Energy Combust. Sci. 2008, 34, 755–781. [Google Scholar] [CrossRef]
  5. Abatzoglou, N.; Boivin, S. A review of biogas purification processes. Biofuels Bioprod. Biorefining 2009, 3, 42–71. [Google Scholar] [CrossRef]
  6. Ryckebosch, E.; Drouillon, M.; Vervaeren, H. Techniques for transformation of biogas to biomethane. Biomass Bioenergy 2011, 35, 1633–1645. [Google Scholar] [CrossRef]
  7. Sposob, M.; Nam, J.Y.; Park, J.G.; Kim, T.H.; Hwang, Y.; Jeong, S.M.; Yun, Y.M. Starvation pretreatment enhances sulfidogenic operation of two-stage anaerobic digestion system for biogas production with low H2S content. J. Clean. Prod. 2021, 290, 125166. [Google Scholar] [CrossRef]
  8. Persson, M.; Jönsson, O.; Wellinger, A. Biogas Upgrading to Vehicle Fuel Standards and Grid Injection. IEA Bioenergy Task 2006, 37, 1–34. [Google Scholar]
  9. Wu, W.M.; Hickey, R.F.; Zeikus, J.G. Characterization of metabolic performance of methanogenic granules treating brewery wastewater: Role of sulfate-reducing bacteria. Appl. Environ. Microbiol. 1991, 57, 3438–3449. [Google Scholar] [CrossRef] [Green Version]
  10. Han, Y.; Qu, Q.; Li, J.; Zhuo, Y.; Zhong, C.; Peng, D. Performance of ammonium chloride dosage on hydrogen sulfide in-situ prevention during waste activated sludge anaerobic digestion. Bioresour. Technol. 2019, 276, 91–96. [Google Scholar] [CrossRef]
  11. Okoro, O.V.; Sun, Z. Desulphurisation of biogas: A systematic qualitative and economic-based quantitative review of alternative strategies. ChemEngineering 2019, 3, 76. [Google Scholar] [CrossRef] [Green Version]
  12. Kadam, R.; Panwar, N.L. Recent advancement in biogas enrichment and its applications. Renew. Sustain. Energy Rev. 2017, 73, 892–903. [Google Scholar] [CrossRef]
  13. Ahmad, W.; Sethupathi, S.; Kanadasan, G.; Lau, L.C.; Kanthasamy, R. A review on the removal of hydrogen sulfide from biogas by adsorption using sorbents derived from waste. Rev. Chem. Eng. 2019, 37, 407–431. [Google Scholar] [CrossRef]
  14. Regenspurg, S.; Iannotta, J.; Feldbusch, E.; Zimmermann, F.J.; Eichinger, F. Hydrogen sulfide removal from geothermal fluids by Fe (III)-based additives. Geotherm. Energy 2020, 8, 1–22. [Google Scholar] [CrossRef]
  15. Andriamanohiarisoamanana, F.J.; Shirai, T.; Yamashiro, T.; Yasui, S.; Iwasaki, M.; Ihara, I.; Nishida, T.; Tangtaweewipat, S.; Umetsu, K. Valorizing waste iron powder in biogas production: Hydrogen sulfide control and process performances. J. Environ. Manag. 2018, 208, 134–141. [Google Scholar] [CrossRef]
  16. Ma, N.; Houser, J.B.; Wood, L.A. Production of cleaner mill scale by dynamic separation of the mill scale from the fast-moving flume water at a hot rolling mill. J. Clean. Prod. 2018, 176, 889–894. [Google Scholar] [CrossRef]
  17. World Steel Association. Available online: https://www.worldsteel.org/media-centre/press-releases/2021/world-steel-in-figures-2021.html (accessed on 3 June 2021).
  18. Martín, M.I.; López, F.A.; Torralba, J.M. Production of sponge iron powder by reduction of rolling mill scale. Ironmak. Steelmak. 2012, 39, 155–162. [Google Scholar] [CrossRef] [Green Version]
  19. Lay, J.J.; Lee, Y.J.; Noike, T. Feasibility of biological hydrogen production from organic fraction of municipal solid waste. Water Res. 1999, 33, 2579–2586. [Google Scholar] [CrossRef]
  20. Lay, J.J.; Li, Y.Y.; Noike, T. Influences of pH and moisture content on the methane production in high-solids sludge digestion. Water Res. 1997, 31, 1518–1524. [Google Scholar] [CrossRef]
  21. APH Association. Standard Methods for the Examination of Water and Wastewater; American Public Health Association (APHA): Washington, DC, USA, 2005. [Google Scholar]
  22. Park, C.M.; Novak, J.T. The effect of direct addition of iron (III) on anaerobic digestion efficiency and odor causing compounds. Water Sci. Technol. 2013, 68, 2391–2396. [Google Scholar] [CrossRef] [PubMed]
  23. Yang, S.; Han, S.; Yun, Y.M.; Kang, S. Stimulation of Biomethane Productivity in Anaerobic Digestion Using Electro-Conductive Carbon-Nanotube Hollow-Fiber Media. Minerals 2021, 11, 179. [Google Scholar] [CrossRef]
  24. Hwang, Y.; Sivagurunathan, P.; Lee, M.K.; Yun, Y.M.; Song, Y.C.; Kim, D.H. Enhanced hydrogen fermentation by zero valent iron addition. Int. J. Hydrog. Energy 2019, 44, 3387–3394. [Google Scholar] [CrossRef]
  25. Baek, G.; Kim, J.; Kim, J.; Lee, C. Role and potential of direct interspecies electron transfer in anaerobic digestion. Energies 2018, 11, 107. [Google Scholar] [CrossRef] [Green Version]
  26. Jang, Y.N.; Hwang, O.; Jung, M.W.; Ahn, B.K.; Kim, H.; Jo, G.; Yun, Y.M. Comprehensive analysis of microbial dynamics linked with the reduction of odorous compounds in a full-scale swine manure pit recharge system with recirculation of aerobically treated liquid fertilizer. Sci. Total Environ. 2021, 777, 146122. [Google Scholar] [CrossRef] [PubMed]
  27. Yun, Y.M.; Sung, S.; Shin, H.S.; Han, J.I.; Kim, H.W.; Kim, D.H. Producing desulfurized biogas through removal of sulfate in the first-stage of a two-stage anaerobic digestion. Biotechnol. Bioeng. 2017, 114, 970–979. [Google Scholar] [CrossRef] [PubMed]
Figure 1. Cumulative methane production of food waste with addition of (a) iron chloride and (b) mill scale.
Energies 14 06542 g001
Figure 2. Change in hydrogen sulfide generation at various concentrations of FeCl3 and mill scale during anaerobic digestion.
Energies 14 06542 g002
Table 1. Chemical composition of feedstock and inoculum.
ParametersFood Waste IFood Waste IIInoculum
TCOD (g/L)102.5 ± 1.1130.0 ± 0.926 ± 6
SCOD (g/L)71.5 ± 1.075.0 ± 0.414 ± 4
SCOD/TCOD (%)705854
TS (g/L)98.1 ± 0.6113.1 ± 1.221 ± 1
VS (g/L)85.2 ± 0.296.5 ± 0.419 ± 3
Sulfur content (%)0.45 ± 0.000.19 ± 0.020.27 ± 0.00
pH4.14.17.2
TCOD: total chemical oxygen demand; SCOD: soluble chemical oxygen demand.
Table 2. Experimental results obtained from batch test I with the addition of iron chloride.
FeCl3 Dosage (g FeCl3/kg TCOD)CH4 Yield (mL CH4/g TCOD)CH4 Production Rate (mL/d)λ (d)H2S Content (ppmv)Total Amount of Sulfur Reduced to H2S (mg)Theoretical Value of Sulfur Reacted with FeCl3 (mg H2S/g FeCl3)Final pH
0211 ± 318.9 ± 0.39.0 ± 0.22,520 ± 4262.37 ± 0.327-7.4 ± 0.1
11258 ± 423.1 ± 1.18.0 ± 0.0947 ± 2670.95 ± 0.062129 ± 337.4 ± 0.1
22289 ± 1422.9 ± 2.18.4 ± 0.2271 ± 620.24 ± 0.03897 ± 187.4 ± 0.2
33269 ± 1116.4 ± 4.37.6 ± 0.188 ± 240.08 ± 0.02070 ± 137.4 ± 0.0
44332 ± 231.8 ± 0.49.0 ± 0.346 ± 220.05 ± 0.03753 ± 107.4 ± 0.0
67283 ± 1819.3 ± 5.67.7 ± 0.137 ± 200.03 ± 0.00935 ± 77.4 ± 0.0
89328 ± 1628.2 ± 0.89.5 ± 0.019 ± 200.023 ± 0.00426 ± 57.4 ± 0.1
Table 3. Experimental results obtained from batch test II after the addition of mill scale.
Mill Scale Dosage (g MS/kg TCOD)CH4 Yield (mL CH4/g TCOD)CH4 Production Rate (mL/d)λ (d)H2S Content (ppmv)Total Amount of Sulfur Reduced to H2S (mg sulfur)Theoretical Value of Sulfur Reacted with Mill Scale (mg H2S/mg MS)Final pH
0260 ± 2036.9 ± 2.09.0 ± 0.1801 ± 741.88 ± 0.010-7.2 ± 0.0
5251 ± 4739.4 ± 1.68.0 ± 0.2783 ± 1201.64 ± 0.00348 ± 27.2 ± 0.0
10265 ± 2637.1 ± 0.38.4 ± 0.0703 ± 801.60 ± 0.04528 ± 57.2 ± 0.1
20277 ± 1340.3 ± 2.27.6 ± 0.3510 ± 811.20 ± 0.00734 ± 07.2 ± 0.0
40250 ± 5146.5 ± 1.29.0 ± 0.3262 ± 610.57 ± 0.09233 ± 37.2 ± 0.2
160287 ± 856.4 ± 0.19.5 ± 0.529 ± 290.08 ± 0.01711 ± 07.2 ± 0.2
Publisher’s Note: MDPI stays neutral with regard to jurisdictional claims in published maps and institutional affiliations.

