3.1. Energy Types Used, Heating Methods and Their Cost Ratio
Household energy consumption was reviewed based on the household energy costs declared in the data sets and the following energy types were taken into account: electricity, (piped) gas, bottled gas, conventional fuels (firewood, coal, briquettes, coke, charcoal, fuel oil, paraffine) and central heating as well as district.
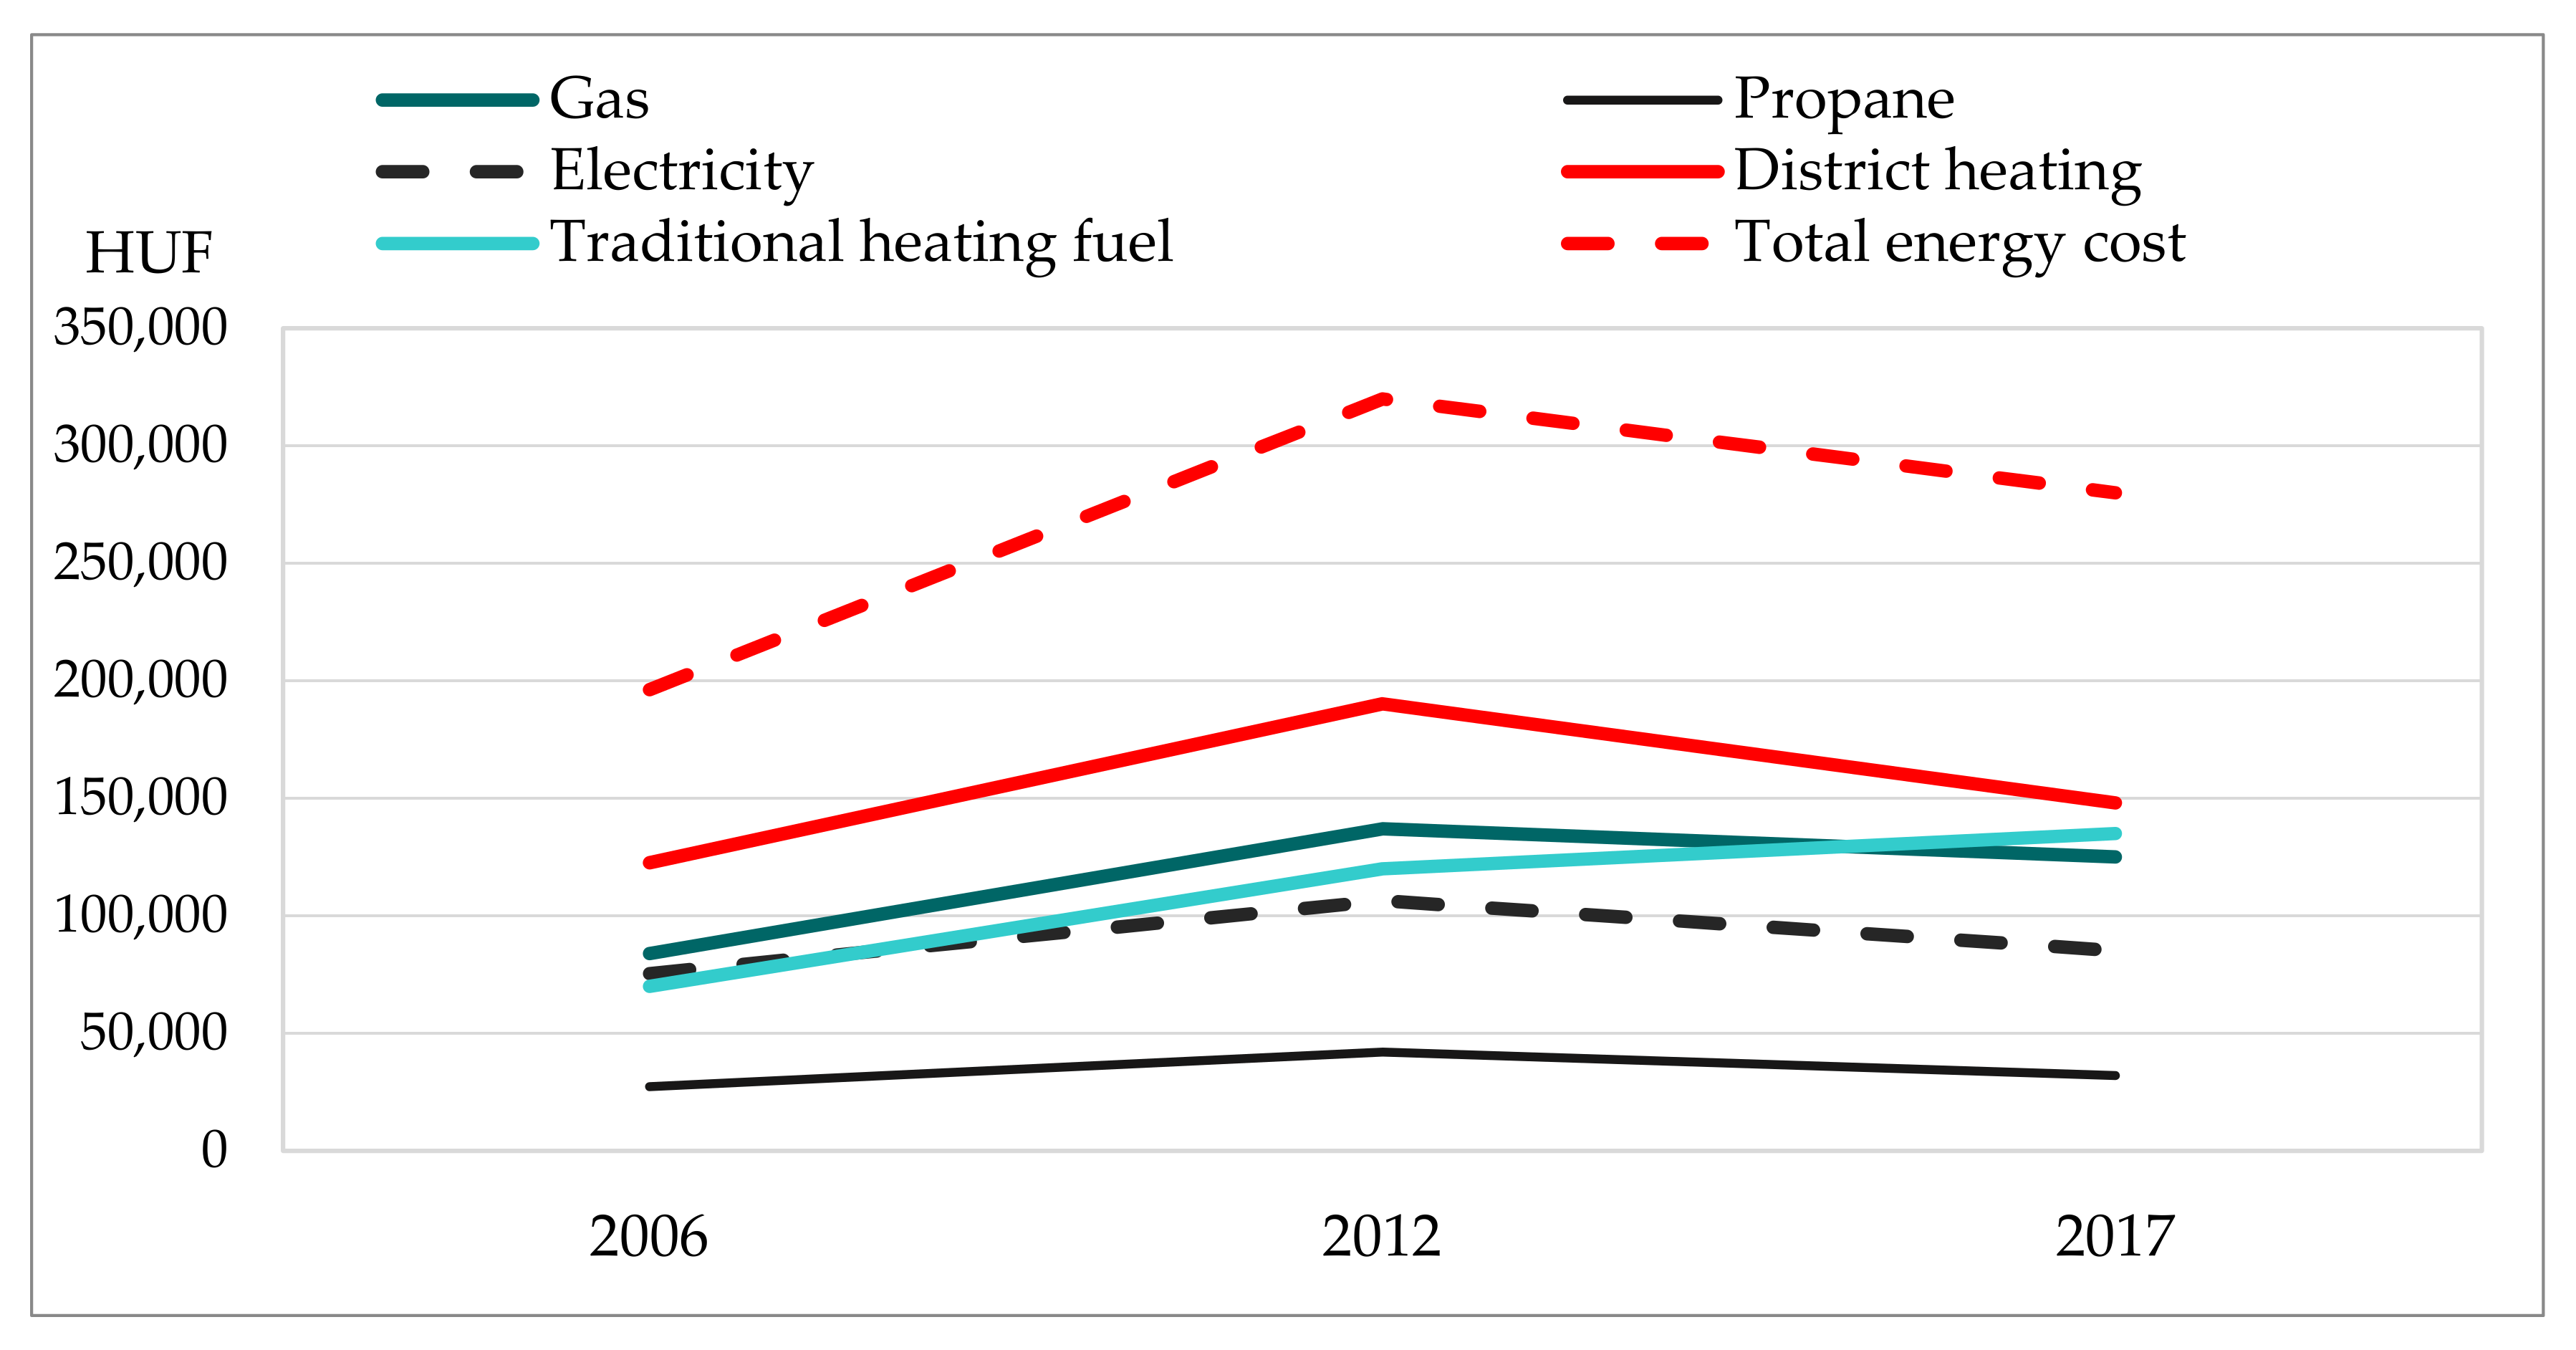
The average energy costs of households accounted for 13.1% of their total consumption expenditure in 2006, 19.5% in 2012 and 15.8% in 2017. All this reflects the fact that energy prices set loose during the global economic downturn were a much greater burden on households than in the years before and after. Based on the change in the median values of energy expenditures (
Figure 2), it is evident that the overhead cost cut scheme introduced by the government in 2013 on the one hand reduced household energy costs, but on the other hand in the case of conventional (solid and liquid) fuels, which were not included in the cost cut scheme, energy costs of households increased even more than piped gas expenditures. In fact, according to the data by the CSO on the average prices of products [
17], while the price of m
3/HUF of piped gas reached its peak at HUF 136 (approximately 0.38 Euro/m
3) in 2012, it then decreased back to HUF 101/m
3 (0.28 Euro/m
3), the price of sawn firewood 100 kg/HUF increased from 2240 HUF to 3740 HUF (from around 6.20 Euro/100 kg to 10.38 Euro/100 kg) between 2006 and 2017.
One of the excellent indicators of energy supply is the quality of heating. The available data show that in Hungary individual room heating and the use of an apartment heating device are the most common (
Figure 3a). However, while until 2012 individual room heating was the most common, by 2017 the proportion of households with (circulating) appliances providing heating of the entire dwelling is higher, which (may) indicate(s) the modernization of the stock of flats, the decrease in the share of district heating is also remarkable, that is probably also due to the modernization of the stock of the flats.
Due to data collection problems, we can make only limited comparisons regarding the interpretation of the distribution of energy sources used for heating, but it can be established that the most common type of heating during the whole period is gas heating (60–40% of households), however, it is a remarkable change that the proportion of households using mixed combustion doubled by 2017 (
Figure 3b).
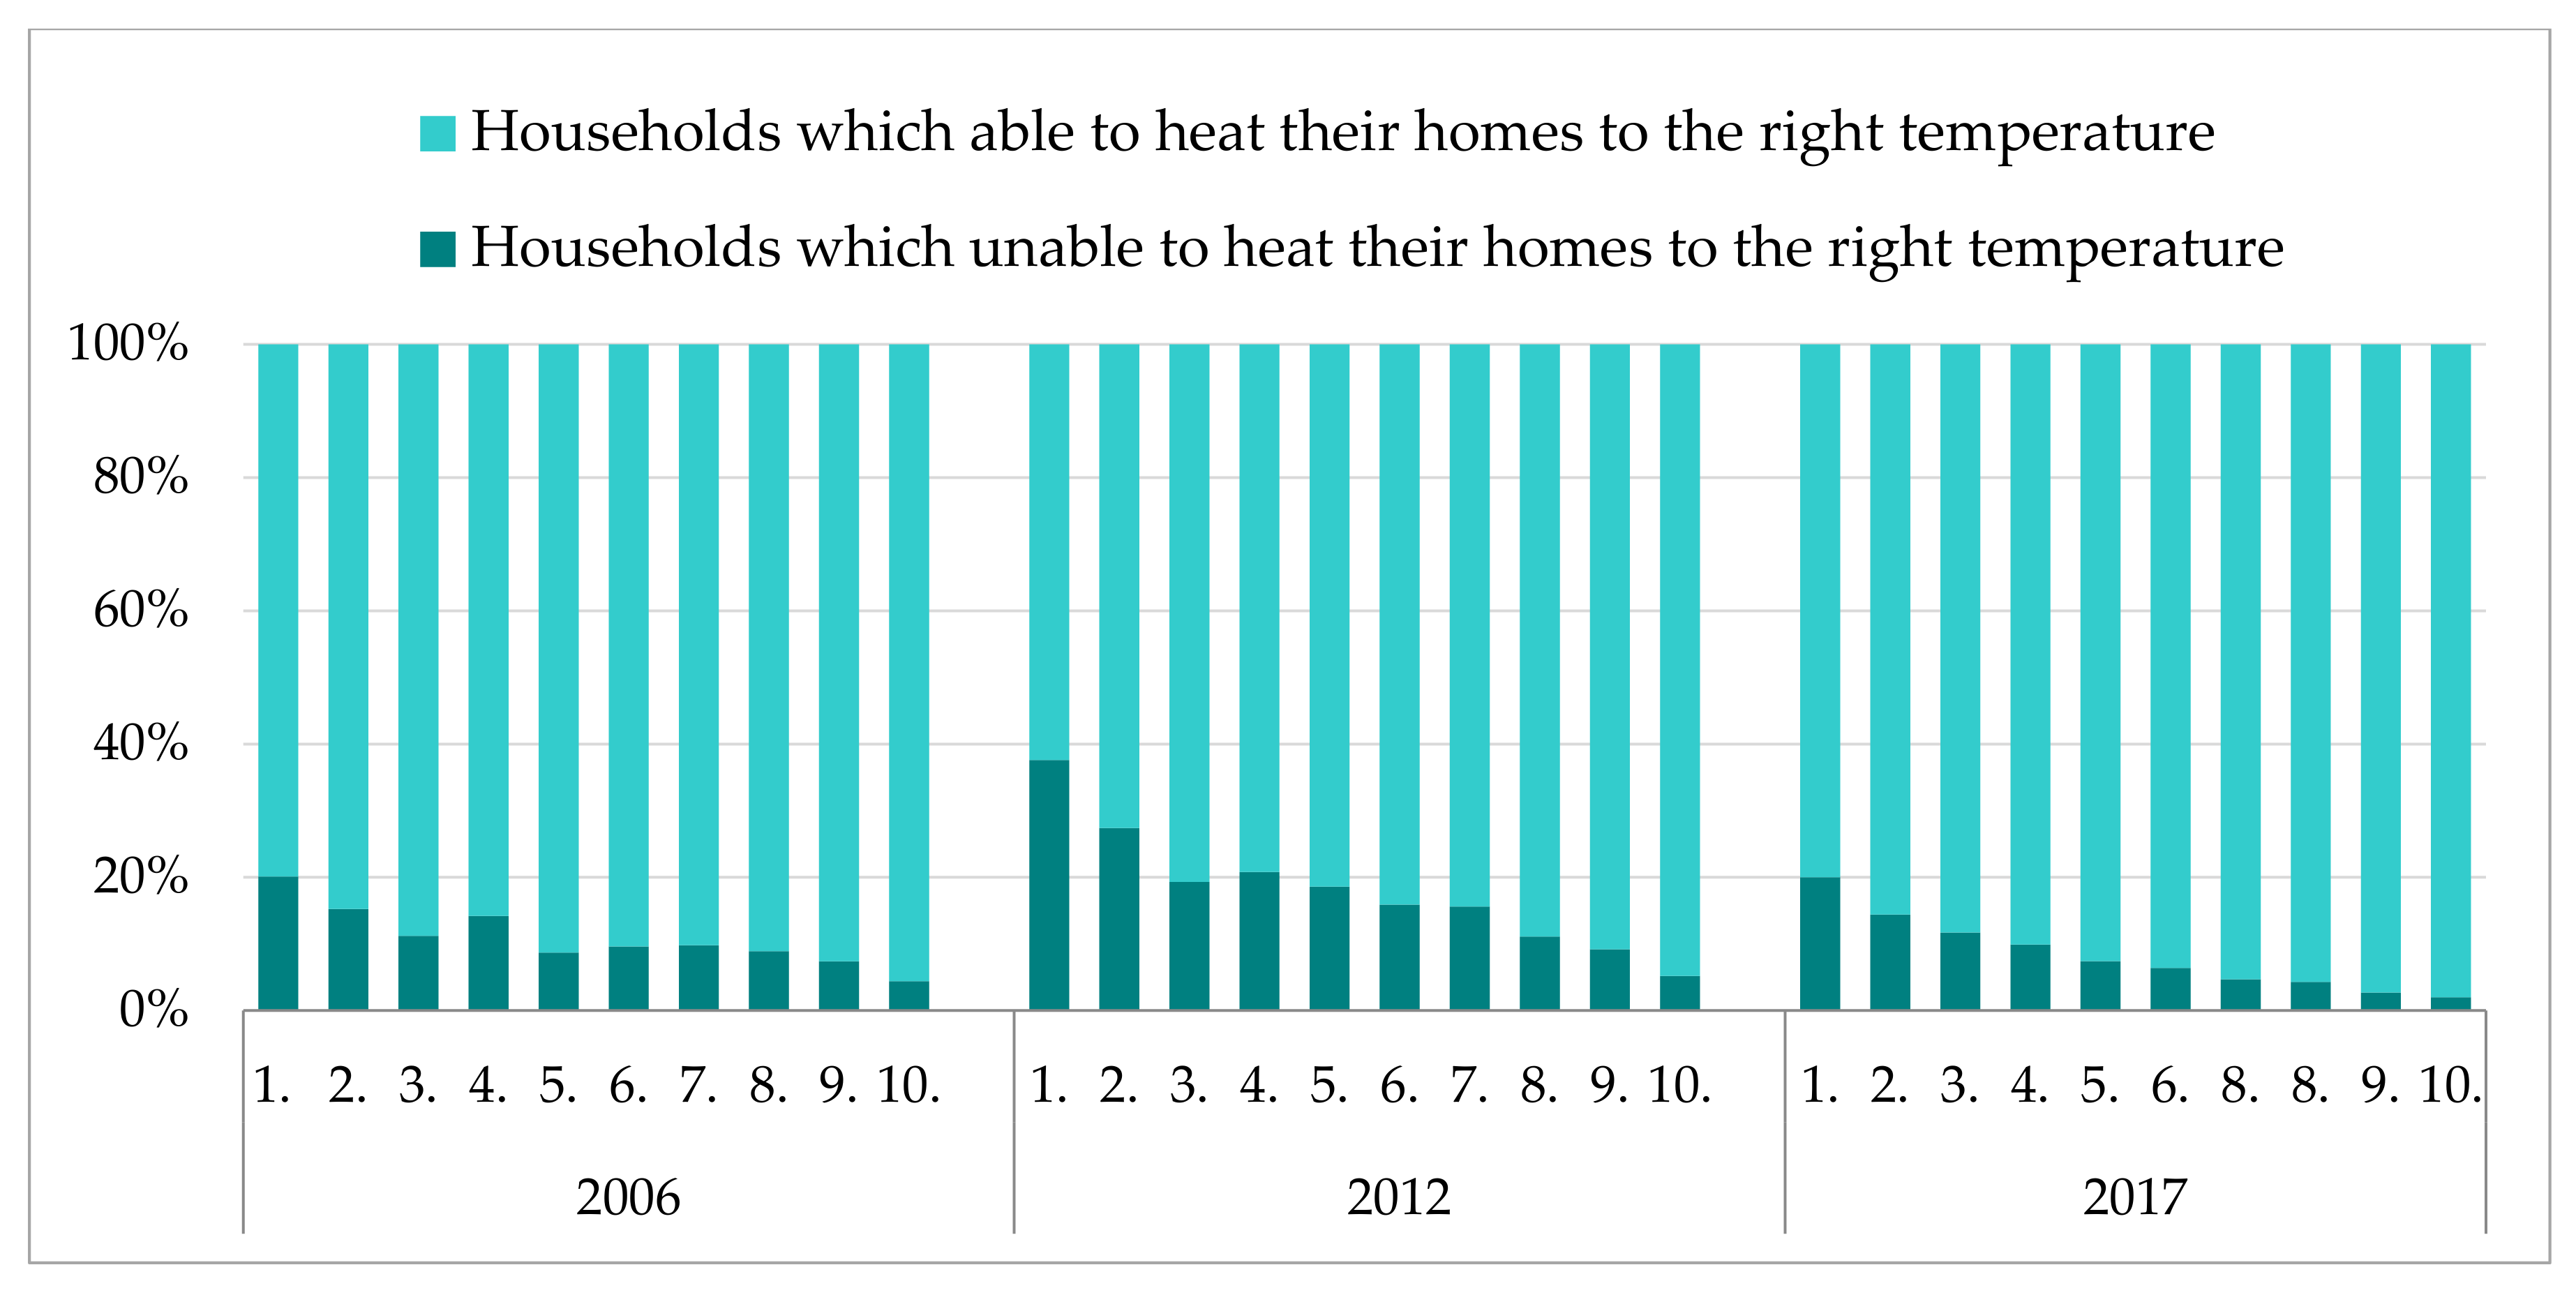
In the years following the global economic downturn, one-sixth of households (16.3%) were unable to heat their homes to the right temperature in winter. A positive change is indicated by the fact that this number was halved by 2017 (to 7.6%). However, when income positions are reviewed (
Figure 4), it is evident that by 2017, the proportion of households in the lower strata of society that were unable to heat their homes to the right temperature did not decrease either: 20% of the poorest could not provide warmth in their homes in winter; moreover, the situation in the three lowest income deciles did not change in 10 years (the 2006 level was typical even in 2017). Studying the phenomenon in terms of energy sources used for heating, it is clear that in 2017, the proportion of households using conventional fuels was the highest among those who were unable to heat their homes properly. This is also explained by the fact that these fuels (coal, wood) are more of an energy source for the poor: while in the lowest income tithes more than half of households heat in this way, in the higher income deciles the proportion of those using solid or liquid fuel is less than 10%. For poor households, fighting the winter cold significantly increases the risk of heating with anything to keep their homes warm: even with toxic combustible waste, which causes severe environmental damage as well as health issues.
3.2. Modes and Intensities of Domestic Energy Consumption
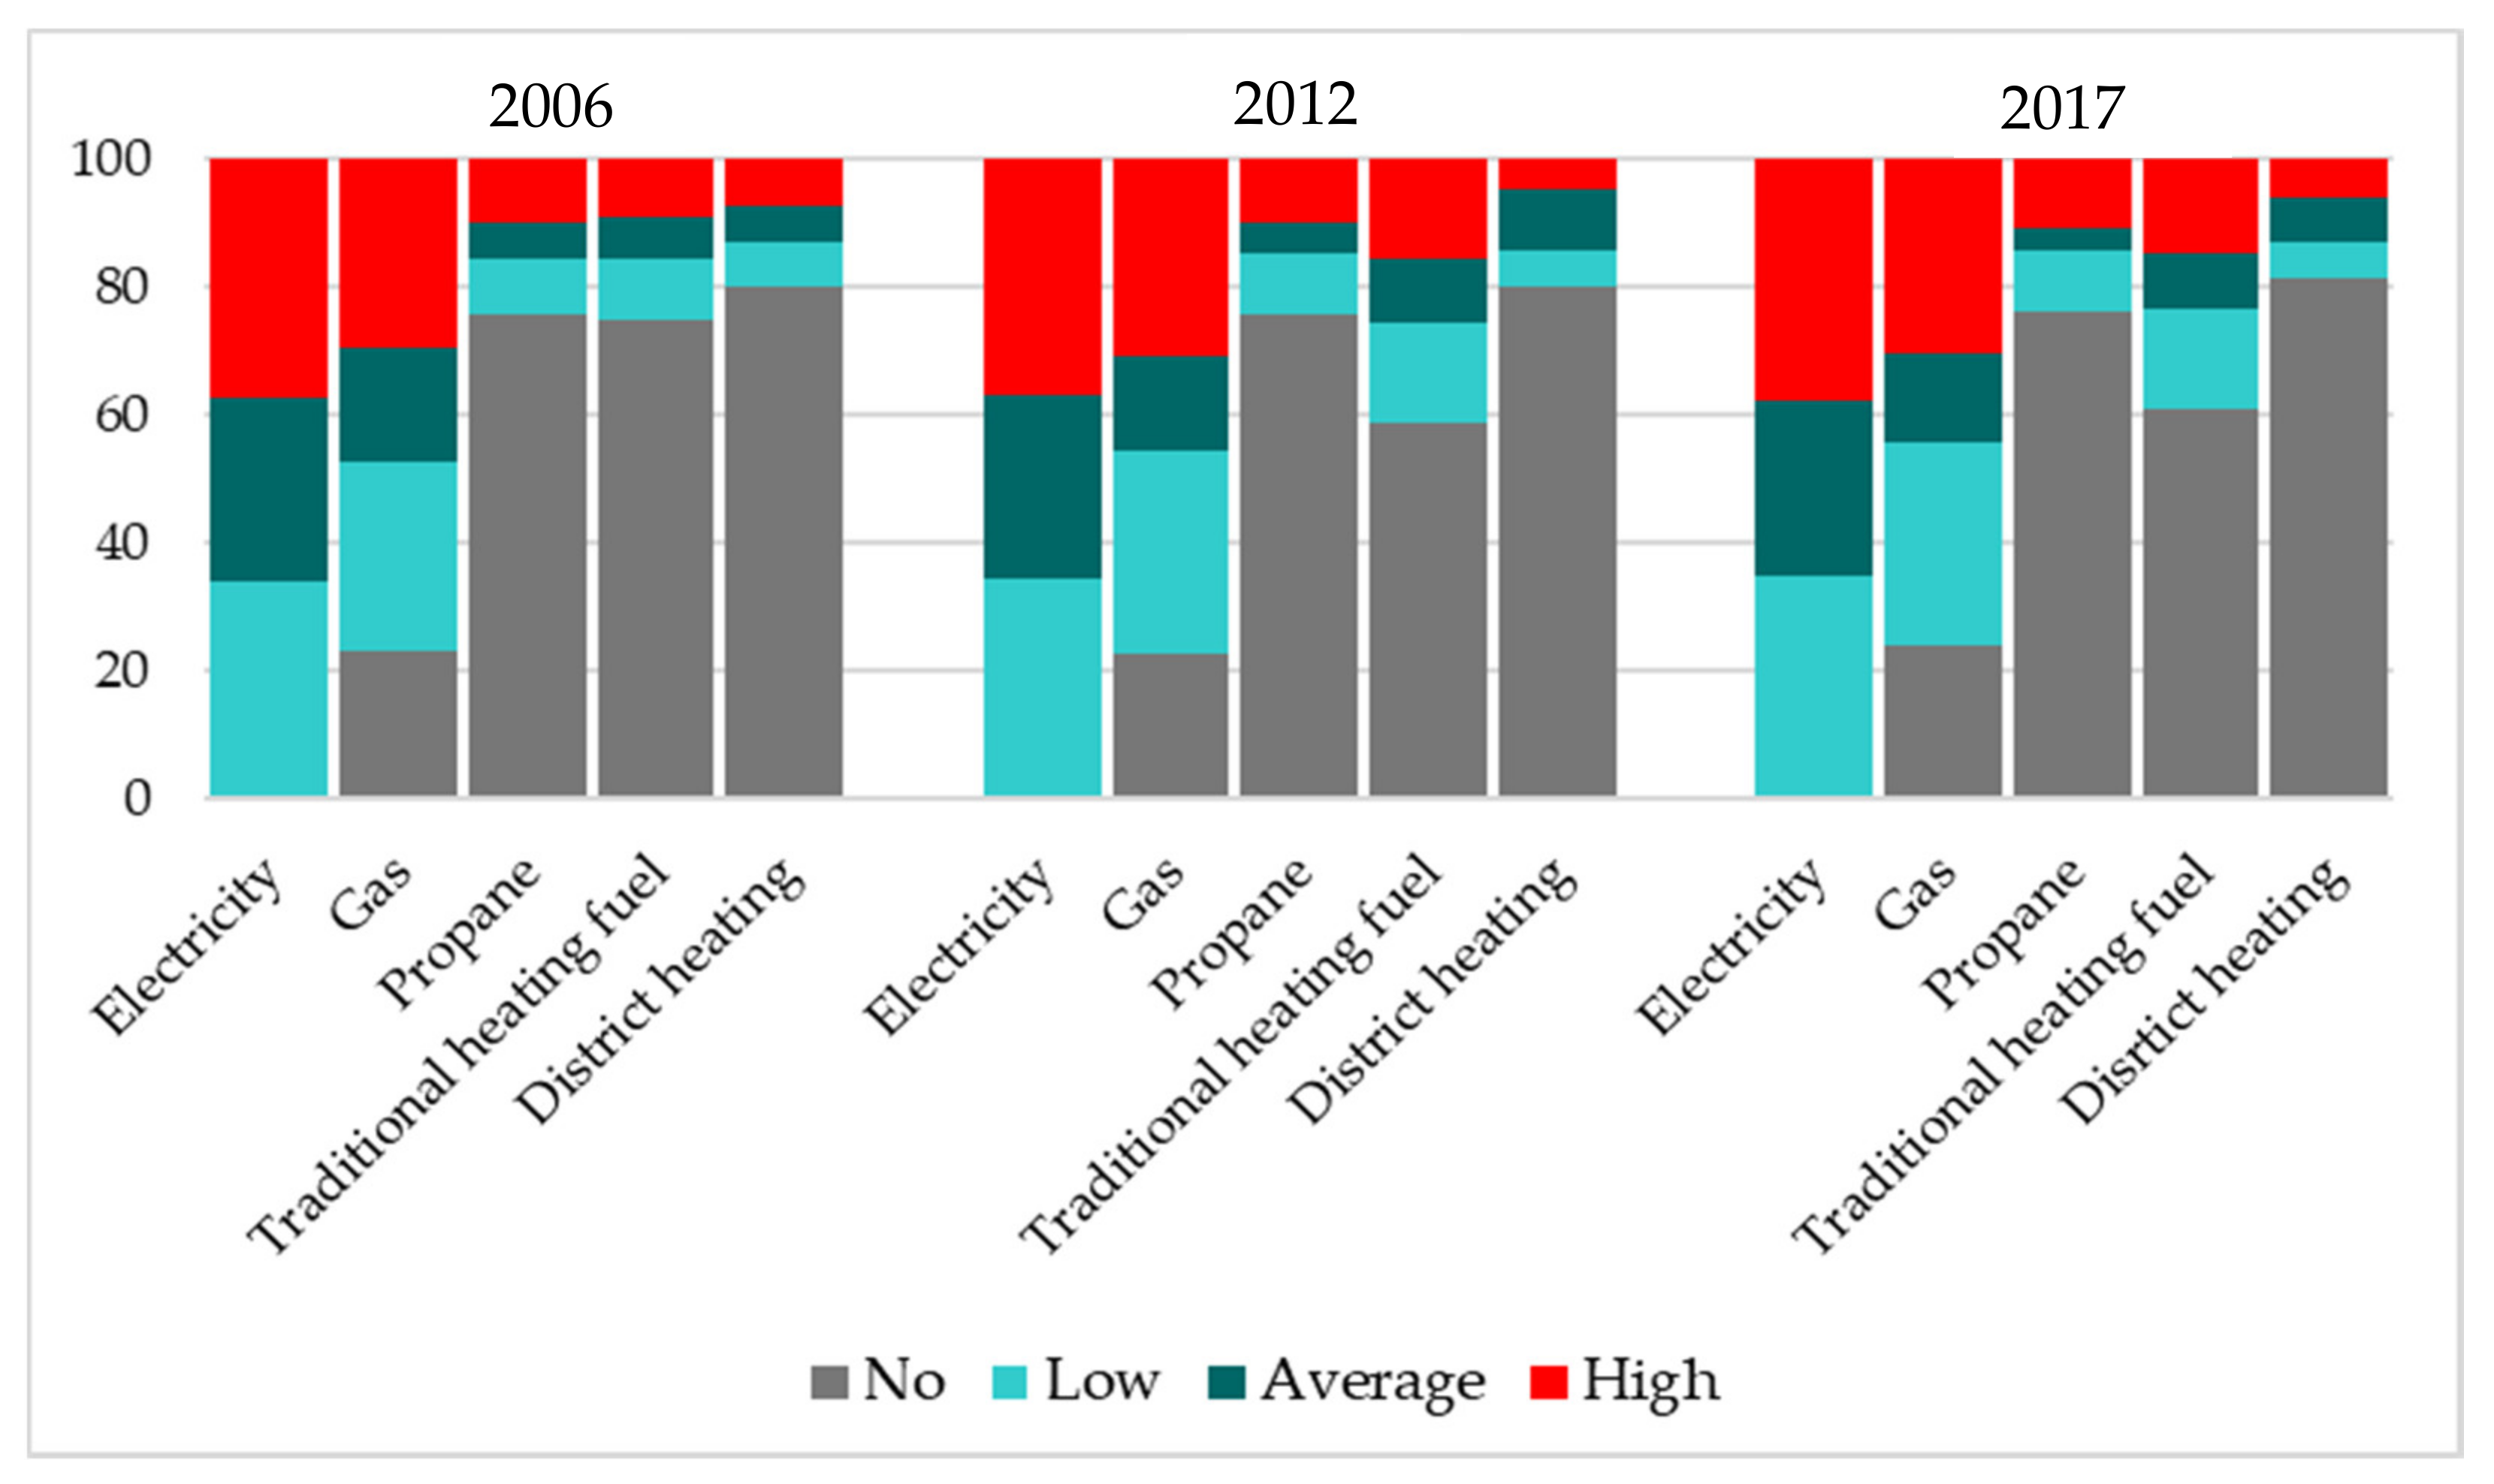
In the following, households are reviewed by groups formed based of the median expenditure spent on energy consumption for each type of energy. Four groups were formed: (1) non-consumers of energy, (2) low, (3) medium, and (4) high energy consumers. In the three cross-sectional surveys available to us, each household consumes electricity, and in terms of other sources of energy, “non-consumer” households form an independent group. Households paying energy costs around the national median value of expenditures on the type of energy reviewed (plus/minus 20%) were considered to be “average energy consumers”. “Low energy consumers” included households with energy expenditure below 20 per cent of the median value, while “high energy consumers” included households with energy expenditure more than 20 per cent above the median value.
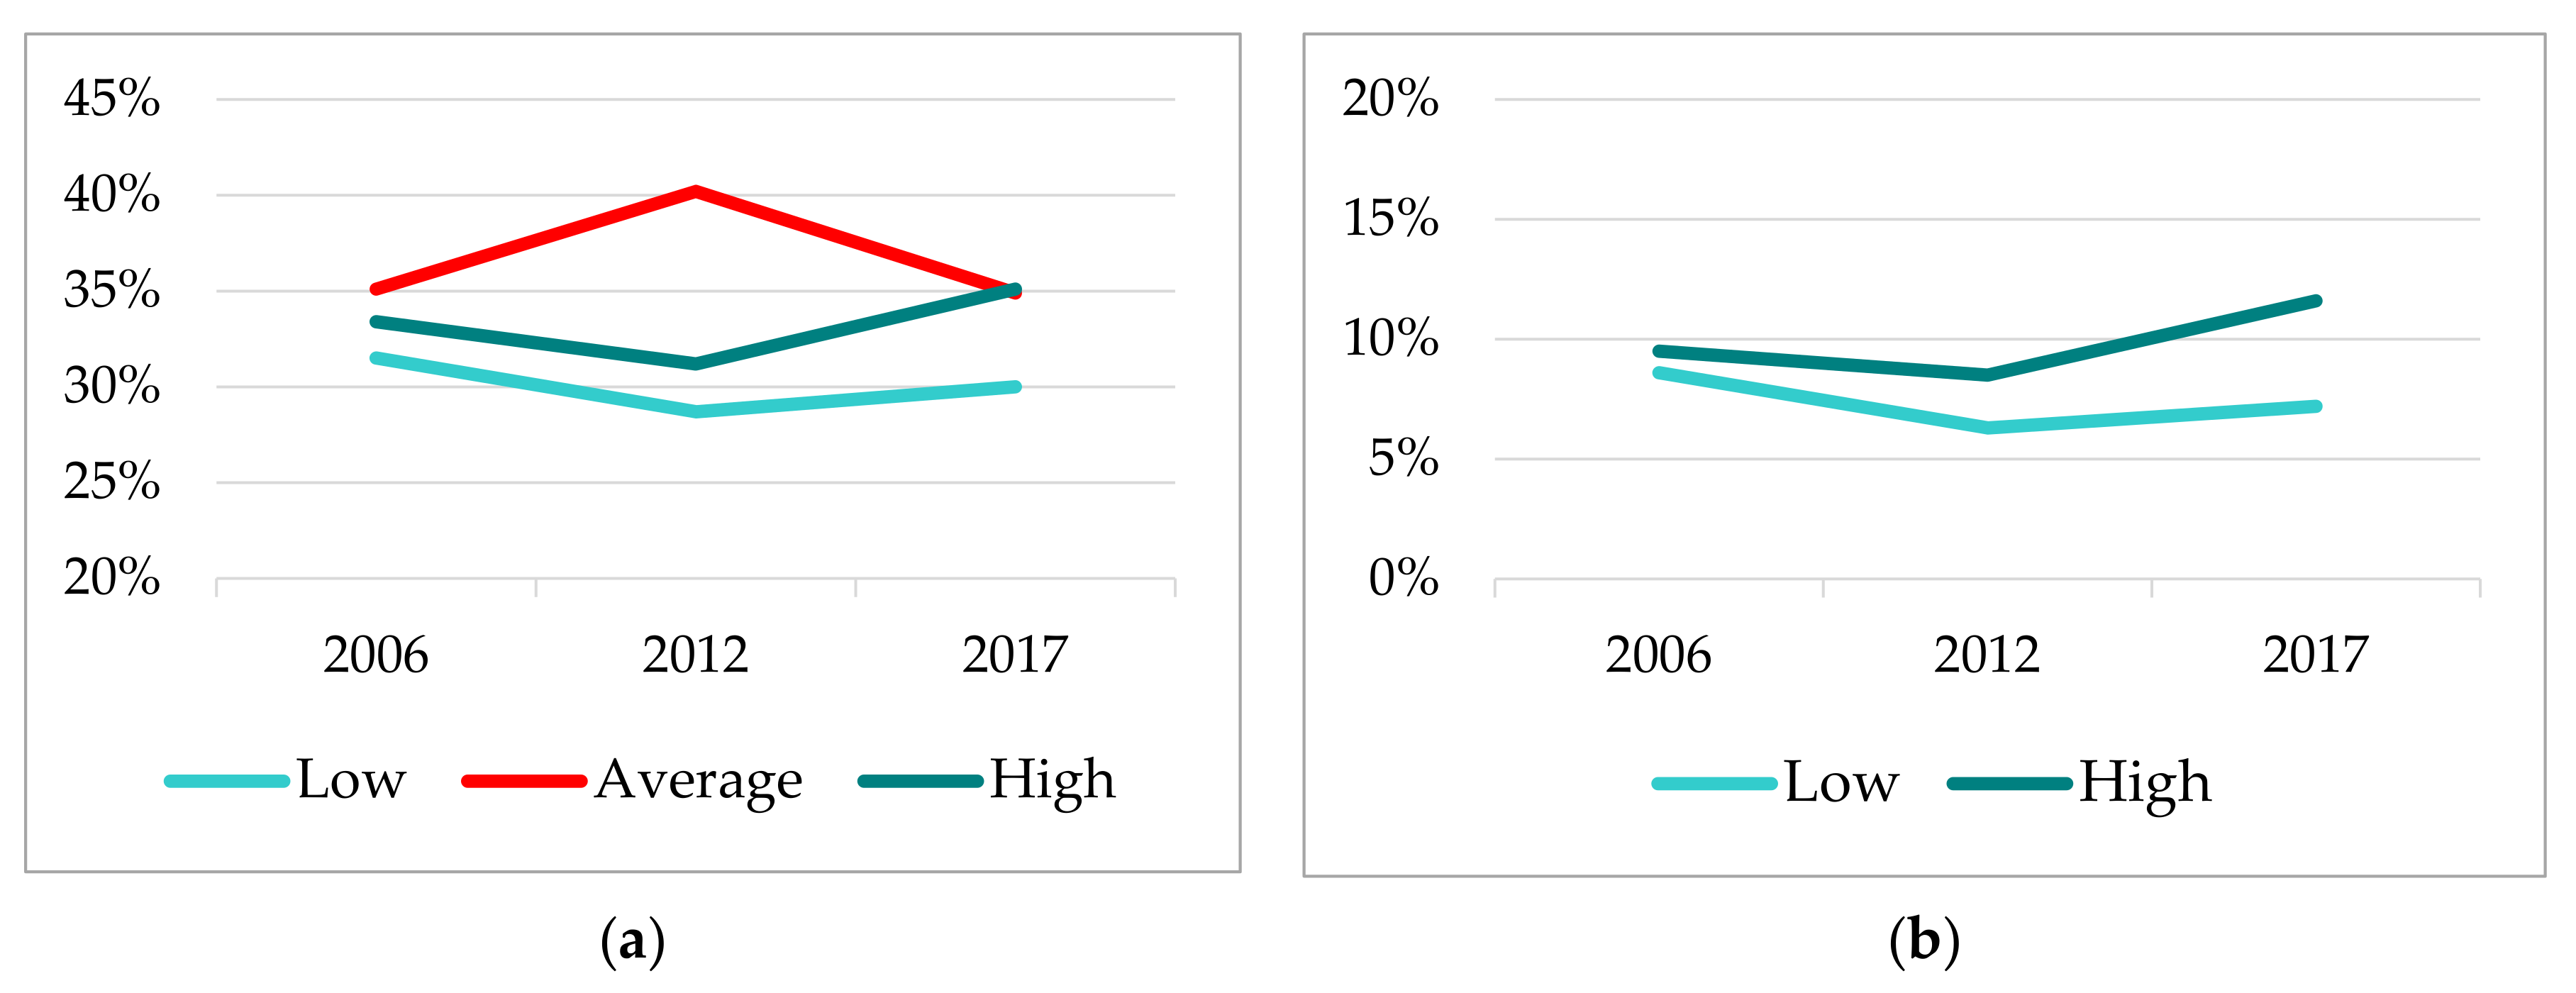
Figure 5a shows that slightly more than one third of Hungarian households are high energy consumers (2017: 35.1%) and somewhat less than one third are low energy consumers (2017: 30%). Whether reviewing high or low energy consumption, the proportion of each group did not change significantly between 2006 and 2017. The share of high energy consumers decreased minimally to 2012 (from 33.4% to 31.2%) but then it increased to 35% by 2017, and overall an increase of only 1.7 percentage points can be registered in the period under review. The same trend can be observed for low-energy households: a decrease during the first period (from 31.5% to 28.7%), followed by a minimal increase for 2017 (30%), while the overall change is only 1, 5 percentage points. There was a more considerable change in the case of average energy users during the first period: their share increased by 2012 (from 35.1% to 40.2%), but by 2017 it decreased by the same amount, thus in 2017 they were as many as in 2006 (35%). If the groups of high and low energy consumers are formed according to stricter criteria, i.e., households with more than twice the national median value are considered high consumers, and households with less than half the median energy as taken as low energy consumers, it can be established that there was hardly any change in terms of the distribution of either household type between 2006 and 2017 (see
Figure 5b).
The intensity of use of each energy type also reflects a high degree of stability (see
Figure 6) except for a single energy source: conventional fuel. The share of households not consuming conventional fuels showed a significant decrease (13.8 percentage points) and the rate of decline was stronger in the post-economic crisis period (2006–2012) than in 2012–2017. At the same time, the share of intensive users of conventional fuels increased: less than a tenth (9.1%) of households belonged to this category immediately before the global economic downturn, while in the post-crisis period as many as one-sixth to one-seventh (15.5% and 14.8%, respectively) Our calculations were made not only for the global (total) household energy consumption, but also for the annual energy consumption per 1 m
2 and 1 person per household. Based on the results obtained, the same situation is seen as described above (although we could not accomplish the calculation according to the number of households in 2013 as the headcount per households variable is not included in the database provided to us).
As the stability of the distribution of the different types of energy-using households presented refers only to the intensity of energy used and to each type of energy (i.e., the proportions of household energy costs) and not to changes in buildings and flats, it is advisable to review households with different energy use in terms the characteristics of the buildings and flats. In all three years of the period under review, among the high energy consuming households, in brick-built detached houses, or else in residential areas of detached houses, the proportion of those living in 3 or 4-room, medium-size (76–100 m
2) property is the highest, yet a number of significant changes can be observed between the periods in terms of other housing and settlement characteristics. It is evident (see
Table A1 in the
Appendix A) that the share of households with high energy costs almost tripled by 2012 in traditional urban residential areas (from 6.9% to 19.2%) and then somewhat (by 4.3 percentage points) decreased to 2017. At the same time, their share decreased only minimally in both detached-house districts and rural areas, while their share remained essentially unchanged in housing estates and villas. The other significant rearrangement is yielded when review the data by type of buildings/houses: the proportion of energy-intensive people living in detached houses decreased significantly by 2017 (from 68.4% to 59%), while those living in multi-apartment condominiums (both with less-than-10-flat and more-than-10-flat condominiums) rocketed by the end of the period (the largest increase—more than double—occurred in condominiums with less than ten dwellings). It is also noteworthy that while in 2006 only 1% of energy-intensive households lived in one-room or at most one-bedroom flats, in 2012 their share was already 5.5%; in 2017 it was over 6.5%. Simultaneously, the share of those living in in 3–4-room properties fell (from 62% to 54%). Consistent with these changes, the proportion of energy-intensive consumers living in large (mainly between 76 and 100 m
2) properties decreased significantly, and the rate those living in properties larger than 100 m
2 just moderately; the proportion of energy-intensive flats smaller than 36 m
2 has more than quintupled. Based on the year of construction, their share increased significantly not only in the oldest houses/flats built before 1945, but also in newer (after 1999) buildings (doubled in the latter case). It is important to point out that while in 2006 almost two-fifths of this group lived in villages, by 2012 and 2017 only a quarter, but their share in the capital and smaller rural towns increased significantly by the end of the period under review (the proportion of those living in county capitals remained unchanged in this regard).
Trends for low-energy households were more or less the opposite to those described for high-energy consumers, involving four very significant changes. Although in all three cross-sectional years the share of people living in low-energy-consuming households, similarly to high energy consumers, is the highest amongst people living in residential areas characterised by detached-houses, their proportion has also surged significantly (from 16% to 23.5%) in residential areas of rural character while in housing estates and traditional urban areas declined considerably. Similarly considerable change can be observed in terms of the type of building: while in 2006 households living in condominiums with 10 or more apartments belonged to the low energy consumers, by 2017 their share was the highest amongst those living in detached houses (42% in 2006; 62% in 2017). Based on the floor area of the property, it can be established that while in 2006 more than a third (36.8%) of low energy consumers lived in apartments with a floor area of 36–55 m2, a quarter in properties with a floor area of 56–75 m2 and a further fifth in properties even larger, by 2012 and 2017, their share decreased in smaller apartments and increased in properties larger than 56 m2, but especially in properties above 100 m2 (in the latter case, there was a 2.5-fold increase). In terms of the type of settlement of the place of residence, the biggest change is that their proportion decreased to almost half in the capital, while in the smaller rural towns and villages we registered an increase of 7–8 percentage points.
Based on the results, it can be assumed that the stock of detached houses has expanded in recent years with more newly built properties on the one hand, and a significant part of the detached houses have been modernized on the other hand. At the same time, households living in detached houses also include the largest energy consumers, which is obviously related to the characteristics of the buildings (detached houses are larger than typical flats in condominiums and housing estates, so their heating and lighting are more expensive). The rising and then declining trend of intensive energy use in the energy consumption of condominium flats is presumably related to the significantly rising energy prices in the early 2010s and then with the decreasing prices after the government intervention. All this suggests that it is worth reviewing the energy consumption habits of Hungarian households more meticulously than before, therefore in the next step we will analyse the energy use-behaviour patterns of households based on the joint consideration of the intensity of the types of energy used.
3.3. Typological Profiles of Domestic Energy Consumers
The study of energy consumption was deepened by exploring further details through examining the groups of Hungarian households according to the combination of the intensities of the types of energy used. The use and intensity of different energy sources varies, as, for example, piped gas is usually used for heating, while and propane gas can only be used for cooking, their mixing, however, points out the housing and social differences of the households and flats. For example, where there is only electricity in the household, propane gas can be used for cooking, or where heating is only possible with conventional fuel, electricity or propane gas can be used for cooking. In addition, as mentioned in the introductory part, the type of energy used depends not only on the decisions of households, but also on the available opportunities and infrastructure.
Based on a combination of variables measuring the intensity of five types of energy (electricity, pipeline/natural gas, propane gas, conventional fuel and central heating), homogeneous groups of households were identified using model-based clustering (latent profile analysis, LPA). LPA is a method that, based on high-level indicators, identifies unobservable, latent groups of households with similar energy consumption patterns. Our researcher’s intention was to find consumer patterns that are typical for a group of the surveyed households, taking into account the intensity of the use of different types of energy. Thus, we used a solution (model-based clustering) that allowed us to form a model structure whereby typical energy consumer groups could be identified.
During the analysis, several models were evaluated in all three samples: 2–7 group solutions were examined and the fitness of the model (Bayesian information criterion, BIC; Akaike information criterion, AIC), the significant result of Lo–Mendell–Rubin likelihood ratio (LMR-LRT), the
p-values of bootstrap likelihood ratio test (BLRT), group sizes (at least 5% of the sample), and higher entropy values were taken into account to determine the optimal model solution [
18,
19]. In the three samples, the AIC and BIC values decreased continuously with increasing number of groups, however, the rate of decrease began to moderate only after the 6-class solution, although the entropy value of the 7-class solution—in 2006 and 2012 samples—was higher than that of the 6th grade. Bearing both the proportion of the smallest class and interpretability in mind, the 6-class structure was adopted in all cases.
First, we present the types of Hungarian households emerged based on energy consumption in the latest sample, 2017 (see
Table 1). The results show that households have a larger share (22.1%), representing some one-fifth of households (
class 4) including the highest electricity and piped gas consumers (they are the high electricity and gas consumers) who do not use other energy source or at very low intensity. In two groups of roughly similar size (
class 1 [18.6%] and
3 [17.8%]), in addition to the average electricity consumption, the use of conventional fuels is typical, with the difference that households in
class 1 supplemented it with using significant amounts of propane gas as well (obviously for cooking). Unlike the other clusters, households in
class 5 (17.5%) and
class 6 (15.2%) are characterized by low electricity and gas consumption, however, the use of central and district heating is dominant in the latter, i.e., in
class 6. And there is a marginal group (
class 2 [8.8%]), which, similarly to the households of groups 1 and 3, is characterized by low—below average—electricity and gas consumption, however, it is also characterized by the fact that it also uses other energy sources with greater or lesser intensity (propane gas, conventional fuels and central heating).
Latent profile analysis explored significant differences between both high and low energy consumption groups: visibly, intensive (high) central heating users (class 6) and intensive conventional fuel users (class 3) consume other energy types/energy sources to a low extent; and low electricity and gas consumption is not necessarily associated with low-intensity use of other energy sources (such as in the case of class 5 vs. class 2).
We wish to point out that the dominant energy use of groups formed based on energy use combinations does not mean that the global energy consumption of a certain consumer group is (also) high, as these are consumer behaviours, and do not directly reflect the intensity of total energy consumption.
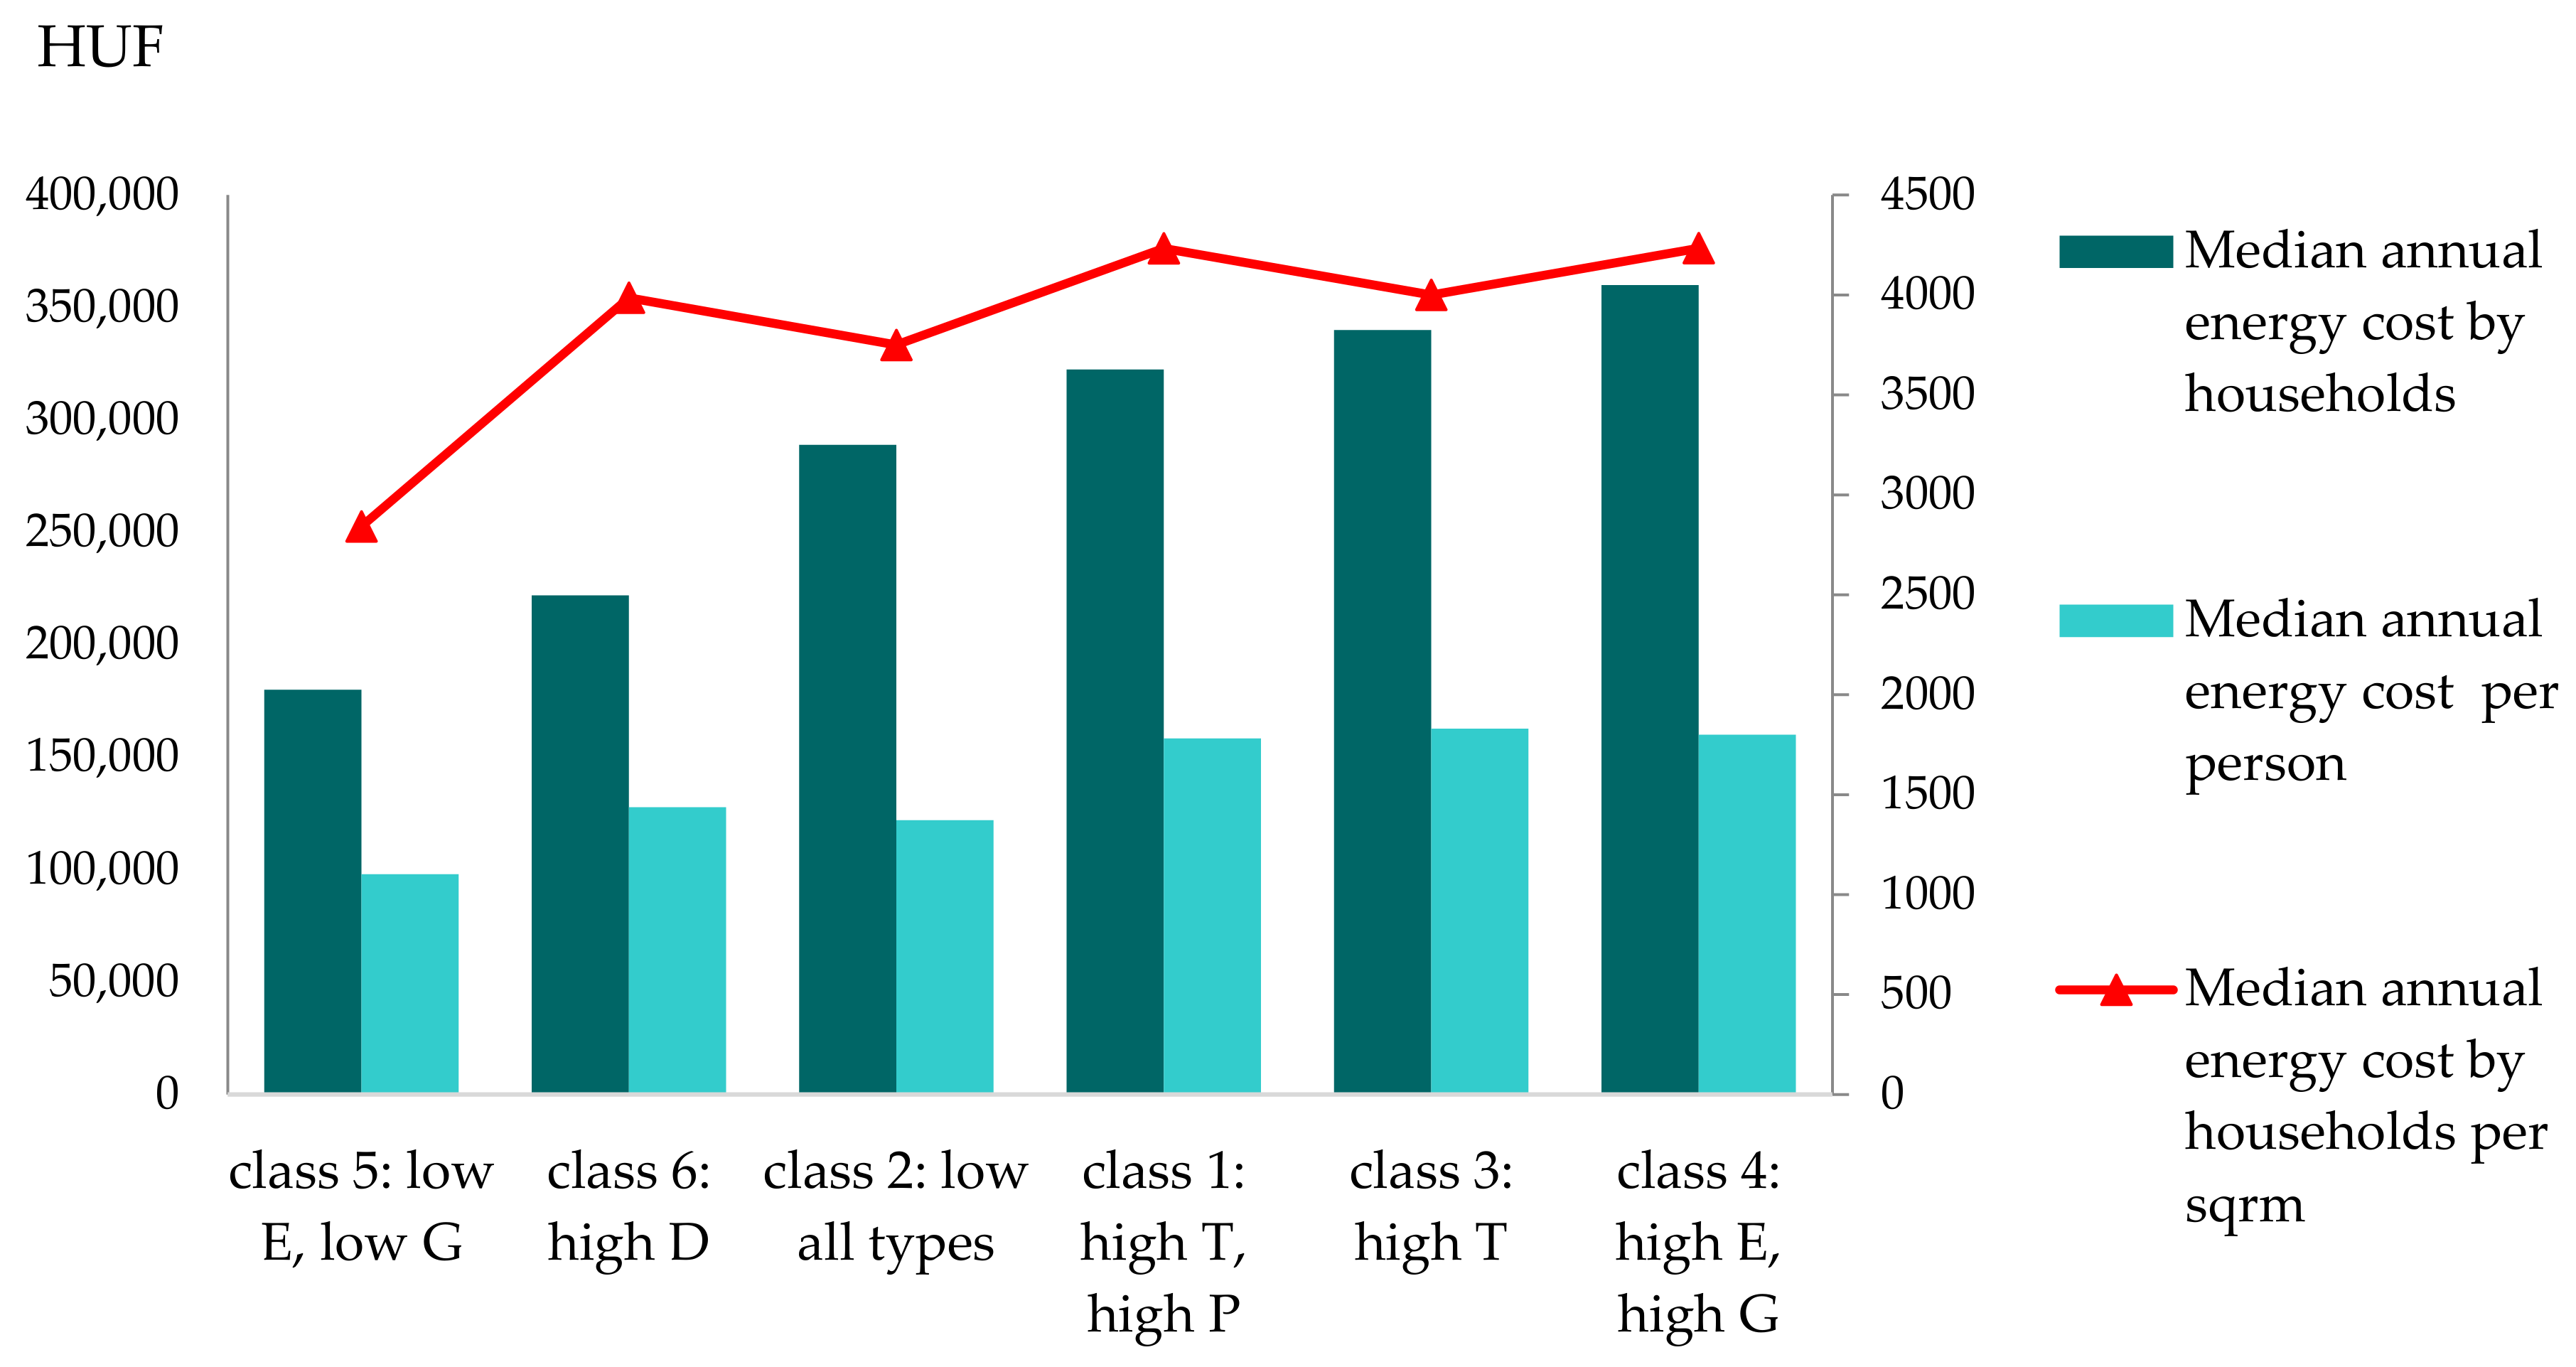
Figure 7 presents the differences between the groups in terms of global energy cost and energy cost intensity calculated based on household size (number of employees) and the size (floor area) of the flat concerned. The
largest consumers of electricity and gas (
class 4) are actually the highest global energy consumers, but the median energy cost per capita is not higher in this class but in the class of
intensive conventional fuel users (
class 3). The global annual energy consumption
of intensive district heating users (
class 6) is the second lowest. In essence, the three largest energy consumers (either the average annual energy cost or the average annual energy cost based on headcount) are
class 4,
class 3 and
class 1, i.e., intensive electricity and gas consumers, intensive conventional fuel users and those who supplement their high fuel consumption with the use of propane gas. The lowest energy consumers are the households of
class 5,
class 6 and
class 2: the low electricity and gas consumers, the intensive district heating users and the low-intensity users of all types of energy.
The housing, building, and socio-demographic characteristics of each consumer group are summarized in
Table A2 in the
Appendix A. Among the households of
the group of largest electricity and gas consumers (
class 4)—compared to the total sample—the proportion of those living in their own large (over 76 m
2 and more than 3-room), in detached or semi-detached houses in residential areas and condominiums in traditional urban built-up with higher status (with high-school diploma or higher, belonging to income quintiles 4 and 5) is relatively high. In terms of household composition, they live in smaller-than-average households: they are typically middle-aged couples without children or retired couples. The proportion of people living in small settlements and villages is low.
The class of intensive traditional fuel and propane gas users (class 1) typically consists of households situated in, 2-room, detached houses (built before 1969) in rural residential areas and villages, of whom, compared to the total sample, the low status (low-income and low-education) is higher.
The other class of intensive traditional fuel users (class 3) also has a high proportion of households living in detached houses in rural towns and villages. However, unlike class 1, the households here are owners of larger properties (more than 3 rooms, more than 76 m2) and the class also includes a high proportion of those in the 3rd and 4th income quintiles. In terms of household composition, the proportion of couples without children and singles is low and the proportion of couples with children and couples without children aged 55–64 is slightly higher than the sample average.
Among the intensive users of district heating (class 6), who are also characterized by low electricity and gas consumption, there is a remarkably high number of households living in up to 2-room flats built between 1970 and 1989, in urban condominiums or residential buildings with more than 10 flats in the larger rural cities and in the capital, and in urban areas. proportion of households living in condominiums. In terms of their social status, the proportion of those in the top income quintile and those with a general high-school diploma is high, while the proportion of graduates is also slightly higher than the sample average. In addition, the proportion of households living in rented flats is also high within this group.
The housing and socio-demographic characteristics of the low electricity and gas consumption group (class 5) are very similar to those of class 6: they also typically live in relatively small (up to 2 rooms and up to 75 m2) condominium flats in a slightly higher than average proportion in cities and the proportion of households living in rented (especially non-market rented) property is also high, but, in contrast to members of class 6, the proportion of couples raising children is low and that of retired households is high.
The low energy users (class 2) households are characterized by the fact that the owners typically have low-education but higher-income (4th income quintile), they are elderly without children (55–64 years old) or retired, living in detached-hose or rural residential areas in smaller rural towns and villages, in properties larger than average (above 75 m2 and with more than 3 rooms).
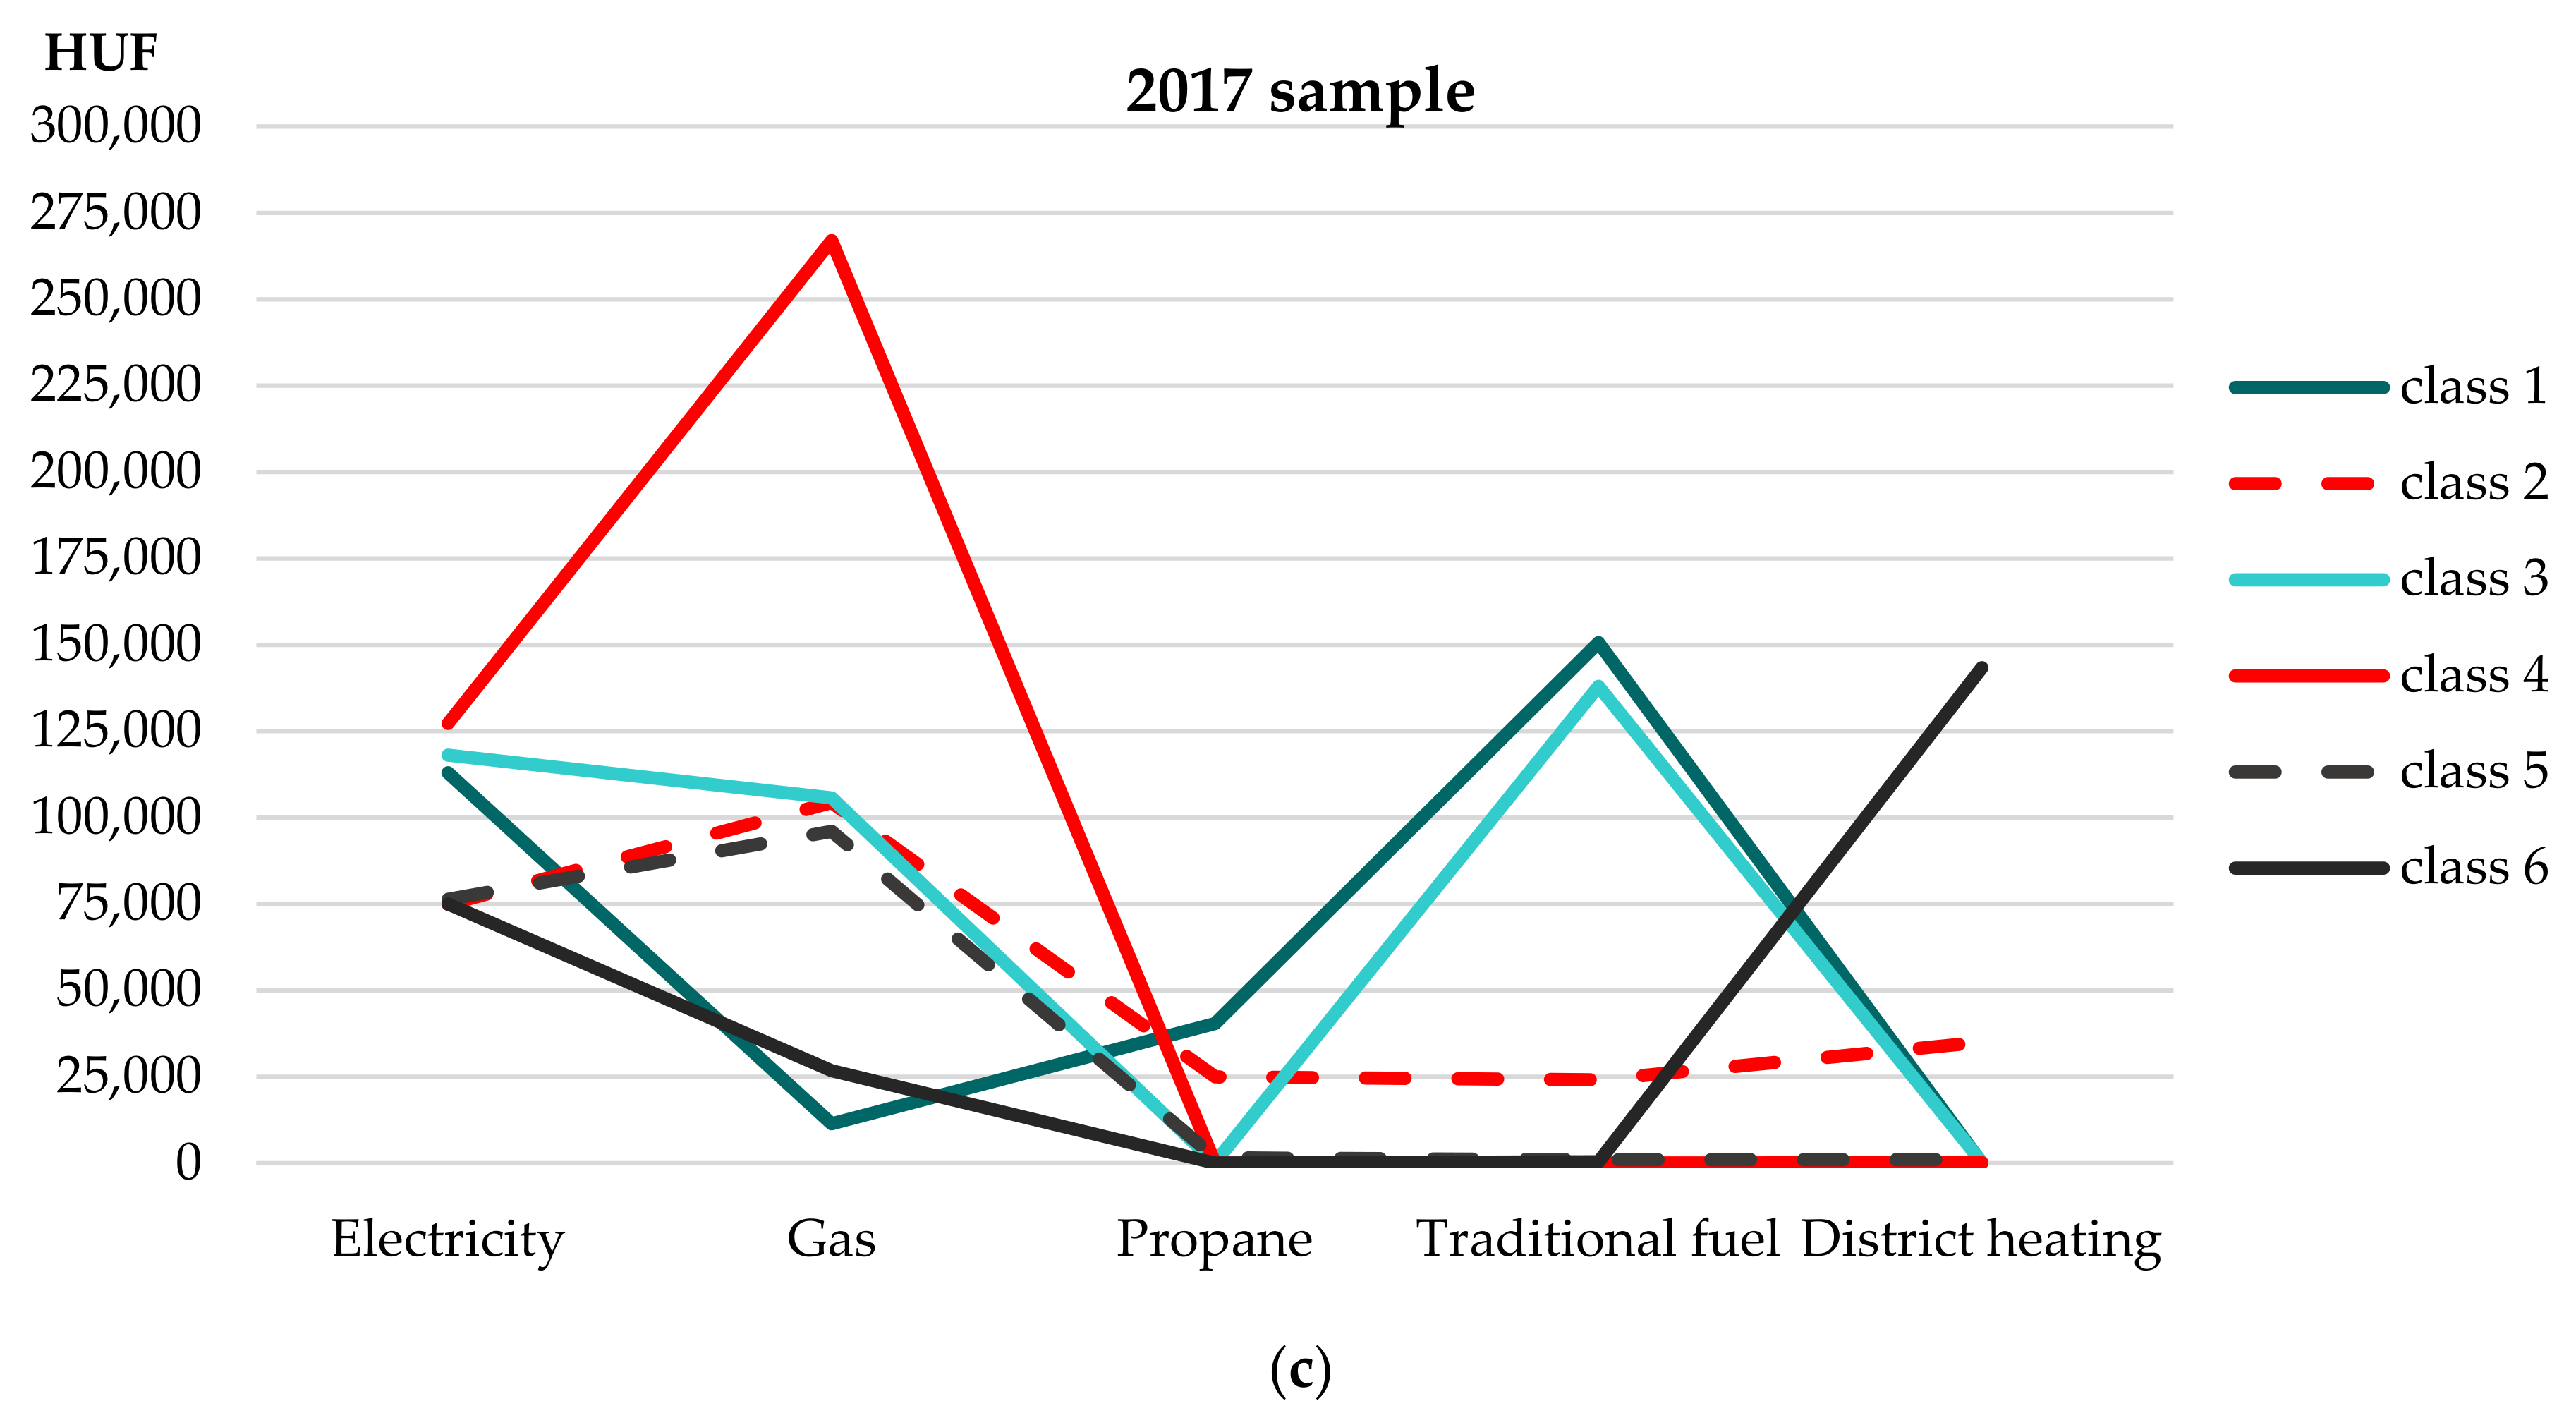
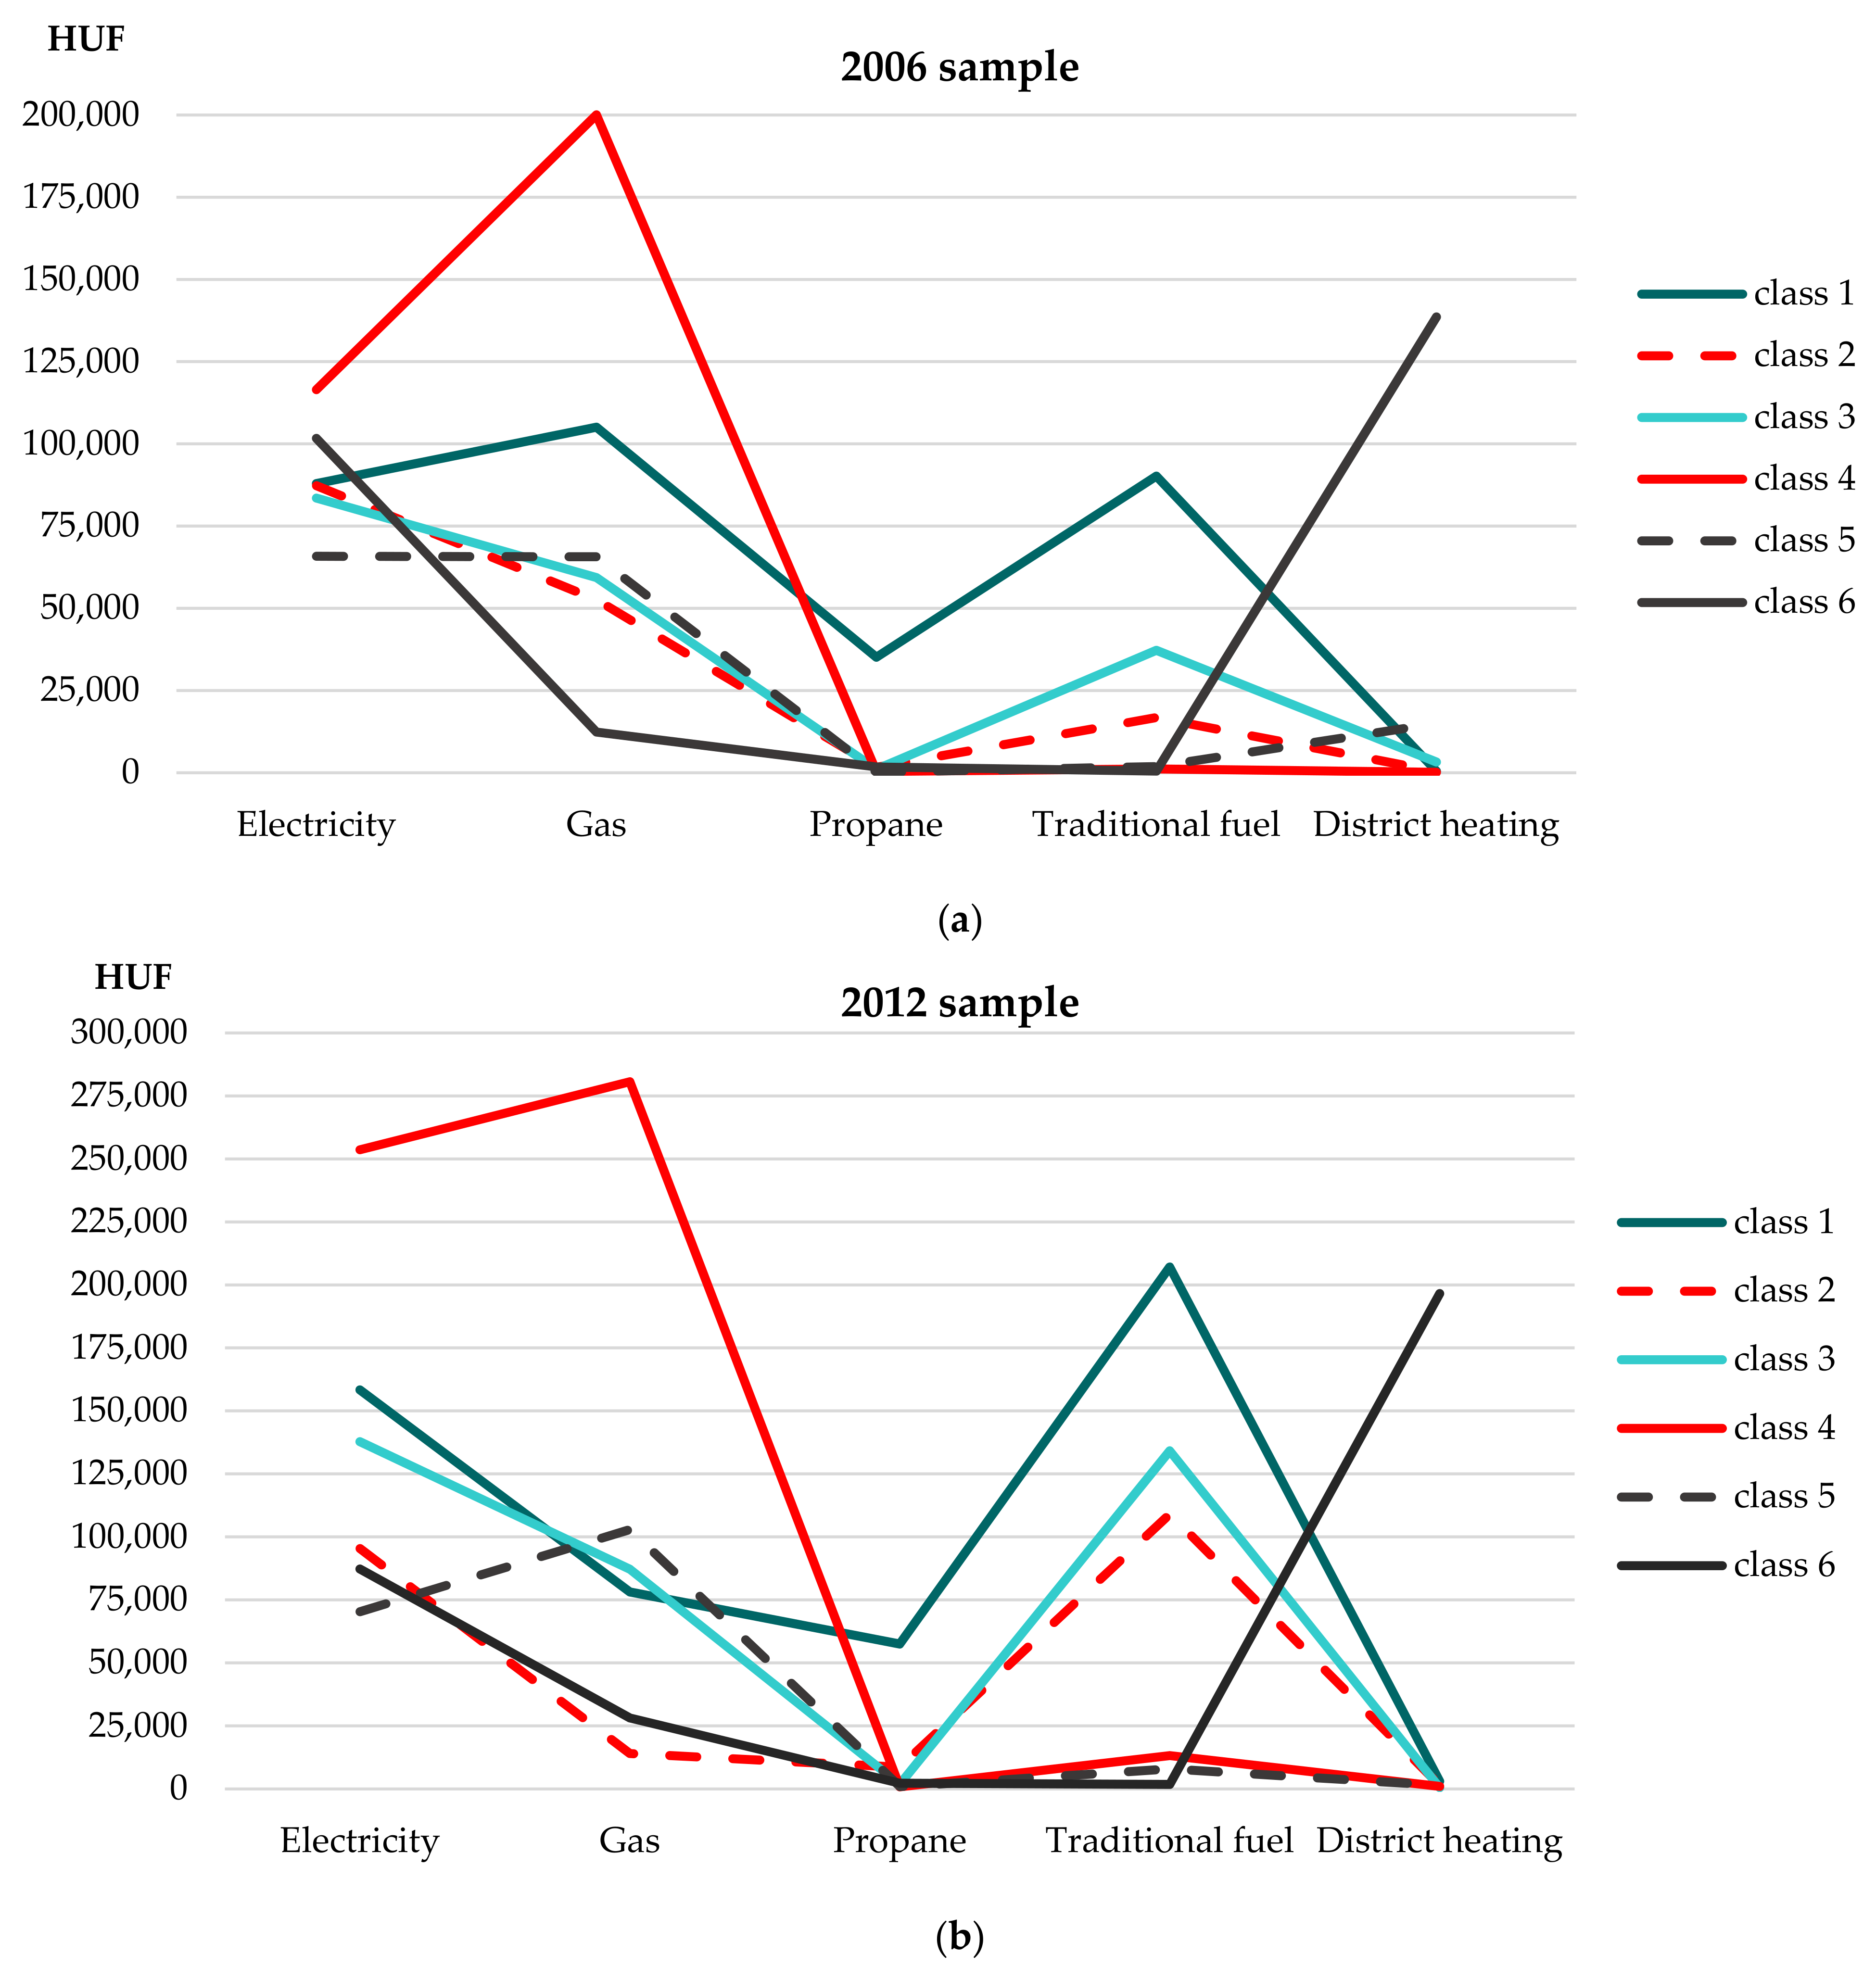
It is evident from
Figure 8 that the pattern of energy use profiles in the sample shows very strong similarity in three periods. Three differences can be observed: in 2006 (compared to 2012 and 2017), high central heating use (
class 6) was coupled with high—well above average—electricity consumption, and in 2012 in the group of low energy consumption (
class 2), not all energy sources uses are of low intensity, but the use of conventional fuels is high, and—also in 2012—the high use of conventional fuels and propane gas (
class 1) is combined with high electricity consumption.
Table 2 presents the descriptions of the classes of the three samples for convenience.
We are aware of the fact that the comparison of individual household types and their proportions over time is limited; in any case, the dominant household type is the large electricity and gas consuming households (class 4) throughout the period under review, and our results show a positive change and decrease. It is also a positive result that the share of low electricity and gas consuming households (class 5) still constitutes a considerable proportion, presumably due to the introduction of stricter energy standards and public policy incentives to improve the energy efficiency of buildings/flats.
3.4. Factors of Domestic Energy Consumption
In the next part of the analysis, we explored the determinants of the household profiles generated as a result of the intensity configurations of the different types of energy used by households. Specifically, we examined how the living conditions and social background of the consumer groups (classes 1–6) identified by latent profile analysis affect their energy consumption behaviour, i.e., the fact of which group they belong.
Thus, the
dependent variables of our explanatory models are variables measuring membership in each energy consumer class, and the
independent variables (predictors) can be divided thematically into two groups: (1) ‘building variables’ and (2) ‘socio-demographic variables’. (1) To characterize the buildings and flats, the following variables were included in the models: living environment, building type and year of construction, floor area of the flat, number of rooms, type of masonry, occurrence of technical problem in the flat (Is the property characterized by any of the following problems: the doors and windows are in bad condition, the masonry or floor is damp, the ceiling is leaking), and settlement type and regional location where the apartment is situated. (2) The socio-demographic variables include variables describing household composition (The types of household composition were based on the age, marital status and number of dependent children of the reference person.), size, income status (The databases available to us contain variables of income deciles calculated from persons sorted by the disposable (net) income of the household/headcount of households, so we used this variable to describe the income situation of the household during the analysis), upon what grounds the property is used, educational attainment and economic activity of the reference person, and length of residency. During the estimation procedure, each model was built step by step: the explanatory factors were included in groups, step by step, so that we could also examine the effect of each variable group on the dependent variable and on each other. A total of 18 model specifications were estimated (all significant). Models including only the characteristics of the properties (BUILDING MODELS) explain 11 to 68 per cent of each energy consumption behaviour; the most for high central heating consumption and the least for the ‘low all types’. The explanatory power of models made up of only socio-demographic variables (SOCIO-DEMOGRAPHIC MODELS) is lower in each case: 6–32 per cent of the dependent variable is usually explained by them. The final models combining building and socio-demographic factors (FINAL MODELS) explain 6–32 per cent of the variability (R
2 details can be found in
Appendix A,
Table A3). ANOVA showed that the difference in explanatory power between the models containing building variables only and that containing socio-demographic variables in addition was significant (
p < 0.001) implying that the inclusion of socio-demographic variables increases the explanatory power of the models. All this proves that building and housing characteristics explain the largest variation of the energy consumption behaviours under review, but the inclusion of socio-demographic variables further increases the explanatory power of the models. The results of the complete models, including all predictors, are presented in
Table 3.
Those of high-status (tertiary-educated, belong to the top-income quintile, middle-aged) childless middle-aged couples with their own real estate have the best chance of getting into the group of the largest consumers of electricity and gas (class 4), and use other energy sources to a lesser extent compared to the reference category of retired couples or to single retirees. Reviewing the effect of residence and building characteristics, it can be established that households situated in residential areas of detached houses, condominiums and villa districts, living in the larger-size properties with the higher number rooms and in the better condition, have the higher chance to become high energy consumers. The geographical location of the apartment is also decisive: the capital city has a significant impact, while other metropolitan settlements have a more moderate impact in the most developed regions of the country (Central Hungary, Central-Transdanubia and the Southern Great Plain).
In contrast, the intensive use of conventional fuel and propane gas (class 1), which is associated with low electricity and gas consumption, is strongly influenced by the low social background: it is more characteristic of larger households with low (at most secondary school without a high-school diploma) education and low income status, but active in the labour market (the increase in chances is linear with the increase in household size). Reviewing the effect of household composition compared to retired households used as a reference group, all other household types increase their chances of getting into this group, although couples with or without children between the ages of 30 and 54 have the best chance to do so. There is a significant difference between property owners, tenants and those using the homes for free: homeowners are almost four times more likely, tenants are slightly more moderately, i.e., one and a half times more likely to fall into this cluster. Analysing the building characteristics, we found that the determining factor in the high use of conventional fuel and propane gas is the rural residential area, the small detached house, which was built of brick or adobe before 1945. The poor technical condition of the flat/house is also positively related to this pattern of energy use behaviour (compulsion). The economically less developed regional-territorial location also increases the probability of getting into the group (areas of highest odds ratios: Southern Transdanubia and, Northern Hungary).
High conventional fuel use (class 3), which, however, is not coupled with propane gas and intensive use of other energy sources, is more prevalent for homeowners with 3–4 years of secondary education in the 2nd and 3rd income quintiles, who are typically couples with children or children or elderly couples without children. In contrast to the class 1 households of other traditional fuel users, these households live in brick, well-maintained, larger detached houses constructed between 1970 and 1999 and situated in the lowest economically developed regions of the country (Northern Great Plain, Northern Hungary).
Intensive use of central and district heating (class 6)—coupled with low electricity and gas consumption—is positively related to labour market activity, high (tertiary) education and belonging to the 2nd and highest (5th) income quintiles. In terms of their family background, young couples or singles without children are most likely to get in here and retired people have the least chance in this respect. Compared to free home users, tenants have a much higher (nearly three times) and homeowners a more moderate (almost double) chance of being included in this group as intensive central heating users. Living in the capital or rural big city (due to for example, the availability of district-heating infrastructure) in multi-apartment, panel housing estate and in smaller (2-room, 36–55 m2) apartment also increases the chances of belonging into this class.
Low electricity and gas consumers (class 5) have a high chance of having the highest level of education, but low chances of being in the highest income quintile (typically the ones belonging to the 3rd and 1st income quintiles are found here). Another decisive socio-demographic factor is the household size of 1–2 people: childless young couples or single young people and retired couples tend to be low energy and gas consumers. This energy consumption behaviour is more likely to occur among tenants and with less chance among homeowners. In terms of building and housing characteristics, traditional urban, multi-apartment condominiums, pre-1945 construction, metropolitan and big city (in the most developed region of the country) and smaller (up to 2 rooms) housing sizes have a significant impact in this respect.
Those using all energy sources with low intensity (class 2) are most likely to come from households belonging to the 4th income quintile and least likely to come from households with the highest educational attainment. The composition of the household also has a statistically significant effect: retired couples or single retirees are more likely to have low energy consumption. The assessment of the impact of building and housing characteristics shows that the location in rural residential area (mainly in Southern Transdanubia, Central Transdanubia and the Southern Great Plain), the construction of the house before 1945, the poor technical condition of the apartment and the medium (76–100 m2) size are all decisive factors in this energy consumption behaviour.


