Abstract
Current electric vehicle (EV) charging systems have limited smart functionality, and most research focuses on load-balancing the national or regional grid. In this article, we focus on supporting the early design of a smart charging system that can effectively and efficiently charge a company’s EV fleet, maximizing the use of self-generated Photo-Voltaic energy. The support takes place in the form of the Vehicle Charging Simulation (VeCS) model. System performance is determined by operational costs, CO2 emissions and employee satisfaction. Two impactful smart charging functions concern adaptive charging speeds and charging point management. Simulation algorithms for these functions are developed. The VeCS model is developed to simulate implementation of a smart charging system incorporating both charging infrastructure and local Photo-Voltaics input, using a company’s travel and energy data, prior to having the EVs in place. The model takes into account travel behaviour, energy input and energy consumption on a daily basis. The model shows the number of charged vehicles, whether incomplete charges occur, and energy flow during the day. The model also facilitates simulation of an entire year to determine overall cost and emission benefits. It also estimates charging costs and CO2 emissions that can be compared to the non-EV situation. With the VeCS model, the impact of various system design and implementation choices can be explored before EVs are used. Two system designs are proposed for the case company; a short-term version with current technology and a future version with various smart functionalities. Overall, the model can contribute to substantiated advice for a company regarding implementation of charging infrastructure.
1. Introduction
The personal transport sector is moving away from vehicles with internal combustion engines (ICEVs) by replacing them with vehicles driven by electric motors to improve sustainability from an energy-use and life-cycle perspective. The resulting vehicle types vary from mild hybrid to fully electric. Such a fully electric vehicle uses rechargeable battery packs to power its motors. This type of vehicle is simply referred to as an electric vehicle, or EV, in this article.
EVs contain multiple subsystems and parts that have to work in an orchestrated manner to provide transportation needs, usability, comfort, and safety for the user and society. A nine-window diagram [1] can be used to put the EV in its temporal and hierarchical context, not only showing its constituting parts, but also the systems surrounding it, and the context it has to function in and interact with, now, in the past and in the future; see Figure 1.
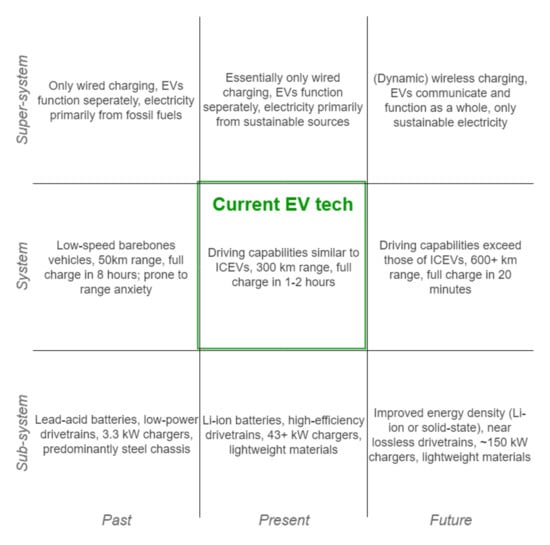
Figure 1.
Nine-window diagram placing EV technology in its temporal and hierarchical context, showing particular elements that change over time and affect EV capabilities. Developed from the model in [1].
The technology enabling EVs, shown in the bottom row of Figure 1, has grown significantly in recent years. There are underlying technological advancements on different hierarchical levels that enable EV improvements such as increasing charging speeds. Future possibilities such as wireless charging, better batteries, and stronger and lighter materials will all influence the characteristics of EVs positively. If the share of sustainable sources in electricity generation continues to increase, the CO2 emissions of the transport sector (still a considerable contributor) are expected to decrease drastically [2,3].
In contrast to traditional charging methods, where EVs are always charged at the highest possible speed, smart charging uses various data streams to determine the optimal charging speeds for its intended goal. Whereas the goal of most present research in the field of smart charging is to balance the load on the national [4,5], regional, or local [6,7] electricity grids, this article focuses on utilizing a smart charging system to efficiently charge a company’s EV fleet, thus making a step to the top row of Figure 1.
At present, several companies are working on improving their carbon footprint and sustainability by installing renewable energy sources such as wind turbines and solar panels (Photo-Voltaic panels, PV), and by transitioning to use of electric vehicles. In such a company the need for on-site charging arises, leading to implementation of a charging station. The size, principle of operation, and design of such a station are hard to determine. At present, rules of thumb are mostly used. This paper presents a way of working to aid companies in sizing the charging solution before there is an EV fleet.
Such a charging station will have one or more EV charging hubs, also called Electric Vehicle Supply Equipment (EVSE). These will either send AC or DC to the connected EV. Although an AC EVSE is the cheaper option, energy has to be converted to DC for the battery by the EV’s internal charger, limiting charging speed to 3.3–43 kW. The higher the applicable power, the heavier and costlier the internal charger becomes. A DC EVSE has a dedicated AC/DC converter that allows for charging speeds of more than 50 kW, with certain EVSE reaching 350 kW [8]. The DC power is directly flowing to the battery, making any heavy and costly on-board charger equipment unnecessary.
The EVSE will generally (in the absence of smart charging) charge at the highest possible power () that the EVSE () can deliver and can be handled by the battery (); thus (), without taking external variables into consideration. The issue with this method of EV charging is the lack of adaptability by the charging system. The first EVs to arrive will be able to connect to an EVSE and share available power equally. They will then keep the charging point occupied until departure. Drivers who arrive late or need a lot of charge quickly are unlikely to make their next trip without recharging. Additionally, as we consider the presence of PV panels at the company, after noon, when PV energy production is at its highest, most connected EVs are already fully charged, and thus energy is exported to the grid. A function of smart charging is to have adaptive charging speeds instead [9,10,11]. There are several benefits made possible by this function, mostly related to cost savings and reduction of CO2 emissions:
- Peak shaving,
- Increasing PV self-consumption,
- Reducing grid energy cost,
- Reducing cases of insufficient State of Charge (SoC) for upcoming trips.
These goals, which will be elaborated later on, are used in this paper for (1) developing a model for simulating a company’s transition to smart charging and are kept in mind while (2) developing the in-company charging system. The overall contribution of this paper lies in the broad and integrated approach to analyze and synthesize in-company smart charging before EVs are used.
Paper Outline
We start in Section 2 by describing the scope of the project, the research questions, and the methodology used. Section 3 presents the state of the art in (smart) charging of EVs resulting in the goal of this research and performance parameters linked to this goal. The case provided by Royal Reesink is introduced in Section 4.
The required system performance, parameters affecting that performance, and strategies for adapting the charging speed and how to implement charging point management are discussed in Section 5. Section 6 presents the set-up, implementation, verification, validation, and operation of the Vehicle Charging Simulation (VeCS) model developed to achieve the research goals. This section forms the core of the paper. Using the model, we explore the design of an in-company charging system in Section 7. Here, the results of the simulations are used and explored.
2. Research Scope and Methodology
As mentioned, more EVs are able to receive a charge and (solar) energy can be spent more efficiently by managing charging speeds and charger availability. Analysing EV users’ needs and actions shows that the location and its demands are imperative to ensure an optimal number of charging points, maximum charging speed, and available power.
2.1. Research Goal and Questions
The main goal of this research—as opposed to most other research, whose subject is public charging facilities [4,5,6,7]—is to determine what a smart charging system has to offer either for companies with EV fleets, or companies considering the move to an EV fleet, and how a balanced charging system can be achieved. Supporting the main goal are secondary goals that are intended to give a clear picture of the situation, system solutions, and implementation effects. Answering the following research questions will shed light on these topics:
- What are the possibilities of in-company smart charging, and how should a system behave to achieve these?
- What gains are to be expected from implementing a smart charging system, and how do various variables and strategies affect these numbers?
- What are the required system functions and architecture to facilitate smart charging behaviour?
- What factors should be taken into account on system implementation, and how can these be optimized?
These questions cover the relevant aspects of researching, analysing, designing, and implementing a smart EV charging system. This way, system designers can gain insight in the (impact of) various aspects of such a system, including its architecture and operation. Furthermore, the information about system implementation and its performance variables and results can help companies decide on how to implement their own charging infrastructure. An important tool to answer these research questions is the model (see Section 6) we constructed for analysing the charging process during a day.
2.2. Methodology
With a literature search (Section 3) on current smart charging products, ideas and solutions are analysed. The results will act as a starting point for the development of new system behaviours and designs, taking into account current and future technologies.
A company provided a case study (see Section 4) so that the research has a real-life context and practical value. Various systems engineering tools and methods [12,13] were used to design and visualise the EV charging system design. This way, iterations are made until the system meets requirements and is capable of fulfilling its functions in an efficient manner.
The planned system’s operation plays an important part in its final performance. Two particular aspects are how to adapt the charging speed and how to manage the charging points. These two aspects, as well as system performance in general, are analysed in Section 5. The algorithms behind determining optimal charging speeds can become quite complex and need a method to design and evaluate their performance. For exploring possibilities and determining the requirements for the charging system, we developed the VeCS model (Section 6). It simulates daily scenarios of charging EVs under different conditions using configurable time periods to understand the functionality and effects of various system designs and parameters, as well as aid in decision making regarding the implementation of EV charging facilities.
3. State of the Art
3.1. EV Charging Standards
NEN-IEC defines four modes of charging [14]. Modes 1 and 2 are limited to slow charging from a standard outlet and are generally used for light EVs or home charging. Mode 3 is the current standard for EVSE at business locations. It uses dedicated connectors and is often compatible with three-phase AC. Mode 3 has safety functionalities and extended control possibilities, such as managing the charging speed in real-time (an important option for smart functionalities). In addition, some are compatible with vehicle-to-grid (V2G) functionality. Figure 2 shows how electricity travels from a regular charging point to the battery in mode 3. This method only allows for a maximum charge speed at 32 A of 22 kW, and at 63 A of 43 kW, both with 3-phase AC. However, as of writing, there are hardly any EVs on the market that can go above 11 kW. The rule of thumb is to install one Mode 3 dual-connection EVSE per four EV users.
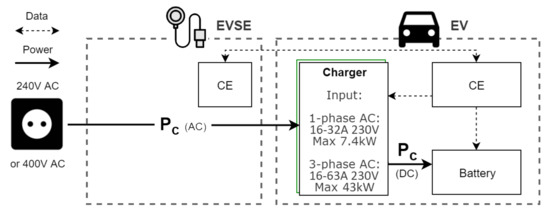
Figure 2.
EV charging with a Mode 3 charging point. Energy is converted to DC by the charger inside the EV, restricting charge speeds. Note that the Control Electronics (CE) of the EVSE and EV communicate for security checks only.
Mode 4 is defined for EVSE with integrated chargers, allowing for high charge speeds through DC. The charging scenario of a Mode 4 fast charger is shown in Figure 3. Current is converted to DC before being sent to the EV, which allows it to bypass the internal charger. Because there are less restrictions on cost, size, and weight for an AC/DC converter in a stationary charging point, significantly higher charging speeds are possible. For more in-depth information on, and comparisons of, connection and charging mode standards used worldwide, the reader is referred to [15]. Mode 4 EVSEs are often limited to publicly accessible areas due to their high purchasing costs (e.g., the Flexicharge DC fast charger at 22,950 € [16]). In comparison, Mode 3 EVSEs are priced at a seventh of that (e.g., the Flexicharge regular charge point at 3090 € [16]). In our in-company charging system, we limit ourselves to Mode 3 charging because of the investment cost and the fact that parking times at the company are generally long (see Figure 4), eliminating the need for (very) high charging speeds.
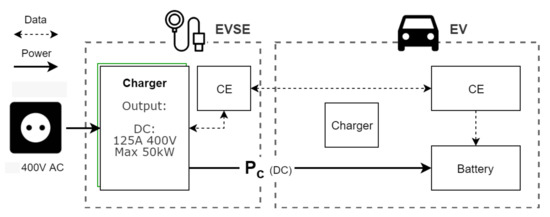
Figure 3.
EV charging with a Mode 4 charging point. Energy is converted to DC before being sent to the EV, allowing for high charge speeds. CEs of both the EVSE and EV still communicate for security checks.
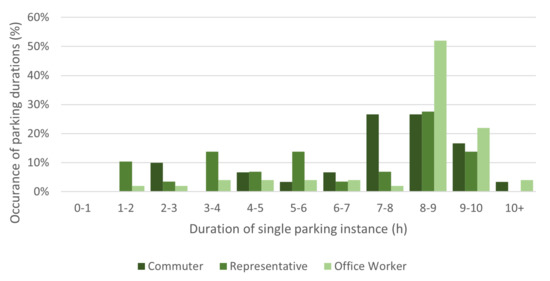
Figure 4.
Histogram of duration (hours) of single parking instance at a company location.
3.2. Smart Charging of EVs
Travelling in a metal box that weighs more than a ton requires a lot of energy. One of the EVs that Royal Reesink is considering is the Volkswagen ID.3. Even though it is a relatively small and efficient car, it still uses 16 kWh of energy for every 100 km driven [17]. At an average annual travel distance of 13,000 km per car in the Netherlands [18], every EV would need at least 2000 kWh per year to charge. For reference, this is two-thirds of the average electricity demand of a Dutch household [19]. The European Environment Agency [20] put forth a statement that read:
“Additional electricity generation will be required in the European Union to meet the extra energy demand arising from an 80% share of electric vehicles in 2050. The share of Europe’s total electricity consumption from electric vehicles will increase from approximately 0.03% in 2014 to around 4–5% by 2030 and 9.5% by 2050.”
It is therefore no surprise that a nation-wide switch to EVs puts a strain on the national electrical grid. The problem lies not only in the total energy demand but also in its distribution during a day. It is unlikely that the energy demand of EVs will be spread evenly across 24 h. Instead, it will spike at certain times, such as when most people arrive at work or when they recharge their EVs at home in the late afternoon and evening after returning from work. Daina et al. [21] add to this that the supply side of the power grid is becoming increasingly volatile due to renewable energy sources.
Current smart charging solutions intend to deal with these electrical grid problems by dispersing the power demand of EV charging [22]. This so-called load balancing operates by moving power use from high-demand to low-demand moments. Proposed methods include V2G capabilities [23,24,25] and charge scheduling or charging management [26,27], sometimes with load forecasting algorithms [28]. Ultimately, the goal is to ensure travel behaviour of the EV driver can be unaffected while congestion in the electrical infrastructure is avoided [6,29]. Smart charging can also contribute to using a larger share of renewable energy. For instance, Schuller and Hoeffer [30] observed an increased wind energy share in EV charging of at least 80% across all socio-demographic groups by using charge scheduling.
In addition to these solutions for the public electrical infrastructure, smart charging can be beneficial for companies aiming at reducing their CO2 footprint: in-company smart charging. In this context, charging management appears to be particularly popular [9,10,11], often making use of charging algorithms to set charging times and speeds. Based on the literature, we summarize the following advantages for in-company smart charging functionalities, mostly related to cost savings and reduction of CO2 emissions:
- Shaving off peak loads: Identical to load balancing but on a smaller scale, shaving off peak loads can prevent overcapacity fees and might avoid the necessity of investing in a heavier electrical grid connection.
- Increasing PV self-consumption: If Photo-Voltaic panels are installed, charging management can help make use of the generated energy by adjusting charging times and speeds. This has the potential to reduce solar energy export, which is generally not cost-efficient. van der Meer et al. [31] even attempt to use solar forecasting to increase self consumption of PV energy.
- Reducing grid energy cost: If energy prices fluctuate throughout the day, stalling EV charging and waiting for favourable prices can significantly reduce energy costs [32].
- Reducing insufficient SoC: Giving certain EVs a priority in charging according to their SoC and departure time can prevent drivers from having insufficient charge to make their next trip. This could prevent otherwise costly public charging and downtime, as well as prevent potential frustrations and accessibility issues.
3.3. Current Solutions
Galus et al. [26] present a review of the integration of EVs in smart charging systems. They discussed which opportunities and challenges would arise and how these systems should operate. They concluded that the largest hurdles would be the battery technology and communications standards. Research has moved on since then. Recent developments include, for instance, [33], who present an optimized charging-discharging set-up for EV fleets. They focus on grid balancing for local distribution companies in the presence of EV fleets, including V2G and battery degradation. Yet, the user perspective and connection management are not considered. Buresh et al. [22] explore the nation-wide impact of implementing local PV-charging systems. Their simulation approach provides insight into overall cost trends. Design space exploration for a specific organization’s EV fleet implementation is not treated. Bhatti et al. [34] focus on determining an optimal PV system. To this end, they employ optimization techniques, in particular particle swarm optimization, incorporating various parameters such as demand, panel purchase price, and grid tariff in the objective function. Travel patterns and user behaviour are not taken into account on an individual basis, but at macro level.
Alkan et al. [35] investigated how PV systems can help balance loads in the case of an EV fleet, albeit in a rather coarse manner. An interesting analysis of city-wide energy demand and PV generation is found in [36]. Taking mainly public transport in a city in eastern India as a case, a fuzzy algorithm is developed. The difference with our situation is that we look at a company intending to shift to an EV fleet. The interaction between the energy consumption of a building and the EVs charged at the premisses is subject of [37]. V2G plays an important role, but PV energy generation is not taken into account. The use case of individual EVs is not considered.
A numerical optimization of charging patterns based on a household travel survey is performed by [38]. A typical point of attention is dealing with electricity price fluctuation throughout the days. There is less attention for the user orientation. Ref [39] optimize State of Charge by predicting the vehicle departure time based on long-term historical data.
As a last reference, [40] is quite similar to our work. It is a balanced approach taking into account a wide range of factors to do, among others, a design space exploration of the required number of chargers. Since then, additional charging and connection management approaches can be found, which we include (see Section 5.1 and Section 5.2) so that the user perspective is weighted more into the solution.
In recent years, commercially significant changes have occured as well. Battery technology in EVs has made tremendous progress (e.g., 130 km range of a 2015 Nissan Leaf versus 355 km range of its 2019 successor [17] and efforts on open communication protocols such as the Open Charge Point Protocol (OCPP, see [41]) have increased. There are already a few EV charging products with smart functionalities available. Many of these use apps to give the user a form of control and share charging information, such as Vandebron (https://vandebron.nl/elektrisch-rijden/slim-laden, accessed on 12 August 2020) and Jedlix (https://www.jedlix.com/, accessed on 12 August 2020). They aim to balance the load of the power grid and use a larger share of sustainable energy, with the ability to save on charging costs as an incentive. The user can enter the expected departure time to make sure the EV is fully charged in time.
ElaadNL is working together with their partners on a project that goes a step further. They incorporate dedicated PV panels and a backup battery system to charge EVs efficiently [42]. Charging will happen either when there is sufficient solar energy available or when the EV requests more power. Departure time and the EVs’ SoC are communicated with the system to set charging speeds. State of Charge is tracked by the vehicle’s battery management system (BMS) but not necessarily communicated to entities outside the vehicle. While knowledge of a vehicle’s SoC is essential for optimizing a smart charging system, additional techniques for SoC estimation and charging optimization presented in [32,43,44,45] may be implemented.
Another smart charging system is offered by EVBox. It is similar to the other products in many aspects; charging management is used for load balancing and avoiding overcapacity fees, monitored by a backoffice that is able to set charging speeds and that checks data and costs. Where it differs, however, is in the system architecture. EVBox has their own line of EVSEs, which can act as so-called hubs and satellites. The satellite charge points connect directly to the hub, which in turn communicates with the back-office. The hub relays information to and from the other EVSE and is the only part of the local system that has to deal with external communications. This reduces failure points and infrastructure requirements, although it might leave the system vulnerable to complete malfunctioning if any of its subsystems do fail.
All of these systems have a particular aspect in common, which is their central control. A single Energy Management System (EMS) collects information and dictates charging speed for all charging stations and EVSE within its system. Most product descriptions call this EMS the back-office, as it is a (remote) server handling all data and communications. However, this is not the only option to enable smart charging functionalities. Galus et al. [26] entertain the possibility of a decentralized control architecture, where each EV acts as its own EMS, individually receiving the required data and including its own travel behaviour to decide on its charging schedule. They state that this architecture allows every vehicle owner to maintain their authority of control instead of handing it over to a central EMS, possibly also reducing communication requirements and mitigating privacy concerns.
In the literature presented above, the goal is to optimize charging (based on among others the vehicle’s State of Charge), while the smart charging system is in operation. Our approach precedes that situation. We want to aid in designing the smart charging system layout when there are no (or only a few) EVs in the company’s fleet. The mentioned SoC estimation algorithms [43,44], and smart charging optimization algorithms [45] are relevant while the system is in operation.
There are many more architectural possibilities for smart charging systems, such as half central or local central. While we looked at these for implementing the smart charging system in our case [46], the discussion falls outside the scope of this paper, which is the use of modelling to balance the design and usage for an in-company smart charging system.
4. Case Introduction
The case used in this research is provided by Royal Reesink (https://www.royalreesink.com, accessed on 12 August 2020). The company acts as a distributor and service provider for equipment and components for agriculture, landscape maintenance, logistic warehousing, and the construction equipment industry. The company not only provides equipment but also takes care of service and maintenance across the life-cycle. Royal Reesink has Dutch origins and has multiple locations in the Netherlands, as well as in European countries (Belgium, Denmark, Germany, Ireland, the United Kingdom), and the rest of the world (Canada, Kazakhstan, South Africa and Turkey).
Royal Reesink has the vision to transition their entire lease fleet of passenger cars, over 300 in the Netherlands alone, to EVs. The desire is to make the switch smooth, ensuring all employees are satisfied. This requires careful planning of both the type of cars and the charging facility. The latter is also heavily influenced by the increasing Photo-Voltaic (PV) capacity of company locations of Royal Reesink. The desire is to optimise use of self-generated PV-energy, so that export of PV power is minimised.
Requirements are set up by consulting with the mobility and facility managers of Royal Reesink. Developing advice for the implementation of charging infrastructure at this particular company with multiple locations will also result in implementation guidelines for other companies. Furthermore, travel behaviour and energy data from Royal Reesink are used in the development of a smart EV charging simulation model VeCS, which is intended to be usable for other companies as well, to determine the size and capacity of their charging facilities.
To make an inventory of the employees’ travel behaviour and needs, we set up and evaluated a questionnaire, that was sent to all employees of one of the company’s locations. Questions addressed driving style and the home situation for a home-charger. Furthermore, part of the questionnaire was the request to track all business-related travelling during one week. There were 35 respondents who collectively gave 165 days of valid travel data. An alternative to gather travel behaviour (and thus energy requirements) would be to fit GPS trackers to the (lease) vehicles (similar to [47]). While that would easily generate very accurate and useful data, privacy concerns made us decide to not use these.
With information from the company, there were three identified categories of employees with rather different travel behaviours: commuters (work normally at multiple company locations during the day, and frequently travel between company locations), representatives (primarily visit clients), and office workers (generally work at only one company location).
Figure 4 shows one of the results of the questionnaire: the parking duration. It is clear that for all types of employees, longer parking times dominate. Office workers clearly work during the entire day at one location, but even representatives spend a significant amount of time at one company location.
Taking the questionnaire results, we also determined the chance of a car being parked at a company location. Figure 5 shows the histogram for 15 min intervals. This figure shows the summed results for all categories of employees. The histograms for the separate categories [46] show similar patterns, with the chance of a representative’s vehicle being parked being lower than an office worker’s one. This information is later used in the model discussed in Section 6.
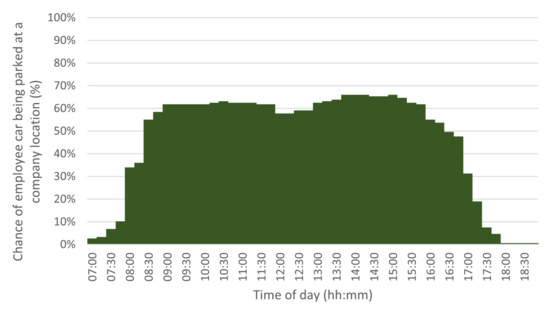
Figure 5.
Chance of a car being parked at a company location at a certain time of day, for all employee categories.
5. System Performance
There are particular advantages to electric transport that an effective charging system can exploit. Building upon the advantages found in Section 3.2 and discussions with Royal Reesink, we built the logical influence diagram in Figure 6. This diagram shows relations between inputs and how they affect performance measures. Using this diagram, we identified three main performance aspects that can be used as key drivers [48,49] during the design and implementation phase:
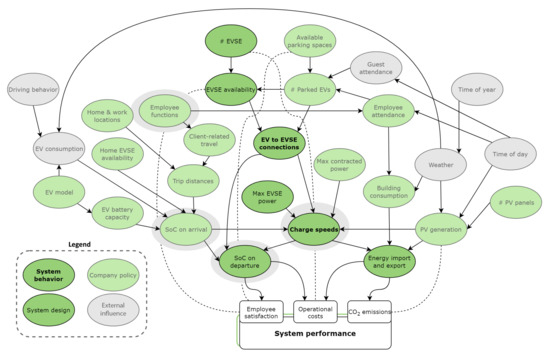
Figure 6.
Logical Influence Diagram showing inputs and their relations. Solid lines represent main influences, dotted lines stand for additional influences.
- Operational costs: Leading to making efficient use of available (solar) energy and maximizing the number of EVs leaving with sufficient charge to reduce employee downtime and (significantly) higher costs of public charging.
- CO2 emissions: Aim is to minimise inefficiencies and prioritise solar energy generated at the company locations.
- Employee satisfaction: Streamline user interaction and reduce range anxiety due to inadequate charging performance.
Figure 6 shows that the performance parameters are influenced by a broad set of variables. Many of these are outside the system’s control, or even outside that of the company. The focus should be on the variables that the system can affect, even indirectly. Two of these depend on the system’s behaviour; charging speeds and EV to EVSE connections. Algorithms for adaptive charging speeds and charging point management determine how the system behaves regarding these aspects.
5.1. Adaptive Charging Speeds
As mentioned above, in traditional charging systems, available power is spread evenly among all charging EVs. No priority is given to certain EVs. There are alternatives to this charging behaviour, such as strategies called first come first serve and earliest deadline first [9]. Additional methods of adapting charging power to particular scenarios are also developed. Some require more data to function and will generally yield better performance. The following charging strategies are integrated into the VeCS model:
- First come first serve (FCFS): Priority is given to the earliest arriving EVs.
- Equal charging (EC): All connected EVs charge with equal power.
- Perfect fit (PF): Power required to reach full charge on departure is calculated for every individual EV (Equation (1)).where:
- –
- = required power to reach full charge on departure (kW)
- –
- = energy on full charge (kWh),
- –
- = current battery charge (kWh), representing the SoC
- –
- = time to departure (h).
- Solar forecasting (SF): PV energy production is predicted and taken into account to optimise use of PV energy without compromising EV SoC on departure.
- Historical charging (HC): Park and charge behaviour is predicted based on historical data and used to prepare for spikes in energy demand.
An additional strategy is called “Full-smart” (FS). It combines the previous three strategies to optimise charging speeds. Full smart could also include vehicle-to-vehicle (V2V) functionality, where EV batteries are used as intermediate energy storage. We did not implement this strategy, though.
5.2. Charging Point Management
When there are fewer charging points than EVs at the company location, not every EV will be able to charge at any given moment. By managing the parking behaviour of EVs, charging connections can be used more efficiently, for example, by requesting EVs with a full charge to disconnect and park somewhere else, or even giving priority to those with (very) low charge. Two main forms of charging point management are considered: manual and automatic transfers. In the former, the system relies on people to physically disconnect and reposition their EVs. This does not exclude the system from making decisions about when and which EVs to connect or disconnect. The latter is set in a future scenario, where the system will take care of charging point management all by itself. We identified the following options for charging point management:
- No Transfers: vehicles park at a certain spot on arrival and are only moved when a trip is carried out.
- Single Midday Transfer: at noon all vehicles that are fully charged vacate the charging spots so that vehicles that (still) need to be charged can use those spots.
- Transfer on Full Charge: when an EV is fully charged, its user is informed and asked to move the vehicle to vacate the charging spot. Users of vehicles with lowest SoC are asked to use the freed charger.
- On Full, Prioritize : Same as transfer on full charge, but now EVs where the current battery charge () is less than required for the next trip () are asked to use the charger.
- Instant Transfers: As soon (i.e., with a very short delay) as a vehicle is sufficiently or fully charged, the charger is used for a next EV. Note that this requires either some form of autonomous driving functionality in the EVs and power transfer either through automatic connections or wireless solutions or the use of EVSE with multiple switchable physical connections.
6. VeCS Model
It is difficult to quantify the influence of different system design choices and scenarios and understand the reason behind it. Often these issues are dealt with in a coarse manner. Furthermore, in our case, Royal Reesink made initial calculations for the number of EVSEs based on annual travelled kilometres, static cost and CO2 numbers, and a rule-of-thumb ratio per location of 4 EVs per 1 Dual-connection EVSE.
Modelling and simulation can aid in dealing with these aspects. In order to obtain a more accurate and better balanced system design, the goal for the current modelling effort is twofold. Firstly, it is meant as a tool to understand the functionality and effects of various EV charging system designs. It gives insight into how certain charging strategies function in real-world scenarios, which system aspects have the greatest effect, and how they influence the energy patterns of the facility location. Secondly, the model is intended to aid in decision making regarding the implementation of EV charging facilities. By feeding the model with the required parameters and running various set-ups, the user is able to see what works best for the situation. Based on the results he/she can make decisions for different aspects such as the number of EVSE, the charging speed and possible smart functionalities.
The Vehicle Charging Simulation, or VeCS, model was developed to take on this complex task by simulating parking, energy and charging patterns during individual days up to an entire year. Basing system design choices on a simulation model has the following advantages:
- The effects of all parameters and the interactions between them can be measured.
- Parameters are easily modified, allowing for design space exploration for many possible system designs and scenarios, before any system is implemented.
- Using data obtained from sources like the survey, interviews, and company-specific data, a better foundation is created for a system design.
- Simulation results are easily replicated. Small changes can be made to compare performances.
Input travel data for the model were obtained from Royal Reesink’s employees via the questionnaire (Section 4). The data were used to generate realistic parking behaviour at company locations, and in this way, information on EV energy use and thus required SoC is obtained. Furthermore, real-life (solar) energy patterns are acquired from smart meters and are incorporated into the model.
6.1. Model Operation
The model takes the data of several input sources and runs a simulation of a single day; see Figure 7. It decides on the system behaviour according to the chosen settings and then calculates and tracks how the input values and other variables change every 15 min. If the user wishes to simulate an entire year, the daily simulation is repeated for every working day. The model’s steps of operation are shown in Figure 8. Results after a simulation include energy patterns, SoC data, charging costs, CO2 emissions, and more, as shown in Figure 9 and Figure 10.
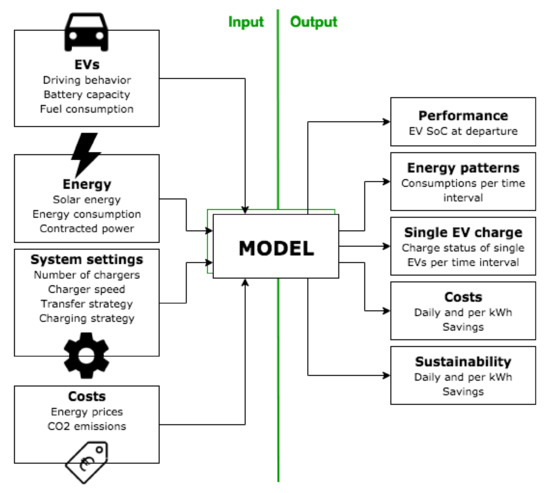
Figure 7.
VeCS model inputs and outputs.
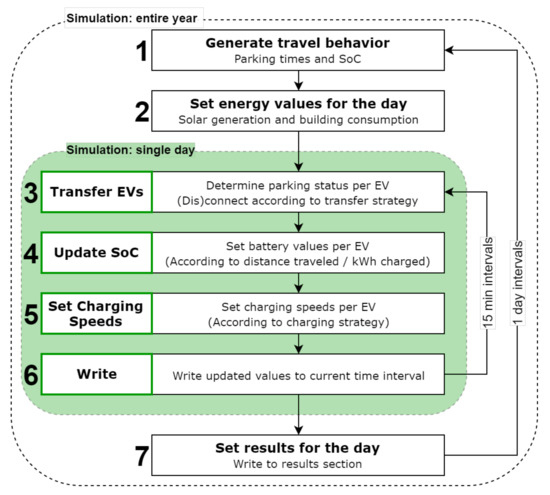
Figure 8.
Simulation steps for an entire year or a single day with 15 min intervals.
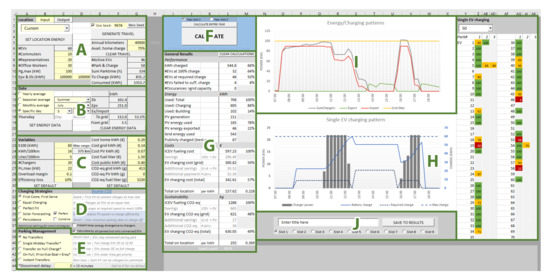
Figure 9.
User Interface of the Vehicle Charging Simulation model (VeCS) within Microsoft Excel. The parts are as follows: (A) General input including company location size and travel parameters. Note the button to generate travel data. Furthermore, note the seed for reproducible random data generation. (B) Date/period selection. (C) Variables on energy consumption and price. (D) Charging strategy selection (see Section 5.1). (E) Parking/connection management strategy selection (see Section 5.2). (F) The button to start the simulations. (G) Results in numbers. (H) Left, graph with single-day charge behaviour for a single (selected) EV, and right, overview with single day results for all simulated EVs: green, fully charged; yellow, partially charged but sufficient for the next trip; red, insufficient charge. (I) Overall power use. (J) Save results.
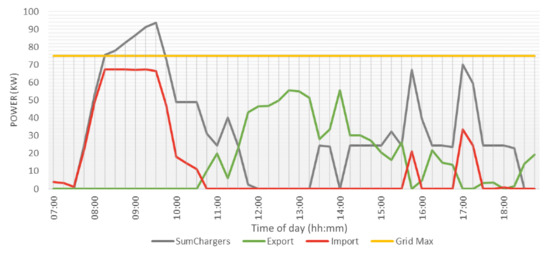
Figure 10.
Energy patterns during a summer day. Shows the total charging power (grey) and power export/import (green/red).
The model was programmed with VBA inside Microsoft Office Excel. In this way, once the model was finalized, the model operator only interacted with an Excel sheet to ensure accessibility and ease of use. Figure 9 shows the model user interface and its explanation. The model and a user manual can be obtained from the authors upon request.
While the model generates random numbers in various segments, these are governed by a seed number. This ensures that exactly the same simulation can be run by using the same seed number. Runs with different seed numbers result in diverse outcomes to explore variations.
Zooming into the segments of the model as numbered in Figure 8, the model operates as follows:
- Generate travel behaviour (A in Figure 9): Instead of using static parking times for each simulation, the VeCS model generates randomized parking data based on the histograms of parking times that were obtained in the above-mentioned questionnaire (Section 4). Employees are differentiated between commuter, representative and office workers, as their travel behaviour is rather different. The model runs a macro using a uniform distribution for every employee to determine the arrival and departure times. SoC is generated randomly (uniformly) since there is no way to know the SoC: we are dealing with planning the smart charging facility and there are no EVs yet. We make use of the knowledge from the survey whether the employees have a driveway that could be equipped with a home-EVSE.
- Set energy values (B in Figure 9): for the selected company location, energy values for consumption and PV generation are integrated in the model. The available data span an entire year in 15 min intervals. The correct values according to the chosen date, month or season can simply be imported from this list before running the main simulation. If the user enters a custom value for energy consumption or PV generation, all energy values are multiplied by a scaling factor.Steps 3 to 6 are performed for every 15 min interval of a working day that runs from 7:00 till 19:00, so a total of 48 intervals per day.
- Transfer EVs: Every 15 min interval begins with this step. It determines which EVs are parked at a company location at the current time. If there are not enough EVSEs available for all parked EVs to connect to, the model decides which EVs disconnect or remain connected. The behaviour is determined by the connection management method set by the user in the model. Options are listed in Section 5.2 and selected in part E in Figure 9.
- Update SoC: As more EVs come in and depart and others receive energy for their batteries, the SoC values are updated accordingly.
- Set charging speeds: Calculating the charging speeds for each individual EV is one of the main aspects of the model. It dictates how much energy is used at what time, how many EVs will have enough energy to make it to their next destination, and what costs and CO2 emissions are generated as an effect. The values chosen by the model will differ depending on what charging strategy is used in the simulation (D in Figure 9). Five of these strategies are available in the model, of which three can be considered smart. The options are listed in Section 5.1.
- Write: When 15 min have been simulated all new values are written to a results sheet. These results can be summed or averaged at the end to show simulation statistics. They are also used to generate graphs of important variables throughout the day. After this step, the model loops back to Segment 3 until all 48 time intervals have been simulated.
- Set results for the day: When the simulation is done, the results can be calculated and presented to the user (G, H, and I in Figure 9). Several aspects of the system’s performance are included. The SoC of each EV and whether it met the required charge are shown, as are the energy consumption, generation, and export. Additionally, indications of economic and environmental costs and savings are given. Several graphs complement these data for easy interpretation by the user.
If an entire year is to be simulated, the model will begin at Segment 1 again. Travel behaviour and energy data are changed, a daily simulation rerun, and results calculated. This is done for every weekday in a year, after which the combined total of the daily results is given in table and graph form to the user. This function can give a better indication of a system’s long-term performance and costs and how it is influenced by various design decisions.
6.2. Model Restrictions
During the development of the VeCS model there was a constant pressure to add functionality. However, due to time restrictions and to prevent overcomplexity, some functions were omitted. The following aspects may benefit the accuracy and/or usefulness of the model if they are to be added:
- Additional smart charging strategies;
- Integration of V2G and V2V capabilities;
- EV model-specific charging profiles that take the model-specific relation between SoC and charging power into account;
- Improved solar forecasting methods;
- Dynamic energy consumption depending on driving behaviour and time of year.
6.3. Model Accuracy
A true-to-reality operational model like the VeCS model should be programmed in such a way that it gives results close to the true value and does so consistently. Several validation and verification methods suggested by literature [50] are used to check the VeCS model: data validation, conceptual model validation, computerized model verification, and operational validation.
6.3.1. Data Validation
Data validation [50] concerns ensuring the data used in the model are adequate and correct. For the VeCS model, the two main types of input are energy data and travel data. As discussed, the energy data are obtained from smart meters where available and supplemented with monthly or annual readings. Given these sources, the data can be considered accurate and valid. The travel data are obtained using the aforementioned survey to employees. The resulting data set has been checked for soundness, and the overall patterns found were logical. Two outliers that represented long day-trips by employees were removed from the dataset, as these rare situations can be better handled by external (fast) charging solutions. The travel data can be improved by installing GPS trackers in employees’ vehicles; see Section 4. Other data (C in Figure 9) were based on the market conditions at time of writing.
6.3.2. Conceptual Model Validation
Conceptual model validation [50] relates to the validity of the underlying theories and assumptions of the model. To this end, we have modelled not only the charging of the EVs but also the use (and hence discharging) of the vehicles, with appropriate timings. These are modelled in 15 min intervals, which constitutes an approximation. Other approximations involve omitting variations in charging speed in case different EV models are employed, ignoring visitors’ EVs and employees leaving at a different time than was expected. The efficiency of charging (so from EVSE to battery) is taken into account as 90%, but the rest of the system is assumed to be 100% efficient.
In the operational validation (Section 6.3.4), we will take a look at the impact of some of these approximations.
6.3.3. Computerized Model Verification
Due to the computerized nature of the VeCS model, errors and inconsistencies may occur, caused by programming errors or incorrect modelling solutions. To check for this type of error, a control experiment was set up. We defined reference settings, and for all runs we conducted, the outcomes matched. Note that the travel behaviour is in principle randomly generated. By using a seed value, the exact same set of travel data can be reused, however.
In addition to using reference settings, the model behaviour is explored with extreme settings. By defining deviations from the reference settings, stating the expected behaviour, and checking the model outcomes, we can check whether the model represents real life accurately.
A few example extreme cases are:
- Decreasing the number of EVs from 60 to 20 and increasing the percentage of home EVSE from 75% to 100% (Experiment 1). Result: number of parked EVs drops, energy demand drops, and not all 20 charging connections are used.
- Increasing the EV energy consumption from 15 kWh/100 km to 20 kWh/100 km and simultaneously reducing the ICEV fuel consumption from 5 L/100 km to 4 L/100 km (Experiment 2). Result: More charging of EVs is needed, and the cost savings are drastically reduced (from 60% to 33%).
- Reduce (usable) battery charge for the EVs from 60 kWh to 40 kWh (Experiment 3). Result: The number of EVs leaving with sufficient charge for the next trip is reduced, resulting in more off-site charging: 94 kWh, instead of 33 kWh.
These three extreme cases are a selection of in total 14 extreme cases conducted. Appendix A lists the reference settings and all cases with results. In all cases, the model behaved in a logical manner.
6.3.4. Operational Validation
The final check is operational validation [50] to check the model’s output is sufficiently accurate for the task at hand. To do so, we have conducted a sensitivity analysis for four important approximations:
- EVs charge at the designated power,
- The charging system outside the EVSE–battery connection is 100% efficient,
- No visitors with EVs use the charging system, and
- Employees always leave at the expected time.
To do so, an initial scenario was used in which the in-company charging system can barely ensure properly charged EVs. Next, for each approximation, one parameter has been changed.
For the EV charge speed, two simulations are compared. The initial scenario with a charging power () of 22 kW and the test scenario with 14.5 kW. The result is a 15.5% decrease in charged energy for the perfect fit strategy. Changing the system efficiency (in addition to the modelled EVSE-battery losses of 10%) from 100% to 82% results in a reduction of 5.2% in charged energy. Furthermore, the number of insufficient charges increases by 17%.
The simulated charging performance (i.e., how well the system is able to sufficiently charge EVs) is found from the complete sensitivity analysis to deviate no more than −23% and +28% over all cases. Costs and emissions will deviate no more than −10% and +10%. This is determined to be sufficient for initial system design and implementation choices. This is based on deviations working in the same direction. In reality, that situation is very unlikely so that the mentioned percentages are worst-case values.
With the model in place and tested, it can be used to simulate system designs for the case company.
7. System Design
Various people and parties are affected by the design of an EV charging system, all with their own specific interests. They are stakeholders to the system and would like their opinions and wishes to be taken into account during its development. The following four stakeholders are particularly involved with the system and have their own wishes:
- Employees: Maximum functionality with minimal user effort.
- Mobility manager: Maximise full or at least sufficiently charged EVs.
- Facility manager: Minimal CO2 emissions and PV energy export.
- Financial provider: Minimal initial and operation costs and employee downtime.
In the research, we worked out the general picture of the nine-window diagram in Figure 1 into a specific Royal Reesink one, shown in Figure 11. Here, SUD stands for System Under Design, the scope of our development effort. In the following subsections the short-term and future designs are elaborated.
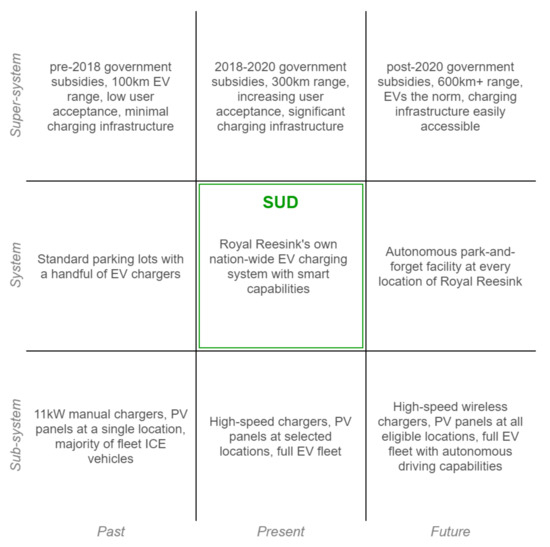
Figure 11.
Nine-windows diagram placing the system in its temporal and hierarchical context, showing particular elements that affect the system and how they change over time. Developed from the model in [1].
7.1. Short-Term System Design
Currently available EV charging technology and products are lacking smart functionality. Products such as EVBox are able to share charging data and costs and allow for load balancing to avoid overcapacity fees but do not have any additional smart functionality. However, it is still useful to design a short-term system to know what companies are able to implement at this time. Comparing such a system’s performance with that of the future vision of an EV charging system in Section 7.2 will give an idea of what subsystems should be integrated and which future compatibility is important.
Implementing an EV charging system in the short-term will restrict charging strategies to a First-come, First-serve (FCFS) or Equal charging (EC) due to a lack of available SoC and departure data; see Table 1. The data used and their sources are shown in Figure 12. The only significant smart functionality available is overcharge protection and data logging, which are achieved by making use of smart meter data and a—potentially—external back-office, respectively. The way the functions of the system are allocated to the system’s parts is shown in Figure 13. This architecture description is used for further development.

Table 1.
Overview of the main characteristics of the short-term and future in-company smart charging systems.
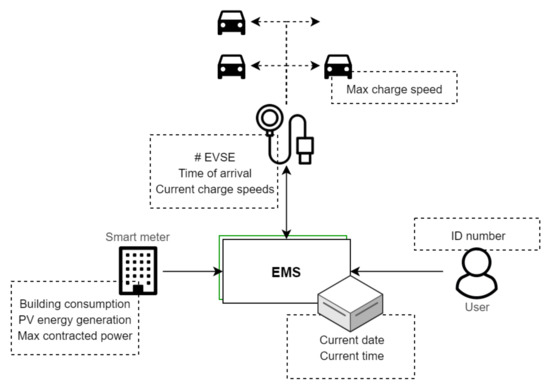
Figure 12.
Data and their sources used in the short-term system design.
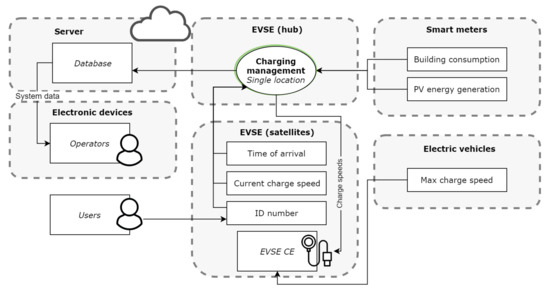
Figure 13.
Function allocation to different parts of the short-term system. The back-office manages the database and runs on a server. The hub EVSE manages charging speeds for itself and all its satellite EVSE. Note that some of the static data in Figure 12 such as the contracted power and number of charging points are omitted. These do not change and can simply be set once when the system is installed.
The connection management in the short-term system will be implemented by placing the EVSE so that multiple parking spots can be serviced. The EVSE will unlock the cable on full so that another vehicle can be plugged in. This way vehicles do not have to be moved during the day.
7.2. Future Vision of System Design
This section discusses a system design estimated to be possible with components and services available on the market within ten years. It will give an idea of the direction smart charging could go and will allow for simulations to calculate system performance.
Whereas the short-term system is limited to two methods of adaptive charging speeds, all strategies described in Section 5.1 are available for the future system except for V2V/V2G; see Table 1. This allows EVs that require a lot of energy in a short time to leave with sufficient SoC and reduces the export of solar energy. Drivers receive a request notification when the system wants them to disconnect their EV or when a charging point has become available that they can connect their EV to. Users and operators are also able to check SoC and charging data, and operators can change settings. Of course these smart functionalities do require a more complex system architecture. A local energy management system (EMS) is the centre of operation, receiving and sending all data and calculating optimal charging speeds and EVSE connections. In addition, wireless data connections to EVs are required to communicate SoC data when there are no EVSE available. A user interface is present to enable drivers to enter departure time and location. This information is needed for smart charging strategies to set each EVs minimum required SoC on departure. Although the architecture is complex relative to the short-term system, there is not much additional hardware required. The most significant difference is the increase in interfaces between subsystems and the number of functions to fulfil. The future system is summarized in the Figure 14 and Figure 15.
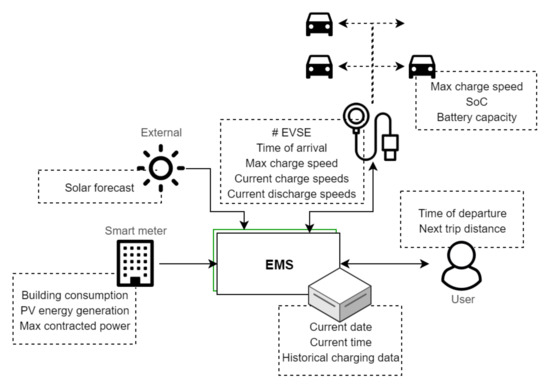
Figure 14.
Data and their sources used in the future system design.
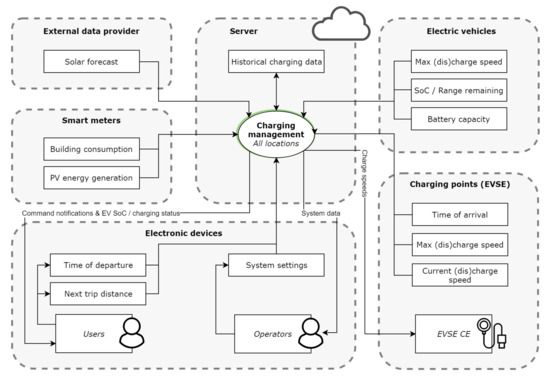
Figure 15.
Function allocation to different parts of the future system. The back office manages the database and runs on a server.
7.3. Simulation Results
The strategies in Section 5.1 were simulated individually for a test case consisting of 30 EVs and a PV installation delivering 40 MWh per year. The results are displayed in Table 2. It is clear from the results in Table 2 that implementing a smart strategy improves the system performance drastically. Both the number of insufficient charges and the exported energy are significantly reduced. Even the rather simple smart strategy of Perfect Fit (PF) results in a strong reduction in incomplete charges, and an improvement in usage of PV energy, shown by the reduced PV export. The other smart strategies perform similarly.
Table 2.
Simulation results for the smart charging strategies for 30 employees. Shown are the results of implementing the respective strategy only. Exported energy reduction is calculated relative to no-EV case, where 40 MWh is exported to the grid.
An implementation of the EV charging system will be discussed for the Royal Reesink BV location in Apeldoorn. The results of these simulations can be found in Table 3. Analyzing the simulation results in detail for this location will help understand how to best carry out the implementation. From the simulation results, four dual-connection EVSEs were found to be the minimum while still keeping the 28 employees with lease cars from having to rely on public charging too often. These EVSE can charge up to sixteen EVs without the need for any of them to relocate by simply reconnecting the cables only.
Table 3.
Results of simulating one year of business travel for the Apeldoorn location using four dual-connection EVSEs.
With the same number of EVSEs, the future version of the system with smart charging capabilities does perform better. This is mostly noticeable in the number of EVs leaving with insufficient charge: 10 instead of 53. The total energy charged during a year also improved from 94 to 101 MWh. The future system makes more efficient use of the limited number of EVSE. As such, integrating smart functionality in the short-term system at a later stage could be a good alternative to installing more EVSE.
Cost-saving differences were marginal due to the present lack of solar panels on this particular building. Savings made are partly due to the lower energy cost for the future system when more solar energy can be generated. In the short term system, costs are estimated higher because more employees will have to charge at home (at a higher rate). For the same reason, emissions did not change between systems. In future developments, the intention to install PV panels on this location should be taken into account, and VeCS allows for that.
The employees working in Apeldoorn are either commuters or office workers. Because on average they travel less than representatives, the EV energy consumption will also be lower. Furthermore, these employees are more likely to spend a long time parked on location, giving EVSEs more time to charge batteries to full. Generating a day of parking behaviour (seed 2306) shows what can be expected (Figure 16). Most employees arrive before 9:00 and leave after 15:00 without having left in between these times. Only a few employees seem to have been commuting between company locations, represented by their shorter parking durations.
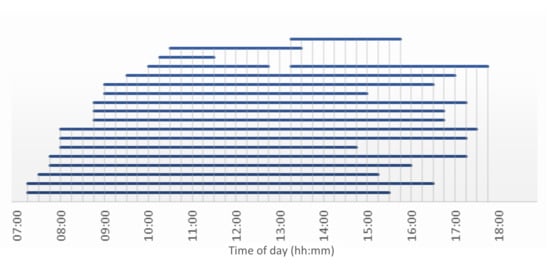
Figure 16.
Parking times of a day at Royal Reesink BV in Apeldoorn. Each blue bar represents an employee who has parked their car.
Running an EV charging simulation with this parking behaviour results in the charging patterns of Figure 17. Due to the reconnection functionality, a nice consistent line with only a slight spike at the early morning can be seen. As this location has a high limit on power demand, every EV was able to charge at full speed.
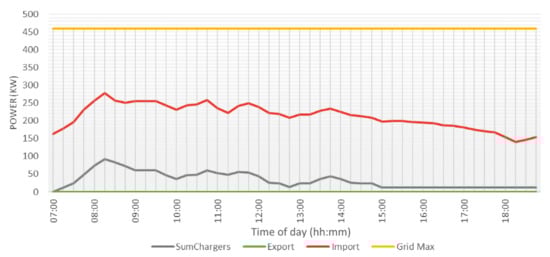
Figure 17.
Charging patterns of one day of charging at Royal Reesink BV in Apeldoorn. Shown are the import from (red) and export to (green) the grid, as well as the contracted maximum (yellow) and power demand of all EVSE combined (grey).
8. Discussion and Limitations
Switching to EVs requires a major investment from a company and necessitates employees to adapt the manner by which they commute. However, both parties also have plenty to gain, especially when a charging infrastructure with smart charging functionalities is properly implemented. The research questions in Section 2.1 are answered below to summarise the findings in an organised manner.
Current research mostly focusses on grid balancing in the case of increasing numbers of EVs. This can be the national, regional, or local grid. While some research looks at balancing in case of EV fleets for public transport, balancing in the scope of a company is not reported, to our knowledge. In-company smart charging can offer an advantage to three particular aspects, described as performance parameters in Section 5: reducing operational costs (by 40–41 k€), reducing CO2 emissions (by 73 tonne CO2-eq.), and increasing employee satisfaction. The first two are clearly achieved, as can be seen in Table 3. Furthermore, we made an initial estimate of investment costs required. These amount to 58 k€ for the Apeldoorn location. (This consists of 37 k€ for home EVSE, 13 k€ for EVSE at the company location, and 8 k€ for wiring. All of these include installation costs. Additional installation of PV panels is left outside this calculation.) Therefore, the break-even point is reached within little over one year.
Employee satisfaction cannot be determined at this point in time, as the system is not yet implemented. While we have taken the employee needs and wishes into account throughout the process, it is crucial to monitor employee satisfaction during system implementation. System design and implementation choices, but also company policies regarding EV use, have an influence on these. Employee satisfaction was a key goal in the system to be designed. This sets our approach apart from the literature cited in Section 3. By implementing one of the smart charging strategies, almost all charging session are successfully completed (Table 3). A mere 0.8% of charging sessions are insufficient for the short term system. For the future system, this is reduced further to 0.1%. Both numbers are so low that it can be expected the resulting employee satisfaction is not negatively affected. Regarding system behaviour, the manner by which adaptive charging speeds and connection management are handled determines how well the system performs.
Switching to an EV fleet will reduce fuel costs and CO2 emissions (Table 3). Choosing a smart EV charging system over a traditional one will increase gains even more. The exact values depend on several variables, such as the number of EVs and EVSE, solar energy availability, and employee travel behaviour. In the case study, fuel costs are reduced by 65% and CO2 emissions by at least 55% compared to when ICEVs are used. Smart functionalities add insignificant performance regarding costs and emissions unless there is an abundance of solar energy production. They do reduce the number of occurrences of insufficient SoC on departure (from 44 down to 7 per 30 employees). Furthermore, it allows similar system performance with significantly lower EVSE (EV:dual connection EVSE ratio of 7:1 instead of 4:1). Implementation of PV is also easily evaluated with the model. Table 2 shows that with an in-company smart charging system, self-use of PV energy is improved significantly (export reduced by up to 79%). If the potential of another company’s switch to EVs needs to be calculated, parameters in the VeCS model can be changed to correspond to their situation.
The most significant requirement to facilitate smart charging behaviour is an array of data management functions. With the additional data such as SoC, energy patterns, solar forecasts and departure times, the system is able to optimize performance according to the intended goals. Inherent to additional data management is an increase in data interfaces. A central EMS gathers and processes the data, makes decisions, and controls the actions of each subsystem. Most of these requirements are not yet available on the market today. If a company wishes to implement an EV charging system, it is important that they choose EVSE compatible with adaptive charging speeds, as the additional data management aspects can be integrated at a later time.
While some sources are inherently uncertain (solar input, exact arrival, and departure times), by gathering data over longer periods of time, useful predictions can be made so that the effects of these uncertainties are limited.
Replacing an entire lease fleet with EVs has a significant impact on the travelling experience of employees. Although the EV charging system itself should be user-friendly in its operation, it is the company’s policies on EV use that might very well have the largest influence on employee satisfaction. In this, one can think of providing employees with home-charging equipment or not, and how to implement transfer of the vehicles on charge completion. Another important aspect is the number of EVSEs that are installed. The optimal number will vary depending on smart functionalities, maximum charging speeds, and employee travel behaviour, and how much these aspects vary over the short and long term. For the case at hand, we found that one dual connection EVSE suffices for seven EVs. Running simulations with the model also indicates that the largest improvement is made in moving from first come first serve (FCFS) or equal charging (EC) to perfect fit (PF) using adaptive charging speed taking SoC, departure time, and next trip distance into account (Table 2). By using the VeCS model and simulating various implementation possibilities, optimal parameters can be found, not only for our case but also for other ones.
The scope of this research is limited to in-company smart charging. However, public benefits to smart charging should not be disregarded (e.g., its ability to compensate for the overproduction of sustainable energy). This research did not consider how company and public smart charging goals can conflict with each other. Further research on this aspect of smart charging is recommended. Another aspect that was found to be important is company policy regarding EV use and charging, as it can have an effect on all system performance parameters. More research in this area is crucial for successful implementation, taking into account that every company’s situation is different.
The VeCS model is well suited for the design task discussed in this paper. Through a broad range of validation and verification experiments, the model can be trusted. Although the VeCS model is useful for various situations and applications, there are certain limitations. Firstly, travel behaviour was collected through a questionnaire. If travel data of another company are gathered, GPS trackers are suggested for more accuracy. Secondly, charging costs are compared with the initial investment; however, system upkeep and maintenance are also important when implementation costs are considered. In a future version of the model, other strategies for charging speed (for instance based on estimated State of Charge) and/or connection management may be integrated. Lastly, the optimal system design and implementation must currently be found manually by tweaking certain parameters. The model could be improved by allowing the user to set performance goals and automatically optimising system design and implementation accordingly.
9. Conclusion and Recommendations
Electric personal transport is growing increasingly fast, and many companies are contemplating a switch to a fleet of EVs. Current charging infrastructure for companies is still relatively straightforward, charging any connected EV at full speed regardless of the situation and installing a number of EVSEs based on rules of thumb. Smart charging has the potential to reduce costs and CO2 emissions, and improve the user experience relative to traditional EV charging, as is also shown in the examples by ELaadNL and EVBox for public charging. Although the design of a smart EV charging system requires usage data and is more complex especially regarding data compiling and processing, the hardware required already exists. As such, it should not be long before similar smart charging systems become available on the market for companies to implement. The manner in which the system is sized and implemented is crucial.
To aid in sizing and designing an in-company smart charging system, the present research presented the Vehicle Charging Simulation (VeCS) model to first explore options and then design a well-balanced charging solution for companies. A company considering the shift to EVs can run the model to see the potential savings both in financial and environmental terms, based on their situation concerning fleet size, PV generation, and travel behaviour. The effects of different charging speeds and connection management strategies are directly shown. Application of the model on our real-life case showed that fuel costs can be reduced by 65% and CO2 emissions by 55% compared to a full-ICEV situation. Moreover, the number of EVSEs in our case can be 1 in 7 EVs, while the present rule of thumb is 1 in 4. The number of EVSE and the company policy on the use and charging of EVs have to closely match employee wishes, their travel behaviour, and other variables. The model can be used to explore options in this respect as well. For instance, from simulations, one can see the effect of adopting a perfect fit (PF) strategy instead of first-come-first-serve (FCFS): the number of incomplete charges drops from 44 to a mere 8 (see Table 2). Failure to explore these aspects before installation could result in higher-than-necessary initial costs or sub-par charging performance, which leads to higher (off-site) charging costs and employee dissatisfaction.
The findings of this project and the VeCS model will be of use in future smart EV charging developments. It can contribute to system designers creating new solutions and products, implementers realizing new charging infrastructure, or other people involved with the worldwide transfer to electric transport.
As a general conclusion, it can be stated that systems engineering methods and tools such as the nine-window diagram, data-flow diagrams, function allocation, and general modelling are useful in designing a complex system like an in-company smart charging facility. These methods and tools help to inventory, communicate, and act upon the often very different stakeholders’ interests and to reason about the system behaviour.
Author Contributions
Conceptualization, M.F.V., G.M.B. and S.P.H.; methodology, M.F.V. and G.M.B.; software, M.F.V.; validation, M.F.V. and S.P.H.; formal analysis, M.F.V.; investigation, M.F.V.; writing—original draft preparation, M.F.V. and G.M.B.; writing—review and editing, G.M.B., M.F.V. and S.P.H.; supervision, G.M.B. All authors have read and agreed to the published version of the manuscript.
Funding
This research received no external funding.
Institutional Review Board Statement
Not applicable.
Informed Consent Statement
Informed consent was obtained from all subjects involved in the study.
Data Availability Statement
The VeCS model and a short manual can be obtained from the corresponding author upon request.
Acknowledgments
The authors thank Royal Reesink for providing a case and in particular N. van Schooten and M.L. Mans for their advice and support in this project. Furthermore, the former DutchINCERT organisation, specifically B. Elders, for helping in finding and supporting this case.
Conflicts of Interest
The authors declare no conflict of interest.
Abbreviations
The following abbreviations are used in this manuscript:
| AC | Alternating Current |
| CCS | Combined Charging System |
| DC | Direct Current |
| EC | Equal Charging |
| EMS | Energy Management System |
| EV/EVs | Electric Vehicle(s) |
| EVSE | Electric Vehicle Supply Equipment |
| FCFS | First-come First-serve |
| ICEV/ICEVs | Internal Combustion Engine Vehicle(s) |
| OCPP | Open Charge Point Protocol |
| PF | Perfect Fit |
| PV | Photo-Voltaic energy |
| SAE | Society of Automotive Engineers |
| SoC | State of Charge |
| SUD | System Under Design |
| V2G | Vehicle to Grid |
| V2V | Vehicle to Vehicle |
| VBA | Visual Basic for Applications |
| VeCS | Vehicle Charging Simulation (model) |
Appendix A. Computerized Model Verification Cases
The VeCS model is verified for its correct implementation using a number of experiments. For each experiment, input parameters of the model are varied with respect to a reference case, and the outcome is predicted. Then the results of the model are checked with these predictions. In this appendix, we will present the reference case and the experiments in a brief manner. The reference case used in the computerized model verification is summarized in Table A1. In the following tables, each experiment is presented in the form of first listing the changed parameters, then the prediction, and finally the results. One or more graphs may be shown to illustrate the case outcomes.
Table A1.
Reference case for the computerized model verification.
Table A1.
Reference case for the computerized model verification.
| ID | Parameter | Value |
|---|---|---|
| 01 | # of EVs | 60 |
| 02 | % home EVSE availability | 75% |
| 03 | Fuel efficiency | EV: 15 kWh/100 km; ICEV: 5 L/100 km |
| 04 | EV max charge | 60 kWh |
| 05 | Annual energy consumption; PV generation | 100 MWh; 100 MWh |
| 06 | Maximum contracted power | 100 kW |
| 07 | Date in year | 5 July |
| 08 | # of charging connections | 20 |
| 09 | Maximum charging speed | 22 kW |
| 10 | Overload safety margin | 0.1 |
| 11 | Energy costs (grid; PV; fuel; public charging) | 0.20 €/kWh; 0.04 €/kWh; 1.50 €/L; 0.60 €/kWh |
| 12 | CO2-emissions (grid; PV; fuel) | 413 g/kWh; 0 g/kWh; 3230 g/L |
| 13 | Charging strategy | First come, first serve |
| 14 | Parking management | No transfers |
Table A2.
Experiment 1.
Table A2.
Experiment 1.
| ID | Parameter | Experiment Value |
|---|---|---|
| 01 | # of EVs | 20 |
| 02 | % home EVSE availability | 100% |
| Prediction: | ||
| The number of cars that park will go down significantly, as will the energy demand. After the home EVSE availability is changed, energy demand will drop even more. Furthermore, not all 20 charging connections will be taken, and they will fill up slower in comparison with the reference case. | ||
| Results: | ||
 | ||
| The behaviour matches the prediction. | ||
Table A3.
Experiment 2.
Table A3.
Experiment 2.
| ID | Parameter | Experiment Value |
|---|---|---|
| 03 | Fuel efficiency | EV: 20 kWh/100 km; ICEV: 4 L/100 km |
| Prediction: | ||
| As EV energy consumption increases, more charging is needed, and as such, fewer EVs will reach a full charge. Cost saving is also lower as diesel efficiency is higher in this scenario. | ||
| Results: | ||
| The number of incomplete and insufficient charges increases from 3 to 5. The cost goes from 40% to 67% of the ICEV costs, caused by lower ICEV fuelling costs and higher electricity costs. | ||
Table A4.
Experiment 3.
Table A4.
Experiment 3.
| ID | Parameter | Experiment Value |
|---|---|---|
| 04 | EV max charge | 40 kWh |
| Prediction: | ||
| With less range due to the smaller battery, there is more chance that EVs will not have enough charge to make their next trip. As a result employees have to publicly charge more often. | ||
| Results: | ||
| The amount of energy from public chargers changes from 33 to 94 kWh, in line with the prediction. | ||
Table A5.
Experiment 4.
Table A5.
Experiment 4.
| ID | Parameter | Experiment Value |
|---|---|---|
| 05 | Annual energy consumption; PV generation | 200 MWh; 200 MWh |
| 06 | Maximum contracted power | 50 kW |
| 07 | Date in year | 4 January |
| Prediction: | ||
| As the contracted power is lower, energy demand will be at its maximum for longer. This might have an impact on the number of vehicles that receive sufficient charge, unless it is negated by high solar generation. However, when the same situation is simulated in winter, when solar energy is limited, many EVs will not receive enough power. | ||
| Results: | ||
 | ||
| The number of incomplete but still sufficient charges increases from 16 to 28, and the insufficient charges increase from 3 to 5. In summer, the situation is less problematic. | ||
Table A6.
Experiment 5.
Table A6.
Experiment 5.
| ID | Parameter | Experiment Value |
|---|---|---|
| 08 | # of charging connections | 10 |
| Prediction: | ||
| With fewer EVSEs available and no transfers, many EVs will not get a chance to charge. All ten charging connections will be taken quickly. | ||
| Results: | ||
 | ||
| The number of incomplete but still sufficient charges increases from 16 to 27. | ||
Table A7.
Experiment 6.
Table A7.
Experiment 6.
| ID | Parameter | Experiment Value |
|---|---|---|
| 10 | Overload safety margin | 0.5 |
| Prediction: | ||
| The system will not allow the energy demand to even get near the maximum contracted power. | ||
| Results: | ||
 | ||
| The figure clearly shows that the import power is much lower than the contracted power limit. | ||
Table A8.
Experiment 7.
Table A8.
Experiment 7.
| ID | Parameter | Experiment Value |
|---|---|---|
| 11 | Energy costs (grid; fuel) | 0.10 €/kWh; 2.00 €/L |
| 12 | CO2-emissions (grid) | 100 g/kWh |
| Prediction: | ||
| As the system does not react to changing energy prices and emissions, charging patterns should remain identical. However, savings should be higher due to the more beneficial electricity prices and emissions. | ||
| Results: | ||
| Charging patterns remain identical to the reference case. The cost savings increase by 299.28 € and emissions are reduced by an additional 351 kg CO2. | ||
Table A9.
Experiment 8.
Table A9.
Experiment 8.
| ID | Parameter | Experiment Value |
|---|---|---|
| 13 | Charging strategy | Perfect fit |
| 14 | Disconnect on Required energy | |
| Prediction: | ||
| The overall charging pattern will be smoother across the day, and individual charging speeds should not be at the maximum speed of 22 kW. The smarter connection management method should result in drastically improved charging performance. | ||
| Results: | ||
| Charging patterns is now more constant over the day and 99% (up from 78%) of the solar energy is used. All EVs receive sufficient charge for the next trip, and there are only 2 EVs that are not fully charged by the end of their parking time. | ||
Table A10.
Experiment 9.
Table A10.
Experiment 9.
| ID | Parameter | Experiment Value |
| 01 | # of EVs | 0 |
| Prediction: | ||
| In this extreme case, no EVs are travelling. Hence, no parking times will be set and the EVSE will not use any energy. | ||
| Results: | ||
| All solar energy is exported and there are no parked EVs. | ||
Table A11.
Experiment 10.
Table A11.
Experiment 10.
| ID | Parameter | Experiment Value |
|---|---|---|
| 02 | % home EVSE availability | 100% |
| 03 | Fuel efficiency | 0 kWh/100 km |
| Prediction: | ||
| In this extreme case without any discharging of the batteries, all EVs will already be at full charge. There will be no energy demand and no charging will take place. | ||
| Results: | ||
| As in the previous experiment, all solar energy is exported, but now there are EVs parked at the company premisses. | ||
Table A12.
Experiment 11.
Table A12.
Experiment 11.
| ID | Parameter | Experiment Value |
|---|---|---|
| 08 | # of charging connections | 1, resp. 70 |
| Prediction: | ||
| With only one charging connection available, its demand will always be at its maximum of 22 kW until the connected EV’s battery is full. With 70 EVSE, all EVs can connect on arrival, so the number of connections will match the number of parked EVs. Charging performance will also be high. | ||
| Results: | ||
| With only 1 charging connection, that connection is constantly occupied. Only a small portion of the solar energy is used for charging, and the resulting solar energy export is almost identical to the previous experiments. With 70 charging connections, all EVs that need to be charged can connect immediately. This results in all EVs receiving sufficient charge. | ||
Table A13.
Experiment 12.
Table A13.
Experiment 12.
| ID | Parameter | Experiment Value |
|---|---|---|
| 06 | Maximum contracted power | 10,000 kW |
| 08 | # of charging connections | 70 |
| 09 | Maximum charging speed | 1000 kW |
| Prediction: | ||
| In this extreme cases, all EVs will charge to full almost instantly when connected to an EVSE. This will result in outstanding performance where every EV reaches a full charge. | ||
| Results: | ||
| All EVs are charged to full. | ||
Table A14.
Experiment 13.
Table A14.
Experiment 13.
| ID | Parameter | Experiment Value |
|---|---|---|
| 10 | Overload safety margin | 1.0 |
| Prediction: | ||
| In this extreme cases with a safety margin of 1.0, no energy from the grid will be allowed to go to the chargers, and only solar energy will be used. | ||
| Results: | ||
 | ||
| The total energy used by the chargers equals the solar energy generated. Charging performance is poor. | ||
Table A15.
Experiment 14.
Table A15.
Experiment 14.
| ID | Parameter | Experiment Value |
|---|---|---|
| 11 | Energy costs (all) | 0.0 |
| 12 | CO2-emissions (all) | 0 g |
| Prediction: | ||
| In this extreme cases with no costs and emissions for all energy sources, the operation costs will drop to zero. However, as the system does not react to changing energy prices and emissions, charging patterns should remain identical. | ||
| Results: | ||
| The calculated costs and emissions are zero, yet charging performance equals the reference case. | ||
References
- Gadd, K. Thinking in Time and Scale. In Triz for Engineers: Enabling Inventive Problem Solving; John Wiley & Sons, Ltd.: Chichester, UK, 2011; pp. 69–93. [Google Scholar]
- Nealer, R.; Reichmuth, D.; Anair, D. Cleaner Cars from Cradle to Grave—How Electric Cars Beat Gasoline Cars on Lifetime Global Warning Emissions; Technical Report, Union of Concerned Scientists. Available online: https://www.ucsusa.org/sites/default/files/attach/2015/11/Cleaner-Cars-from-Cradle-to-Grave-full-report.pdf (accessed on 22 September 2021).
- Hoekstra, A. The underestimated potential of battery electric vehicles to reduce emissions. Joule 2019, 3, 1412–1414. [Google Scholar] [CrossRef]
- Foley, A.; Tyther, B.; Calnan, P.; Ó Gallachóir, B. Impacts of Electric Vehicle charging under electricity market operations. Appl. Energy 2013, 101, 93–102. [Google Scholar] [CrossRef]
- Lazarou, S.; Vita, V.; Christodoulou, C.; Ekonomou, L. Calculating Operational Patterns for Electric Vehicle Charging on a Real Distribution Network Based on Renewables’ Production. Energies 2018, 11, 2400. [Google Scholar] [CrossRef]
- Fonteijn, R.; van Amstel, M.S.; Nguyen, H.P.; Morren, J.; Bonnema, G.M.; Slootweg, H. Evaluating flexibility values for congestion management in distribution networks within Dutch pilots. J. Eng. (UK) 2019, 18, 5158–5162. [Google Scholar] [CrossRef]
- Garruto, R.; Longo, M.; Yaïci, W.; Foiadelli, F. Connecting Parking Facilities to the Electric Grid: A Vehicle-to-Grid Feasibility Study in a Railway Station’s Car Park. Energies 2020, 13, 3083. [Google Scholar] [CrossRef]
- Lambert, F. ABB Unveils its 350 kW Electric Vehicle Charging Tech, Claims 200 km of Range in 8 Minutes. Electrek. 2018. Available online: https://electrek.co/2018/04/24/abb-electric-vehicle-charging-tech/ (accessed on 22 September 2021).
- Kuran, M.S.; Carneiro Viana, A.; Iannone, L.; Kofman, D.; Mermoud, G.; Vasseur, J.P. A Smart Parking Lot Management System for Scheduling the Recharging of Electric Vehicles. IEEE Trans. Smart Grid 2015, 6, 2942–2953. [Google Scholar] [CrossRef]
- Mohamed, A.; Salehi, V.; Ma, T.; Mohammed, O. Real-Time Energy Management Algorithm for Plug-In Hybrid Electric Vehicle Charging Parks Involving Sustainable Energy. IEEE Trans. Sustain. Energy 2014, 5, 577–586. [Google Scholar] [CrossRef]
- Yagcitekin, B.; Uzunoglu, M. A double-layer smart charging strategy of electric vehicles taking routing and charge scheduling into account. Appl. Energy 2016, 167, 407–419. [Google Scholar] [CrossRef]
- Kapurch, S.J.; Rainwater, N.E. Nasa Systems Engineering Handbook Sp/-2007-6105 Rev1; NASA: Washington, DC, USA, 2007.
- Bonnema, G.M.; Veenvliet, K.T.; Broenink, J.F. Systems Design and Engineering: Facilitating Multidisciplinary Development Projects; CRC Press: Boca Raton, FL, USA, 2016. [Google Scholar]
- NEN. NEN-EN-IEC 61851-1:2019 en: Laden via een Geleidende Verbinding van Elektrische Voertuigen; Technical Report; NEN: Delft, The Netherlands, 2019. [Google Scholar]
- Falvo, M.C.; Sbordone, D.; Safak Bayram, I.; Devetsikiotis, M. EV Charging Stations and Modes: International Standards. In Proceedings of the 2014 International Symposium on Power Electronics, Electrical Drives, Automation and Motion, Ischia, Italy, 18–20 June 2014. [Google Scholar] [CrossRef]
- Flexicharge. Laadpaal Elektrische Auto. Available online: https://www.oplaadpuntkopen.nl/product/laadpaal-elektrische-auto/ (accessed on 29 January 2019).
- Elektrische Voertuigen Database. Retrieved 8 May 2019. Available online: www.ev-database.nl (accessed on 10 July 2020).
- CBS. Verkeersprestaties Personenauto’s; Kilometers, Brandstofsoort, Grondgebied. 2018. Available online: https://opendata.cbs.nl/statline/#/CBS/nl/dataset/80428ned/table?ts=1540904148773 (accessed on 5 March 2019).
- CBS. Energieverbruik Particuliere Woningen; Woningtype En Regio’s. 2019. Available online: https://statline.cbs.nl/StatWeb/publication/?DM=SLNL&PA=81528NED (accessed on 5 March 2019).
- European Environment Agency. Electric Vehicles and the Energy Sector—Impacts on Europe’s Future Emissions. 2016. Available online: https://www.eea.europa.eu/themes/transport/electric-vehicles/electric-vehicles-and-energy/action-download-pdf (accessed on 1 February 2019).
- Daina, N.; Sivakumar, A.; Polak, J.W. Electric vehicle charging choices: Modelling and implications for smart charging services. Transp. Res. Part C Emerg. Technol. 2017, 81, 36–56. [Google Scholar] [CrossRef]
- Buresh, K.M.; Apperley, M.D.; Booysen, M.J. Three shades of green: Perspectives on at-work charging of electric vehicles using photovoltaic carports. Energy Sustain. Dev. 2020, 57, 132–140. [Google Scholar] [CrossRef]
- Liu, C.; Chau, K.T.; Wu, D.; Gao, S. Opportunities and Challenges of Vehicle-to-Home, Vehicle-to-Vehicle, and Vehicle-to-Grid Technologies. Proc. IEEE 2013, 101, 2409–2427. [Google Scholar] [CrossRef]
- Mal, S.; Chattopadhyay, A.; Yang, A.; Gadh, R. Electric vehicle smart charging and vehicle-to-grid operation. Int. J. Parallel Emergent Distrib. Syst. 2013, 28, 249–265. [Google Scholar] [CrossRef]
- Tan, K.M.; Ramachandaramurthy, V.K.; Yong, J.Y. Integration of electric vehicles in smart grid: A review on vehicle to grid technologies and optimization techniques. Renew. Sustain. Energy Rev. 2016, 53, 720–732. [Google Scholar] [CrossRef]
- Galus, M.D.; Vayá, M.G.; Krause, T.; Andersson, G. The role of electric vehicles in smart grids. Wiley Interdiscip. Rev. Energy Environ. 2013, 2, 384–400. [Google Scholar] [CrossRef]
- Sundström, O.; Binding, C. Flexible charging optimization for electric vehicles considering distribution grid constraints. In Proceedings of the 2012 IEEE Power and Energy Society General Meeting, San Diego, CA, USA, 22–26 July 2012; p. 1. [Google Scholar]
- Rajakaruna, S.; Shahnia, F.; Ghosh, A. (Eds.) Plug in Electric Vehicles in Smart Grids; Springer: Singapore, 2015. [Google Scholar]
- Van Amstel, M.S. Flexibility System Design for Electric Vehicles: Performing Congestion Management for the Dso. PDEng Thesis, University of Twente, Enschede, The Netherlands, 2018. [Google Scholar]
- Schuller, A.; Hoeffer, J. Assessing the Impact of EV Mobility Patterns on Renewable Energy Oriented Charging Strategies. Energy Procedia 2014, 46, 32–39. [Google Scholar] [CrossRef][Green Version]
- Van der Meer, D.; Mouli, G.R.C.; Mouli, G.M.E.; Elizondo, L.R.; Bauer, P. Energy Management System With PV Power Forecast to Optimally Charge EVs at the Workplace. IEEE Trans. Ind. Inform. 2018, 14, 311–320. [Google Scholar] [CrossRef]
- Wang, R.; Wang, P.; Xiao, G. Two-stage mechanism design for electric vehicle charging involving renewable energy. In Proceedings of the 2014 International Conference on Connected Vehicles and Expo (ICCVE), Vienna, Austria, 3–7 November 2014; pp. 421–426. [Google Scholar] [CrossRef]
- Hamidi, A.; Nazarpour, D.; Golshannavaz, S. Increasing the renewables share in discos power provision: An optimal charging/discharging collaboration through EV fleets. In Proceedings of the 2016 21st Conference on Electrical Power Distribution Networks Conference (EPDC), Karaj, Iran, 26–27 April 2016; pp. 92–97. [Google Scholar]
- Bhatti, A.R.; Salam, Z.; Sultana, B.; Rasheed, N.; Awan, A.B.; Sultana, U.; Younas, M. Optimized sizing of photovoltaic grid-connected electric vehicle charging system using particle swarm optimization. Int. J. Energy Res. 2019, 43, 500–522. [Google Scholar] [CrossRef]
- Alkan, B.; Uzun, B.; Erenolu, A.K.; Erdinc, O.; Turan, M.T.; Catalao, J.P.S. Scenario Based Analysis of an EV Parking Lot Equipped with a Roof-Top PV Unit within Distribution Systems. In Proceedings of the 2018 International Conference on Smart Energy Systems and Technologies (SEST), Seville, Spain, 10–12 September 2018. [Google Scholar] [CrossRef]
- Ghorai, S.; Majumdar, D.; Jash, T.; Ray, S. PV assisted Fuzzy based EV charge scheduling for demand side energy management: A case study. In Proceedings of the 2020 IEEE Calcutta Conference (CALCON), Kolkata, India, 28–29 February 2020. [Google Scholar] [CrossRef]
- Yusuf, J.; Ula, S. Impact of Building Loads on Cost Optimization Strategy for a Plug-in Electric Vehicle Operation. In Proceedings of the 2019 IEEE Transportation Electrification Conference and Expo (ITEC), Detroit, MI, USA, 19–21 June 2019. [Google Scholar] [CrossRef]
- Li, S.; Xie, F.; Huang, Y.; Lin, Z.; Liu, C. Optimizing workplace charging facility deployment and smart charging strategies. Transp. Res. Part D Transp. Environ. 2020, 87, 102481. [Google Scholar] [CrossRef]
- Frendo, O.; Gaertner, N.; Stuckenschmidt, H. Improving Smart Charging Prioritization by Predicting Electric Vehicle Departure Time. IEEE Trans. Intell. Transp. Syst. 2020. [Google Scholar] [CrossRef]
- Ivanova, A.; Fernandez, J.A.; Crawford, C.; Djilali, N. Coordinated charging of electric vehicles connected to a net-metered PV parking lot. In Proceedings of the 2017 IEEE PES Innovative Smart Grid Technologies Conference Europe (ISGT-Europe), Turin, Italy, 26–29 September 2017. [Google Scholar] [CrossRef]
- Open Charge Alliance. Available online: https://www.openchargealliance.org/protocols/ (accessed on 26 June 2020).
- ELaadNL. Slim Laden in de Praktijk. 2019. Available online: https://www.elaad.nl/projects/slim-laden-in-de-praktijk/ (accessed on 26 June 2020).
- Wei, Z.; Dong, G.; Zhang, X.; Pou, J.; Quan, Z.; He, H. Noise-immune model identification and state of charge estimation for lithium-ion battery using bilinear parameterization. IEEE Trans. Ind. Electron. 2020, 68, 312–323. [Google Scholar] [CrossRef]
- Wei, Z.; Hu, J.; He, H.; Li, Y.; Xiong, B. Load Current and State-of-Charge Coestimation for Current Sensor-Free Lithium-Ion Battery. IEEE Trans. Power Electron. 2021, 36, 10970–10975. [Google Scholar] [CrossRef]
- Wu, J.; Wei, Z.; Liu, K.; Quan, Z.; Li, Y. Battery-Involved Energy Management for Hybrid Electric Bus Based on Expert-Assistance Deep Deterministic Policy Gradient Algorithm. IEEE Trans. Veh. Technol. 2020, 69, 12786–12796. [Google Scholar] [CrossRef]
- Voss, M.F. In-Company Smart Charging: Design of an EV Charging System and Simulation Model. Master’s Thesis, University of Twente, Engineering Technology, Enschede, The Netherlands, 2019. [Google Scholar]
- Sarmiento-Delgado, F.; Clairand, J.M.; Guerra-Terán, P.; Escrivá-Escrivá, G. Electric Vehicle Charging Load Prediction for Private Cars and Taxis Based on Vehicle Usage Data. In Proceedings of the 2019 IEEE CHILEAN Conference on Electrical, Electronics Engineering, Information and Communication Technologies (CHILECON), Valparaiso, Chile, 13–27 November 2019; pp. 1–6. [Google Scholar] [CrossRef]
- Heemels, W.; Somers, L.; van den Bosch, P.; Yuan, Z.; van der Wijst, B.; van den Brand, A.; Muller, G.J. The Key Driver Method. In Boderc: Model-Based Design of High-Tech Systems; Heemels, W., Muller, G.J., Eds.; Embedded Systems Institute: Eindhoven, The Netherlands, 2006; pp. 27–42. [Google Scholar]
- Bonnema, G.M. Funkey Architecting—An Integrated Approach to System Architecting Using Functions, Key Drivers and System Budgets. Ph.D. Thesis, University of Twente, Enschede, The Netherlands, 2008. [Google Scholar]
- Sargent, R.G. Verification and validation of simulation models. In Proceedings of the 2010 Winter Simulation Conference, Baltimore, MD, USA, 5–8 December 2010; pp. 166–183. [Google Scholar] [CrossRef]


Publisher’s Note: MDPI stays neutral with regard to jurisdictional claims in published maps and institutional affiliations. |
© 2021 by the authors. Licensee MDPI, Basel, Switzerland. This article is an open access article distributed under the terms and conditions of the Creative Commons Attribution (CC BY) license (https://creativecommons.org/licenses/by/4.0/).