Article

Risk of Using Capillary Active Interior Insulation in a Cold Climate

1
Faculty of Civil and Geodetic Engineering, University of Ljubljana, Jamova 2, 1000 Ljubljana, Slovenia
2
Institute of Mathematics, Physics and Mechanics, Jadranska 19, 1000 Ljubljana, Slovenia
*
Author to whom correspondence should be addressed.
Energies 2021, 14(21), 6890; https://doi.org/10.3390/en14216890
Submission received: 16 September 2021 / Revised: 12 October 2021 / Accepted: 16 October 2021 / Published: 20 October 2021
(This article belongs to the Section G: Energy and Buildings)

Abstract

:
The retrofitting of cultural heritage buildings for energy efficiency often requires the internal thermal insulation of external walls. Most of the in situ studies of capillary active interior insulation were performed in mild oceanic climate regions, and they showed an excellent performance. However, as a large part of Central–Eastern Europe belongs to a continental climate with cold winters and long periods of temperatures below the freezing temperature, the applicability of the capillary active interior insulation in cold climate was studied. The hydrothermal behaviour of the three walls was determined—each consists of one of three different interior insulations—and the original wall is made of historic regular solid bricks. Two interior thermal insulations were capillary active (aerated cellular concrete, calcium silicate) and one vapour-tight (glass foam). A hot box–cold box experiment and a steady-state model were used to demonstrate an increase in the original wall mass due to the water condensation only when the capillary active interior insulation is used. The combination of the water condensation and the low sub-zero temperature may lead to a risk of freeze–thaw damage to the original wall. The numerical simulation of the water vapour condensation for the considered walls for the Slovenian town Bled with sub-zero average winter temperatures was performed to obtain the whole temperature and moisture profile. It showed good agreement between an experimentally and numerically obtained amount of water condensation. The capillary active interior insulation proved to be unsuitable for improving the thermal insulation of buildings in cold continental climate, and only a vapour-tight system can be recommended.

1. Introduction

In many cases, e.g., in cultural heritage buildings where the façade needs to remain unaffected due to the legislation, interior insulation is the only possible solution for reducing heating and/or cooling costs and increasing indoor temperature comfort [1]. The drawback of this solution is a substantial change of temperature and moisture conditions inside the original wall. There are some applications without a vapour barrier in mild climate regions [2]. However, in middle European climate, usually, a vapour-tight interior insulation (e.g., mineral wool and vapour barrier) is used to prevent the original wall from an unacceptable increase in moisture content [3]. Unfortunately, this solution prevents the drying out of the wall towards the inside. Recently, new materials, so-called, capillary active interior insulation, are proposed [4]. These materials possess pores with sizes from one-tenth of µm to one µm that can absorb liquid water and redistribute it towards the interior, improving the drying process [5], which is especially important in a case of wind-driven rain. The two most typical members of capillary active insulation are aerated concrete and calcium silicate [6]. Many different combinations of original brick wall and materials of a capillary active interior insulation (for example, calcium silicate, aerated concrete, polyurethane board with capillary active channels) have been investigated by numerical simulations [1,5,7,8,9] or/and in situ or laboratory experiments [3,5,6,9,10,11,12]. However, most of the in situ studies were performed in mild oceanic climate regions (Dublin, Ireland [12], Belfast, Northern Ireland [11], and Lyngby, Denmark [9]). They did not experience any problems connected with the freezing of the condensate water in the original wall, as the lowest monthly average temperature in this climate region is still well above the freezing temperature. On the other hand, a large part of Central–Eastern Europe belongs to a continental climate with cold winters and long periods of temperatures below the freezing temperature. Only a few experimental studies of capillary active interior insulation implemented on buildings in a cold continental climate can be found in the literature with a somehow not decisive conclusion as to whether this solution is suitable for the cold climate or not. Klõšeiko et al. [6] studied four different interior insulations, namely calcium silicate, aerated concrete, polyurethane board with capillary active channels (all three capillary active insulations), and polyisocyanurate board (vapour barrier insulation) in a historical school building in Tallinn, Estonia. They found a possible risk of mould growth on the surface of the wall on the room side and in the interstitial layer. The original brick wall was quite wide (≈75 cm), and no freezing was detected between the insulating system and the original wall. Biseniece et al. [3] performed long-term measurements of temperature and relative humidity on the internally isolated historic brick building in Riga, Latvia. They concluded that the original wall may be exposed to freeze–thaw damage after internal insulation during the cold months. Wereeckem and Roels [10] conducted a laboratory “hot box–cold box” experiment: the small test walls consisted of capillary active and standard non-capillary active insulation on a hot side and the brick wall towards the cold side. They used quite extreme temperature conditions: 35 °C on the hot side and 2 °C on the cold one. The moisture content in the walls in a steady-state condition was determined by weighing separate parts of the walls. They concluded that from the point of view of interstitial condensation, a vapour-tight system was preferable to a capillary active interior insulation system, while they did not discuss a possible freeze–thaw damage.
Our study aims to extend a similar “hot box–cold box” experiment with different interior insulations as in [8] but applying a lower—below zero—temperature in a cold box, determine an increase in water content separately in the insulation layer and original wall, and evaluate the applicability of the capillary active interior insulation in a cold continental climate.

2. Materials and Methods

Three test walls are prepared with a size of 39 cm × 39 cm. Each wall consists of the very same 12 cm thick layer of historic regular solid bricks [13] of the size 15 cm × 12 cm × 6.5 cm (from now on called the original wall) on a cold side. The historic regular solid bricks were widely used in Slovenia and Central Europe in the 19th and 20th centuries, varying only slightly in the size with time. On a warm side (“hot box”, a laboratory ambient conditions), one of the three interior insulations is used: an aerated cellular concrete [14] and calcium silicate [15] as capillary active materials, and a foam glass [16] as a vapour-tight material. The materials and dimensions of specimens are shown in Figure 1. No glue mortar was used in order to make it possible to weigh separately the original wall and insulation layer before and after the experiment.
For the simulation of the cold conditions (“cold box”), a refrigerator is used where the temperature stabilises at approximately −1.5 °C. Its door is replaced by a specially constructed door made of extruded polyester boards with an opening where the specimen with the dimensions of 39 cm × 39 cm can be inserted (Figure 2). The original wall faces the cold side (refrigerator’s interior) while on the other hand, the insulation is warm and experiences laboratory ambient conditions.
The air temperature (between 18 and 22 °C) and relative humidity (RH, ≈60%) in the laboratory RHin and the refrigerator RHout are measured with a VOLTCRAFT DL-121TH multi-channel data logger (Figure 3).
Two heat flow plates AHLBORN FQA018 for the measurement of heat flow flux are mounted on the wall. One plate is mounted in the centre of the warm side surface (measuring heat flux density qin), while the other one is mounted on the cold side of the wall (qout), as shown in Figure 3a. In addition to the heat flux density, the heat flow plates measure the contact temperature, too. Thus, they provide us with the information of the surface contact temperatures, namely Tin on the warm side of the insulation and Tout on the cold side of the original wall, i.e., in the refrigerator.
Between the insulation and the original wall (Figure 3b), a Ni-Cr thermocouple (measuring a temperature T′) and AHLBORN FHAD 46-C41 relative humidity sensor [17] are built. They measure the contact temperature T′ and relative humidity RH’ in the interstitial layer, respectively.
Before we start each experiment, the original wall and the insulation are dried out in an oven and weighed separately. Then, they are assembled and wrapped all around the sides with a plastic foil to prevent water vapour transfer from the sides of the wall. The experiment starts with mounting the wall specimen, i.e., one of the three insulations in addition to the original wall, in an opening of the specially built door of the refrigerator. The contact temperatures Tin, Tout, T′, relative humidity RHin, RHout, RH′, and heat flux density qin and qout are measured as a function of time. After 8 days, the wall specimen is removed from the refrigerator and dismantled to separate the insulation from the original wall to measure their weight separately. The difference between the final and initial mass is the indicator of the condensate water amount in the insulation and original wall separately. The period of 8 days was long enough for accurate determination of mass difference.
The temperature and moisture profile in the insulation and original wall were theoretically estimated using a simple model assuming steady-state conditions, as described in the standard ISO 13788:2012 [18] (Glaser method).
In this approximation, the temperature T(x) and water vapour pressure p(x) are linear within a single layer. The interface temperature can be calculated as [19]
T = T in R 1 + T out R 2 R 1 + R 2 ,
where Ri = di/λi are the thermal resistances of the original wall (R1) and the interior insulation layer (R2). Similarly, the interface vapour pressure p′ is
p = p in s d 1 + p out s d 2 s d 1 + s d 2 ,
where sdi = µi di, are the water vapour diffusion and equivalent air layer thickness, sd1 for the original wall and sd2 of the interior insulation layer. The vapour pressure on the surface of the internal insulation layer is pin = RHin·psat(Tin) and pout = RHout·psat(Tout) on the outside surface. Finally, the water vapour pressure at saturation at a temperature T (in °C) is determined according to ISO13788:2012 [18] as
p s a t = 610.5   exp ( 17.269   T 273.3 + T ) ,   T 0   ° C   and
p s a t = 610.5   exp ( 21.875   T 265.5 + T ) ,   T < 0   ° C .
In a layer where the calculated vapour pressure is larger than the water vapour pressure at saturation, the condensation may occur. The rate of the condensation g is the difference between the densities of the inside and outside water vapour flow rates gin and gout [18,19]:
g = g in g out = 0.72   g kPa · m · h   ( p in p s d 2 p p out s d 1 ) .  

3. Experimental Results

Figure 4 shows the time dependences of temperatures T, heat flux densities q, and relative humidity RH, as described in the previous section and denoted in Figure 2 during the period of 8 days for three different interior insulations.
The first column (Figure 4a) shows the results for a case of the capillary active material: the aerated cellular concrete. The temperatures and heat flux density change considerably at the beginning and reach steady-state conditions after approximately 24 h. The temperature Tout, heat flux density qout, and RHout look much noisier than the other measured quantities. They all report the conditions on the cold side—in the refrigerator. In the insets in Figure 4a, there are the same quantities in an expanded scale for a 60-minute interval only. The displayed “noisy” signal is actually not a noise but a periodic change of the temperature Tout and the other two quantities qout and RHout that depend on the temperature inside the refrigerator. The refrigerator’s temperature stabilises at approximately −1.5 °C. As the refrigerator’s compressor is periodically turned on and off, the temperature inside the refrigerator oscillates with a period of approximately 20 min and an amplitude of 0.5 °C. These oscillations have a great impact on the reporting heat flux density qout. The heat flow plates are only 1.5 mm thick, and a sudden change of the temperature on one side of the plate causes a dramatic change of the reported heat flux density through the plate. The minimum value of the measured heat flux density qout (that is achieved when the temperature in the refrigerator is maximal, just before the switching on the compressor) is close to the heat flux density qin on the other, i.e., warm, side of the wall. In steady-state conditions, these two heat fluxes are expected to be the same. In the other two panels (Figure 4b,c), we do not show the result of the cold heat flow density plate, qout.
While the temperature T′ between the insulation layer and the original wall stabilises after approximately 24 h, the relative humidity RH’ at the same location increases even after 8 days. In panel (a) of Figure 4, when aerated cellular concrete is used as inner insulation, the RH’ is approaching the value of 100%, which means a water condensation can occur in the interstitial layer.
Very similar results are obtained for another capillary active interior insulation, namely calcium silicate (Figure 4b). Again, a time scale for reaching steady-state conditions is approximately 24 h for the temperature and several days for the relative humidity RH’ in an interstitial layer. The relative humidity RH’ saturates at a level above 90%. As the experimental error of the RH sensor strongly increases at such a high level of relative humidity (4% above 90% RH [15]), we can conclude that the relative humidity in an interstitial layer is again close to 100%, i.e., close to the dew point.
In Figure 4c, the results for foam glass, a vapour-tight material, are shown. Temperature and heat flux time dependences are similar as in the previous two cases. The important difference is the behaviour of the relative humidity RH′. In this case, the relative humidity between the insulation and original wall does not saturate to 100% but remains at approximately 50%. No condensation occurs in this wall, as will be proved also by weighing the wall after the experiment.
A temperature difference across each layer, namely interior insulation (TinT′) and the original wall (T′ − Tout), and a heat flux density qin in the steady-state enable us to calculate the thermal conductivity λ of each material. The obtained thermal conductivities are collected in Table 1 and compared to the expected values reported by manufacturers. The measured thermal conductivities of the two capillary active insulations (aerated cellular concrete and calcium silicone) are larger than those reported by manufacturers while the measured λ of foam glass is within the experimental error in agreement with the expected value. The obtained larger values of the thermal conductivities λ can be attributed to the increased water content in the capillary active insulation.
After 10 days, the wall was removed from the refrigerator, the insulation layer was decoupled from the original brick wall, and they both were weighed separately. The increase in the mass from the dry state before the experiment to the final mass after 10 days of a hot box–cold box experiment is shown in Figure 5.
In the case of two capillary active insulations, aerated cellular concrete and calcium silicate, the results are quite similar. The mass of condensed water in the insulation layer is approximately 20 g, while in the original brick wall, it increases by 100 g during 10 days. Considering the volume of the original wall (0.12 m × 0.39 m × 0.39 m), it means an increase in the moisture content per volume of the original wall of approximately 0.5 kg/m3 per day. This value is comparable to the results reported by Vereecken and Roels [10]. They also show that the moisture content increases linearly even after 100 days if, of course, the boundary conditions (temperature and RH values in a hot box and cold box) are kept constant. These results demonstrate that a lot of condensed water appears in the original wall when capillary active insulation is used.
The situation is completely different when foam glass, which is a vapour-tight material, is used for the interior insulation. In Figure 5, we can see that within the experimental error, no water vapour condensates when a vapour-tight interior insulation is used.

4. Discussion

In the experimental part of the present work, we demonstrated the accumulation of condensed water in a wall with capillary active interior insulation. The water accumulates mostly in a cold part of the wall, i.e., in the original brick wall.
Let us now discuss the change of temperature and moisture conditions in the original wall due to the interior insulation using a simple model assuming steady-state conditions as described in the Materials and Methods section. The steady-state conditions are a reasonable approximation at least for a wall not directly exposed to sunlight. In addition, all boundary effects, thermal boundary layers, and other minor effects are neglected in the following calculations. Our goal is just to demonstrate the main change of the thermal/humidity conditions in the original wall due to the internal insulation. Due to the lack of exact knowledge of the material properties, their dependence on the temperature and moisture content, and sometimes even the dimensions of historic walls, a very precise temperature and vapour pressure profile cannot be obtained usually no matter how sophisticated the numerical methods used.
As an example of outside temperature and relative humidity conditions, we use the weather conditions for a well-known Slovenian tourist resort, Bled. The coldest month is January with an average temperature between −6 and 1 °C changing from year to year [20]. Even during the warmest January with the average temperature of 1 °C, there are several days with temperatures well below the freezing point. In the following calculations, we decide to use a temperature Tout = −5 °C. The outside relative humidity RHout is set to 82%, as an average value in Bled in January [21]. The amount of precipitation is small during the winter months, mostly in the form of snow. Rainy days are rare. For the interior conditions, a temperature Tin = 20 °C and a relative humidity RHin = 65% are used. The walls are simplified as much as possible. Only the original brick wall of the width of 12 cm and one of the three types of interior insulations (width 6 cm) are considered. The material properties are taken from the results of our experimental work and are close to the claimed values by manufacturers. All values of material properties and dimensions used in the calculations are collected in Table 2. We need to emphasize that small changes of material properties in a range of the differences between the literature reported values and the experimentally obtained ones do not change the presented following results qualitatively.
The results of this steady-state model are temperature and water vapour dependences within the walls shown in Figure 6, where in panel (a), only the original wall with no additional insulation is considered. The temperature decreases linearly from the interior temperature of 20 °C down to −5 °C outside, leaving only a relatively small region close to the cold surface of the wall below the freezing temperature. This region with a temperature below 0 °C is marked with a red background colour. The lowest graph in Figure 6a shows water vapour pressure through the wall (black curve) and water pressure at saturation psat (blue dashed curve), as calculated from Equation (3) for the actual temperature dependence T(x) in the wall. The water vapour pressure is close to the saturated value only in a region close to the cold surface. However, it is still below the saturated value, which means no water condensation occurs in the original wall with no insulation layer. These conditions, namely the temperature and water vapour pressures dependences shown in Figure 6a, are somehow typical winter conditions in the original wall that have lasted for decades or even centuries in historical buildings.
The conditions change dramatically when internal insulation, e.g., capillary active aerated cellular concrete (Figure 6b), is added to the original wall. The almost complete original wall is now below the freezing point. The water vapour pressure in the original wall is slightly smaller as shown in Figure 6a with no insulation. However, due to the low temperature in the original wall, the water vapour pressure at saturation is in a wide region in the original wall as well as in a part of the insulation below the calculated water vapour pressure at saturation (dashed curve is below the full line). The area between the two water pressure levels (shaded in blue) represents the region where condensation can occur. The most problematic is the region with a possible condensation (blue) and temperature below 0 °C (red) at the same time. It is a cross-section area shown on the top scheme in Figure 6b. In this region, freezing of the condensed water can happen. In realistic conditions with daily changing outside temperature, freeze–thaw cycles can repeat many times during the winter period with devastating consequences for the original wall [23]. With slightly lower outside temperature, which is very probable during the whole winter, as −5 °C (for which the calculation in Figure 6 is made) is the average temperature in January on Bled, even the interstitial region between the insulation and the original wall can become a freeze–thaw region, which may lead to a splitting of the two layers.
The conditions in Figure 6c with the calcium silicate instead of the aerated cellular concrete as capillary active interior insulation are similar to Figure 6b. It is not surprising because the two insulations have similar material properties (Table 2). Let us use this example in Figure 6c to estimate the rate of the condensation. As the water vapour pressure cannot exceed the vapour pressure at saturation, we have to redraw the vapour pressure (thin red line instead of a full black line). The rate of the condensation g can be calculated from Equation (5):
g   =   g in     g out   =   0.72   g kPa · m · h   ( p in     p s d 2     p     p out s d 1 ) =   0.72   g kPa · m · h   ( 1.522   kPa     0.756   kPa 0.18   m     0.756   kPa     0.329   kPa 0.84   m ) =   2.7   g m 2 · h .
We can compare this result with the experimentally obtained amount of the condensed water. During the 10-days-long hot box–cold box experiment with similar outside and inside conditions as used in the above calculation, the mass of the experimental wall increased by approximately 120 g. The area of the experimental wall was A = 0.15 m2. Using the result of Equation (5), the calculated mass of the condensed water in 10 days would be
m = g ·   t · A = 2.7   g m 2 · h   · 10 · 24   h · 0.15   m 2 = 97   g .
A relatively good correspondence between the measured mass of condensed water (120 g) and the calculated one (97 g) is an indirect justification of the application of the simple steady-state model.
Finally, Figure 6d represents the conditions with the foam glass as interior insulation. Foam glass serves as a vapour-tight insulation. The water vapour pressure is now significantly reduced when compared with the two capillary active insulations in Figure 6b,c. No condensation occurs in the wall in agreement with the experimental result.

5. Conclusions

We evaluate the applicability of the capillary active interior insulation in a cold continental climate experimentally and theoretically within the approximation of steady-state conditions.
The hot box–cold box experiments are conducted with three different set-ups of the walls. In each test, the wall consists of one of the internal insulations, namely aerated cellular concrete or calcium silicate as the capillary active materials, or a vapour-tight foam glass on the hot side, and the brick wall towards the cold side. The thermal conductivities of used insulations are determined by measuring the heat flux q and temperature differences ΔT across the layers in a steady-state condition. The thermal conductivities are slightly larger than the reported values by manufacturers due to the increased water content in the materials. The most important experimental result is the original brick wall mass increase due to the water condensation only when capillary active insulation, either the aerated cellular concrete or calcium silicate, is used. No increase in the water content in the original brick wall is detected when a water vapour-tight insulation, the foam glass, is used as the interior insulation.
A steady-state model is used to determine the regions in the wall where a water condensation can occur. For typical winter conditions in the cold continental climate (−5 °C outside), we show the capillary active interior insulation with a relatively small water vapour resistance factor, which makes the almost complete original wall a region where the water condensation is expected. In a large part of this region, the temperature is below the freezing point. The combination of possible water condensation and low temperature in the same region of the original wall represents a huge risk for the freeze–thaw damage of the original wall and even the interstitial region. Additionally, the presence of condensed water in the considered walls, which are built with the regular solid bricks and with a lime–sand mortar, represent a risk of mortar degradation due to the nature of the lime.
We can conclude that the capillary active interior insulation is not a suitable solution for improving the thermal insulation of buildings in the cold continental climate. If the internal insulation is the only possible option for improving the thermal insulation of the building in a cold climate, the vapour-tight insulation needs to be applied.

Author Contributions

Conceptualisation, D.A. and Z.J.; methodology, D.A.; investigation, D.A. and K.Č.; writing—original draft preparation, Z.J.; writing—review and editing, D.A. All authors have read and agreed to the published version of the manuscript.

Funding

This research was funded by the Slovenian Research Agency (Grant No. P2-0348, Grant No. P2-0185, and Grant No. J2-8194).

Conflicts of Interest

The authors declare no conflict of interest. The funders had no role in the design of the study; in the collection, analyses, or interpretation of data; in the writing of the manuscript, or in the decision to publish the results.

References

  1. De Mets, T.; Tilmans, A.; Loncour, X. Hygrothermal assessment of internal insulation systems of brick walls through numerical simulation and full-scale laboratory testing. Energy Procedia 2017, 132, 753–758. [Google Scholar] [CrossRef]
  2. Andreotti, M.; Bottino-Leone, D.; Calzolari, M.; Davoli, P. Applied Research of the Hygrothermal Behaviour of an Internally Insulated Historic Wall without Vapour Barrier: In Situ Measurements and Dynamic Simulations. Energies 2020, 13, 3362. [Google Scholar] [CrossRef]
  3. Biseniece, E.; Žogla, G.; Kamenders, A.; Purvinš, R.; Kašs, K.; Vanaga, R.; Blumberga, A. Thermal performance of internally insulated historic brick building incold climate: A long term case study. Energy Build. 2017, 152, 577–586. [Google Scholar] [CrossRef]
  4. Grunewald, J.; Ruisinger, U.; Häupl, H. The Rijksmuseum Amsterdam—hygrothermal analysis and dimensioning of thermal insulation. In Proceedings of the 3rd International Building Physics, Montreal, QC, Canada, 27–31 August 2016; pp. 345–352. [Google Scholar]
  5. Vereecken, E.; Roels, S. Capillary active interior insulation: Do the advantages really offset potential disadvantages? Mater. Struct. 2015, 48, 3009–3021. [Google Scholar] [CrossRef]
  6. Klõšeiko, P.; Arumägi, E.; Kalamees, T. Hygrothermal performance of internally insulated brick wall in cold climate: A case study in a historical school building. J. Build. Phys. 2015, 38, 444–464. [Google Scholar] [CrossRef]
  7. Marincioni, V.; Marra, G.; Altamirano-Medina, H. Development of predictive models for the probabilistic moisture risk assessment of internal wall insulation. Build. Environ. 2018, 137, 257–267. [Google Scholar] [CrossRef]
  8. Zhou, X.; Carmeliet, J.; Derome, D. Influence of envelope properties on interior insulation solutions for masonry walls. Build. Environ. 2018, 135, 246–256. [Google Scholar] [CrossRef]
  9. Jensen, N.F.; Bjarlov, S.P.; Rode, C.; Moller, E.B. Hygrothermal assessment of four insulation systems for interior retrofitting of solid masonry walls through calibrated numerical simulations. Build. Environ. 2020, 180, 107031. [Google Scholar] [CrossRef]
  10. Vereecken, E.; Roels, S. A comparison of the hygric performance of interior insulation systems: A hot box–cold box experiment. Energy Build. 2014, 80, 37–44. [Google Scholar] [CrossRef]
  11. Campbell, N.; McGrath, T.; Nanukuttan, S.; Brown, S. Monitoring the hygrothermal and ventilation performance of retrofitted clay brick solid wall houses with internal insulation: Two UK case studies. Case Stud. Constr. Mater. 2017, 7, 163–179. [Google Scholar] [CrossRef] [Green Version]
  12. Walker, R.; Pavía, S. Thermal and moisture monitoring of an internally insulated historic brick wall. Build. Environ. 2018, 133, 178–186. [Google Scholar] [CrossRef]
  13. Klun, M.; Antolinc, D.; Bosiljkov, V. Out-of-Plane Experimental Study of Strengthening Slender Non-Structural Masonry Walls. Appl. Sci. 2021, 11, 9098. [Google Scholar] [CrossRef]
  14. Toplotna Izolacija: Multipor Plošče. Available online: www.ytong.si/si/docs/Multipor_2018.pdf (accessed on 16 September 2021).
  15. PROMATECT–MC® die Klimaplatte. Available online: www.bdb.at/NL/2010/140729/201308.pdf (accessed on 16 September 2021).
  16. GEOCELL SCHAUMGLAS. Available online: www.geocell-schaumglas.eu/ (accessed on 16 September 2021).
  17. Digital Sensor for Temperature, Humidity, and Atmospheric Pressure FHAD 46-Cx. Available online: www.ahlborn.com/download/pdfs/kap08/eng/fhad46e.pdf (accessed on 16 September 2021).
  18. ISO 13788:2012. Hygrothermal Performance of Building Components and Building Elements–Internal Surface Temperatures to Avoid Critical Surface Humidity and Interstitial Condensation–Calculation Methods. Available online: https://www.iso.org/standard/51615.html (accessed on 18 October 2021).
  19. Pinterić, M. Building Physics; Springer International Publishing AG: Cham, Switzerland, 2017; pp. 99–146. [Google Scholar]
  20. January Weather Forecast and Climate. Available online: www.weather-atlas.com/en/slovenia/bled-weather-january (accessed on 16 September 2021).
  21. Slovenian Environment Agency. Podatki za Pravilnik o Učinkoviti Rabi Energije. Available online: Meteo.arso.gov.si/met/sl/climate/tables/pravilnik-ucinkoviti-rabi-energije/ (accessed on 16 September 2021).
  22. Ministrstvo za Okolje in Proctor. Tehnična Smernica TSG-1-004: 2010, Učinkovita Raba Energije. Available online: www.zaps.si/img/admin/file/WWW%20ZAPS/ARH%201_14/1_14_2%20Tehnicna%20smernica_raba%20energije_TSG-1-004_2010.pdf (accessed on 16 September 2021).
  23. Uranjek, M.; Bokan-Bosiljkov, V. Influence of freeze–thaw cycles on mechanical properties of historical brick masonry. Constr. Build. Mater. 2015, 84, 416–428. [Google Scholar] [CrossRef]
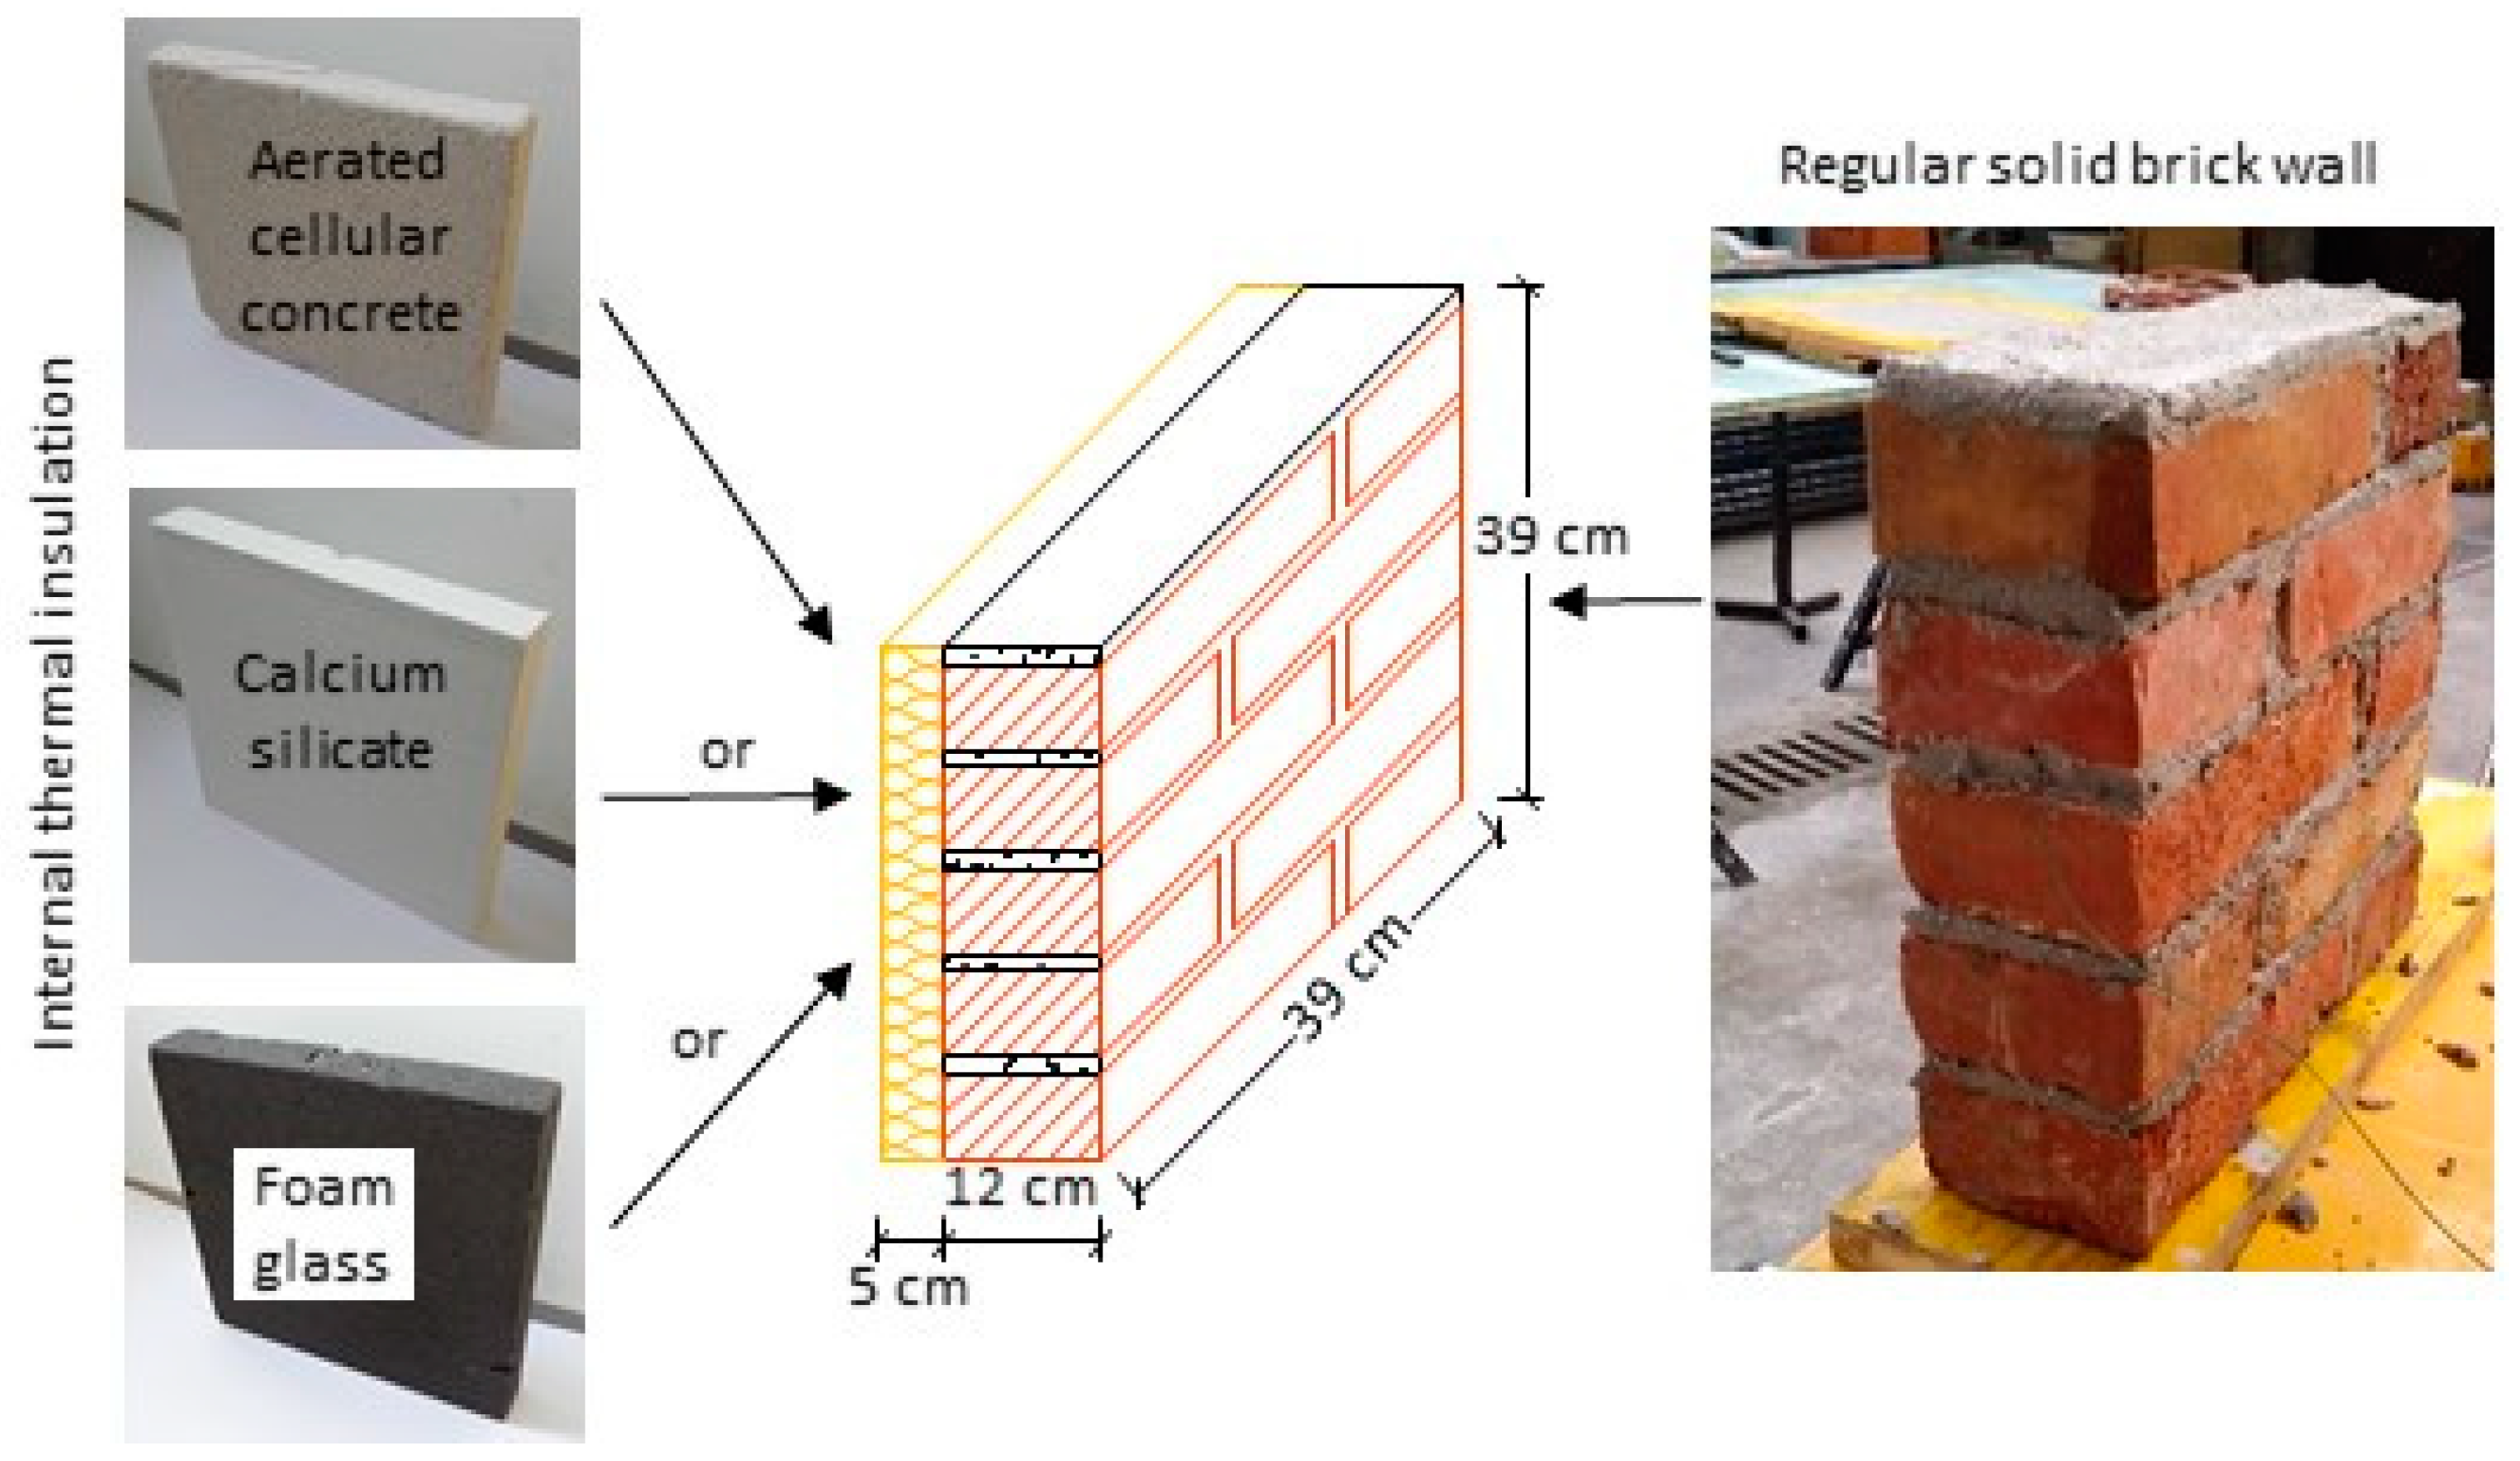
Figure 1. The test walls consist of different internal thermal insulation on the hot side and the brick wall (original wall) on the cold side. Units are in cm.
Energies 14 06890 g001
Figure 2. Test setup with prepared insulated brick wall specimen in the opening of the specially prepared door of the fridge.
Energies 14 06890 g002
Figure 3. Heat flow plate on the interior insulation (a), temperature and RH meters in the interstitial layer (b), and a scheme with the symbols of all measured quantities (c).
Energies 14 06890 g003
Figure 4. Time dependences of temperature, heat flux, and RH for three wall specimens with different interior insulations and the very same brick wall. Due to the unknown technical problem, the sensors for T′, Tout, and RH′ in panels (b,c) did not record the data for the first 20 h and 12 h, respectively.
Energies 14 06890 g004
Figure 5. The increase in the mass of different insulation layers (left on each figure) and original wall (right) after 10 days of a hot box–cold box experiment.
Energies 14 06890 g005
Figure 6. Temperature and water vapour pressure dependences in the original wall alone (a) and with three different interior insulations (bd). Red background colour marks regions where the temperature is below 0 °C, while blue background colour marks the region where water condensation occurs.
Energies 14 06890 g006
Table 1. The expected thermal conductivities (Literature λ) and the measured ones (Experimental λ).
Interior Insulation MaterialLiterature λ (W/mK)Experimental λ (W/mK)
Aerated cellular concrete0.043–0.045 [14]0.05
Calcium silicate (Promatect MC)0.053 [15]0.07
Foam glass0.05 [16]0.05
Original brick wall/0.3 1
1 As the average value of several experiments.
Table 2. Material properties and dimensions of four walls used in the calculations.
Outside conditions:Tout = −5 °C,RHout = 0.82 (82%)
Inside conditions:Tin = 20 °C,RHin = 0.65 (65%)
Thickness d (cm)Thermal conductivity λ (W m−1 K−1)Water vapour resistance factor μ 1
Original brick wall120.37 [22]
Aerated cellular concrete60.053 [14]
Calcium silicate60.073 [15]
Foam glass60.05μ → ∞ [16]
1 From technical documentation of the manufacturers.
Publisher’s Note: MDPI stays neutral with regard to jurisdictional claims in published maps and institutional affiliations.