Abstract
Making full use of wind energy can effectively alleviate the global energy shortage and environment contamination problems. Nevertheless, how to significantly improve the performance of the wind turbine airfoil and blade is a crucial issue. As the novel flow control method, the co-flow jet (CFJ) technology is one of the most potential methods to solve this problem. Thus, the effects of the CFJ technology on the performance enhancement of the S809 airfoil and Phase VI wind turbine blade are explored in this study. Furthermore, the effects of the injection location and jet momentum coefficient are studied, and an adaptive jet momentum coefficient strategy of the CFJ technology is proposed. Results demonstrate that the CFJ technology can significantly improve the maximum lift coefficient and maximum corrected lift-to-drag ratio of the S809 airfoil. Moreover, the power coefficient of the Phase VI wind turbine blade at the low tip speed ratio is greatly enhanced as well. In particular, the maximum lift coefficient and maximum corrected lift-to-drag ratio of the typical S809 CFJ airfoil with adaptive Cμ are improved by 119.7% and 36.2%, respectively. The maximum power coefficient of CFJ blade can be increased by 4.5%, and the power coefficient of CFJ blade can be boosted by 226.7% when the tip speed ratio is 1.52.
1. Introduction
As a kind of clean energy, wind energy has been paid more and more attention by various countries. According to preliminary wind power statistics published by the World Wind Energy Association (WWEA), the total capacity of all wind farms worldwide by the end of 2020 has reached 744 gigawatt, which is sufficient to generate 7% of the world’s electricity demand [1]. As the basic elements of the wind turbine blade, the performance of the airfoils directly affects the aerodynamic characteristics of wind turbine blade, which are essential to the power generation of the wind turbine. Meanwhile, flow control technology has shown extremely significant advantages in improving the performance of airfoils and blades, and is one of the effective ways to greatly improve the performance of wind turbine airfoils and blades.
Many researchers have studied various passive and active flow control methods to enhance the performance of the wind turbine airfoil and blade, such as gurney flaps [2,3,4,5,6], vortex generators [7,8,9,10,11], synthetic jets [12,13,14,15,16], circulation controls [17,18], and plasma actuators [19,20,21,22,23,24]. Gamiz et al. [3] found that the power output of the five-megawatt wind turbine could be significantly increased by equipping with vortex generators (VGs) and Gurney flaps (GFs). Inigo et al. [6] implemented the GF to improve the aerodynamic performance of the DU91W(2)250 wind tunnel airfoil. Results showed that optimum GF lengths of the airfoil with maximum lift-to-drag ratios were between 0.25% and 0.75% chord length. Li et al. [10] carried out the wind tunnel tests and numerical simulations to explore the aerodynamic characteristics of the DU93-W-210 wind tunnel airfoil with VGs. It was found that the stall angle of attack and lift coefficient of the airfoil with VG were increased by 10° and 48.7%, respectively. Ye et al. [11] applied the VGs to the NREL wind turbine and demonstrated that the wind turbine with VGs achieved better aerodynamic performance compared to the baseline. Moshfeghi et al. [13] studied the effects of the synthetic jet actuators (SJAs) on the performance improvement of a wing composed of the NREL S809 airfoil by numerical methods. Results demonstrated that the stall and lift characteristics of the wing with SJA became worse when the flow was attacked, but the lift performance was enhanced when the flow was separated. Maldonado et al. [16] analyzed the power efficiency of the wind turbine with SJAs. Results indicated that the power demand of driving the wind turbine with SJAs could be reduced by 10.6% at 500 rpm. Xu et al. [17,18] validated the effectiveness of the full circulation control (FCC) and partial circulation control (PCC) on the performance enhancement of wind turbine airfoils with the blunt trailing edge. Aono et al. [19] explored the effects of the plasma technology on the aerodynamic performance of the NREL S825 airfoil. Results showed that the shear layer separation near the leading edge was prevented by the direct momentum addition produced by the plasma actuator during the case setup. Li et al. [21,22] proved that the dynamic stall of the wind turbine airfoil could be effectively controlled by the plasma actuators. Aono et al. [23] used the dielectric barrier discharge plasma actuator to control the separated flow of the wind turbine and demonstrated that the leading edge separation could be effectively suppressed at high angle of attack. Zhu et al. [25] presented a novel flow control strategy which could reduce the power consumptions of the blowing, synthetic, and plasma jet actuators, resulting in the performance enhancement of the vertical axis wind turbine.
Moreover, a novel active flow control technology, named co-flow jet (CFJ), was proposed and developed by Zha et al. [26,27,28,29,30,31,32,33,34,35,36]. The CFJ airfoil, which has an injection slot near the leading edge and a suction slot near the trailing edge on the airfoil suction surface, has shown the significant lift enhancement and drag reduction with low power expenditure [26,27,28]. Because the mass flux of the injection is equal to that of the suction, the zero net mass flux can be achieved. Meanwhile, Yang et al. [29,30,31,32] numerically demonstrated that the CFJ airfoil and cylinder could achieve the super-lift coefficient that far exceeded the theoretical limit, which was proved by Zha et al. [33] for the first time in experiment. To apply embedded micro-compressor actuator to the CFJ airfoil during the tunnel experiment, Ren et al. [34,35,36] designed the injection and suction duct of the CFJ airfoil, and simulated the 3D CFJ airfoil with an embedded micro-compressor actuator. Zhang et al. [37] explored the numerical and experimental methods to achieve CFJ technology with fans inside the duct. Results demonstrated that the maximum lift coefficient of the CFJ airfoil could be increased by at least 50% and the drag coefficient could be negative at small angles of attack. Therefore, the CFJ technology is one of the most effective means to greatly improve the performance of the wind turbine airfoil, thereby improving the performance of the wind turbine.
The CFJ technology has been applied to the propeller or rotor airfoil. Zhu et al. [38] applied the CFJ technology to the near space propeller, whose efficiency was increased by more than 5%. Yang et al. [39] analyzed the dynamic stall characteristics of the CFJ rotor airfoils and demonstrated that the CFJ technology could remove the dynamic stall phenomenon occurring on rotor airfoils. The parametric studies of the CFJ technology applied to the various conventional airfoils have been implemented by researchers. Zha et al. [40] and Wang et al. [41] explored the effect of the injection slot size on the CFJ airfoils based on the NACA0025 airfoil. Results demonstrated that the stall and lift characteristics of CFJ airfoils with the small injection slot size could be greatly enhanced, whereas the drag characteristics of CFJ airfoils with the large injection slot size could be effectively improved. Lefebvre et al. [42,43] implemented the CFJ airfoil trade study based on the NACA23121 airfoil when the angle of attack (AoA) was 10° and the injection location was found to have significant influence on the energy consumption and aerodynamic efficiency. Xu et al. [44] studied the effects of the key parameters, including jet momentum coefficient, injection slot size, and injection location, on the aerodynamic performance of the co-flow jet airfoil based on the NACA6415 airfoil at the low-Reynolds-number condition and the different angles of attack. The results showed that the injection location and suction location had little effects on the energy consumption and aerodynamic efficiency, and the conclusion about the effect of the injection location on the CFJ airfoil was very different from that of Lefebvre et al. [42,43]. The differences may be caused by the various CFJ airfoils and computational conditions.
Moreover, the CFJ technology has been applied to the wind turbine airfoil and blade. The static aerodynamic performance and dynamic stall control of the NREL S809 airfoil using the CFJ technology were numerically investigated by Xu et al. [45,46]. The results showed that the CFJ technology was proved to have the positive effect in increasing lift, reducing drag, and suppressing dynamic stall of the S809 airfoil. However, the influence of the energy consuming, which was only researched individually, was not included in the lift-to-drag ratio and only one CFJ airfoil configuration was studied. Sun et al. [47] numerically investigated the aerodynamic performance of the vertical axis wind turbine using the CFJ technology and demonstrated that the CFJ technology could recover some of the power loss due to blade stall. When the jet momentum coefficient was bigger, the control effect was better. In addition, Xu et al. [48] implemented the investigation of co-flow jet active flow control for wind turbine airfoil. The effects of injection slot size, injection slot location, suction slot size, suction slot location, and injection total pressure were studied. The optimum configuration was able to increase the maximum lift coefficient by 42.3%. But the value ranges of the parameters were not wide enough and only three values were taken for each parameter. Moreover, the corrected lift-to-drag ratio of the optimum configuration had no increase when compared with the baseline. Meanwhile, Xu et al. [49] studied the performance enhancement of the Phase VI wind turbine and demonstrated that the power output of the CFJ blade could be increased by 207.7% at the jet momentum coefficient of 0.23. Although the power output increment of the CFJ wind turbine was large, the required jet momentum coefficient was too large, which led to difficulties in applications. Therefore, it is meaningful to develop a novel CFJ strategy that can achieve a large performance enhancement of the wind turbine at a small jet momentum coefficient.
In order to further explore the performance improvement effects of CFJ technology on the wind turbine airfoil, it is necessary to further carry out research to obtain CFJ technology strategies that can simultaneously improve the maximum lift coefficient and corrected lift-to-drag ratio of wind turbine airfoil. Based on the accumulated research experiences, the injection location and jet momentum coefficient of CFJ technology have significant influence on the performance improvement of S809 airfoil. Therefore, under the condition that other parameters of CFJ technology remain unchanged, the effects of the injection location and jet momentum coefficient on the performance of S809 airfoil are explored in the wider value ranges using the CFD method. The optimum strategy of CFJ technology for improving the performance of the S809 airfoil is proposed. Moreover, the performance enhancement of the Phase VI wind turbine blade using the CFJ technology is also explored. The research results have significant reference value for the performance improvement of wind turbines.
2. Methodology
2.1. CFJ Airfoil Configuration Design
The S809 airfoil designed by the National Renewable Energy Laboratory (NREL) for the horizontal axis wind turbine blade is selected as the baseline airfoil. The NREL S809 airfoil has the maximum thickness of 21% and more detailed parameters can be found in [50].
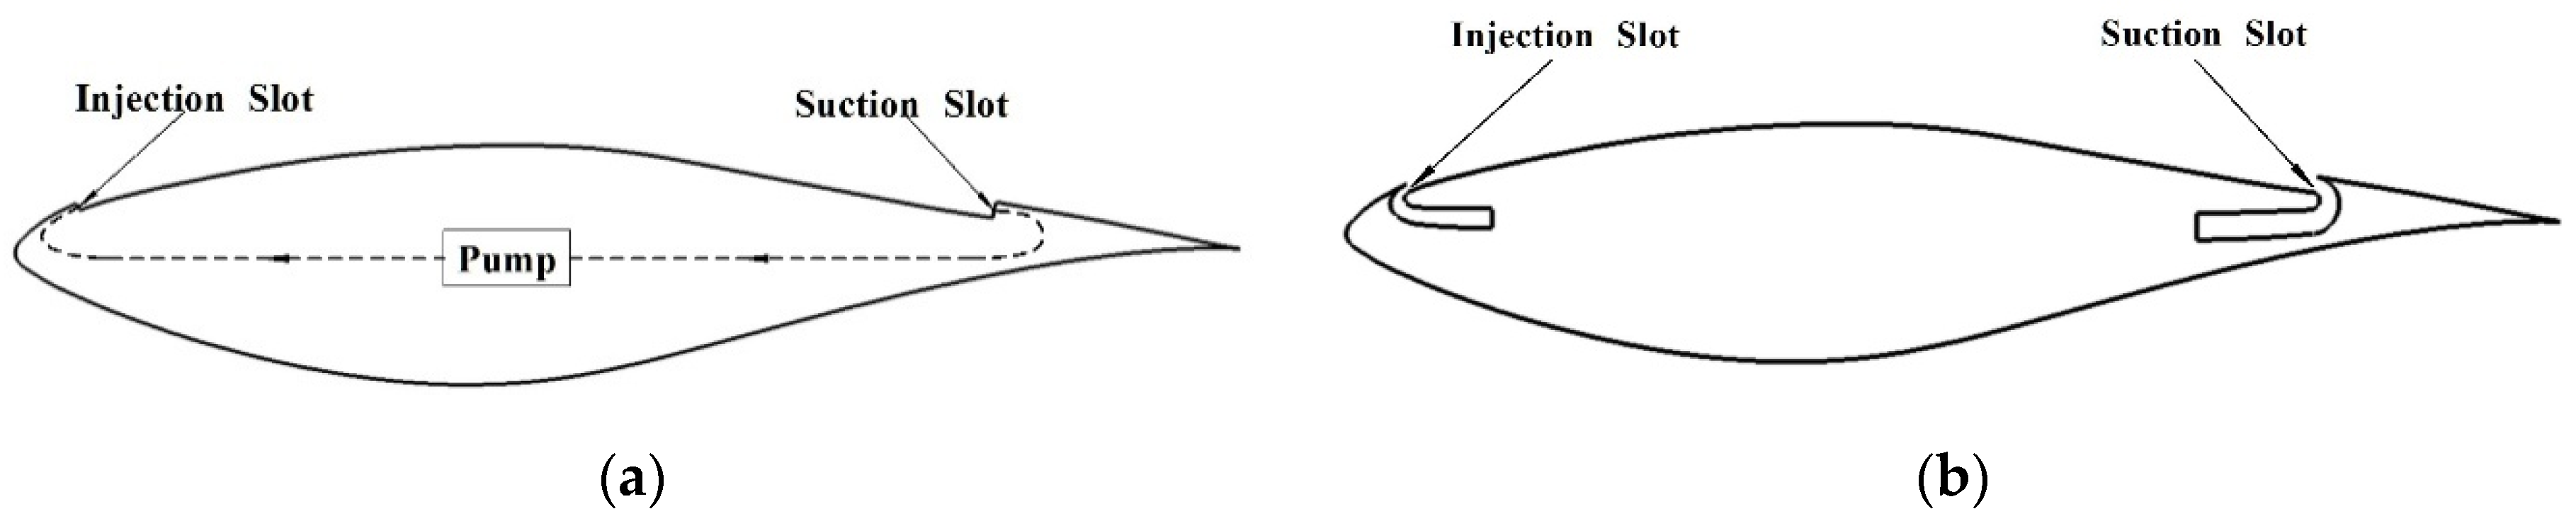
With reference to literature documentation [29,45,46], the NREL S809 CFJ airfoil is designed, as sketched in Figure 1a. The airfoil suction surface between the injection slot near the leading edge and suction slot near the trailing edge are translated downward to create these slots, and the translation distance is defined as the suction surface translation (SST). To achieve different size of the injection slot and suction slot, the portions of the airfoil suction surface near the injection slot and suction slot are reconstructed. The ducts near the injection slot and suction slot are included in the computational model of the S809 CFJ airfoil to ensure the injection slot and suction slot possessing more realistic velocity profiles, as sketched in Figure 1b. A small amount of mass flow is pressurized by the pump inside the airfoil and injected into the main flow through the injection slot. Meanwhile, the same amount of mass flow is sucked in through the suction slot.
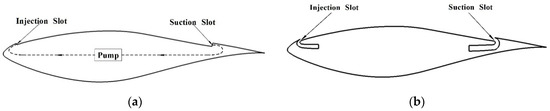
Figure 1.
(a) Schematic diagram of the S809 CFJ airfoil; (b) computational model of the S809 CFJ airfoil.
2.2. Numerical Methods
The Reynolds-Averaged Navier-Stokes (RANS) equations with the k-ω SST two-equation turbulence model are used in this research. The finite-volume method with second order spatial accuracy is utilized. HP MPI parallel computing technique is implemented to save the simulation time.
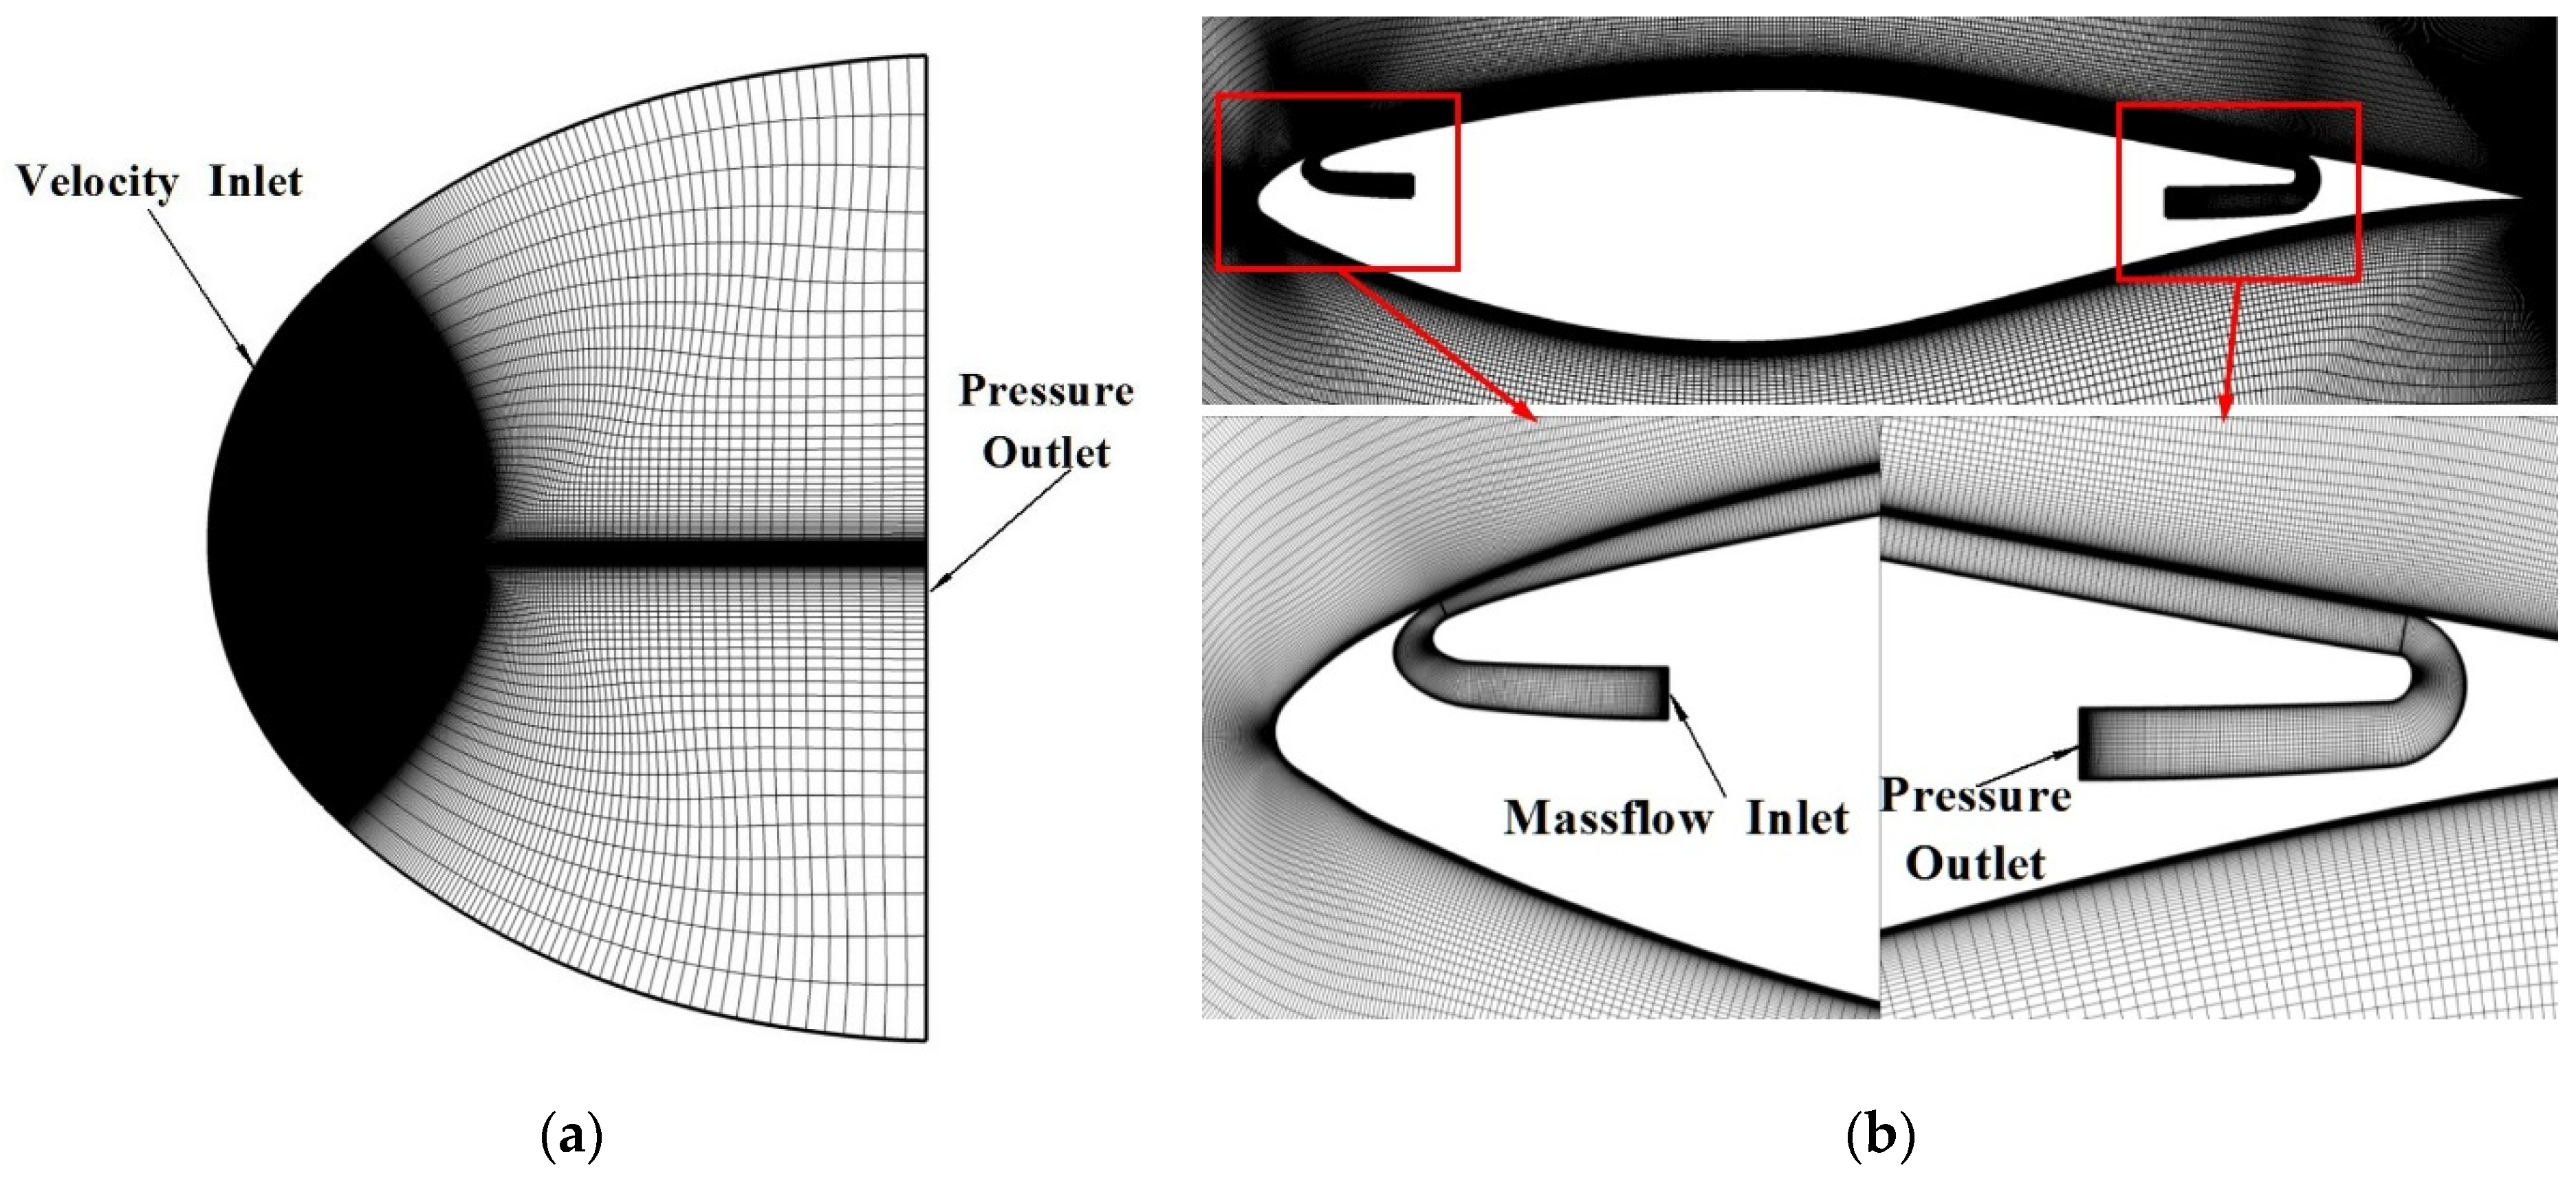
Considering the sharp trailing edge of the S809 airfoil, the C-type structured grid with the domain whose radius and length are 50 and 100 times of the chord length is adopted for the simulation, as shown in Figure 2. The velocity inlet is set as the inflow condition at the inlet boundary, and the pressure outlet is set as the outlet condition at the exit boundary. The massflow inlet is set as the injection condition, where the mass flow rate is specified. Meanwhile, the pressure outlet is set as the suction condition, where the pressure change is iterated to achieve the specified amount of mass flow. The no-slip wall boundaries are set at the solid surfaces of the airfoil and the duct.

Figure 2.
Computational grid and boundary conditions of the airfoil. (a) Overall grid; (b) close-up view of the S809 CFJ airfoil grid.
2.3. CFJ Airfoil Parameters
The jet intensity of the CFJ airfoil is evaluated using the jet momentum coefficient Cμ, which is defined as:
where is the injection mass flow rate, Vj and V∞ are the injection velocity and free-stream velocity respectively, ρ∞ is the free-stream density, and S is the reference area of the airfoil.
According to the reference [42,43], the power consumption and corresponding power coefficient required by the pump inside the CFJ airfoil are defined as:
where Cp denotes the specific heat capacity at the constant pressure, T0 indicates the total temperature, P01 and P02 imply the total pressure at the pump exit and inlet respectively, and γ is the specific heat ratio, which is equal to 1.4 for air. η is the pump efficiency, which is taken to be 1.0 in this study.
The conventional lift-to-drag ratio is defined as:
where CL and CD are respectively the lift coefficient and drag coefficient considering the jet reactionary force for the CFJ airfoil.
To take into account the influence of the power consumption on the aerodynamic performance of the CFJ airfoil, the corrected lift-to-drag ratio including the pump power is defined as [42,43]:
3. Results and Discussions
3.1. Baseline Simulation and Validation
The performance of S809 airfoil has been conducted in the low-turbulence wind tunnel of the Delft University of Technology Low Speed Laboratory at the free transition and fixed transition conditions, respectively [50]. As no transition model is used in the simulations, the experimental results at fixed transition condition by roughness at 0.02 c on the upper surface and 0.05 c at lower surface are selected to validate the numerical methods. Based on the experimental conditions, the Mach number 0.15 and Reynolds number 2.0 × 10⁶ are adopted for all cases in this study. The grid refinement study is carried out with three different grid resolutions, including a coarse grid of 1001 × 102, a medium grid of 1501 × 144 and a fine grid of 2001 × 176. The detailed parameters of the three grids are tabulated in Table 1.

Table 1.
Detailed parameters of the S809 airfoil grids (airfoil chord length = 600 mm).
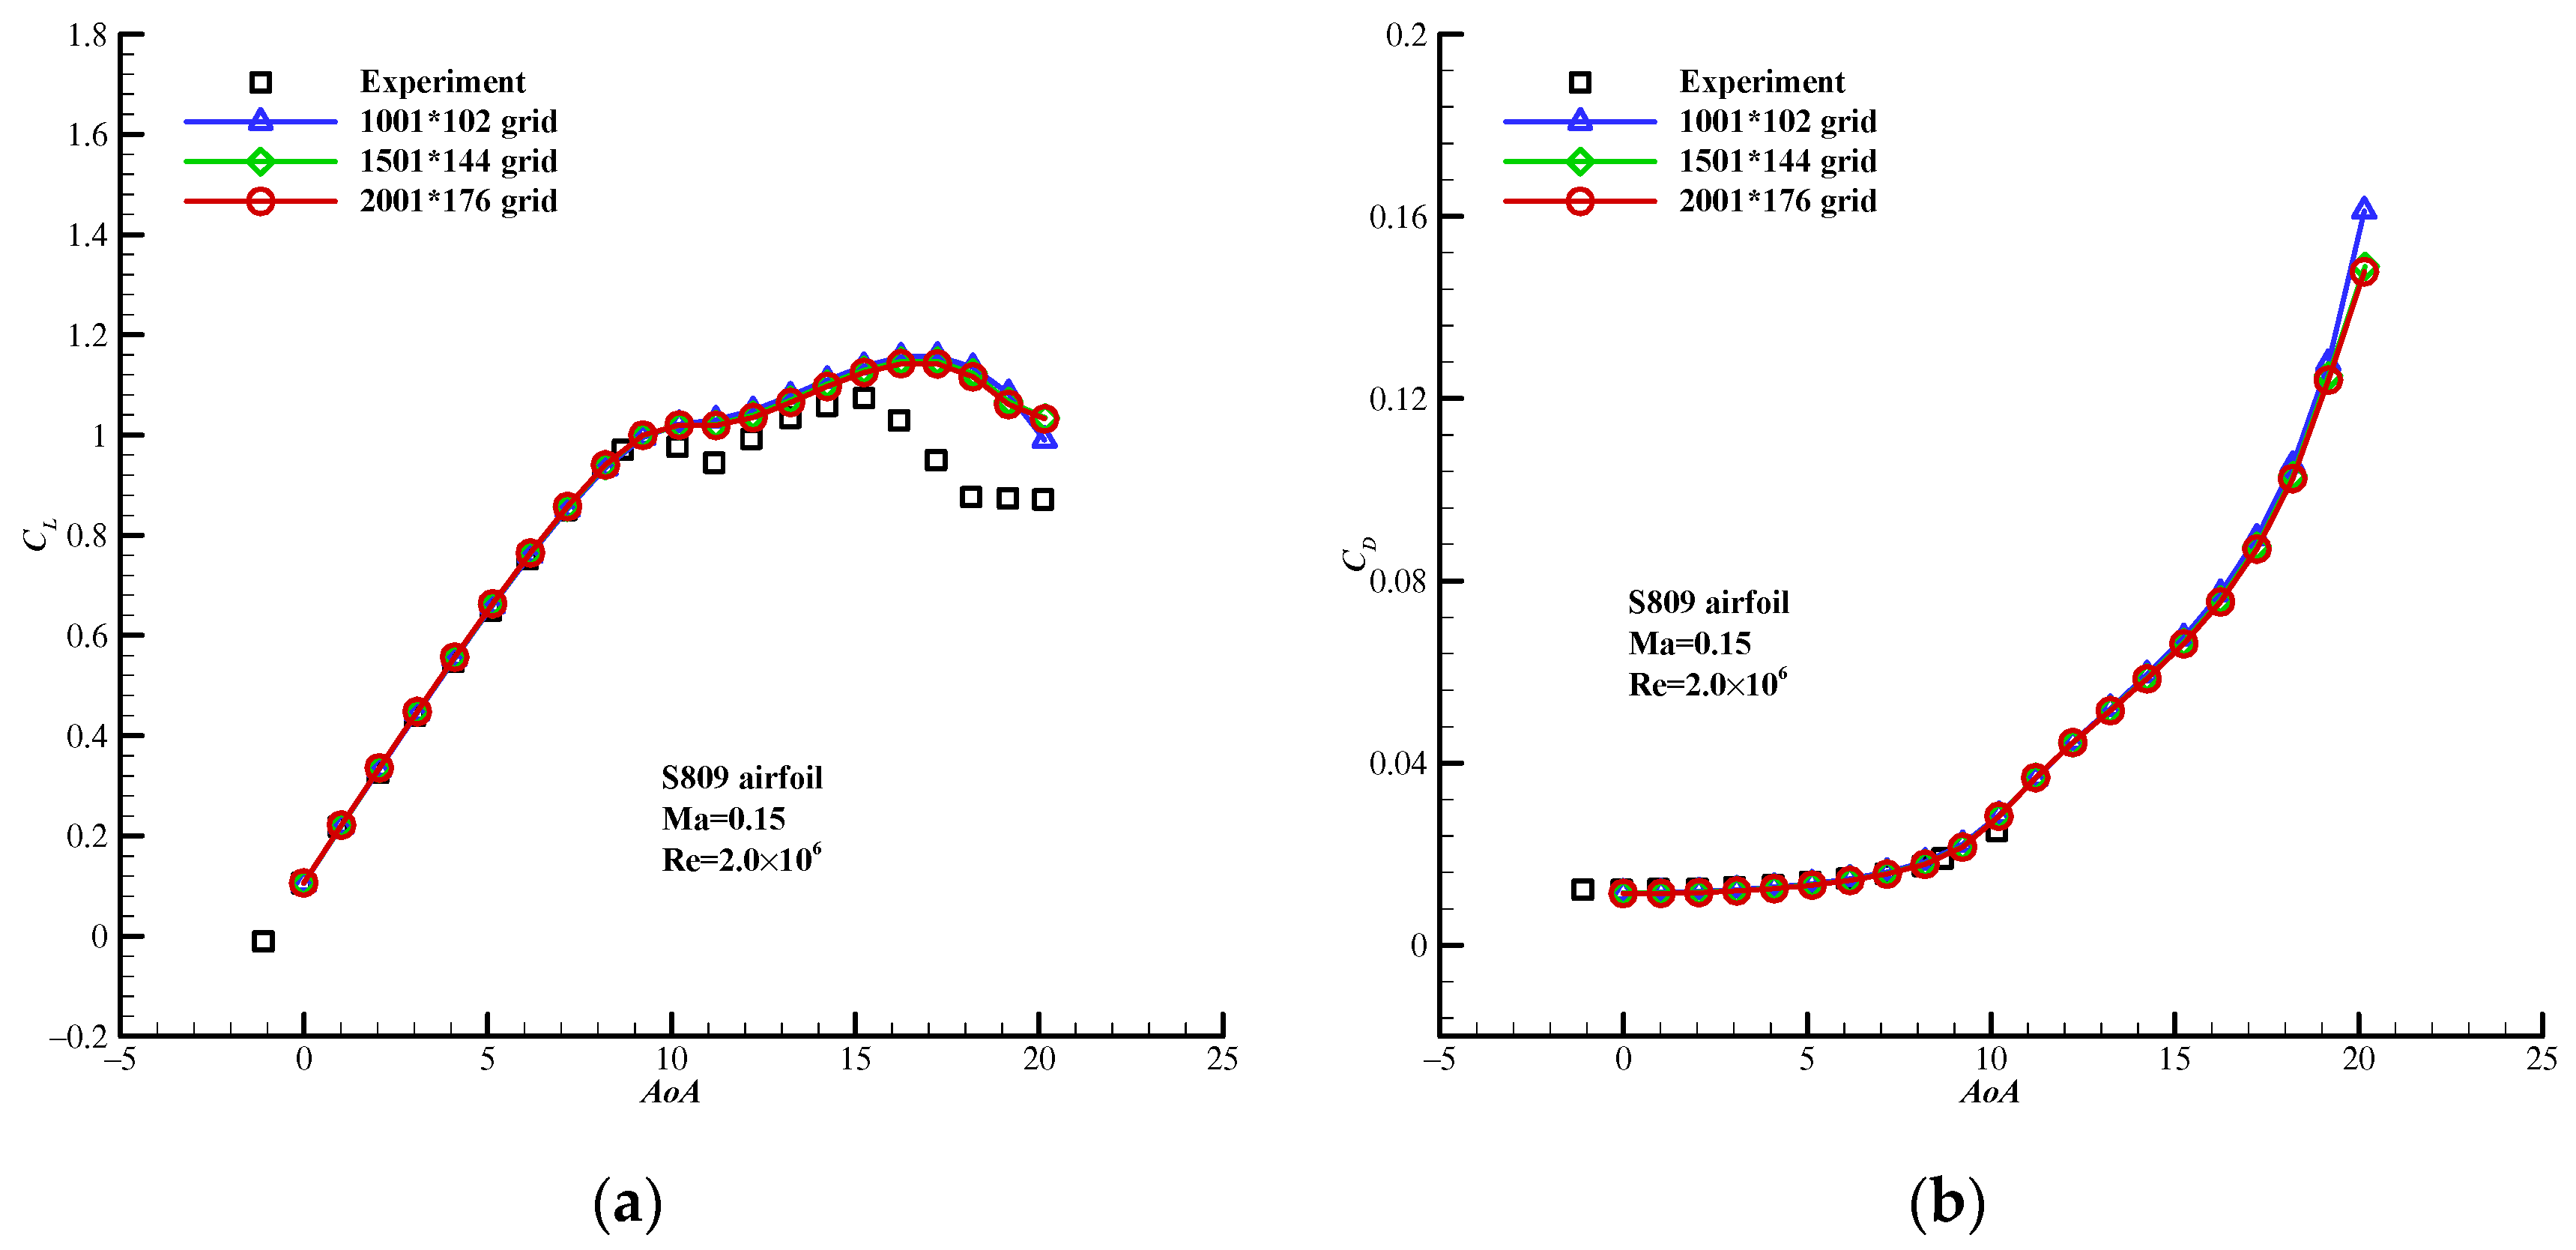
Figure 3 shows the aerodynamic coefficients comparisons of the experimental and numerical results with various grid resolutions. The numerical lift and drag coefficients agree well with the experimental results when the AoA is less than 10°. However, the numerical lift coefficients are slightly higher than experimental results when the AoA is above 10°. This discrepancy may be caused by the fact that all RANS models cannot predict the turbulence stress levels accurately in large separation zones.
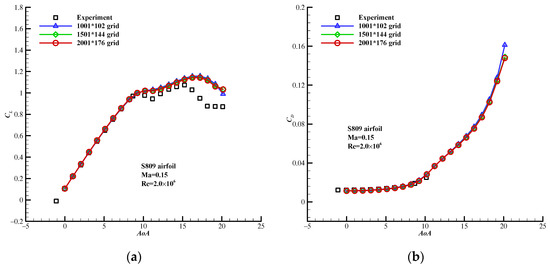
Figure 3.
Aerodynamic coefficients comparisons of the experimental and numerical results with various grid resolutions at Ma = 0.15, Re = 2.0 × 10⁶. (a) Lift coefficient; (b) drag coefficient.
The comparisons of aerodynamic coefficients with different grid resolutions at three typical AoAs are given in Table 2. When AoA is 0°, the finer the grid, the closer the lift coefficient is to the experimental result while the drag coefficient is the opposite. But the error of drag coefficients using the coarse and medium grid is merely 1.1%. Furthermore, for the drag coefficients and lift coefficients, the differences between the medium and fine grid are very small. The same conclusions about the lift coefficients can be drawn when AoA is 8.2° and 12.22°. But the finer the grid, the closer the drag coefficient is to the experimental result when AoA is 8.2°. There is no experimental data of drag coefficient when AoA is 12.22° and the drag coefficients using the three grids are close to each other. Thus, by compromising between the computational complexity and accuracy, the medium grid of 1501 × 144 is used in this paper.
Table 2.
S809 airfoil aerodynamic coefficients comparisons between simulations and experiments (Ma = 0.15, Re = 2.0 × 10⁶).
3.2. Effect of the Injection Location
The injection slot size, suction slot size and suction surface translation are fixed to 0.65% chord, 1.33% chord and 1.43% chord, respectively. The suction location is fixed to the 80% chord-wise location from the leading edge and the Cμ is fixed to 0.04. The injection location varies from a 1% chord-wise location to a 20% chord-wise location from the leading edge. Effects of six injection locations with the 1%, 5%, 9%, 13%, 17%, and 20% chord-wise locations, as illustrated in Figure 4, on the performance of S809 CFJ airfoil are investigated.
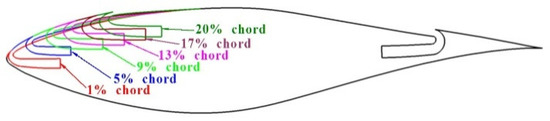
Figure 4.
S809 CFJ airfoils with various injection locations.
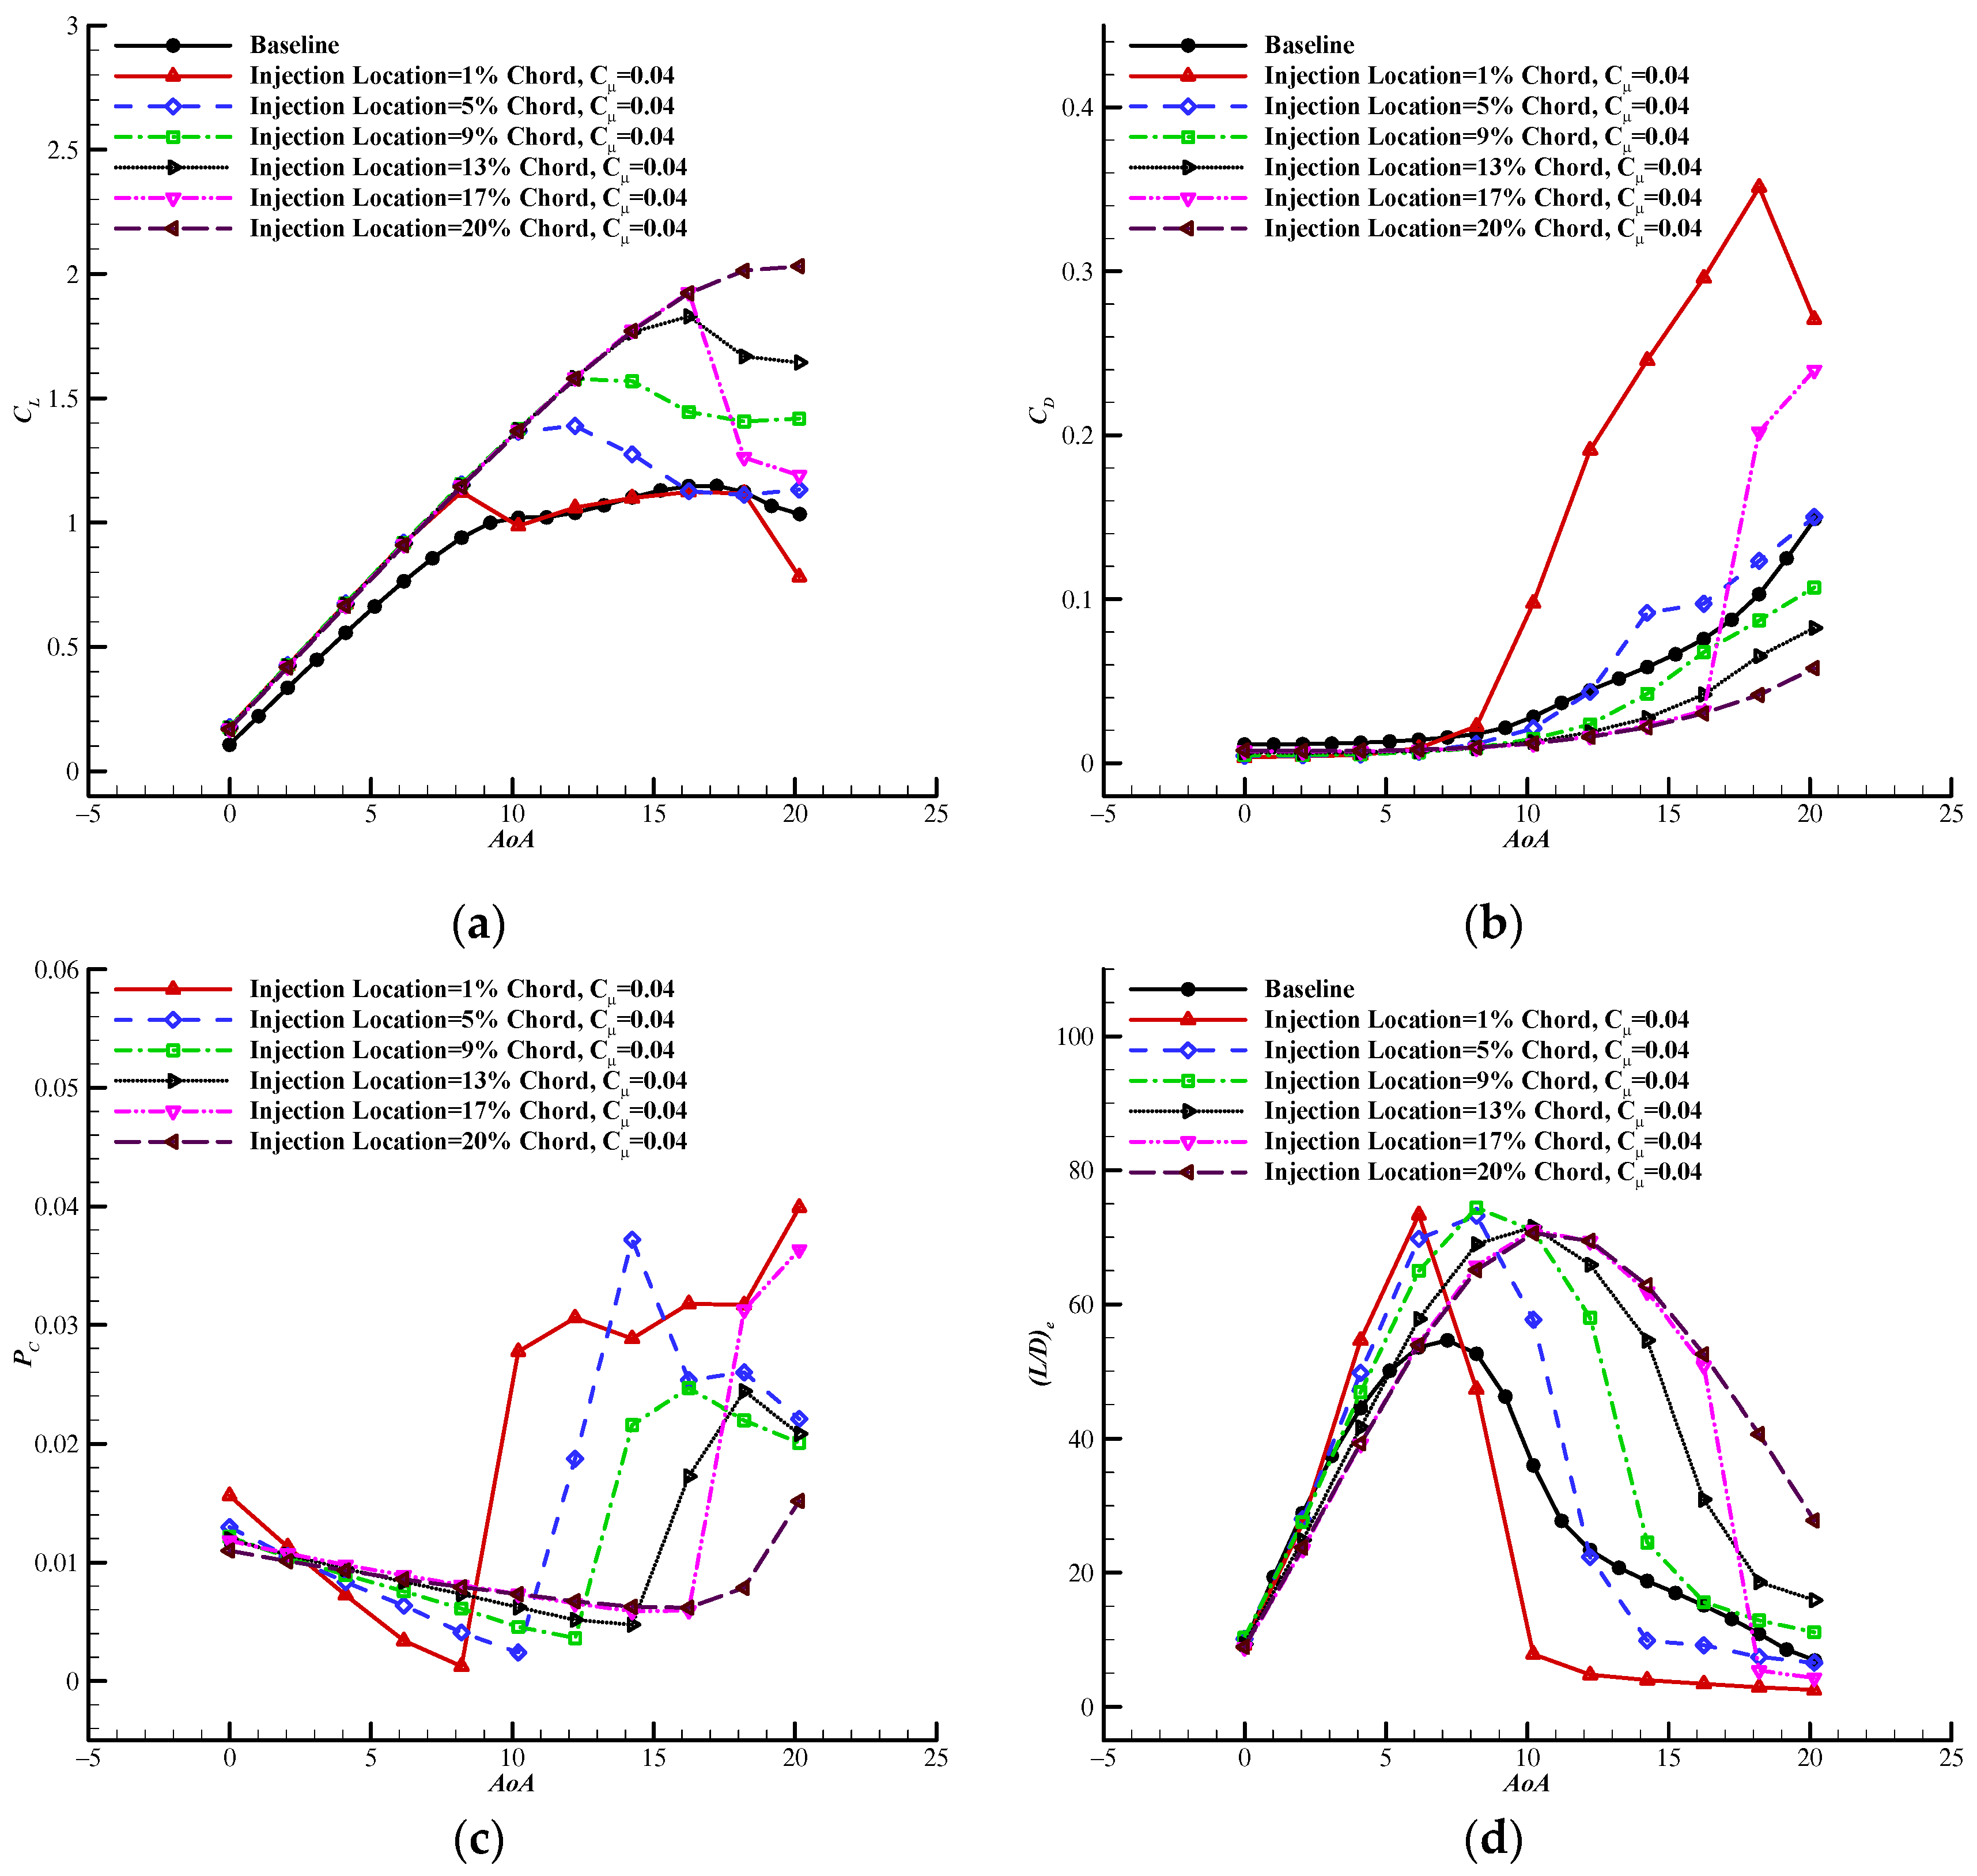
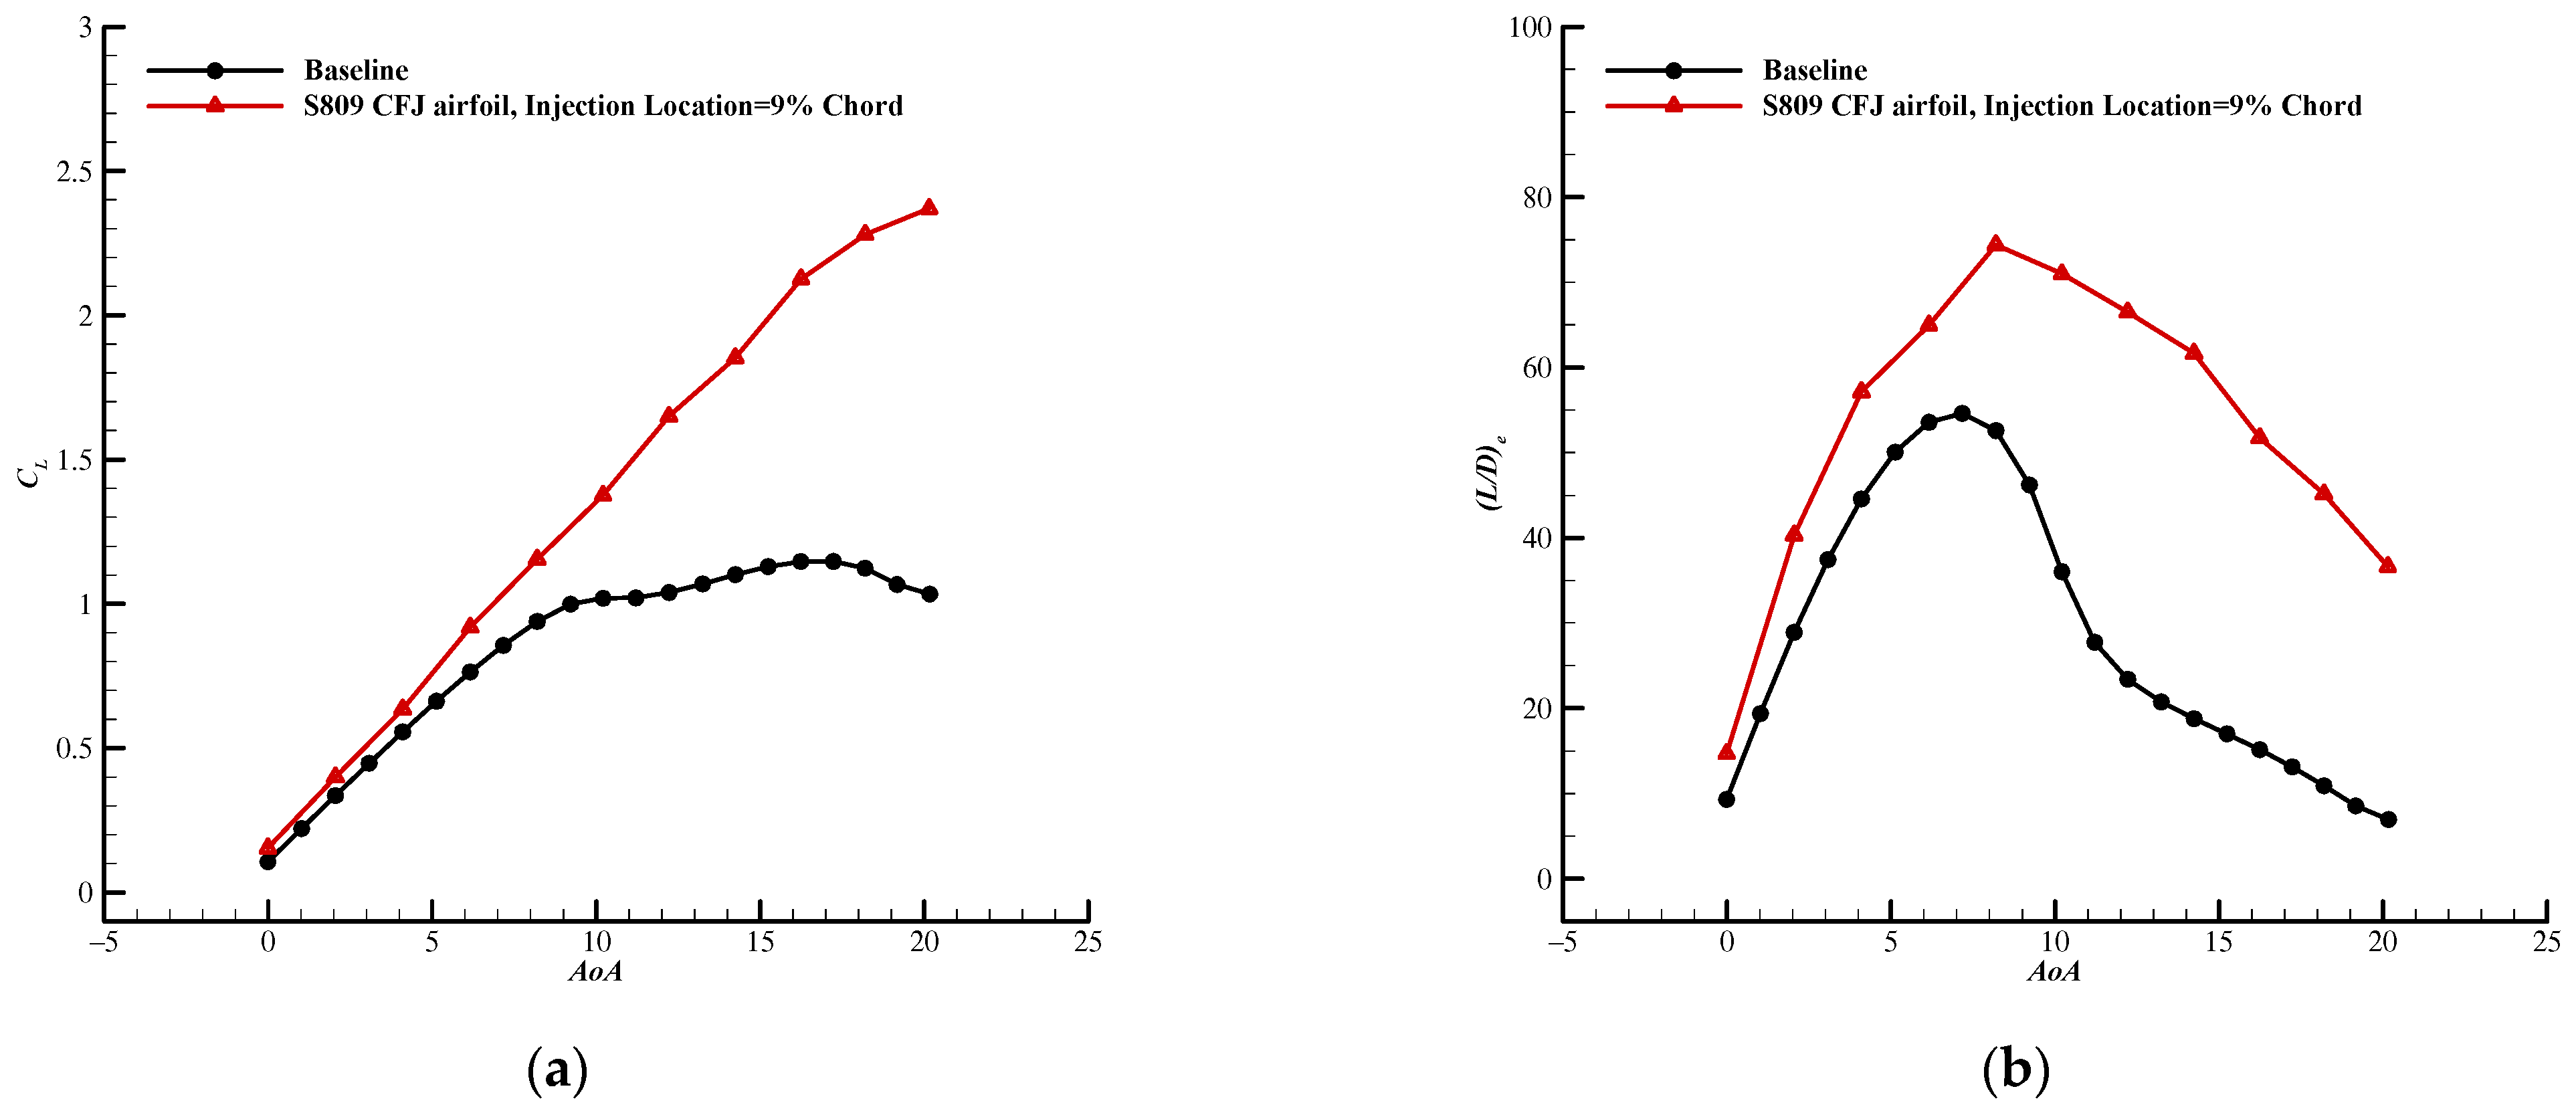
Figure 5 presents aerodynamic coefficients comparisons of S809 CFJ airfoils with various injection locations. When the AoA is below 8.2°, the lift and drag coefficients of S809 CFJ airfoils with various injection locations are almost the same. As the injection slot is moved downstream, the power consumption coefficient decreased when the AoA is below 2.02° and increased when the AoA is between 2.02° and 8.2°. Thus, when the AoA is below 8.2°, the corrected lift-to-drag ratio of S809 CFJ airfoil increased as the injection slot is moved upstream. But at the large AoA, the more downstream the injection location, the better the lift characteristic of S809 CFJ airfoil, resulting in the better corrected lift-to-drag ratio of S809 CFJ airfoil. The lift curves of S809 CFJ airfoils with the 17% and 20% chord-wise injection locations almost coincide expect that the AoA is above 16.24°. The curvature of the suction surface of the S809 airfoil at the 1% chord-wise location is larger than those at other chord-wise locations. The adverse pressure gradient region of the suction surface is near 1% chord-wise location at high angle of attack. When the injection slot of S809 CFJ airfoil is located at 1% chord-wise location, more energies are needed to overcome the adverse pressure gradient. Meanwhile, the existence of the injection destroys the smoothness of the suction surface of the S809 airfoil, which will cause the separation point to move upstream and the separation region to become larger when stall occurs. The more upstream the injection, the greater the fluence on the smoothness of the suction surface. Therefore, when the S809 CFJ airfoil with the 1% chord-wise injection location stalls at the AoA of 8.2°, the jet momentum coefficient of 0.04 is not enough to overcome the large adverse pressure gradient and the drag is suddenly increased. Table 3 presents the maximum lift coefficients and maximum lift-to-drag ratios of S809 CFJ airfoils with various injection locations. As the injection slot is moved downstream, the maximum lift coefficient is increased. The range of corrected lift-to-drag ratio increment of S809 CFJ airfoil with various injection locations is between 29.3% and 36.2% when compared with the baseline. When the injection slot is at the 1% chord-wise location, the maximum lift coefficient and maximum lift-to-drag ratio of S809 CFJ airfoil are 2.6% lower and 34.3% higher than that of the baseline, respectively. The S809 CFJ airfoil with the 9% chord-wise injection location has the optimum maximum corrected lift-to-drag ratio, which is 36.2% higher than that of the baseline. The S809 CFJ airfoil with the 20% chord-wise injection location has the optimum maximum lift coefficient, which is 76.5% higher than that of the baseline.

Figure 5.
Aerodynamic coefficients comparisons of the S809 CFJ airfoils with various injection locations (Cμ = 0.04). (a) Lift coefficient; (b) drag coefficient; (c) power coefficient; (d) corrected lift-to-drag ratio.
Table 3.
Maximum lift coefficients and maximum lift-to-drag ratios of S809 CFJ airfoils with various injection locations (Cμ = 0.04).
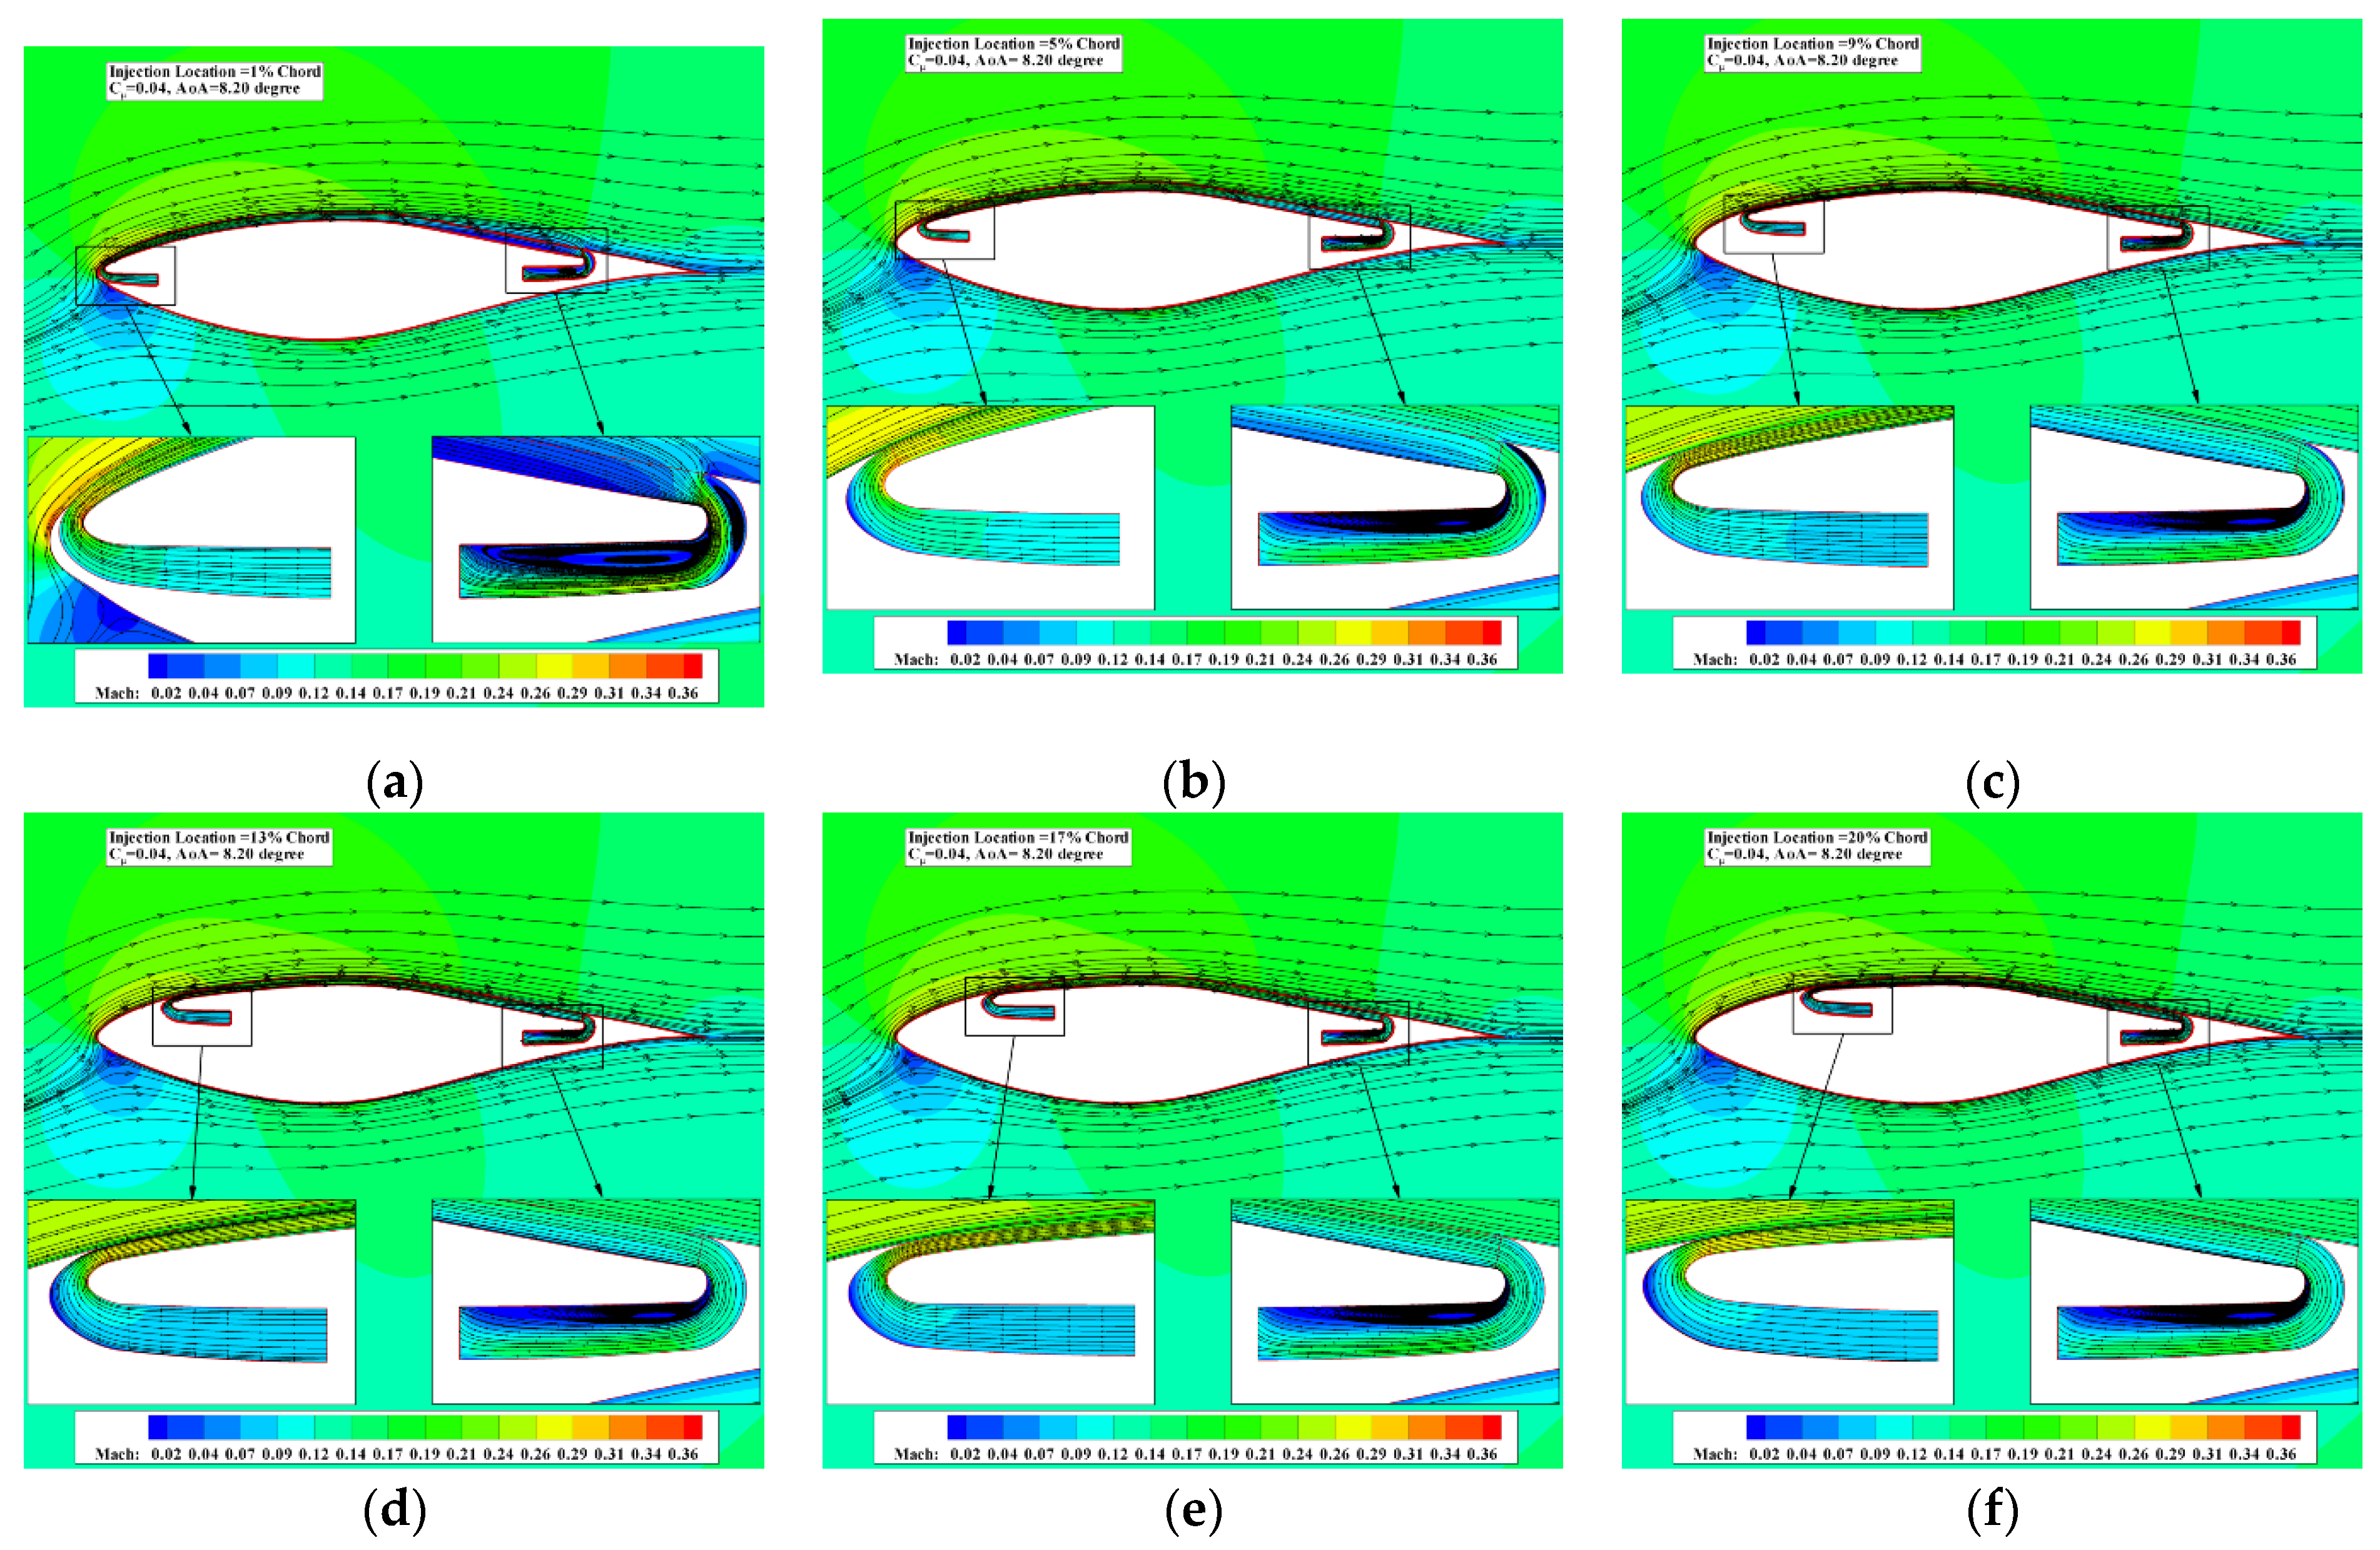
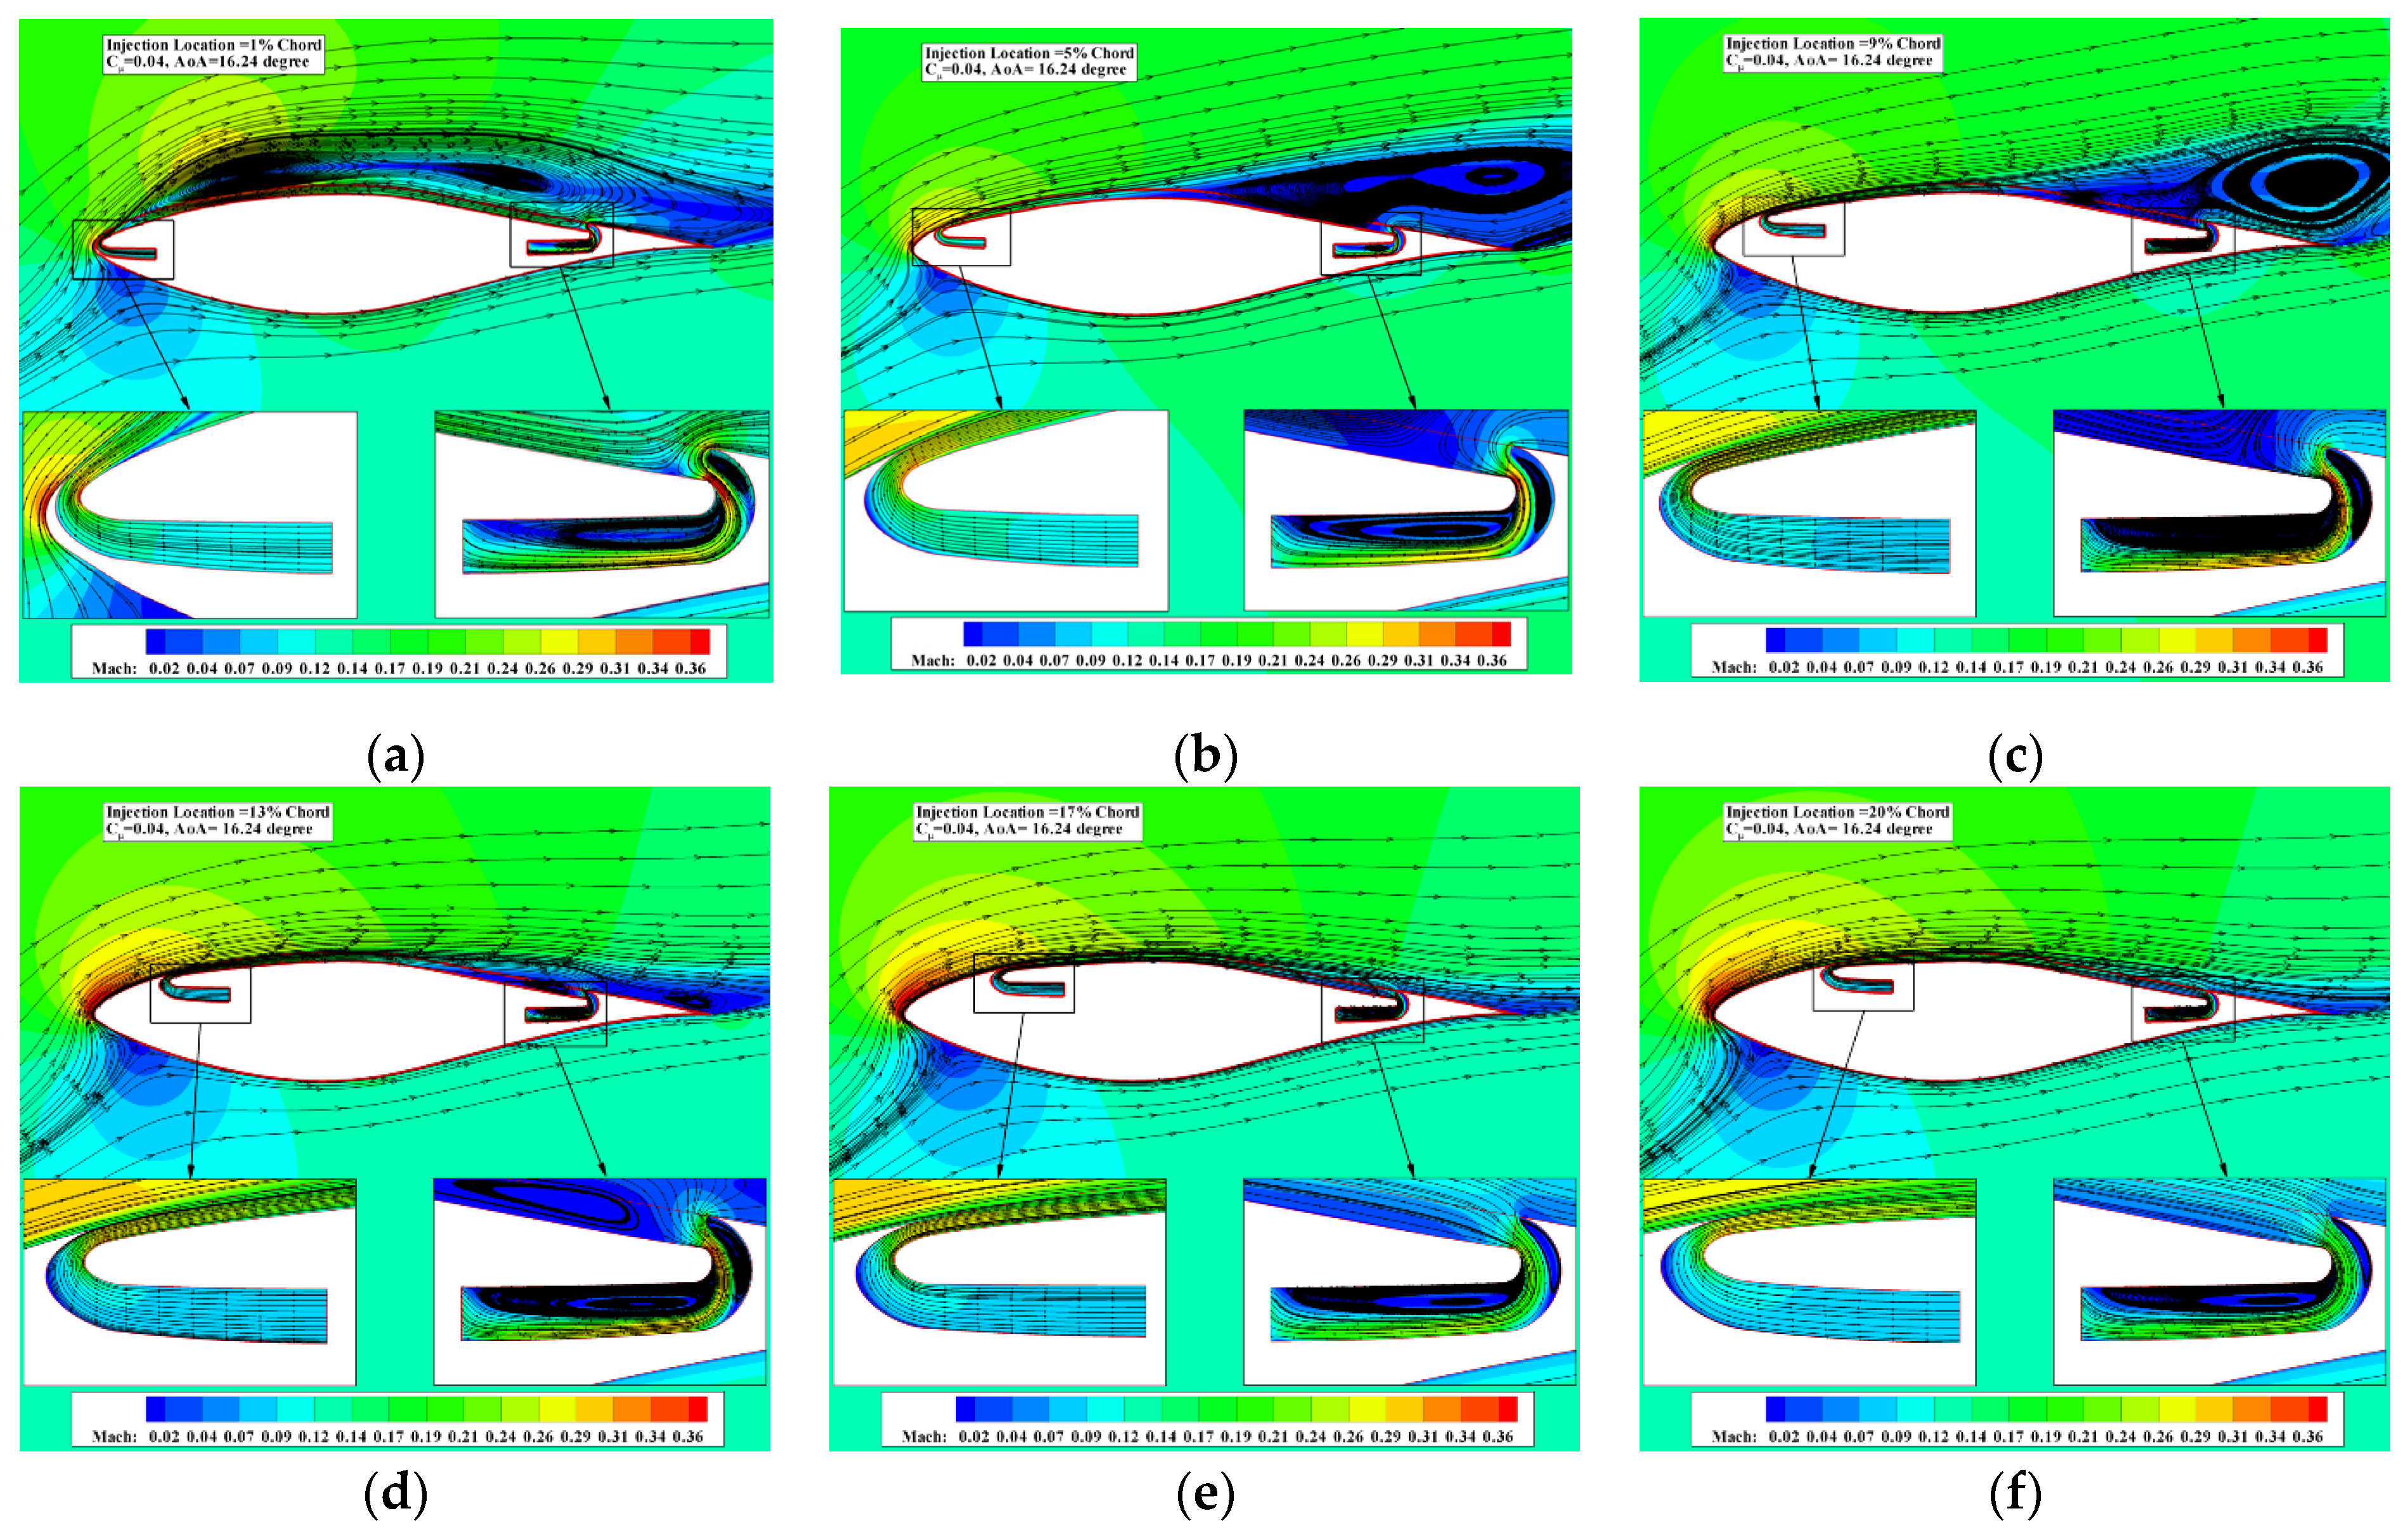
Figure 6 and Figure 7 show the Mach number contours and streamlines of S809 CFJ airfoils with various injection locations when the AoAs are 8.2° and 16.24°, respectively. It can be seen that at 8.2° AoA, the flows of S809 CFJ airfoils with various injection locations are attached. The high local Mach number region of S809 CFJ airfoil is near the leading edge. Thus, the closer the injection location is to the leading edge, the easier it is for the mass flow to be injected into the main flow and the less the energy is consumed. This is why the S809 CFJ airfoil with the injection location near the leading edge has low power consumption coefficient and high corrected lift-to-drag ratio at the small AoA. At 16.24° AoA, the large flow separations appear on the suction surfaces of S809 CFJ airfoils with the 1%, 5%, and 9% chord-wise injection locations, but the flows of S809 CFJ airfoils with the 13%, 17%, and 20% chord-wise injection locations are attached. The separation region is large and the separation point is near the leading edge at 16.24° AoA. When the injection location is close to the leading edge, the injection location is too close to the adverse pressure gradient region and the jet energy of S809 CFJ airfoil with 0.04 Cμ is not enough to suppress the flow separation, and most of the jet energy is converted into heat. When the injection slot is moved downstream, the injection location is near the vortex core and it is easier to inject the jet energy into the main flow to suppress the large flow separation.
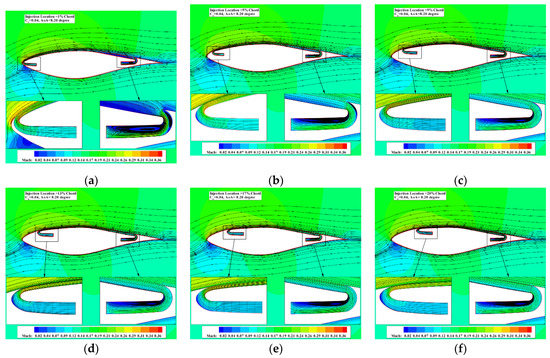
Figure 6.
Mach number contours and streamlines of S809 CFJ airfoils with various injection locations (Cμ = 0.04 and AoA = 8.2°). (a) Injection location = 1% chord; (b) injection location = 5% chord; (c) injection location = 9% chord; (d) injection location = 13% chord; (e) injection location = 17% chord; (f) injection location = 20% chord.

Figure 7.
Mach number contours and streamlines of S809 CFJ airfoils with various injection locations (Cμ = 0.04 and AoA = 16.24°). (a) Injection location = 1% chord; (b) injection location = 5% chord; (c) injection location = 9% chord; (d) injection location = 13% chord; (e) injection location = 17% chord; (f) injection location = 20% chord.
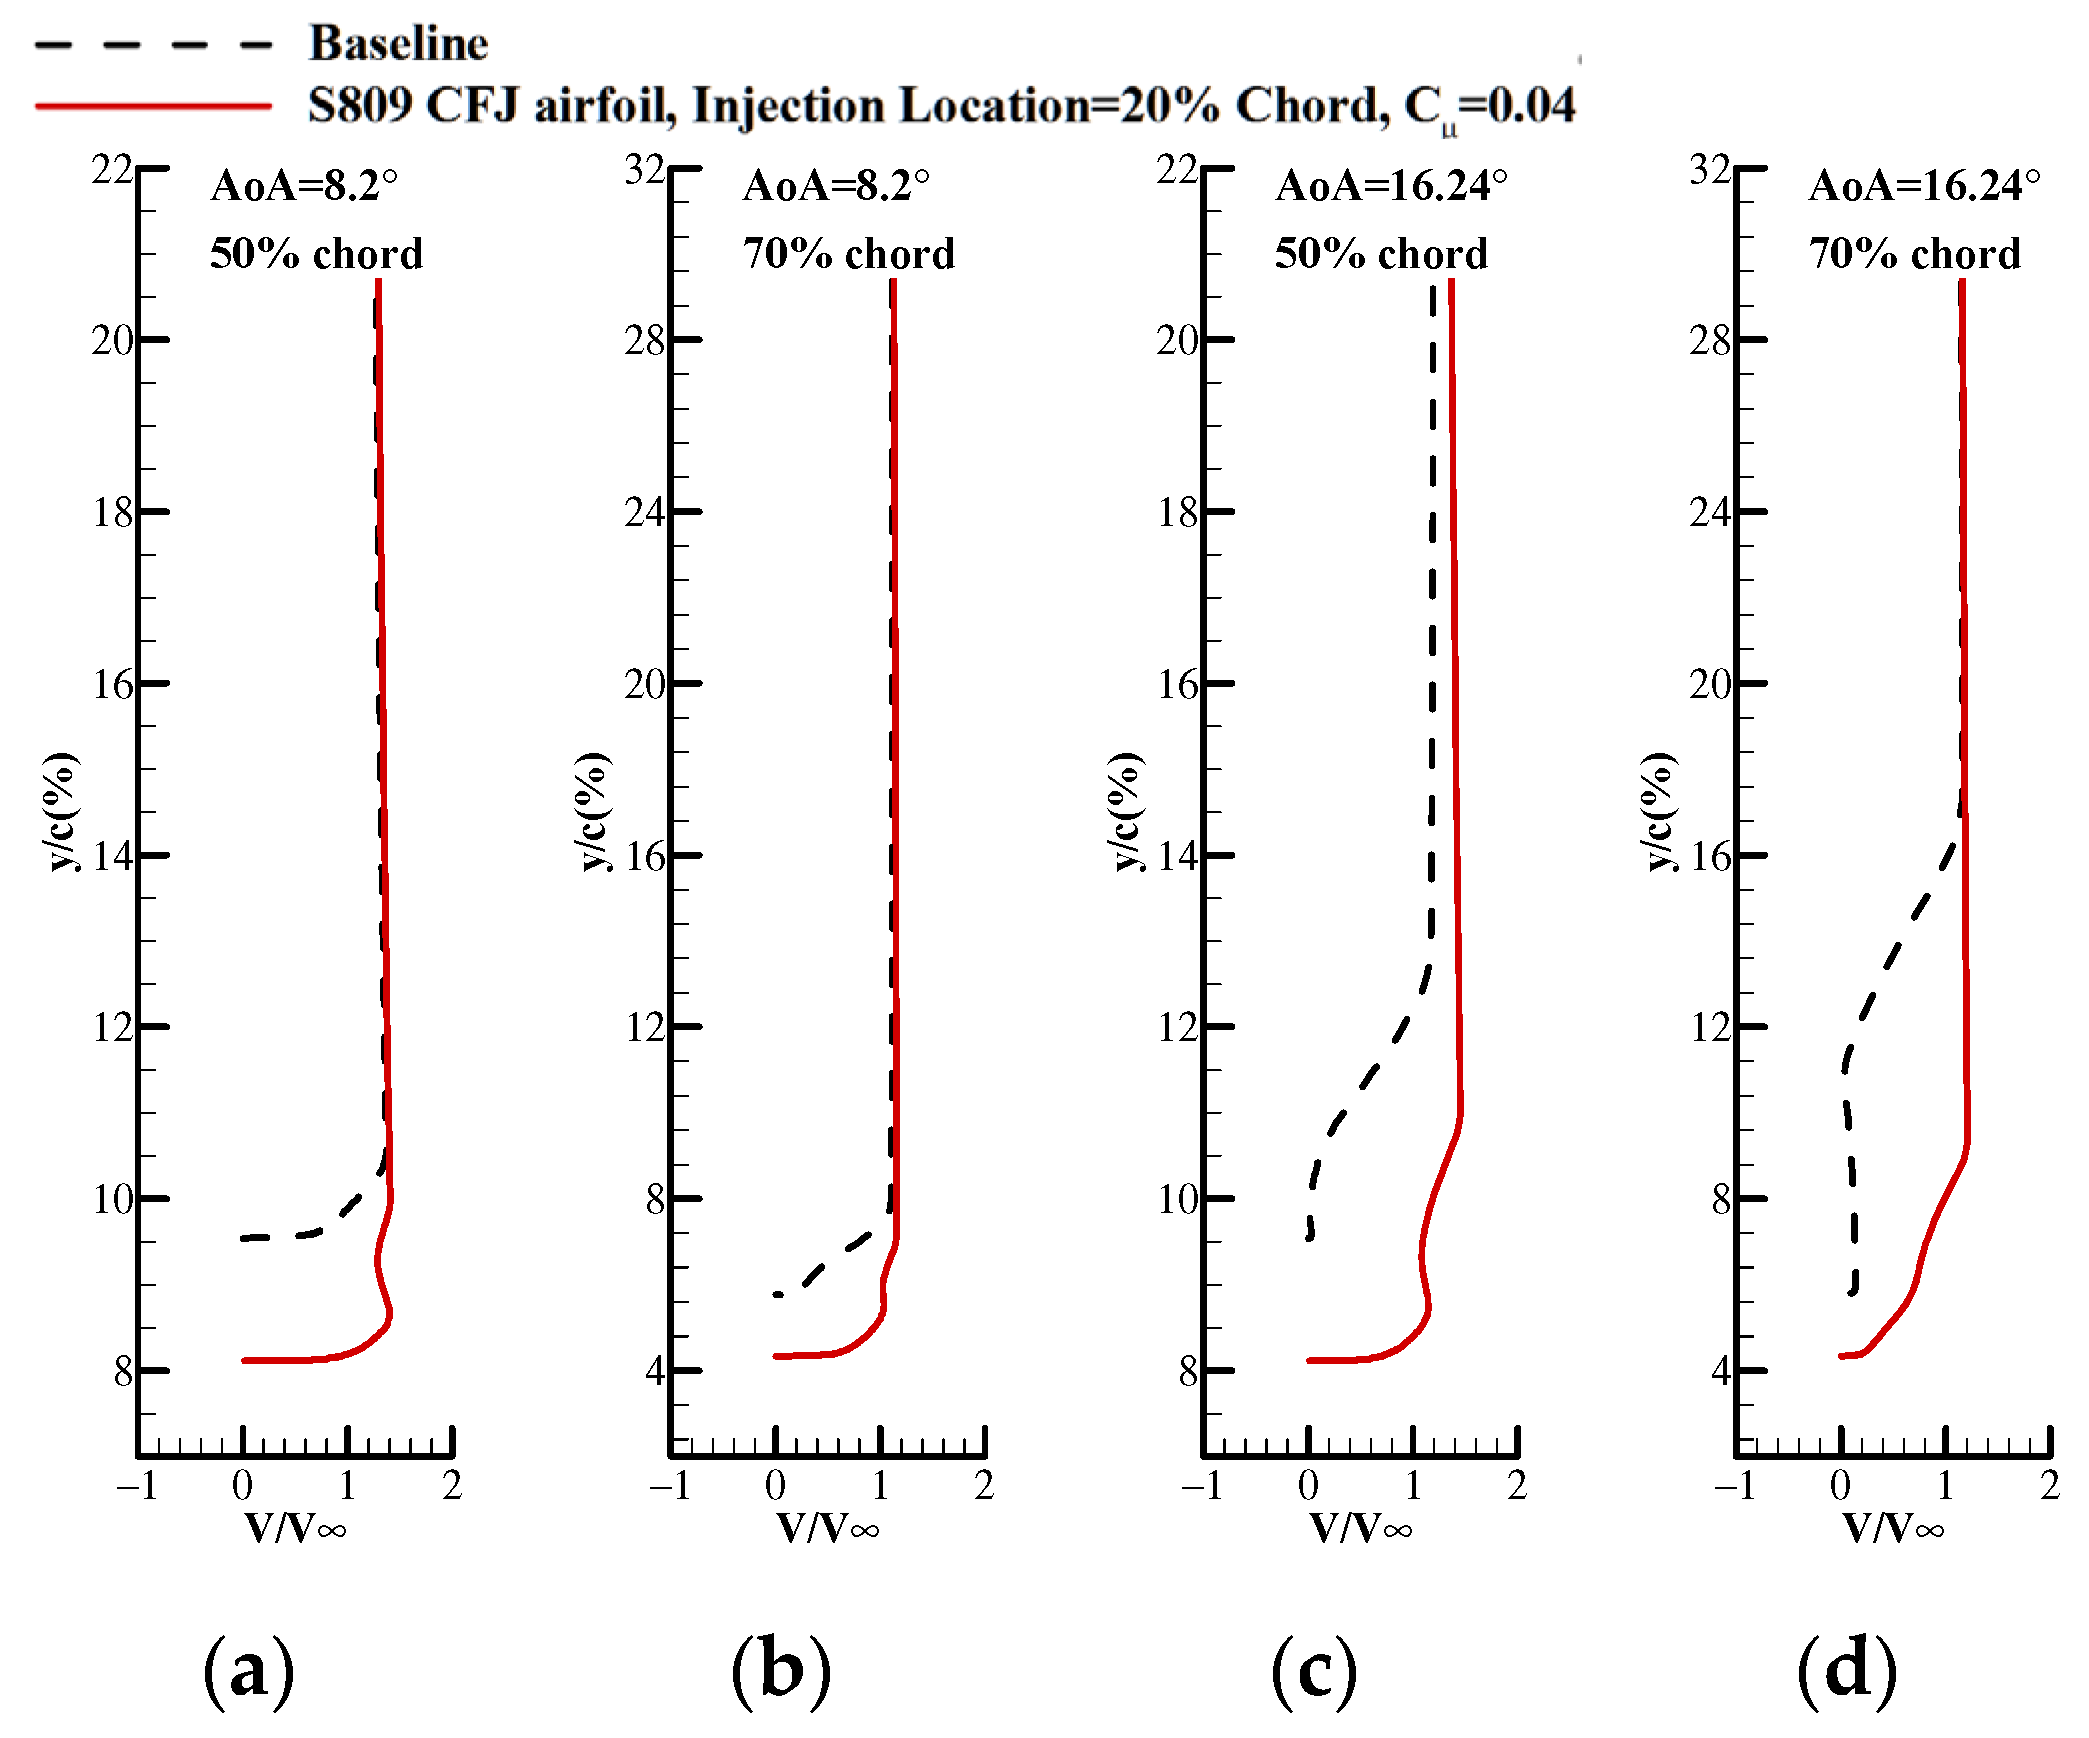
In order to more intuitively characterize the performance enhancement of the CFJ technology on the S809 airfoil, the surface pressure coefficient distributions comparisons and velocity profiles comparisons of the baseline and S809 CFJ airfoil are implemented, as shown in Figure 8 and Figure 9. It is obvious to find that CFJ technology can greatly increase the peak of negative pressure at the leading edge of the S809 airfoil, and the negative pressure region is expanded especially when the AoA is 16.24°. Therefore, the lift coefficient of the S809 airfoil can be significantly enhanced by the CFJ technology. In Figure 9, the variable of x-axis is the dimensionless velocity near the suction surface of the airfoils, and the variable of y-axis is the distance from the suction surface given in the percent chord length. The velocity profiles of the baseline and S809 CFJ airfoil at the 50% and 70% chord-wise locations when the AoAs are 8.2° and 16.24 are taken perpendicular to suction surface of the airfoil. It can be seen that when AoA is 8.2°, no separation occurs in the boundary layers of the baseline and S809 CFJ airfoil, but the velocity profiles of S809 CFJ airfoil are fuller than those of the baseline. When AoA is 16.24°, large separations occur in the boundary layer of the baseline, while the flow in the boundary layer of the S809 CFJ airfoil is still attached because the jet energy is injected into the main flow.
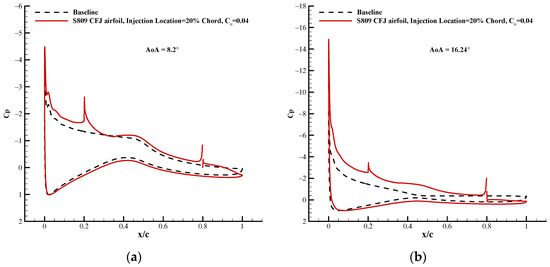
Figure 8.
Comparisons of surface pressure coefficient distributions of the baseline and S809 CFJ airfoil with 20% chord-wise injection location (Cμ = 0.04). (a) AoA = 8.2°; (b) AoA = 16.24°.
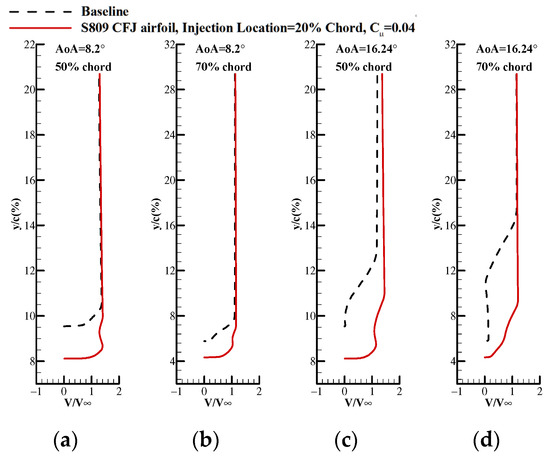
Figure 9.
Comparisons of velocity profiles near the suction surfaces of the baseline and S809 CFJ airfoil with 20% chord-wise injection location (Cμ = 0.04). (a) AoA = 8.2°, 50% chord-wise location; (b) AoA = 8.2°, 70% chord-wise location; (c) AoA = 16.24°, 50% chord-wise location; (d) AoA = 16.24°, 70% chord-wise location.
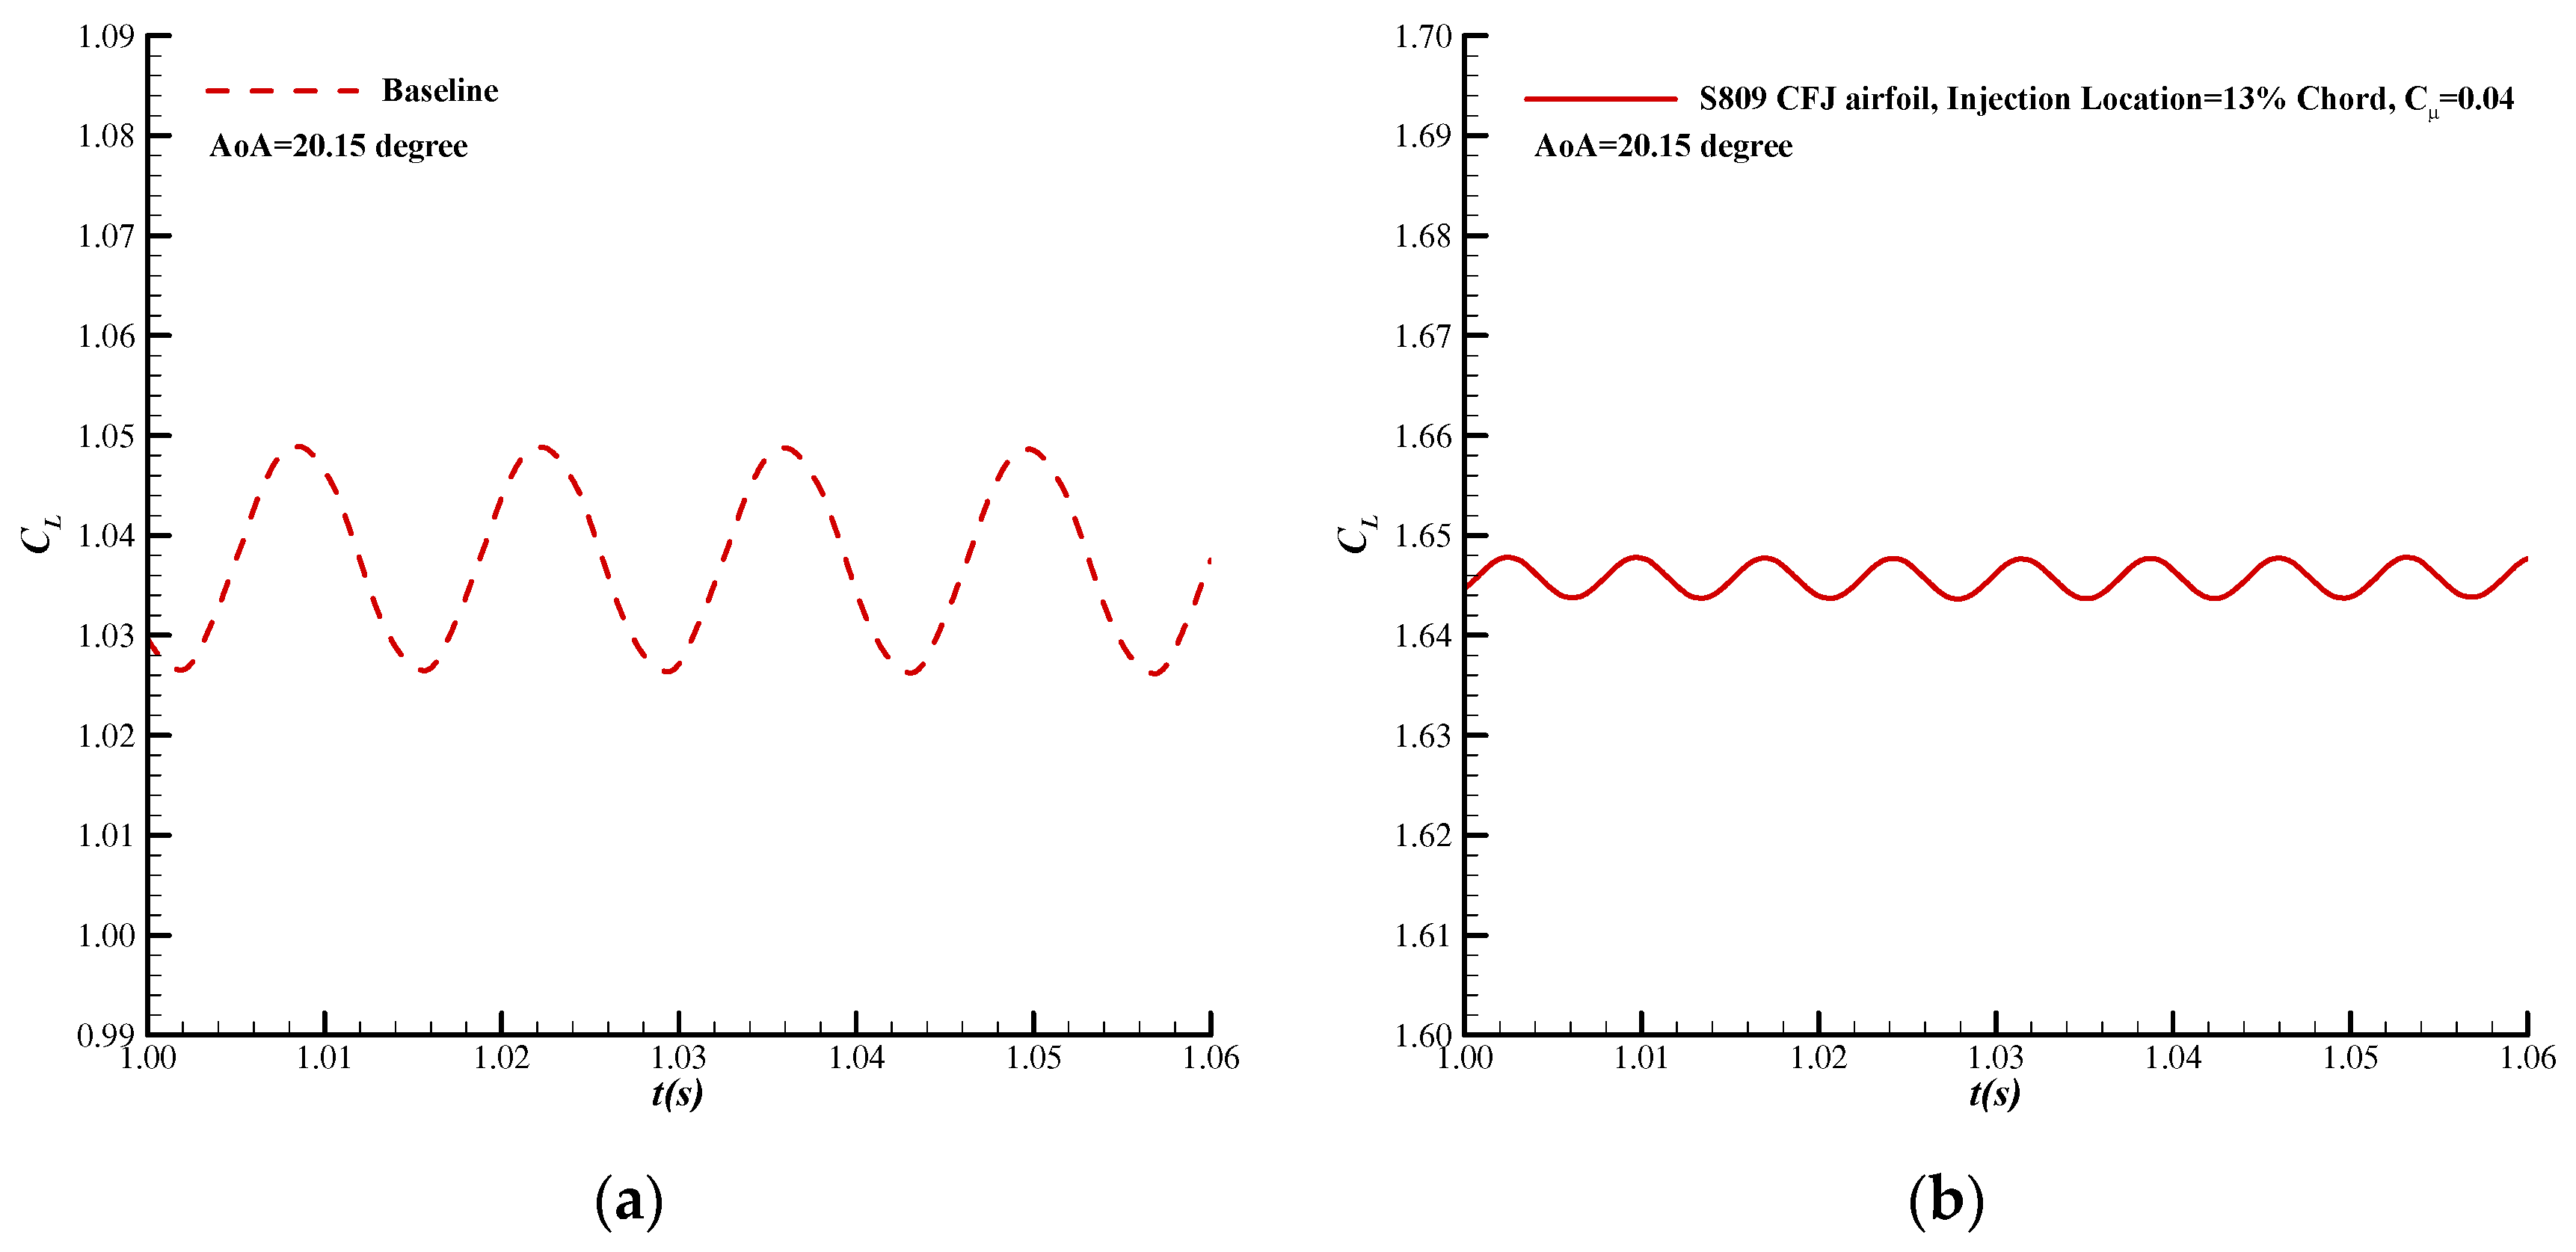
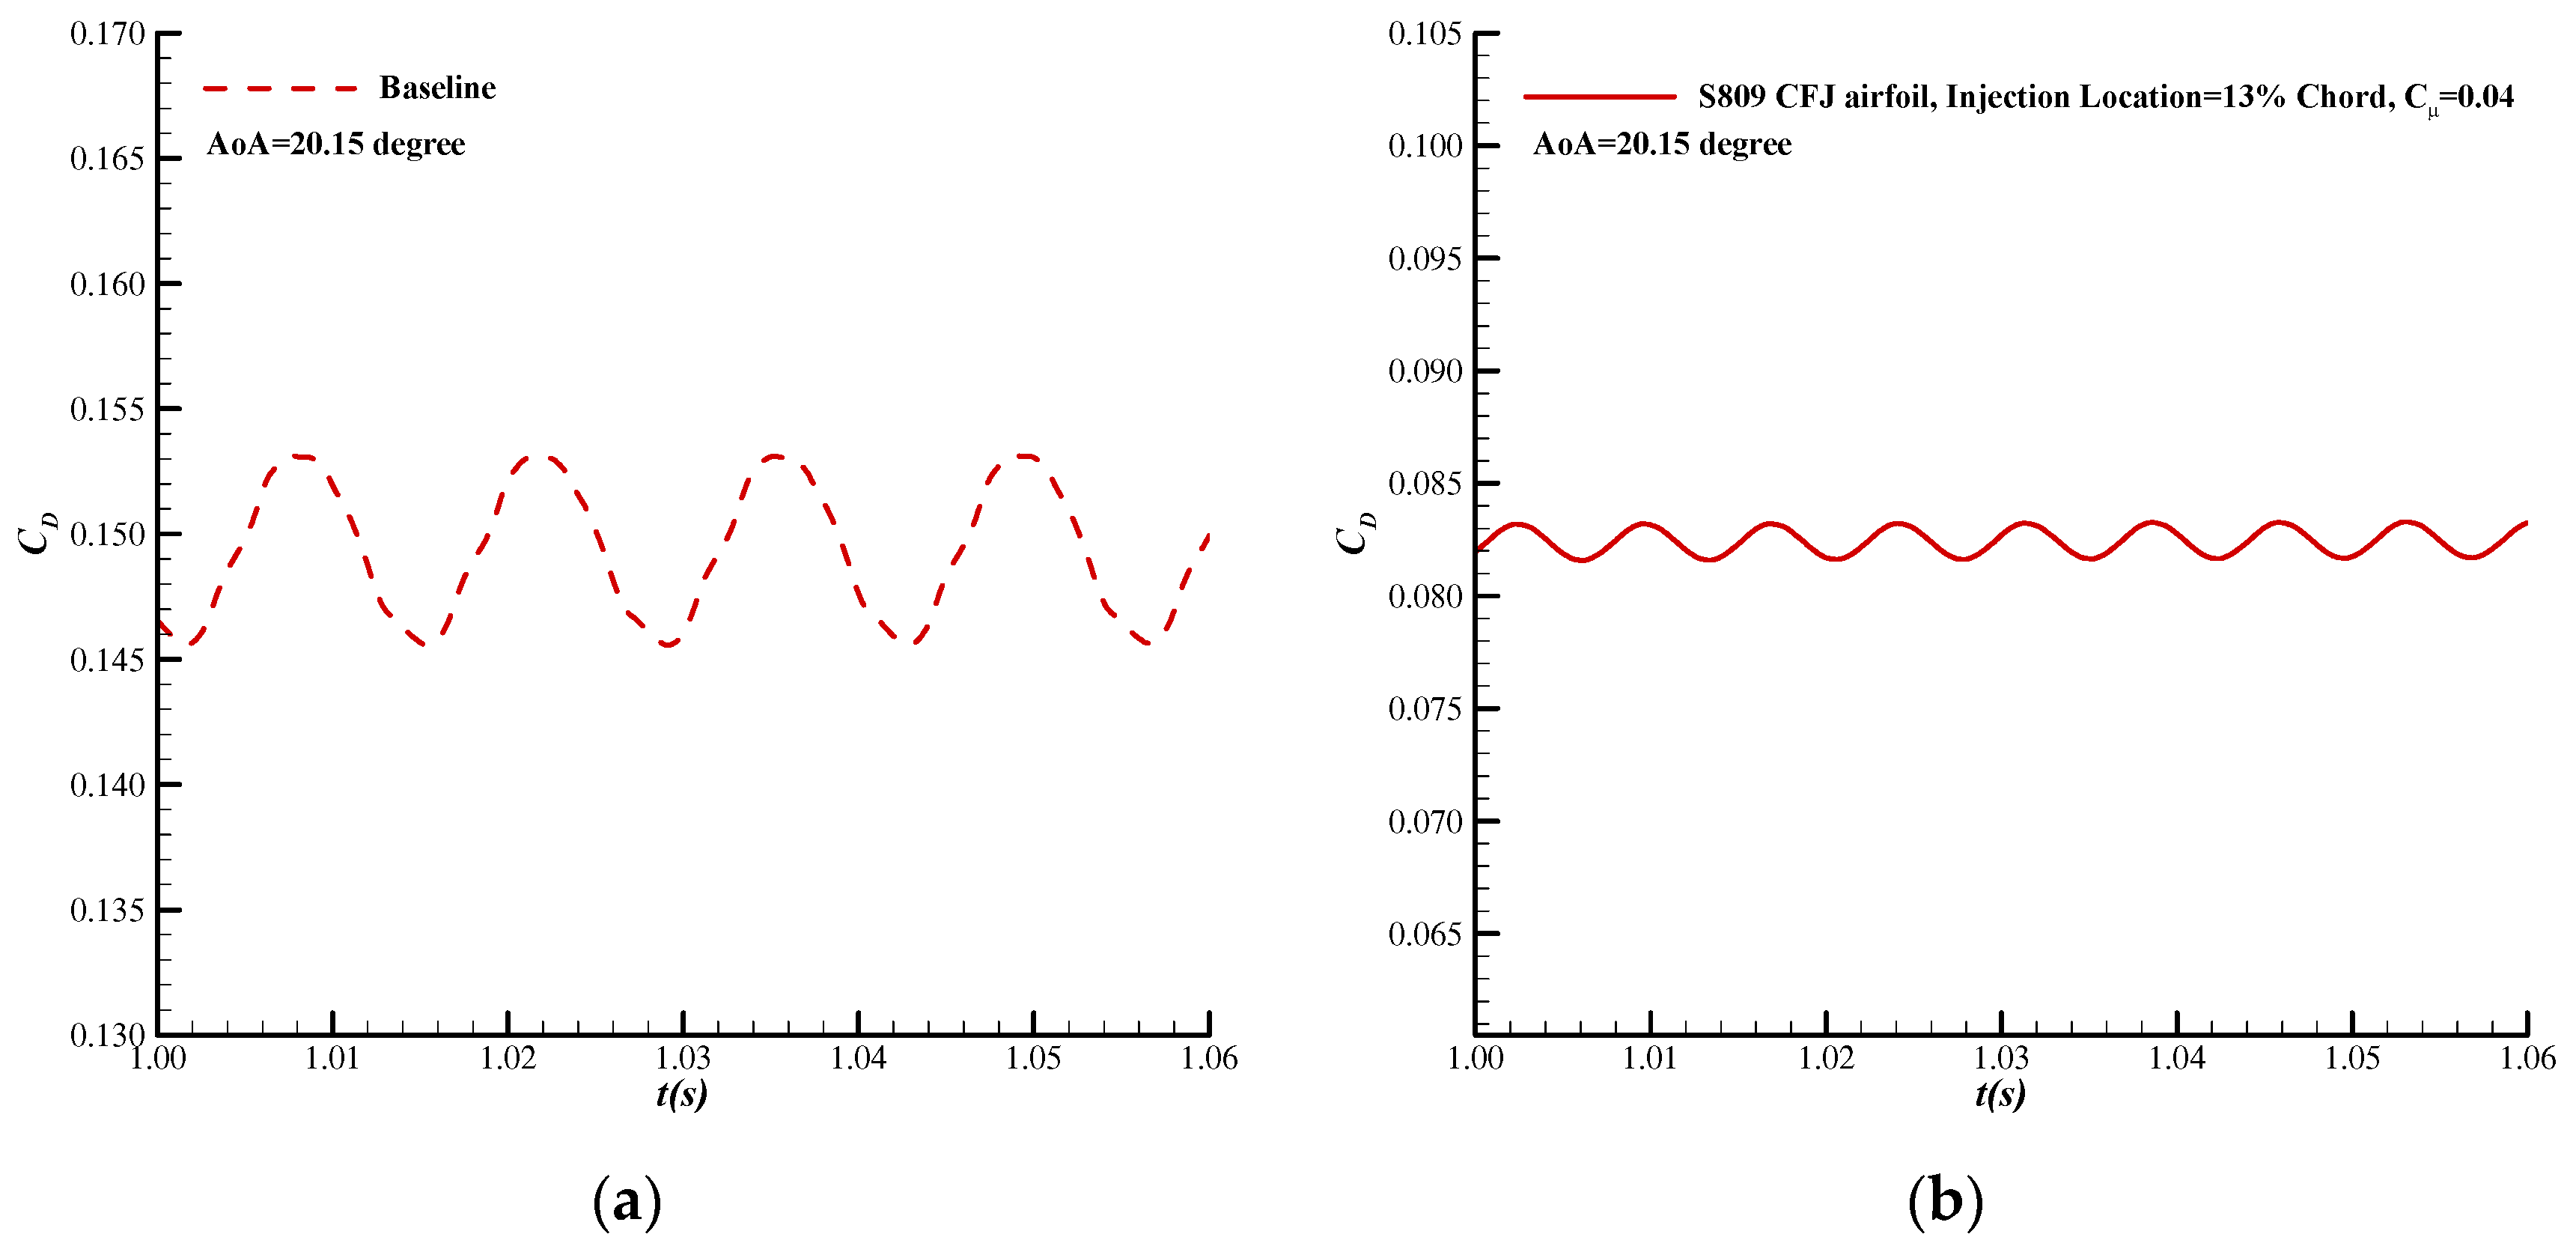
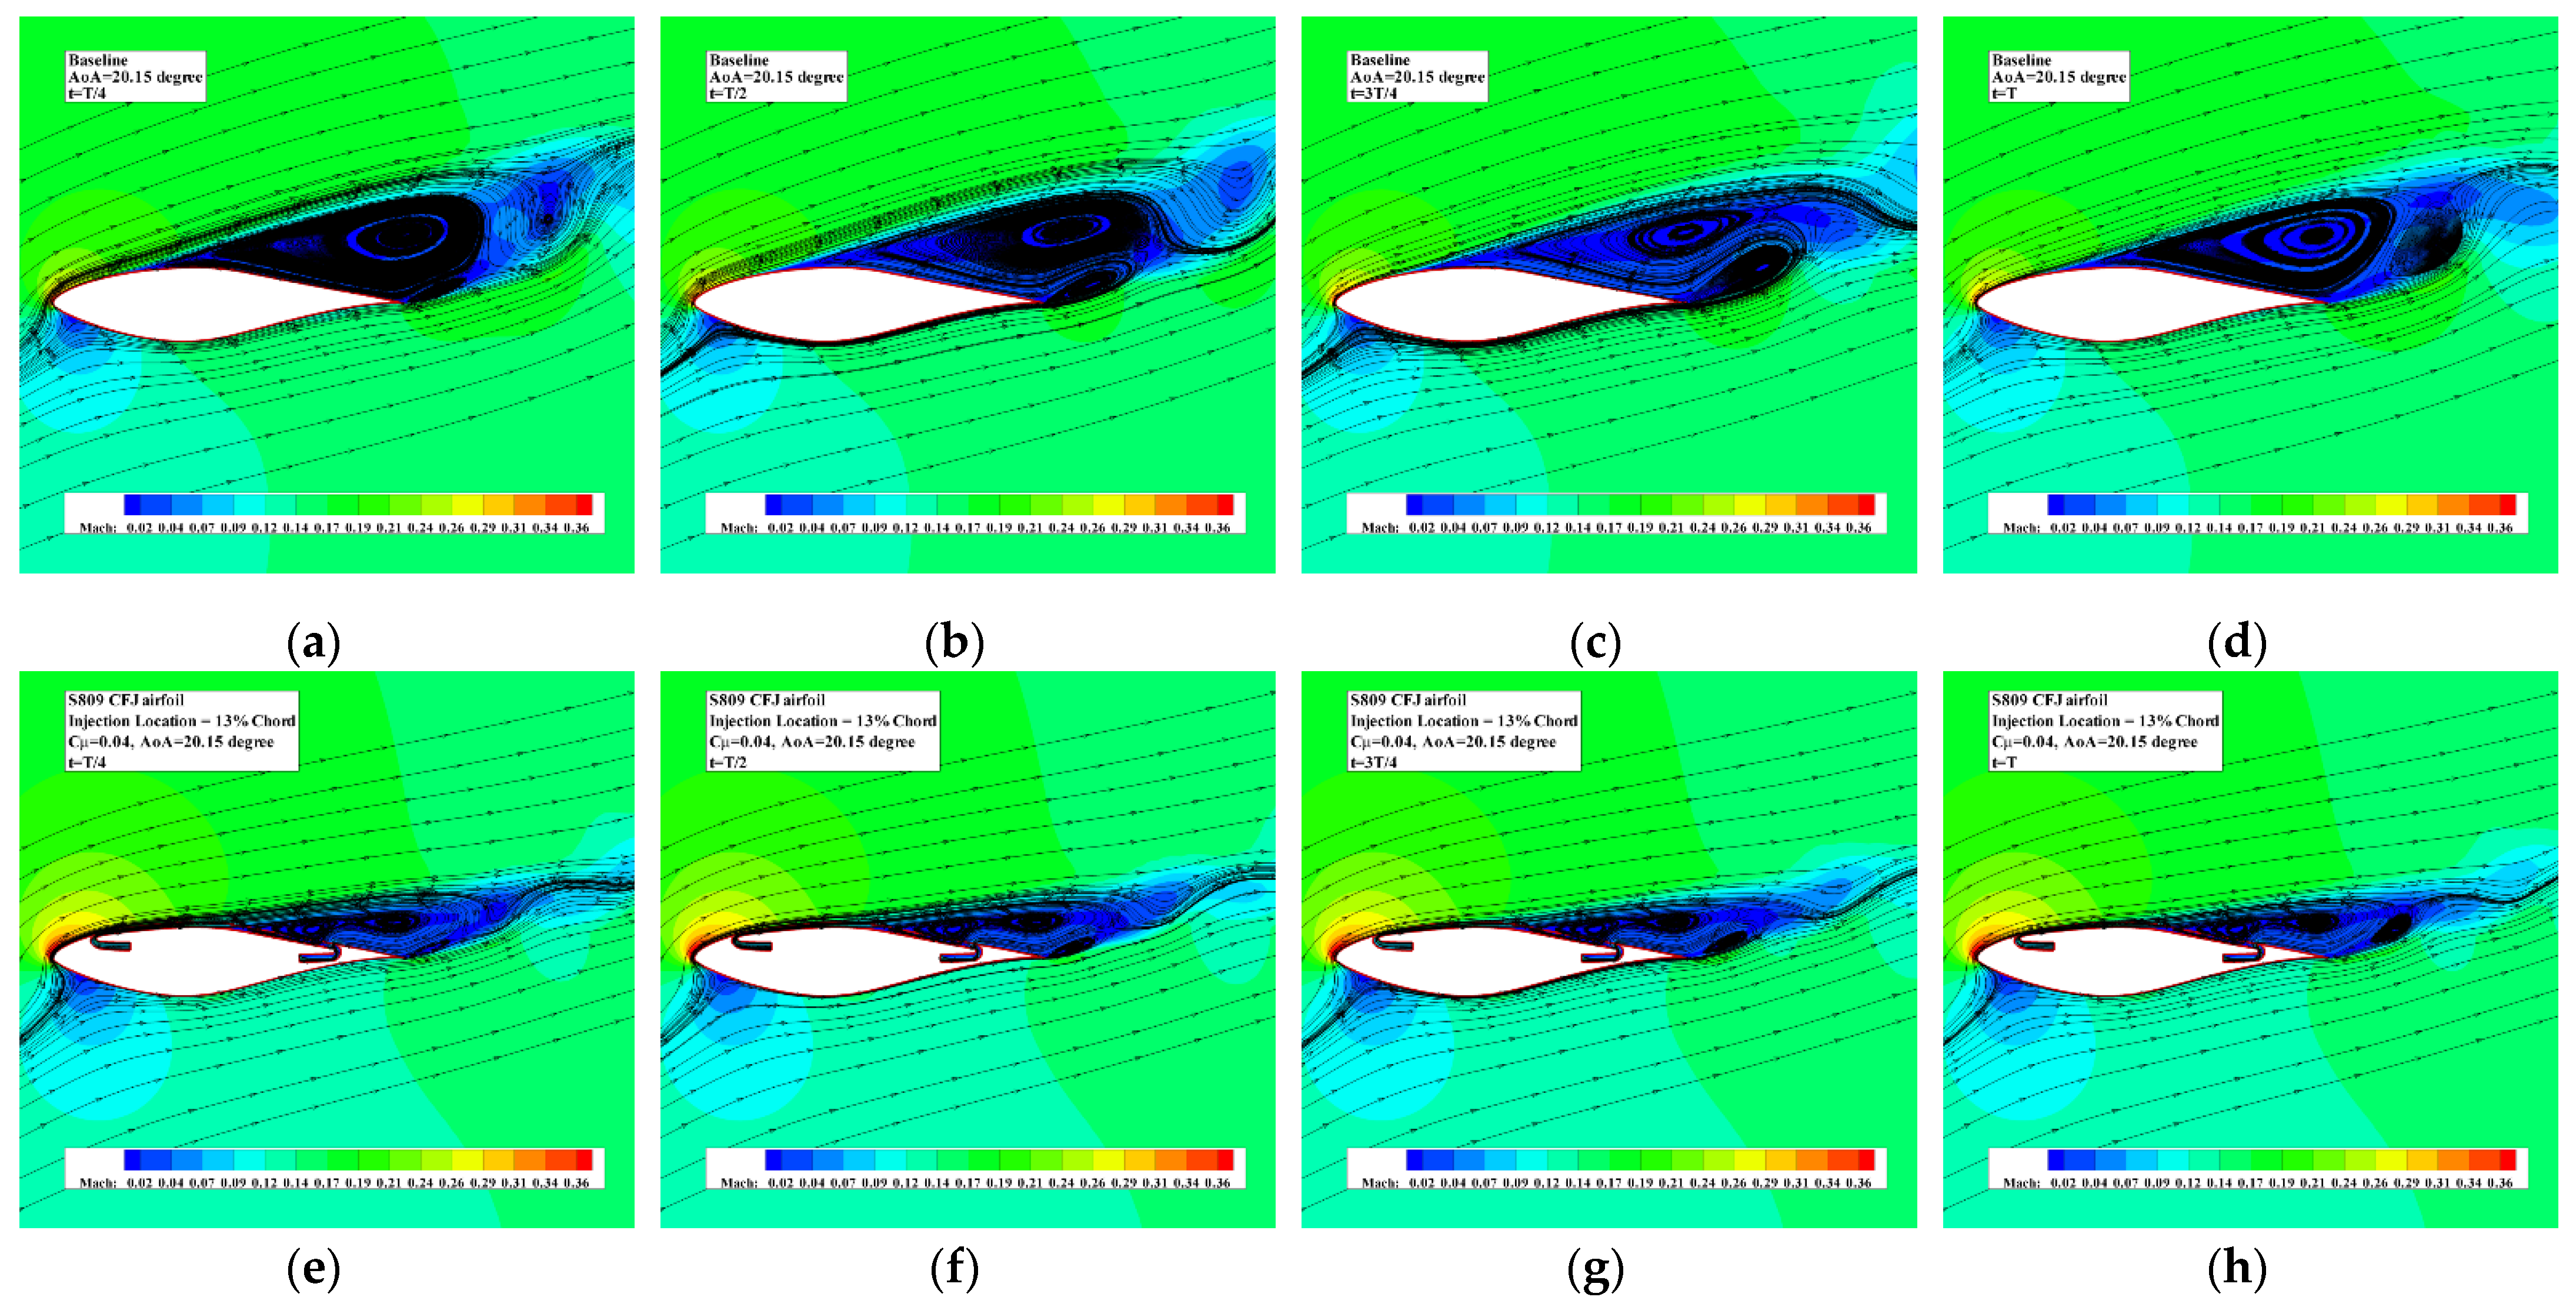
The unsteady simulations for the baseline and S809 CFJ airfoil with 13% chord-wise injection location are implemented to explore the effects of CFJ technology on the vortex structures when AoA is 20.15°. The time histories of lift coefficient and drag coefficient of the baseline and S809 CFJ airfoil are given in Figure 10 and Figure 11, respectively. It can be found that the amplitudes of lift coefficient and drag coefficient of S809 CFJ airfoil are significantly smaller than those of the baseline. The lift coefficient amplitude of S809 CFJ airfoil is only 0.004 while that of the baseline is 0.0225. The drag coefficient amplitude of S809 CFJ airfoil is only 0.0016 while that of the baseline is 0.0076. Moreover, the vortex shedding frequency of S809 airfoil, which is 139 Hz, is larger than that of the baseline, which is 73 Hz. Figure 12 shows the instantaneous Mach number contours and streamlines of the baseline and S809 CFJ airfoil within one time cycle. The separation region of S809 CFJ airfoil is obviously smaller than that of the baseline. Meanwhile, the secondary vortex of S809 CFJ airfoil near the trailing edge, induced by the primary vortex, is also smaller than that of the baseline.
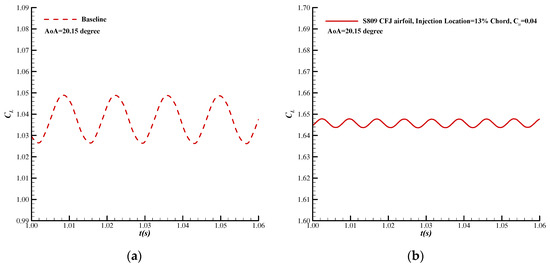
Figure 10.
Time histories of lift coefficient of the baseline and S809 CFJ airfoil with 13% chord-wise injection location (Cμ = 0.04 and AoA = 20.15°). (a) Baseline; (b) S809 CFJ airfoil.
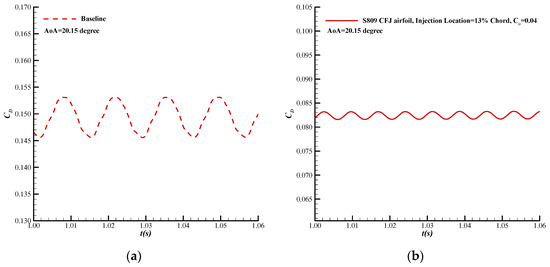
Figure 11.
Time histories of drag coefficient of the baseline and S809 CFJ airfoil with 13% chord-wise injection location (Cμ = 0.04 and AoA = 20.15°). (a) Baseline; (b) S809 CFJ airfoil.
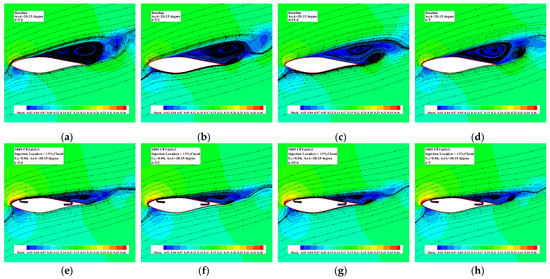
Figure 12.
Instantaneous Mach number contours and streamlines of the baseline and S809 CFJ airfoil with 13% chord-wise injection location (Cμ = 0.04 and AoA = 20.15°). (a) Baseline, t = T/4; (b) baseline, t = T/2; (c) baseline, t = 3T/4; (d) baseline, t = T; (e) S809 CFJ airfoil, t = T/4; (f) S809 CFJ airfoil, t = T/2; (g) S809 CFJ airfoil, t = 3T/4; (h) S809 CFJ airfoil, t = T.
3.3. Effect of the Jet Momentum Coefficient
The injection slot size, suction slot size, and suction surface translation are also fixed to 0.65% chord, 1.33% chord, and 1.43% chord, respectively. The suction location is also fixed to the 80% chord-wise location from the leading edge. The effects of five jet momentum coefficients, which are 0.02, 0.04, 0.06, 0.08, and 0.10 respectively, are studied. Two different injection locations, which are 9% chord-wise location and 1% chord-wise location from the leading edge, are selected because that the S809 CFJ airfoils with the two injection locations achieve the largest and second largest corrected lift-to-drag ratios when the Cμ is 0.04.
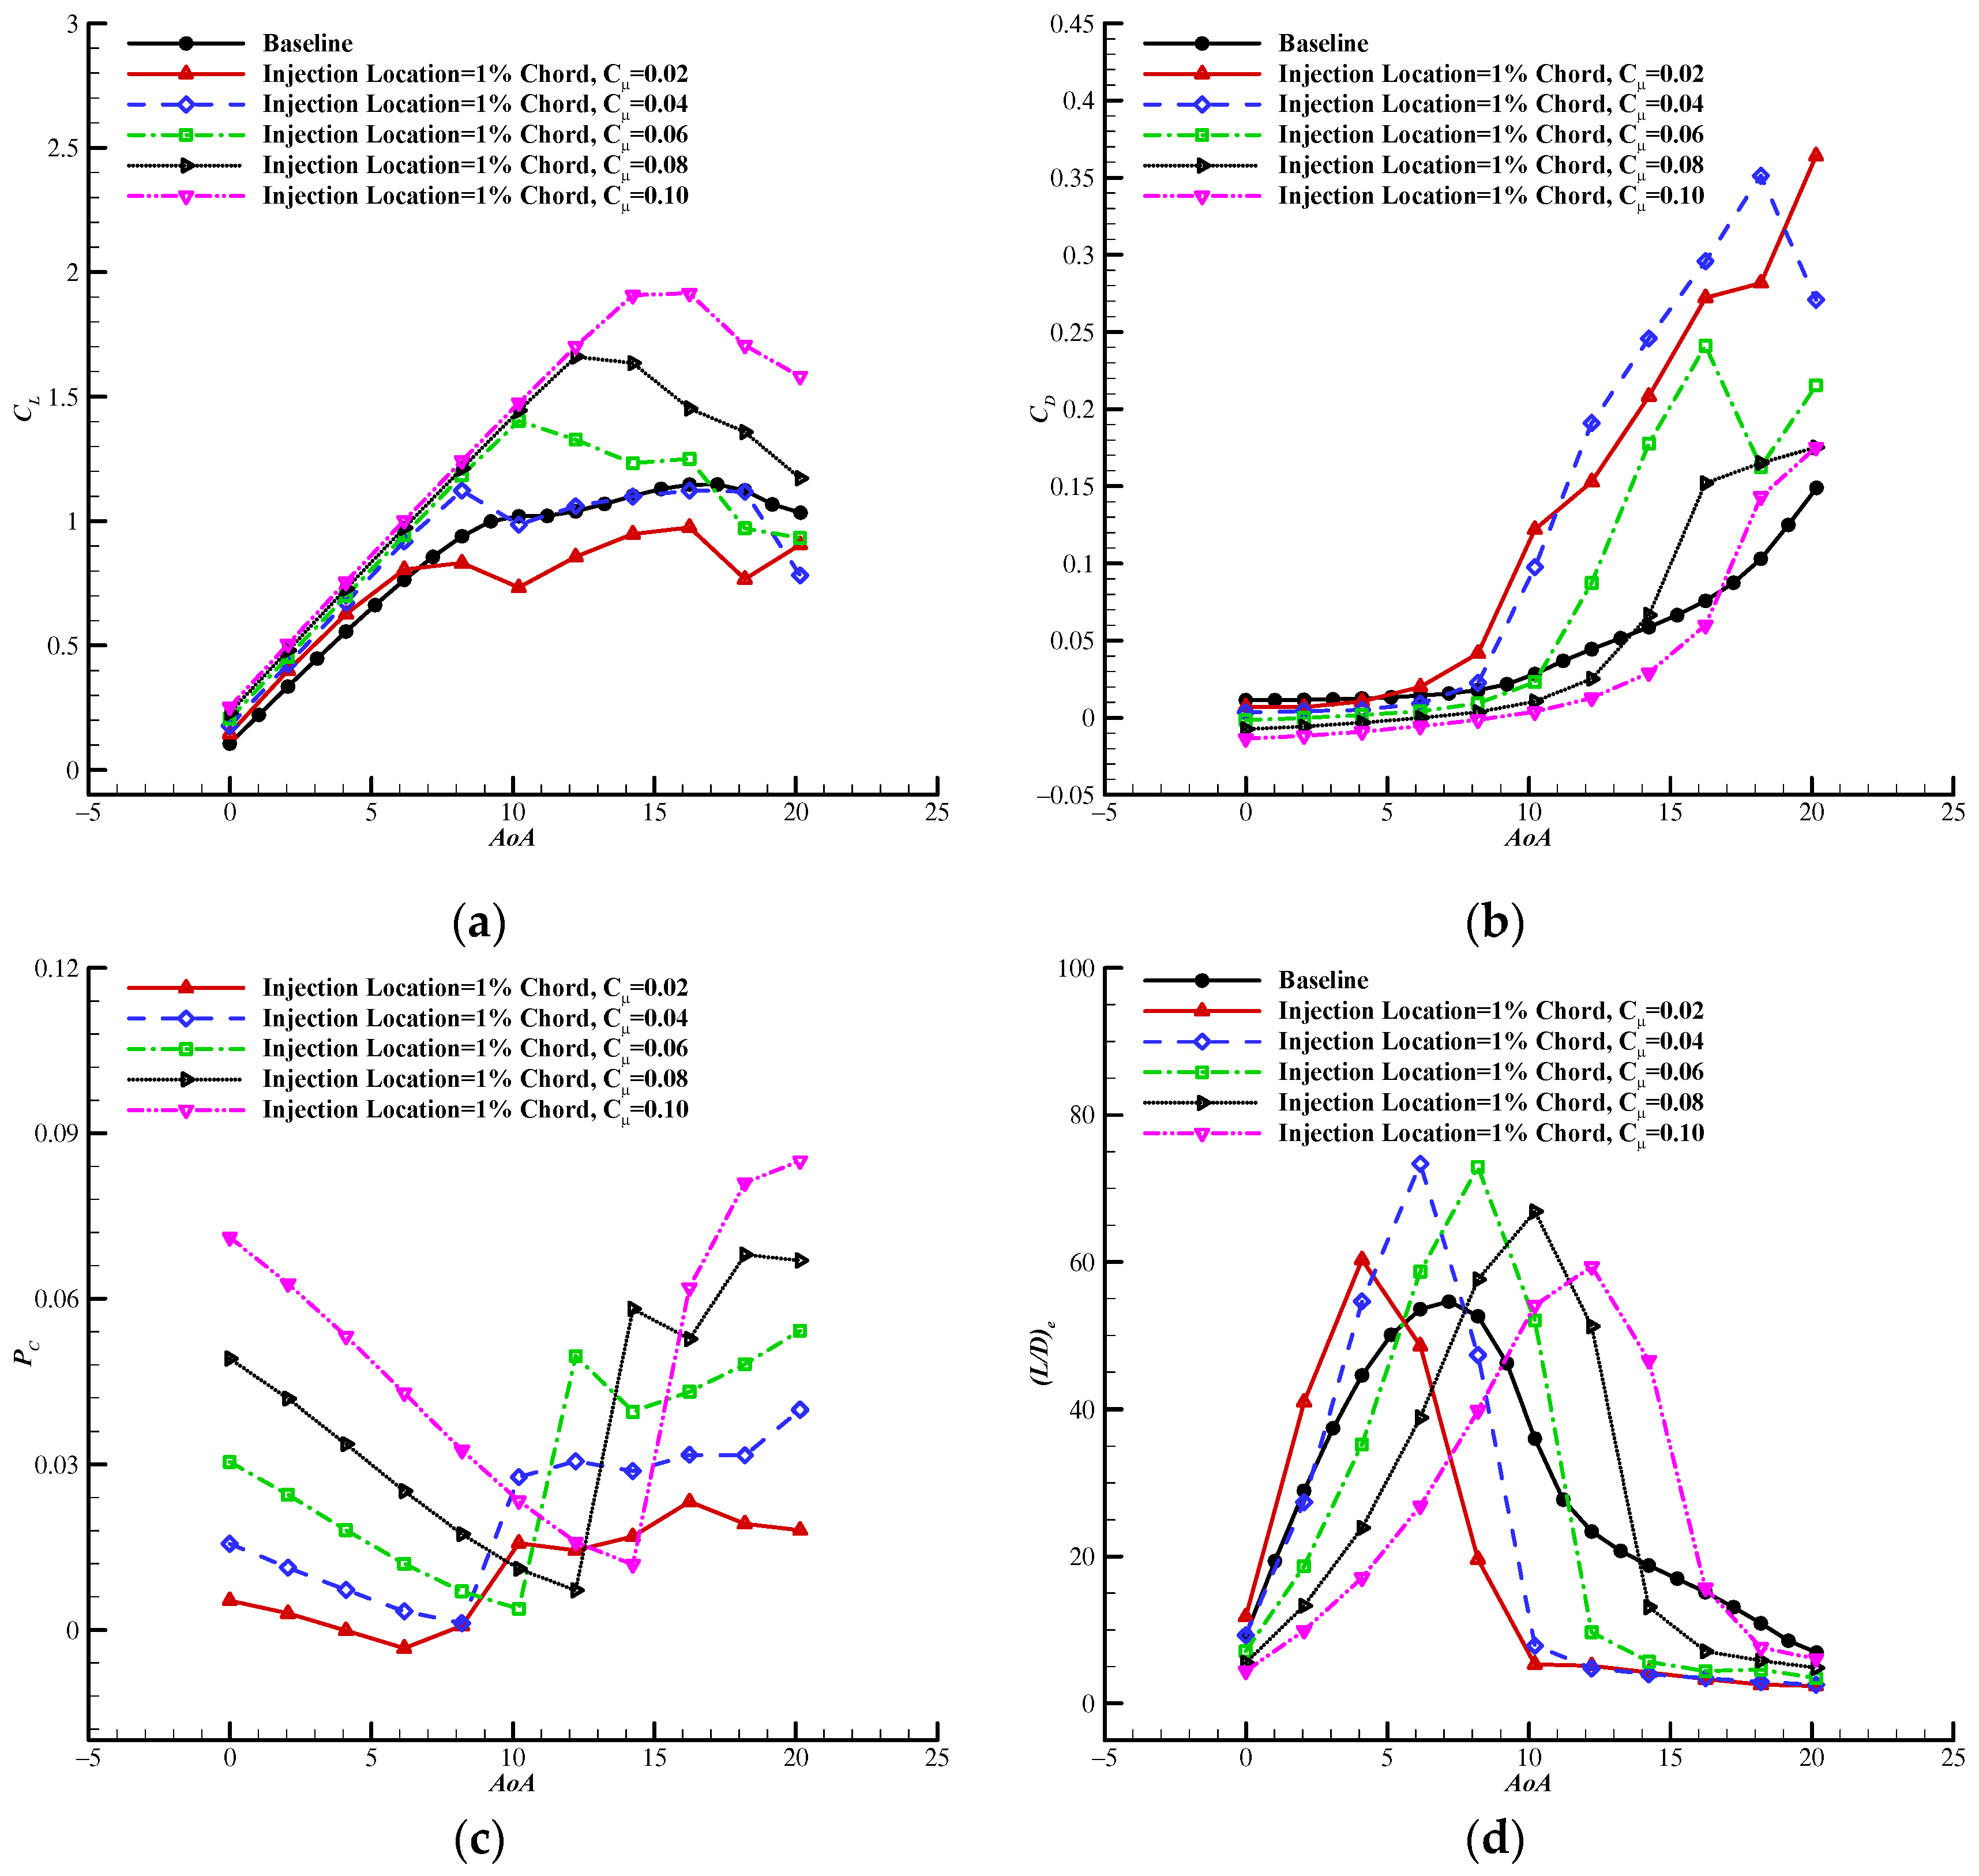
When the injection location is at 1% chord-wise location from the leading edge, the aerodynamic coefficients comparisons of S809 CFJ airfoils with various jet momentum coefficients are presented in Figure 13. As shown in Figure 13a,b, the lift and drag characteristics of S809 CFJ airfoil are enhanced with the increased Cμ. When the Cμ is 0.02, the lift coefficient of S809 CFJ airfoil is higher than that of the baseline only at the low AoA, and the S809 CFJ airfoil has the worse lift and drag characteristics at the high AoA. When the Cμ is 0.04 and the AoA is below 8.2°, the lift coefficient of S809 CFJ airfoil is higher than that of the baseline. But when the AoA is higher than 8.2°, the lift coefficient of S809 CFJ airfoil remains almost the same as that of the baseline and the drag coefficient is worse than that of the baseline. While the Cμ is greater than 0.06, the S809 CFJ airfoil has the higher lift coefficient than the baseline almost at each AoA. The maximum lift coefficients are improved by 9.0%, 44.7%, and 67.4% respectively when the Cμ is 0.06, 0.08, and 0.10. As shown in Figure 13c, the power consumption coefficient is first decreased and then increased with the increased AoA for each Cμ. Moreover, as the Cμ increases, the power consumption coefficient increases at the same small AoA, and the relative increment in the power consumption of S809 CFJ airfoil is larger than the relative increment in the lift coefficient. For example, at 2.05°AoA, the power consumption coefficient of S809 CFJ airfoil with 0.08 Cμ is 2.7 times higher than that with 0.04 Cμ, while the lift coefficient with 0.08 Cμ is only 13.2% higher than that with 0.04 Cμ. Thus, as shown in Figure 13d, the greater the Cμ, the lower the corrected lift-to-drag ratio at the low AoA. However, at the high AoA, the S809 CFJ airfoil with small Cμ also has a large power consumption coefficient, but most of the energy is converted into heat and is dissipated, while the S809 CFJ airfoil with high Cμ can effectively overcome the flow separation and has the higher lift coefficient. Thus, the greater the Cμ, the greater the corrected lift-to-drag ratio at the high AoA. Because of the above reasons, the AoA at the maximum corrected lift-to-drag ratio increases with the increased Cμ. The maximum corrected lift-to-drag ratios are improved by 10.4%, 34.3%, 33.4%, 22.5%, and 8.7% respectively when the Cμ is 0.02, 0.04, 0.06, 0.08, and 0.10. When the Cμ is 0.04 and 0.06, the S809 CFJ airfoil has the maximum corrected lift-to-drag ratios.
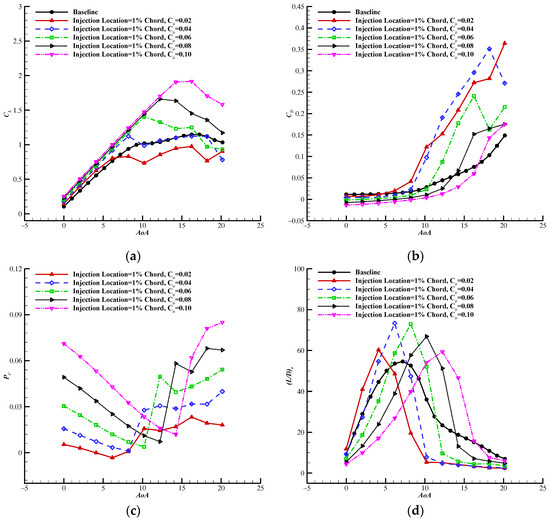
Figure 13.
Aerodynamic coefficients comparisons of the S809 CFJ airfoils with various jet momentum coefficients (injection location = 1% chord). (a) Lift coefficient; (b) drag coefficient; (c) power coefficient; (d) corrected lift-to-drag ratio.
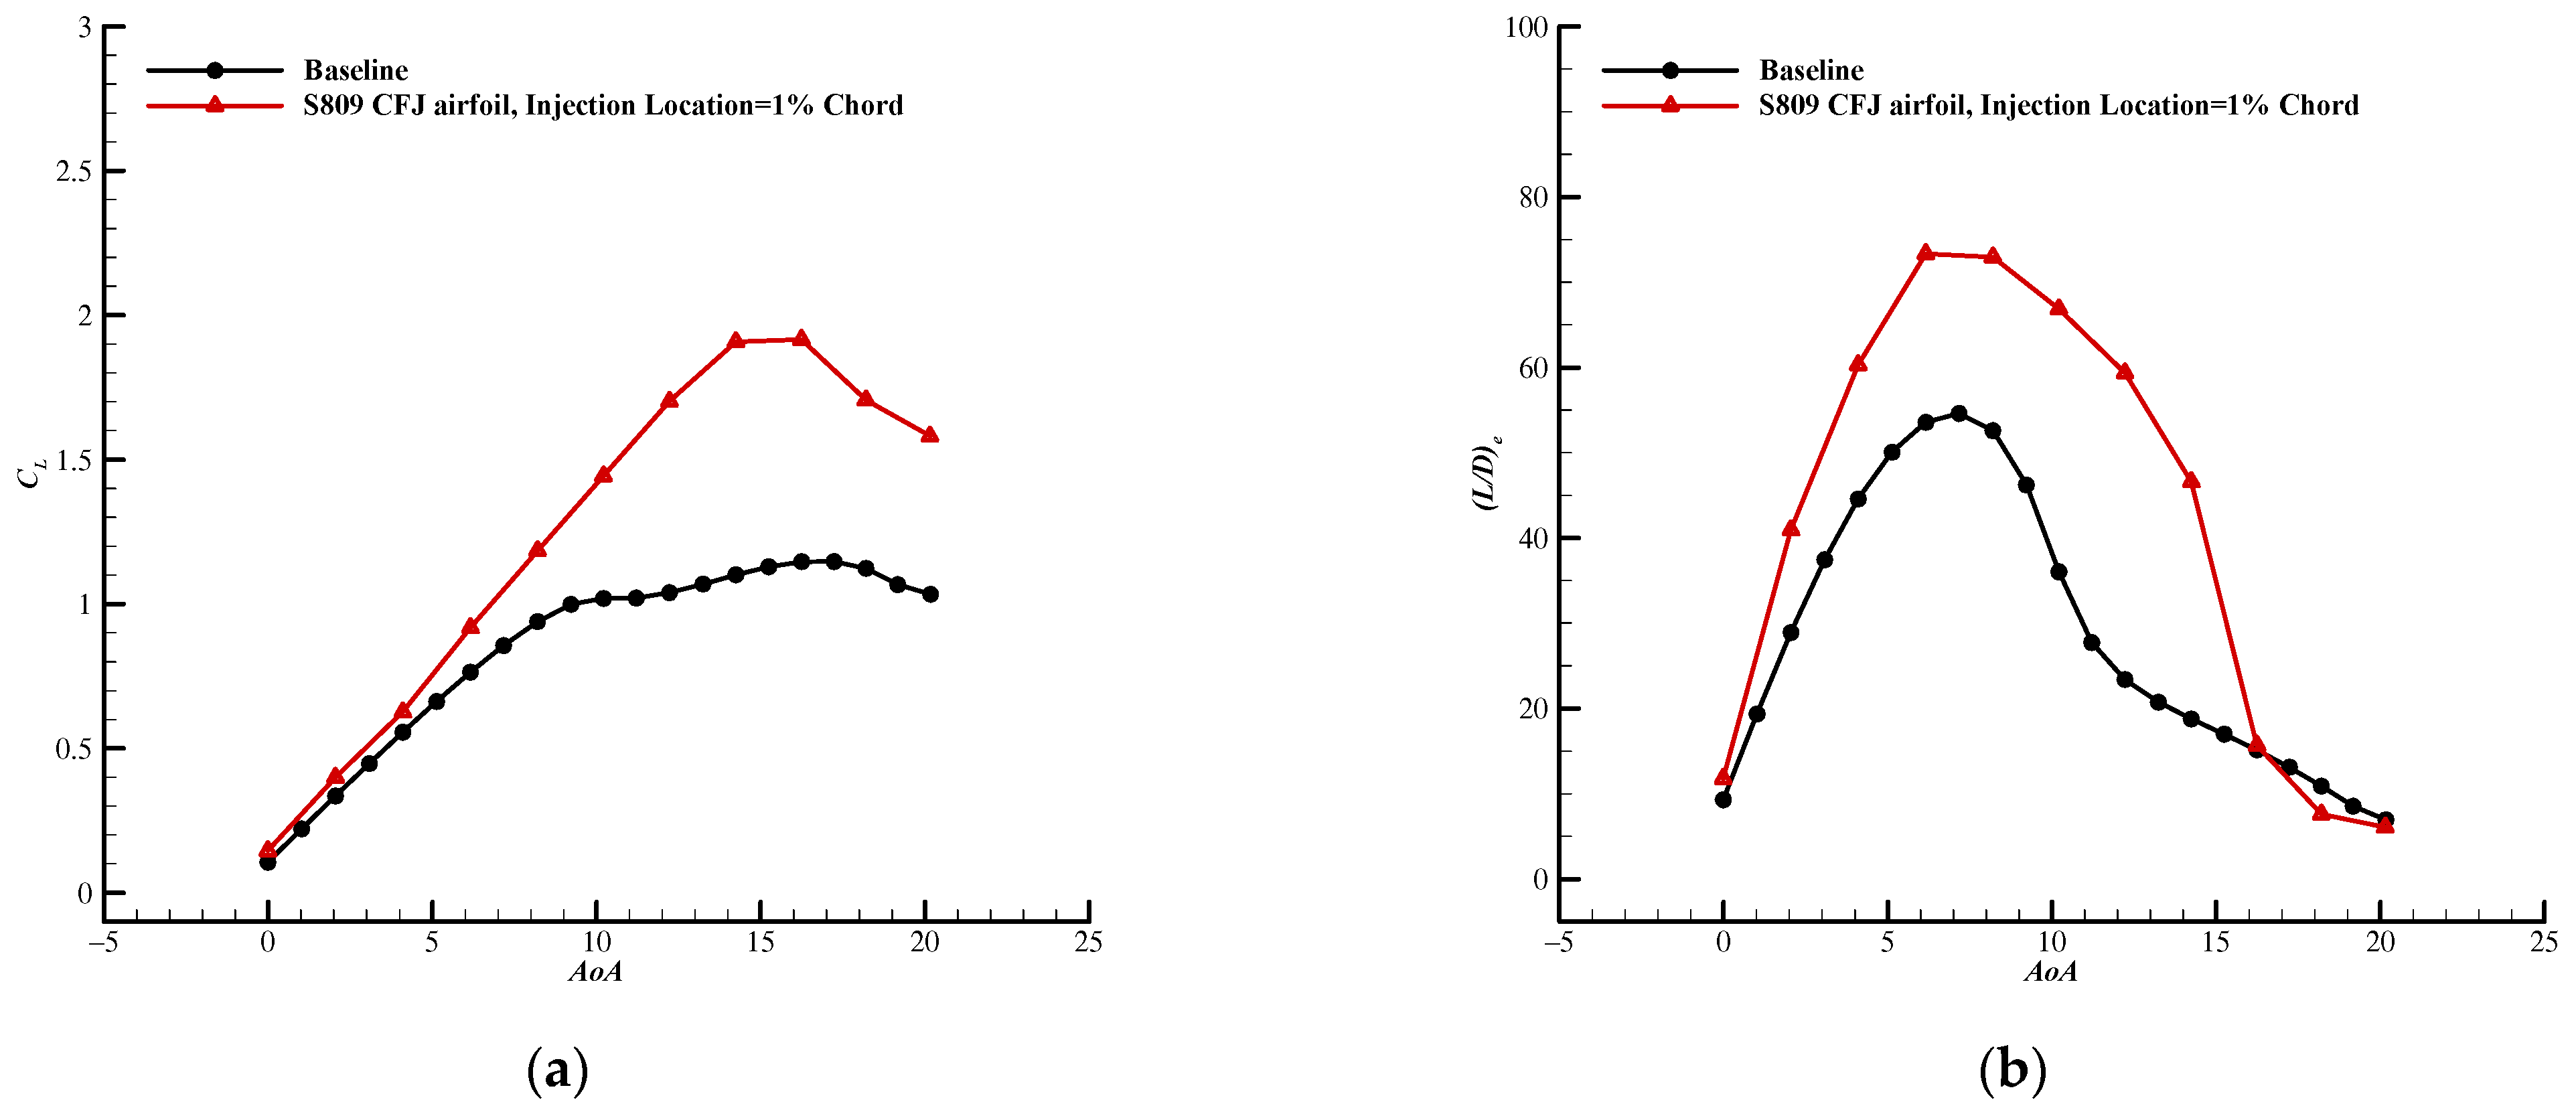
Although the S809 CFJ airfoil with a given Cμ has the higher maximum corrected lift-to-drag ratio than the baseline, the S809 CFJ airfoil with small Cμ has the lower corrected lift-to-drag ratio than the baseline at the high AoA and the S809 CFJ airfoil with high Cμ has the lower corrected lift-to-drag ratio than the baseline at the low AoA. Thus, to ensure that the S809 CFJ airfoil has the higher corrected lift-to-drag ratio and lift coefficient than the baseline at all AoAs, a S809 CFJ strategy with the adaptive Cμ is proposed. The small Cμ is used at the low AoA, and the Cμ gradually increases as the AoA rises. Therefore, based on the performance of S809 CFJ airfoil at different Cμ, the Cμs of S809 CFJ airfoil with the 1% chord-wise injection location at various AoAs are tabulated in Table 4. Figure 14 shows the lift coefficients and lift-to-drag ratios of S809 CFJ airfoil with different Cμ at various AoAs. As shown in Figure 14, the lift coefficient and the corrected lift-to-drag ratio of S809 CFJ airfoil with the adaptive Cμ strategy are comprehensively improved when compared with the baseline, and the maximum lift coefficient and maximum lift-to-drag ratio are improved by 67.4% and 34.3%, respectively.
Table 4.
Jet momentum coefficients of the S809 CFJ airfoil at various AoAs (injection location = 1% chord).
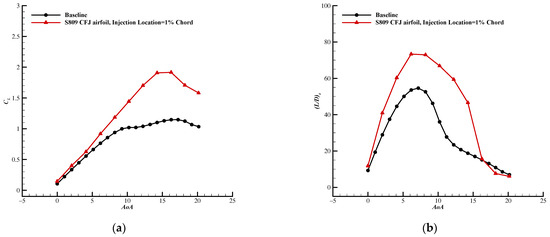
Figure 14.
Aerodynamic coefficients of the S809 CFJ airfoils with different jet momentum coefficients at various AoAs (injection location = 1% chord). (a) Lift coefficient; (b) corrected lift-to-drag ratio.
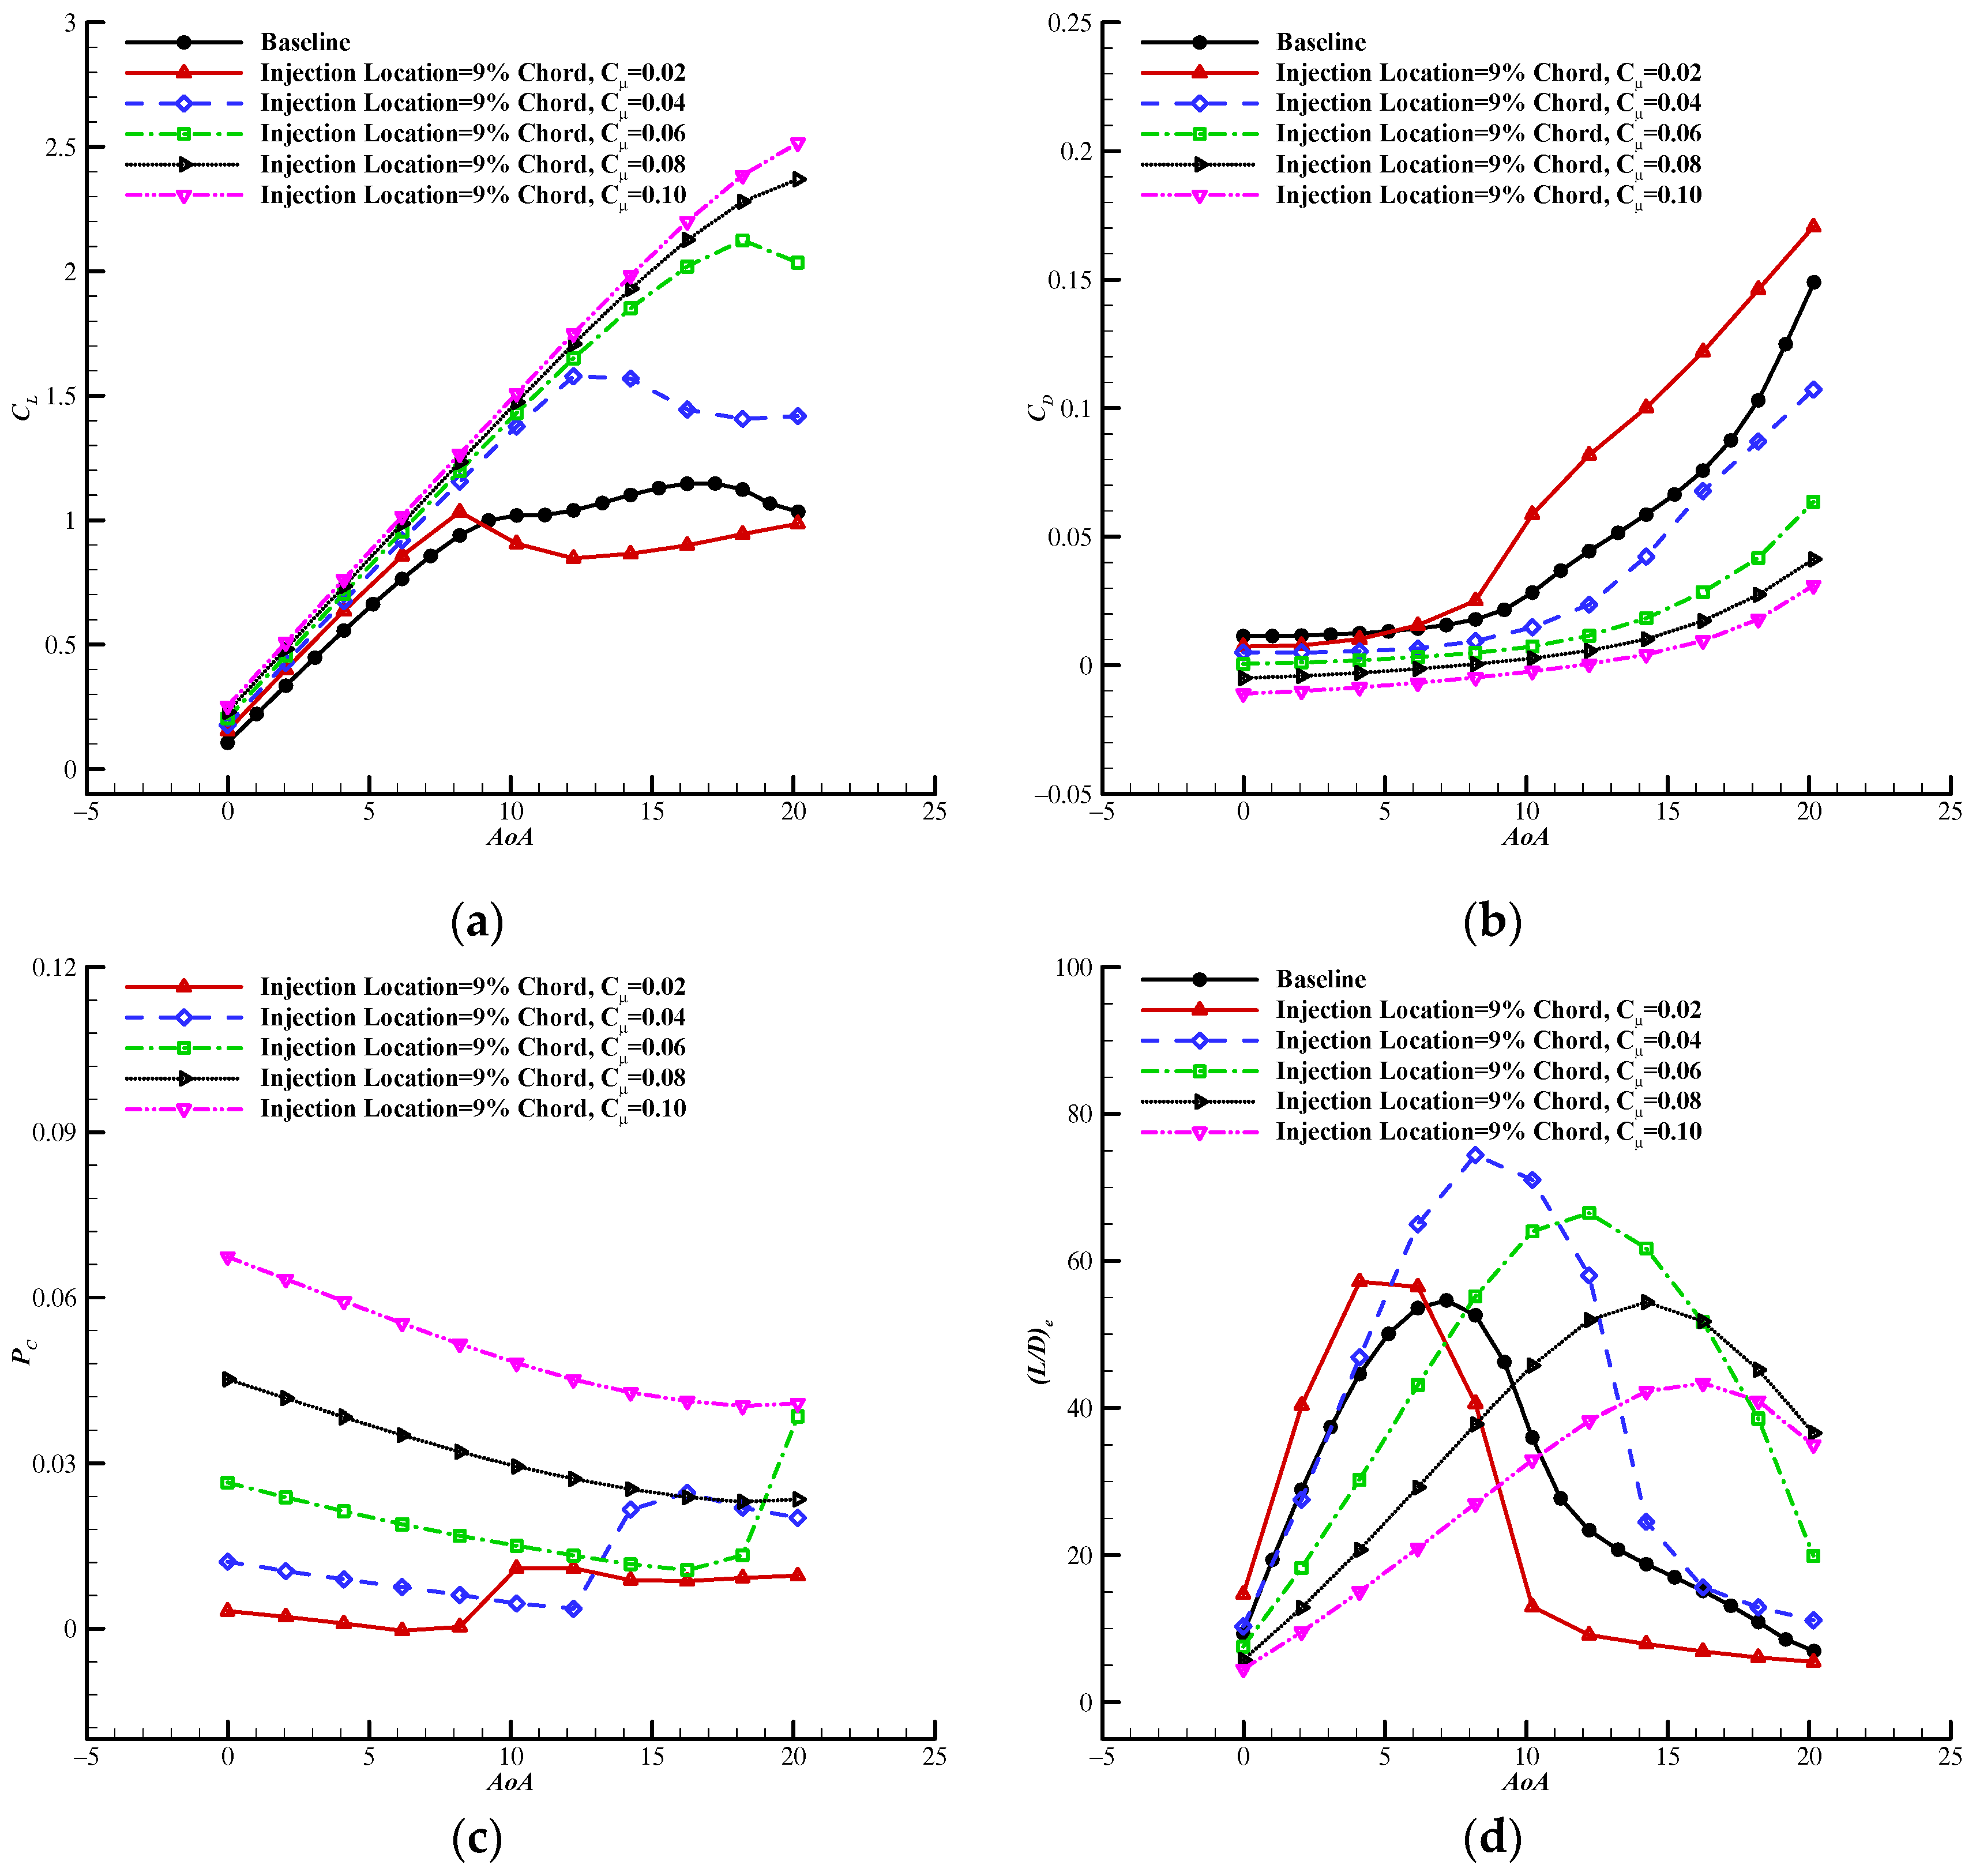
In order to further verify the above conclusions and CFJ strategy, the effect of Cμ on the performance of S809 CFJ airfoil is studied when the injection location is at 9% chord-wise location from the leading edge. Figure 15 shows aerodynamic coefficients comparisons of S809 CFJ airfoils with various jet momentum coefficients. Similarly, the lift and drag characteristics of S809 CFJ airfoil with the 9% chord-wise injection location are enhanced with the increased Cμ. As the Cμ increases, the power consumption coefficient increases at the same small AoA. Moreover, the greater the Cμ, the lower the corrected lift-to-drag ratio at the low AoA and the larger the corrected lift-to-drag ratio at the high AoA. At the same time, there are some differences in the aerodynamic characteristics of S809 CFJ airfoil with the 9% chord-wise injection location and with the 1% chord-wise injection location. When the Cμ is greater than 0.04, the S809 CFJ airfoil with the 9% chord-wise injection location has the higher lift coefficient than the S809 CFJ airfoil with the 1% chord-wise injection location. The maximum lift coefficient increment of S809 CFJ airfoil with the 9% chord-wise injection location using a given Cμ is greater than that with the 1% chord-wise injection location. The maximum lift coefficients of S809 CFJ airfoil with the 9% chord-wise injection location are improved by 84.8%, 106.6%, and 119.7% respectively when compared with that of the baseline when the Cμ is 0.06, 0.08, and 0.10. As the AoA increases, the power consumption coefficient of S809 CFJ airfoil with the 9% chord-wise injection location decreases lower than that with the 1% chord-wise injection location. Therefore, at the high AoA and high Cμ, the S809 CFJ airfoil with the 9% chord-wise injection location consumes more energy, which shows that the maximum corrected lift-to-drag ratios of S809 CFJ airfoils with the 0.08 and 0.10 Cμ are 0.4% and 20.6% lower than that of the baseline. Thus, it is necessary to explore the effect of the injection location.
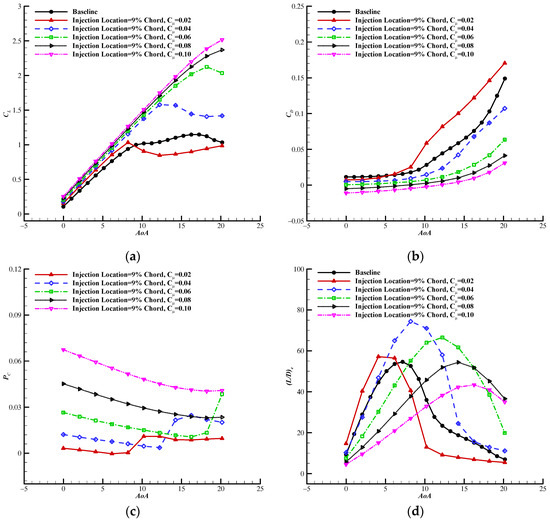
Figure 15.
Aerodynamic coefficients comparisons of the S809 CFJ airfoils with various jet momentum coefficients (injection location = 9% chord). (a) Lift coefficient; (b) drag coefficient; (c) power coefficient; (d) corrected lift-to-drag ratio.
Figure 15d shows that the same CFJ strategy with the adaptive Cμ can be used for the S809 CFJ airfoil with the 9% chord-wise injection location in order to achieve the higher corrected lift-to-drag ratio and lift coefficient. Based on the performance of S809 CFJ airfoil with the 9% chord-wise injection location, the Cμs at various AoAs are tabulated in Table 5. Figure 16 presents the lift coefficients and lift-to-drag ratios of S809 CFJ airfoils with different Cμs at various AoAs. As shown in Figure 16, the lift coefficient and the corrected lift-to-drag ratio of S809 CFJ airfoil with the 9% chord-wise injection location using the adaptive Cμ strategy are also comprehensively improved when compared with the baseline, and the maximum lift coefficient and maximum lift-to-drag ratio are improved by 119.7% and 36.2%, respectively.
Table 5.
Jet momentum coefficients of the S809 CFJ airfoil at various AoAs (injection location = 9% chord).
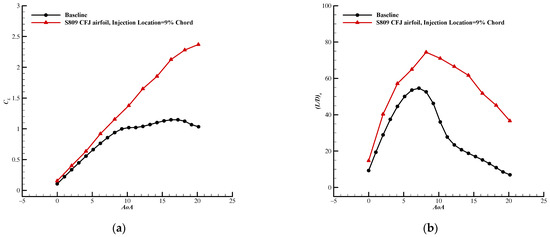
Figure 16.
Aerodynamic coefficients of the S809 CFJ airfoils with different jet momentum coefficients at various AoAs (injection location = 9% chord). (a) Lift coefficient; (b) corrected lift-to-drag ratio.
3.4. Performance Enhancement of the Wind Turbine Blade Using the CFJ Technology
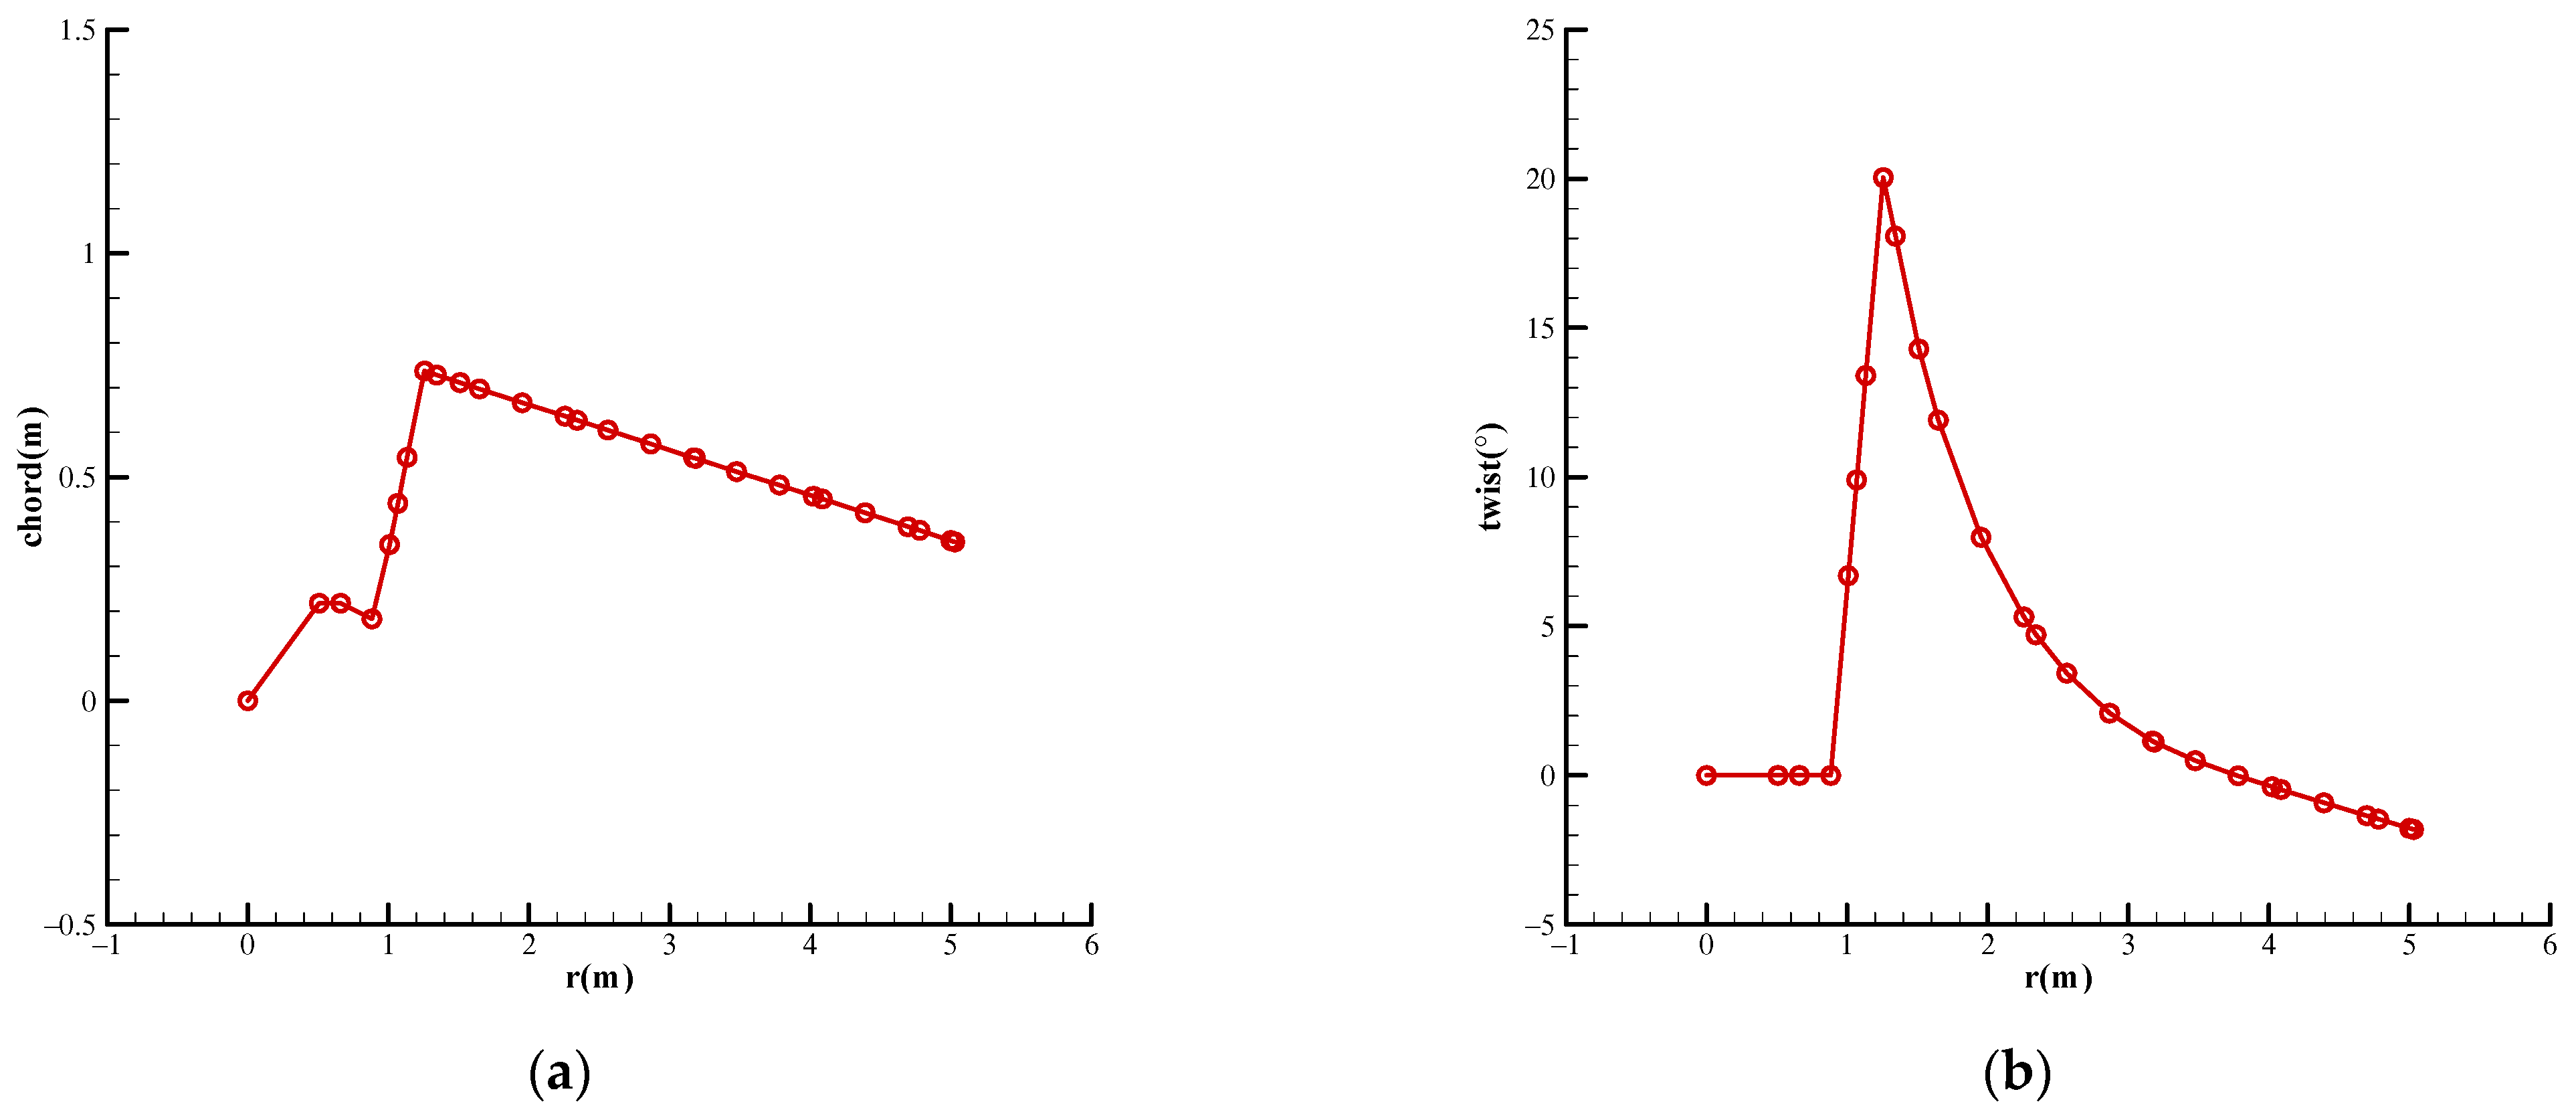
The PROPID code [51], which is a program for the design and analysis of horizontal axis wind turbines based on the blade element momentum theory, is used to evaluate the effect of CFJ technology on the wind turbine blade. The baseline is the PHASE VI wind turbine blade [52] using the S809 airfoil as the blade element, and S809 airfoils are replaced by S809 CFJ airfoils with the 9% chord-wise injection location to construct the CFJ blade. The adaptive Cμ strategy is applied to S809 CFJ airfoils and the power consumption of the CFJ technology is included. The radius of the hub and blade are 0.508 m and 5.029 m, respectively. The chord and twist distributions of the blade are shown in Figure 17.
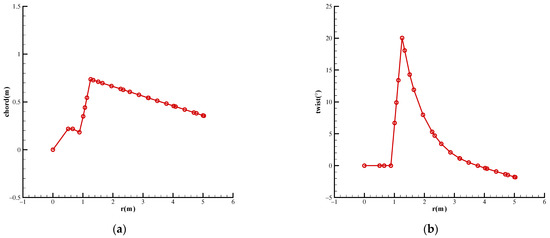
Figure 17.
Chord and twist distributions of the wind turbine blade. (a) Chord distribution; (b) twist distribution.
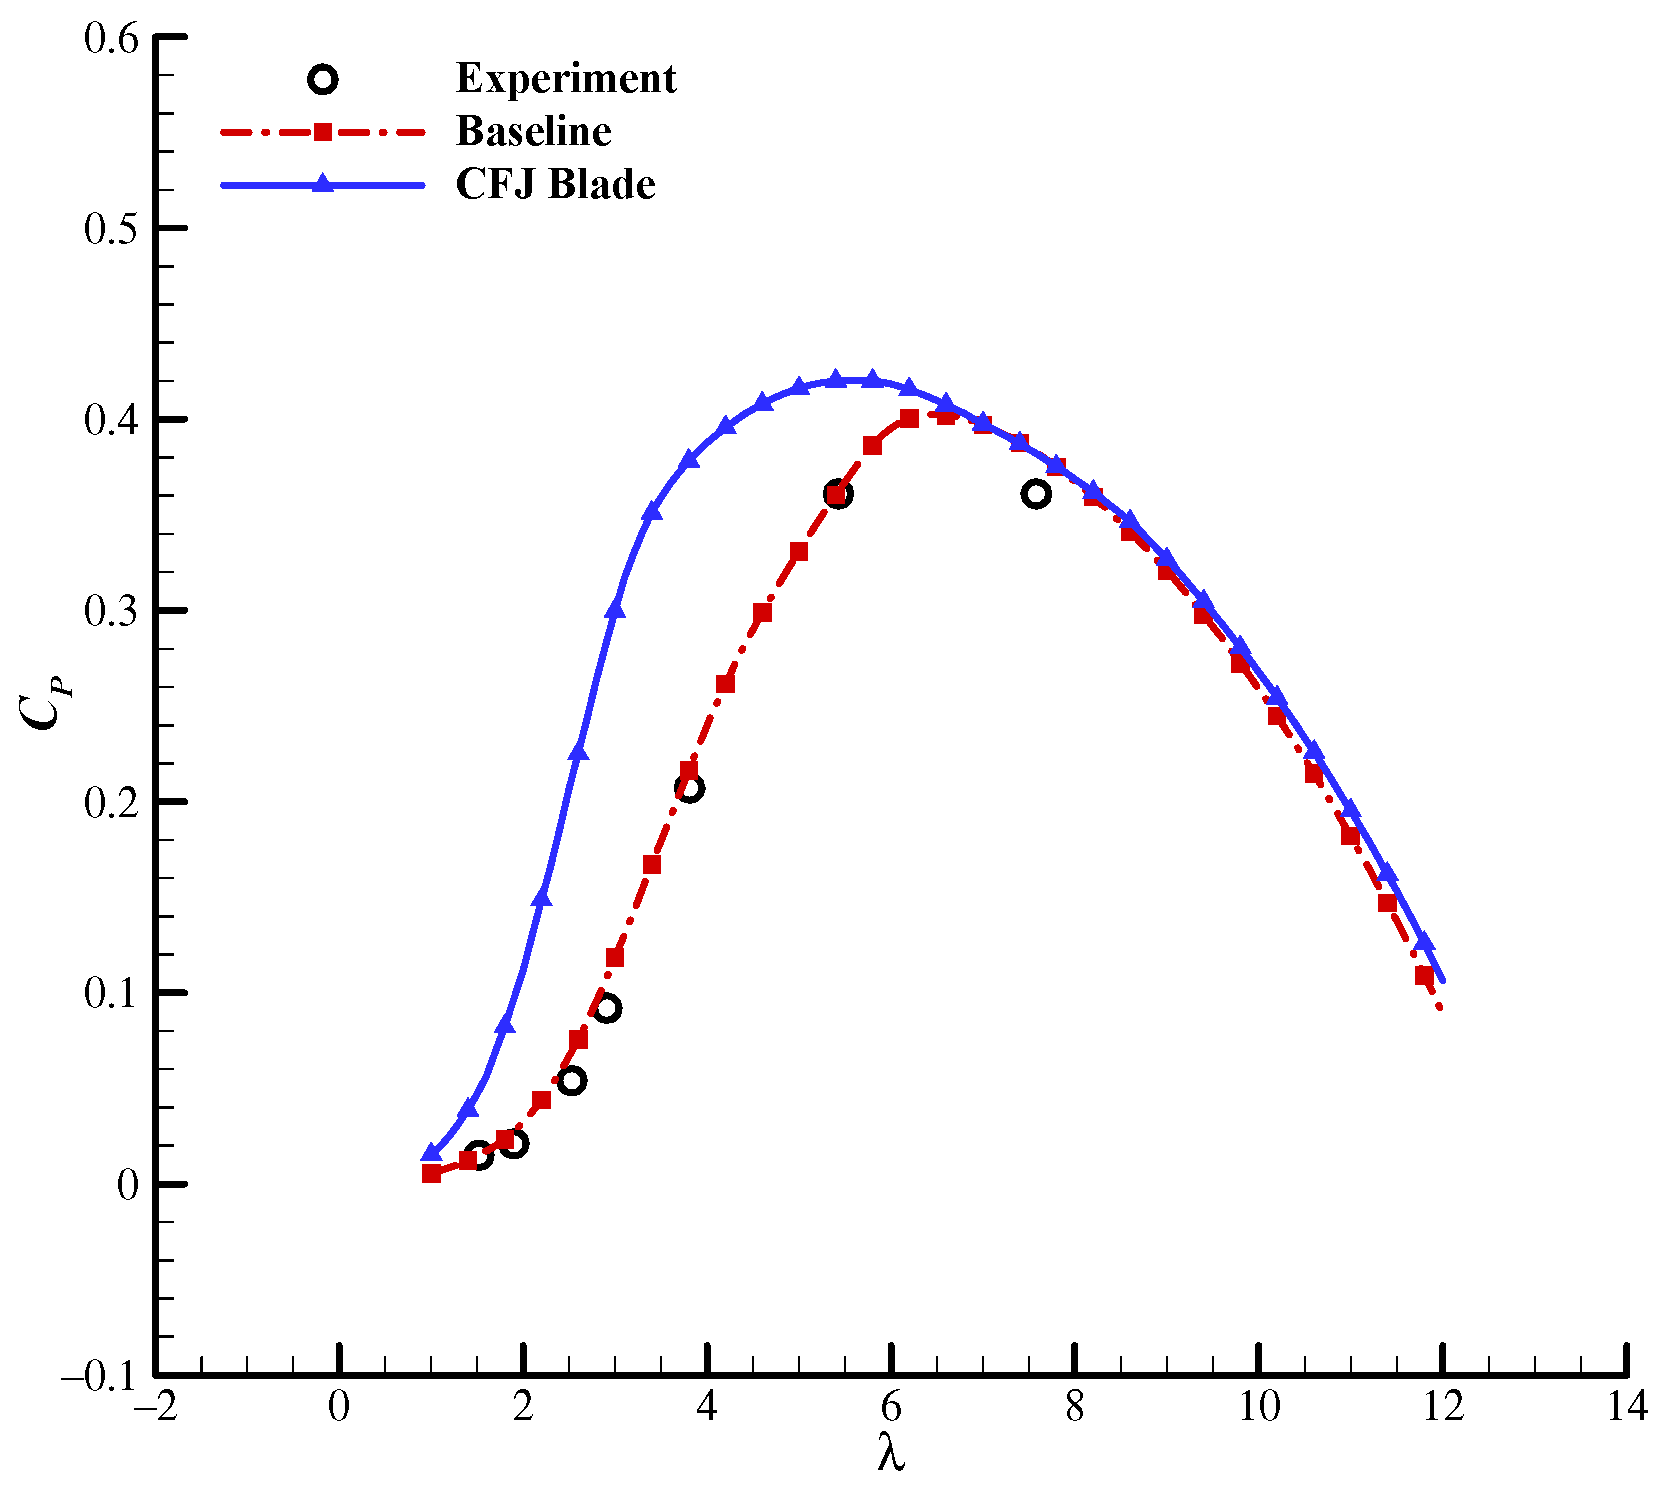
Figure 18 shows the power coefficients of the CFJ blade and baseline, while the experimental results are from Reference [53]. The power coefficients of the baseline predicted by PROPID code at various tip speed ratios (denoted as λ) are in good agreement with the experimental results, which verifies the reliability of the PROPID code. When λ is greater than 7, the power coefficient of the CFJ blade is slightly higher than that of the baseline. However, when λ is less than 7, the power coefficient of the CFJ blade is obviously higher than that of the baseline. Table 6 shows the power coefficient comparisons of the CFJ blade and baseline at several tip speed ratios. Although the maximum power coefficient of the CFJ blade only increased by 4.5% when compared with the baseline, the power coefficients of the CFJ blade are 226.7%, 202.9%, and 74.7% higher than those of the baseline, respectively. Thus, the performance of the Phase VI wind turbine blade is significantly enhanced by using the CFJ technology.
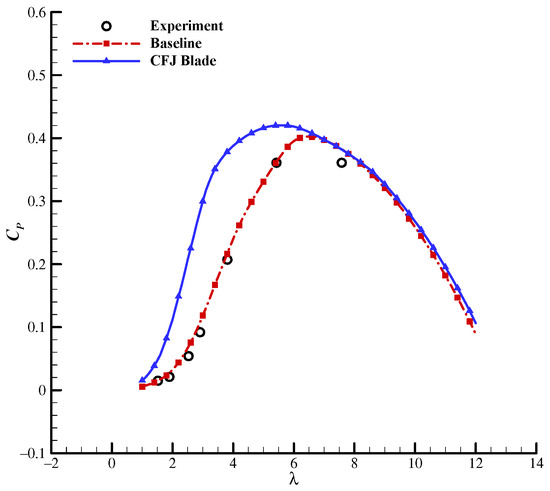
Figure 18.
Power coefficient comparisons of the CFJ blade and baseline.
Table 6.
Power coefficient comparisons of the CFJ blade and baseline at typical tip speed ratios.
4. Conclusions
In this study, the effects of the injection location and jet momentum coefficient are studied, and an adaptive jet momentum coefficient strategy of the CFJ technology is proposed. Meanwhile, the effects of the CFJ technology on the performance enhancement of the Phase VI wind turbine blade are explored. Some major conclusions can be summarized as follows:
- (1)
- The CFJ technology can significantly improve the maximum lift coefficient and maximum corrected lift-to-drag ratio of the S809 airfoil;
- (2)
- At the low AoA, the closer the injection location is to the leading edge, the better the lift and drag characteristics of S809 CFJ airfoil. At the high AoA, the more downstream the injection location, the stronger the flow separation suppression capability of S809 CFJ airfoil;
- (3)
- A S809 CFJ strategy with the adaptive Cμ is proposed. The small Cμ is used at the low AoA, and the Cμ gradually increases as the AoA rises. The performance of S809 CFJ airfoil with adaptive Cμ is comprehensively enhanced, and the maximum lift coefficient and maximum corrected lift-to-drag ratio of the typical S809 CFJ airfoil are improved by 119.7% and 36.2%, respectively;
- (4)
- The application of the CFJ technology to the Phase VI wind turbine blade can greatly improve the power coefficient at the low tip speed ratio. The maximum power coefficient of CFJ blade can be increased by 4.5%, and the power coefficient of CFJ blade can be boosted by 226.7% when the tip speed ratio is 1.52.
Future Work
The RANS or LES methods should be used to further investigate the effects of the CFJ technology on the performance of the wind turbine blade.
Author Contributions
Conceptualization, X.Y. and B.S.; methodology, S.Z. and X.Y.; validation, S.Z.; formal analysis, X.Y.; investigation, S.Z.; resources, S.Z. and B.S.; data curation, S.Z. and X.Y.; writing—original draft preparation, S.Z.; writing—review and editing, S.Z. and B.S.; visualization, S.Z.; supervision, X.Y. and B.S.; project administration, X.Y. and B.S.; funding acquisition, X.Y. All authors have read and agreed to the published version of the manuscript.
Funding
This research was funded by NATIONAL NATURAL SCIENCE FOUNDATION OF CHINA, grant number 11672243.
Institutional Review Board Statement
Not applicable.
Informed Consent Statement
Not applicable.
Data Availability Statement
Not applicable.
Conflicts of Interest
The authors declare no conflict of interest.
References
- World Wind Energy Association. Available online: https://wwindea.org/worldwide-wind-capacity-reaches-744-gigawatts/ (accessed on 24 March 2021).
- Ahmed, M.R.; Nabolaniwaqa, E. Performance Improvement of a Wind Turbine Blade Designed for Low Wind Speeds With a Passive Trailing Edge Flap. In Proceedings of the ASME 2012 International Mechanical Engineering Congress & Exposition, Houston, TX, USA, 9–15 November 2012. [Google Scholar]
- Fernandez-Gamiz, U.; Zulueta, E.; Boyano, A.; Ansoategui, I.; Uriarte, I. Five Megawatt Wind Turbine Power Output Improvements by Passive Flow Control Devices. Energies 2017, 10, 742. [Google Scholar] [CrossRef] [Green Version]
- Zhang, H.; Zhao, Z.D.; Zhou, G.X.; Kang, S. Experimental Investigation of the Effect of Gurney Flap on Du93-W-210 Airfoil Aerodynamics Performance. Acta Energy Sol. Sin. 2017, 38, 601–606. [Google Scholar]
- Ahmed, M.R.; Nabolaniwaqa, E. Performance Studies on a Wind Turbine Blade Section for Low Wind Speeds With a Gurney Flap. J. Energy Resour. Technol. 2019, 141, 111202. [Google Scholar] [CrossRef]
- Inigo, A.; Unai, F.G.; Ekaitz, Z.; Aitor, S.A.; Daniel, S.A. Parametric Study of a Gurney Flap Implementation in a Du91w(2)250 Airfoil. Energies 2019, 12, 294. [Google Scholar]
- Afjeh, A.A.; Keith, T.G.; Fateh, A. Predicted aerodynamic performance of a horizontal-axis wind turbine equipped with vortex generators. J. Wind. Eng. Ind. Aerodyn. 1990, 33, 515–529. [Google Scholar] [CrossRef]
- Dai, L.P.; Jiao, J.D.; Li, X.K.; Kang, S.; Zhao, P. Numerical Investigation on Effect of Installation Position of Vortex Generator on Aerodynamic Characteristics of Wind Turbine Airfoil. Acta Energy Sol. Sin. 2016, 37, 276–281. [Google Scholar]
- Wang, H.; Zhang, B.; Qiu, Q.; Xu, X. Flow control on the NREL S809 wind turbine airfoil using vortex generators. Energy 2017, 118, 1210–1221. [Google Scholar] [CrossRef]
- Li, X.; Yang, K.; Wang, X. Experimental and Numerical Analysis of the Effect of Vortex Generator Height on Vortex Characteristics and Airfoil Aerodynamic Performance. Energies 2019, 12, 959. [Google Scholar] [CrossRef] [Green Version]
- Ye, Q.; Avallone, F.; Van Der Velden, W.; Casalino, D. Effect of Vortex Generators on NREL Wind Turbine: Aerodynamic Performance and Far-Field Noise. J. Phys. Conf. Ser. 2020, 1618, 52077. [Google Scholar] [CrossRef]
- Khameneh, N.; Tadjfar, M. Improment of Wind Turbine Efficiency by Using Synthetic Jets. In Proceedings of the ASME 2016 Fluids Engineering Division Summer Meeting, Washington, DC, USA, 10–14 July 2016. [Google Scholar]
- Moshfeghi, M.; Hur, N. Numerical study on the effects of a synthetic jet actuator on S809 airfoil aerodynamics at different flow regimes and jet flow angles. J. Mech. Sci. Technol. 2017, 31, 1233–1240. [Google Scholar] [CrossRef]
- Ali, B.; Ouahiba, G.; Hamid, O.; Ahmed, B. Aerodynamic Optimization of Active Flow Control over S809 Airfoil Using Synthetic Jet. In Proceedings of the 2018 International Conference on Wind Energy and Applications in Algeria, Algiers, Algeria, 6–7 November 2018. [Google Scholar]
- Zhu, H.; Hao, W.; Li, C.; Ding, Q. Simulation on flow control strategy of synthetic jet in an vertical axis wind turbine. Aerosp. Sci. Technol. 2018, 77, 439–448. [Google Scholar] [CrossRef]
- Maldonado, V.; Gupta, S. Increasing the power efficiency of rotors at transitional Reynolds numbers with synthetic jet actuators. Exp. Therm. Fluid Sci. 2019, 105, 356–366. [Google Scholar] [CrossRef] [Green Version]
- Xu, H.-Y.; Qiao, C.-L.; Yang, H.-Q.; Ye, Z.-Y. Active Circulation Control on the Blunt Trailing Edge Wind Turbine Airfoil. AIAA J. 2018, 56, 554–570. [Google Scholar] [CrossRef]
- Xu, H.Y.; Dong, Q.L.; Qiao, C.L.; Ye, Z.Y. Flow Control over the Blunt Trailing Edge of Wind Turbine Airfoils Using Circu-Lation Control. Energies 2018, 11, 619. [Google Scholar] [CrossRef] [Green Version]
- Aono, H.; Nonomura, T.; Yakeno, A.; Fujii, K. Plasma Flow Control Simulation of an Airfoil of Wind Turbine at an Inter-Mediate Reynolds Number. In Proceedings of the ASME 2013 Fluids Engineering Division Summer Meeting, Incline Village, NV, USA, 7–11 July 2013. [Google Scholar]
- Baleriola, S.; Leroy, A.; Loyer, S.; Devinant, P.; Aubrun, S. Circulation control on a rounded trailing-edge wind turbine airfoil using plasma actuators. J. Phys. Conf. Ser. 2016, 753, 52001. [Google Scholar] [CrossRef]
- Li, G.Q.; Zhang, W.G.; Jiang, Y.B.; Yang, P.Y. Experimental Investigation of Dynamic Stall Flow Control for Wind Turbine Airfoils Using a Plasma Actuator. Energy 2019, 185, 90–101. [Google Scholar]
- Li, G.Q.; Yi, S.H. Large Eddy Simulation of Dynamic Stall Flow Control for Wind Turbine Airfoil using Plasma Actuator. Energy 2020, 212, 118753. [Google Scholar]
- Aono, H.; Fukumoto, H.; Abe, Y.; Sato, M.; Nonomura, T.; Fujii, K. Separated Flow Control of Small Horizontal-Axis Wind Turbine Blades Using Dielectric Barrier Discharge Plasma Actuators. Energies 2020, 13, 1218. [Google Scholar] [CrossRef] [Green Version]
- Fadaei, M.; Davari, A.; Sabetghadam, F.; Soltani, M. Enhancement of a Horizontal Axis Wing Turbine Airfoil Performance Using Single Dielectric Barrier Discharge Plasma Actuator. Proc. IMechE Part A J. Power Energy 2021, 235, 476–493. [Google Scholar] [CrossRef]
- Zhu, H.; Hao, W.; Li, C.; Ding, Q.; Wu, B. Application of flow control strategy of blowing, synthetic and plasma jet actuators in vertical axis wind turbines. Aerosp. Sci. Technol. 2019, 88, 468–480. [Google Scholar] [CrossRef]
- Zha, G.-C.; Paxton, C. A Novel Airfoil Circulation Augment Flow Control Method Using Co-Flow Jet. In Proceedings of the 2rd AIAA Flow Control Conference, Portland, OR, USA, 28 June–1 July 2004. [Google Scholar]
- Zha, G.C.; Gao, W.; Paxton, C. Numerical Simulation of Co-Flow Jet Airfoil Flows. In Proceedings of the 44th AIAA Aerospace Sciences Meeting and Exhibit, Reno, NV, USA, 9–12 January 2006. [Google Scholar]
- Zha, G.-C.; Carroll, B.F.; Paxton, C.D.; Conley, C.A.; Wells, A. High-Performance Airfoil Using Coflow Jet Flow Control. AIAA J. 2007, 45, 2087–2090. [Google Scholar] [CrossRef]
- Yang, Y.C.; Zha, G.C. Super-Lift Coefficient of Active Flow Control Airfoil: What is the Limit? In Proceedings of the 55th AIAA Aerospace Sciences Meeting, Grapevine, TX, USA, 9–13 January 2017. [Google Scholar]
- Yang, Y.C.; Fernandez, M.; Zha, G.C. Improved Delayed Detached Eddy Simulation of Super-Lift Flow of Co-Flow Jet Airfoil. In Proceedings of the 2018 AIAA Aerospace Sciences Meeting, Kissimmee, FL, USA, 8–12 January 2018. [Google Scholar]
- Yang, Y.C.; Zha, G.C. Super Lift Coefficient of Cylinder Using Co-Flow Jet Active Flow Control. In Proceedings of the 2018 AIAA Aerospace Sciences Meeting, Kissimmee, FL, USA, 8–12 January 2018. [Google Scholar]
- Yang, Y.C.; Zha, G.C. Numerical Investigation of Ultra-High Lift Coefficient Co-Flow Jet Wing without Flaps. In Proceedings of the 2018 AIAA Aerospace Sciences Meeting, Kissimmee, FL, USA, 8–12 January 2018. [Google Scholar]
- Zha, G.; Yang, Y.; Ren, Y.; McBreen, B. Super-Lift and Thrusting Airfoil of Coflow Jet Actuated by Micro-Compressors. In Proceedings of the 2018 Flow Control Conference, Atlanta, GA, USA, 25–29 June 2018. [Google Scholar]
- Ren, Y.; Zha, G. Simulation of 3D Co-Flow Jet Airfoil with Embedded Micro-Compressor Actuator. In Proceedings of the 2018 AIAA Aerospace Sciences Meeting, Kissimmee, FL, USA, 8–12 January 2018. [Google Scholar]
- Ren, Y.; Zha, G. Design of Injection and Suction Ducts for Co-Flow Jet Airfoils with Embedded Micro-Compressor Actuator. In Proceedings of the 2018 Flow Control Conference, Atlanta, GA, USA, 25–29 June 2018. [Google Scholar]
- Ren, Y.; Zha, G. Design of Injection Jet Span Profile for Co-Flow Jet Airfoil. In Proceedings of the AIAA Scitech 2019 Forum, San Diego, CA, USA, 7–11 January 2019. [Google Scholar]
- Zhang, S.L.; Yang, X.D.; Song, B.F.; Xu, J.H. Numerical and Experimental Study of the Co-Flow Jet Airfoil Performance En-hancement. In Proceedings of the 55th AIAA Aerospace Sciences Meeting, Grapevine, TX, USA, 9–13 January 2017. [Google Scholar]
- Zhu, M.; Yang, X.D.; Song, C.; Song, W.P. High Synergy Method for Near Space Propeller Using Co-Flow Jet Control. Acta Aeronaut. Astronaut. Sin. 2014, 35, 1549–1559. [Google Scholar]
- Yang, X.-D.; Jiang, W.-R.; Zhang, S.-L. Analysis of Co-Flow Jet Effect on Dynamic Stall Characteristics Applying to Rotor Airfoils. IOP Conf. Ser. Mate. Sci. Eng. 2019, 491, 12010. [Google Scholar] [CrossRef]
- Zha, G.-C.; Paxton, C.D.; Conley, C.A.; Wells, A.; Carroll, B.F.; Wells, A. Effect of Injection Slot Size on the Performance of Coflow Jet Airfoil. J. Aircr. 2006, 43, 987–995. [Google Scholar] [CrossRef]
- Wang, B.; Haddoukessouni, B.; Lévy, J.; Zha, G.-C. Numerical Investigations of Injection-Slot-Size Effect on the Performance of Coflow Jet Airfoils. J. Aircr. 2008, 45, 2084–2091. [Google Scholar] [CrossRef]
- Lefebvre, A.M.; Zha, G. Co-Flow Jet Airfoil Trade Study Part I: Energy Consumption and Aerodynamic Efficiency. In Proceedings of the 32nd AIAA Applied Aerodynamics Conference, Atlanta, GA, USA, 16–20 June 2014. [Google Scholar]
- Lefebvre, A.; Zha, G.C. Co-Flow Jet Airfoil Trade Study Part II: Moment and Drag. In Proceedings of the 32nd AIAA Applied Aerodynamics Conference, Atlanta, GA, USA, 16–20 June 2014. [Google Scholar]
- Xu, J.H.; Li, K.; Song, W.P.; Yang, X.D. Influence of Co-Flow Jet Key Parameters on Airfoil Aerodynamic Performance at Low Reynolds Number. Acta Aeronaut. Astronaut. Sin. 2018, 39, 122018. [Google Scholar]
- Xu, H.-Y.; Xing, S.-L.; Ye, Z.-Y. Numerical study of the S809 airfoil aerodynamic performance using a co-flow jet active control concept. J. Renew. Sustain. Energy 2015, 7, 23131. [Google Scholar] [CrossRef]
- Xu, H.-Y.; Qiao, C.-L.; Ye, Z.-Y. Dynamic Stall Control on the Wind Turbine Airfoil via a Co-Flow Jet. Energies 2016, 9, 429. [Google Scholar] [CrossRef] [Green Version]
- Sun, X.; Xu, Y.; Huang, D. Numerical simulation and research on improving aerodynamic performance of vertical axis wind turbine by co-flow jet. J. Renew. Sustain. Energy 2019, 11, 13303. [Google Scholar] [CrossRef]
- Xu, K.W.; Zha, G.C. Investigation of Coflow Jet Active Flow Control for Wind Turbine Airfoil. In Proceedings of the AIAA AVIATION 2020 FORUM, Virtual Online, 15–19 June 2020. [Google Scholar]
- Xu, K.; Zha, G. High Efficiency Wind Turbine Using Co-Flow Jet Active Flow Control. In Proceedings of the ASME Turbo Expo 2021, Virtual Online, 7–11 June 2021. [Google Scholar]
- Somers, D.M. Design and Experimental Results for the S809 Airfoil; Technical Report NREL/SR-440-6918; National Renewable Energy Laboratory (NREL): Golden, CO, USA, 1997.
- PROPID for Horizontal Axis Wind Turbine Design. Available online: https://m-selig.ae.illinois.edu/propid.html (accessed on 9 May 2021).
- Hand, M.M.; Simms, D.A.; Fingersh, L.J.; Jager, D.W.; Cotrell, J.R.; Schreck, S.; Larwood, S.M. Unsteady Aerodynamics Experiment Phase VI: Wind Tunnel Test Configurations and Available Data Campaigns; Technical Report NREL/TP-500-29955; National Renewable Energy Laboratory (NREL): Golden, CO, USA, 2001.
- Sørensen, N.N.; Michelsen, J.A.; Schreck, S. Navier-Stokes predictions of the NREL phase VI rotor in the NASA Ames 80 ft × 120 ft wind tunnel. Wind. Energy 2002, 5, 151–169. [Google Scholar] [CrossRef]


Publisher’s Note: MDPI stays neutral with regard to jurisdictional claims in published maps and institutional affiliations. |
© 2021 by the authors. Licensee MDPI, Basel, Switzerland. This article is an open access article distributed under the terms and conditions of the Creative Commons Attribution (CC BY) license (https://creativecommons.org/licenses/by/4.0/).