Article

Partial Discharge Simulation of Air Gap Defects in Oil-Paper Insulation Paperboard of Converter Transformer under Different Ratios of AC–DC Combined Voltage

1
China Southern Power Grid Research Institute Co., LTD, Guangzhou 510663, China
2
School of Electric Power, South China University of Technology, Guangzhou 510641, China
*
Author to whom correspondence should be addressed.
Energies 2021, 14(21), 6995; https://doi.org/10.3390/en14216995
Submission received: 14 September 2021 / Revised: 9 October 2021 / Accepted: 19 October 2021 / Published: 25 October 2021

Abstract

:
A converter transformer is important primary equipment in a DC transmission project. The voltage on the valve side winding is complex when the equipment is running, including DC, AC, and AC–DC combined voltage. The insulation structure of the valve side winding of a converter transformer is an oil-paper insulation structure, which may have a variety of defects in the manufacturing stage and daily use, resulting in partial discharge. Therefore, it is the key to studying the partial discharge characteristics and mechanism of oil-paper insulation under AC–DC combined voltage. In this paper, we build a two-dimensional air gap model of oil-paper-insulated pressboard considering the actual particles and actual reaction based on the fluid model. The characteristics and evolution mechanism of partial discharge (PD) in pressboard under different AC/DC combined voltages are studied by numerical simulation. The results show that when the DC component increases, the polarity effect of partial discharge is more obvious, while the potential and discharge intensity in the air gap decrease. Further analysis revealed that the DC component in the combined voltage accumulated a large number of surface charges on the surface of the air gap, and the space charge distribution was more uniform and dispersed, which generated an electric field with opposite polarity to the DC component in the air gap and, then, inhibited the development of local discharge in the paperboard. The results of the simulation are consistent with the previous experimental phenomena, and the mechanism analysis of the simulation results also verifies the previous analysis on the mechanism of experimental phenomena. This will lay a theoretical foundation for the further study of partial discharge phenomenon of oil-paper insulation structures in practical operation in the future.

1. Introduction

In recent years, with the development of DC transmission projects, the voltage level of UHV DC in China has increased year by year, which has played an important role in solving the problems of large-capacity and long-distance transmission in China. Many scholars have carried out a lot of research on the stable operation and optimization of the UHV AC/DC system. Wang Weiyuan combined the PSCAD component library with an e-tran model to simulate the operation characteristics and AC/DC interaction mechanism of an 800 kV DC transmission. This simulation model improves the accuracy of an electromagnetic transient simulation of an AC/DC power grid. Zhao Liying proposed a new power flow calculation method to analyze the voltage stability of VSC-HVDC AC/DC system, and the system has showed that the algorithm has good applicability and robustness [1,2,3].
In addition, the reliable operation of electrical equipment such as a converter transformer is also of great practical significance for HV-AC/DC transmission. Different from the traditional AC transformer, the oil-paper insulation structure of the converter transformer bears more complex voltage in actual operation, including DC, AC, and AC/DC superposition. There are great differences in the characteristics and mechanism of partial discharge under different voltage forms. Based on this, it is of great practical significance to study the characteristics and evolution mechanism of partial discharge under an AC/DC composite voltage to maintain the safe operation of the HVDC system [4,5,6,7,8,9,10,11,12].
At present, there are many experimental studies and reports on the partial discharge of an oil-paper insulation structure under AC–DC combined voltage. By building a simple oil-paper insulation structure model in the laboratory, scholars found that with an increase in the proportion of the DC component in the combined voltage, the initial voltage of the partial discharge increased, and the discharge repetition rate and the discharge magnitude decreased [6,7,8,9,10]. Furthermore, Chen Qingguo, Sha, and Li carried out a preliminary simulation of electric field and potential distribution under combined voltage by using finite element analysis software and circuit simulation, respectively. Combined with the previous experiments, they analyzed the mechanism of the experimental phenomenon: due to the existence of the DC voltage component in the combined voltage, a lot of surface charges and space charges are generated in the air gap, thus forming an electric field with opposite polarity to the DC voltage component and inhibiting the occurrence of partial discharge, but this analysis has not been clearly verified [13].
It can be seen that the current research in converter transformers has mainly been carried out in the laboratory environment by applying combined voltage to a simple oil-paper insulation model. Based on the experimental phenomena, scholars have analyzed the physical mechanism of partial discharge under combined voltage, but the analysis is still at the phenomenon level and cannot describe the microphysical process of partial discharge in the air gap. Sha simulated the oil-paper insulation structure, but the overall model is relatively simple and failed to reveal the microphysical evolution process of partial discharge in the air gap [13,14,15,16,17,18,19,20].
In recent years, with the improvement of the performance of supercomputers, computational high-voltage engineering has been proposed, which uses applied mathematics and computer science to solve or explain practical problems in high-voltage engineering. Computational high-voltage engineering is a supplement and development based on the traditional high-voltage experiment and research methods [12,13]. However, at present, the discipline of high-voltage engineering is still dominated by experiments, supplemented by empirical formulas and semi-physical models to explain high-voltage physical phenomena. For example, most of the traditional partial discharge models are three capacitance models and induced charge models. Although these models are helpful for qualitatively understanding the surface phenomenon of partial discharge, their physical meaning is not strictly clear. After considering the shortcomings of the traditional partial discharge model, Callender et al. proposed a virtual ionic fluid model based on the plasma dynamic process in partial discharge. The model describes the physical processes such as the migration, diffusion, and recombination of electrons and ions [21,22], which is of great significance to the study of the mechanism of partial discharge.
However, the model built by Callender does not consider the actual chemical particles and reactions. Therefore, we have developed a plasma partial discharge model considering more than 20 kinds of actual particles and their chemical reactions in the air gap. The model enables us to explain the physical mechanism of partial discharge behavior from the perspective of physicochemistry and observe the accumulation and decomposition of chemical substances in partial discharge [21,22,23,24,25,26,27,28]. In this paper, we use this model to understand the evolution mechanism of partial discharge of an oil-paper insulation structure under combined voltage more deeply and accurately.

2. Model and Simulation

2.1. The Air Gap Model of Insulating Pressboard

There are often residual air bubbles in the manufacture of a converter transformer and the solidification and decomposition of organic materials. Besides, although vacuum drying and impregnation techniques are usually used, mechanical stress can cause local cracks [17]. These internal air gaps accelerate the aging of an oil-paper insulation structure. Partial discharge in the internal air gap of insulating materials is considered one of the main causes of insulation breakdown.
In the model, the relative dielectric constant of the air gap ε1 inside the insulating medium is 1, and the relative dielectric constant of the insulating medium εr is 3.6~4.5 [12], as shown in Figure 1 Under the applied voltage, the air gap will bear a higher voltage than the insulating pressboard, and the withstand voltage of air is much lower than that of the insulating paperboard, so the air gap will break down in advance. This is a typical partial discharge phenomenon caused by air gap defects. Based on the plasma fluid model, this paper will build a two-dimensional air gap model of oil-paper insulating paperboard to study this phenomenon [29,30].

2.2. The Introduction of the Model Simulation

A two-dimensional axisymmetric model is built using COMSOL Multiphysics, as shown in Figure 2. The model consists of a uniform dielectric material epoxy resin with a width of 0.3 mm, a length of 2 mm and a relative dielectric constant r = 3.6, and a cylindrical cavity with a thickness of 0.1 mm and a length of 1 mm. The cavity is filled with atmospheric air at a temperature of 300 K.

2.2.1. The Ratio of Combined Voltage

In order to build a better model, the AC–DC ratio of externally applied combined voltage used in this simulation refers to the AC–DC ratio used by the valve side winding of a converter transformer in an insulation withstand test. According to the test requirements of the Institute of Electrical and Electronics Engineers (IEEE) and the International Large Power Grid Conference (CIGRE), the insulation withstand test voltage at the valve side of a ±800 kV converter transformer is jointly determined by DC component VDC and AC component VAC. Considering the loss of the smoothing reactor and rectifier circuit, the voltage of a single rectifier bridge in a converter transformer is
Vdr = 1.175 Vac,
where Vac is the power supply voltage of the rectifier bridge, and the AC component of the withstand test voltage at the valve side of the converter transformer is:
V AC = V ac / 3 ,
The DC component of withstand test voltage VDC is:
VDC = (p − 0.5) Vdr,
where p represents the number of rectifiers. There are four rectifiers in the ±800 kV converter transformer. Replace p = 1, 2, 3, and 4 into Equation (3) successively. It can be seen that the ratio of AC effective voltage to DC average voltage in the withstand test voltage at the valve side of the transformer is 1:1, 1:3, 1:5, and 1:7, respectively.
In the simulation, the AC voltage component VAC with frequency (f = 50 Hz) and the DC voltage component VDC with different ratios (VDC + VAC = 1.49 kV) are applied to the upper surface AB of the simulation model, and the lower surface CD of the model is grounded. The total amplitude of the applied AC–DC combined voltage of the model has always been 1.49 kV, but the AC–DC component proportions of the composite voltage are 1:1, 1:3, 1:5, and 1:7, respectively.

2.2.2. Partial Discharge Numerical Simulation Model

Based on the work of previous researchers, the simulation model in this paper considers the main particles and chemical reactions in the air [28]. The main particles considered are: electrons, N2+, N4+, O2+, O4+, O, and O2 ions, N and O ground state atoms, N2, O2, and O3 ground state molecules, O (1D) excited state atoms, N2 (A) and N2 (B) electron excited state nitrogen molecules, N2 (v = 1–4) and O2 (v = 1–2) vibrational excited state molecules, and O2 (a), O2 (b), and O2 (c) electron excited state oxygen molecules [28,30]. Additionally, the chemical scheme is shown in the Appendix A (Table A1 and Table A2). Note that the rate coefficients of electron-collision reactions f ( ε ¯ )   are precalculated by Bolsig + software with the cross-section data taken from, as well as the electron energy distribution function (EEDF). The relationship between f ( ε ¯ ) and EEDF is given by the following integral [31]:
f ( ε ¯ ) = 0 2 e m e ε σ l F ε ¯ ( ε ) d ε
here, e is the elementary charge, ε is the electron energy, σl is the collision cross-section for reaction l, and F ε ¯ ( ε )   is EEDF. It is worth noting that f ( ε ¯ ) is the function of the mean energy [31].
The electron migration and other relevant particle parameters of the model are analyzed by the Boltzmann equation, and electron energy density is obtained by solving the continuity equations through the drift-diffusion approximation:
n e t + · Γ e = S e ,
n ε t + · Γ ε = S ε E · Γ e ,
Γ e = μ e n e E D e · n e e ,
Γ ε = 5 3 μ e n ε E 5 3 D e · n ε ,
where ne and nε are the electron number density and electron energy in the simulation, respectively, and the initial values are set as 2 × 10⁶ [m3] and 3 [eV], respectively. Гe and Гε represent electron flux and electron energy flux, respectively. The source term Se describes the change in ne due to the chemical reaction, and the electron energy source term Sε represents the energy change caused by inelastic collision. E represents the electric field strength, and E·Гe stands for Joule heat. μe represents electron mobility [31,32].
The electron diffusion coefficient De is obtained by using Einstein’s relation
D e = μ e T e
where the electron temperature Te is calculated by:
T e = 2 3 ε ¯ = 2 n ε 3 n e
where ε ¯ is the mean electron energy.
The transport process of different heavy particles is solved by the multicomponent diffusion equation:
ρ ω k t = · j e + S k ,
where ρ represents the density of the mixture, ωk is the mass fraction, Sk is the source term, and jk is the flux vector.
The Poisson equation is used to describe the potential distribution in the air gap:
· ( ε 0 ε r φ ) = ρ V ,
where ε0 is the vacuum dielectric constant, φ is the potential, and ρv is the space charge density [33].
In partial discharge, the particles in the air gap will interact with the air gap surface and accumulate on the air gap surface. The following equation is characterizing the interaction between particles and air gap wall:
n · Γ e = 1 2 v e , t h n e α s n e μ e E · n i γ i ( Γ i · n ) ,
n · Γ ε = 5 6 v e , t h n ε α s n ε μ ε E · n i γ i ε i ( Γ i · n ) ,
v e , t h = 8 T e π m e ,
The electron flux and electron energy density on the wall can be obtained by the above formula [34]. The boundary condition of surface charge density ρs in the simulation can be solved according to the following formula:
ρ s t = n · J e + n · J i ,
ρ s = n · ( D 1 D 2 ) ,
where Je and Ji are the electron current density and ion current density, respectively, and D1 and D2 are the potential displacement vector of the dielectric layer boundary in the air gap, respectively.
In order to ensure the conservation of total molar mass of the simulation model, the boundary conditions of heavy particles are:
n · j k = M k R s u r f , k + α s M k c k μ k , m z k E · n
where jk, Mk, Rsurf, k, and ck represent the flux, molar mass, surface reaction rate, and mass fraction of heavy particles, respectively [32,33,34,35,36,37,38,39,40].
In this paper, the simulation research will be carried out based on the above model. The previous research of our research group shows that in the partial discharge with a similar geometric size, the photoionization reaction will not affect the discharge morphology of partial discharge. Therefore, photoionization is not considered in this paper [27,28].

3. Results

In the simulation of this paper, the length and width of the air gap and the amplitude of the applied voltage of the model are fixed. We compared the discharge evolution process by adjusting the AC–DC ratio in the combined voltage. Previously, Mai Hong et al. conducted a large number of experiments on oil-paper air gap partial discharge under combined voltage with different AC–DC ratios and found that there is polarity effect in partial discharge [38]. When the DC component of the combined voltage increases, the discharge mainly occurs in the half cycle of the same polarity of the AC component and DC component. When the AC–DC ratio exceeds 1:1, the role of the DC component becomes more and more prominent until there is almost no discharge in another half cycle with opposite AC and DC polarity [41,42].
In order to observe the polarity effect of partial discharge under combined voltage, the normalized periodic electron density spatial distribution diagram under different AC–DC ratios of combined voltage is obtained by simulation, and the axial electron distribution of the air gap in a cycle can be known by Figure 3. In Figure 3, the R axis of this figure is the axial width of the air gap of the model, and the Z axis represents the timeline of the tenth discharge cycle of the simulation. In this simulation, we run ten discharge periods. Figure 3 is the normalized distribution of electron density in the tenth period. Additionally, 0.19 in Figure 3 represents the half period of the tenth period, which is the AC voltage component from the positive half period to the negative half period.
As can be seen from Figure 3a, when the applied voltage is pure AC voltage, the discharge will occur in the positive and negative half cycle, the electron density distribution area is similar, and the magnitude of electron density is of the same order. When the AC/DC ratio of the applied voltage is 1:1, it can be seen that although the discharge occurs in both positive and negative half cycles, it is obvious that the electron density distribution area in the positive half cycle is larger and the order of magnitude of electron density is higher, as shown in Figure 3b. Once the ratio of AC–DC exceeds 1:1, it can be seen from Figure 3c–e that the discharge is concentrated in the positive half cycle, and the negative half cycle discharge is almost invisible. Comparing Figure 3c–e, it is found that when the DC component in the combined voltage increases, the electron aggregation region in the positive half cycle gradually increases, centered on the position of 1/4 cycle (0.185 s).
Combined with the simulation results and the experimental results of previous scholars, it can be seen that when the DC component in the applied combined voltage is significantly greater than the AC component, the electric field vector direction in the air gap is consistent with the polarity of the DC voltage component and will not change with the polarity of the AC component. At this time, the strong discharge in the air gap is concentrated in the positive half cycle, in which the AC component and DC component have the same polarity. Moreover, when the proportion of the DC component in the combined voltage is large, even if the polarity of the AC voltage changes, the DC voltage applied to the upper plate can still attract a large amount of electron aggregation. Therefore, the electron aggregation region in Figure 3c–e expands with an increase in the DC component. The simulation results are consistent with the experimental results of Mai Hong [41]; the partial discharge under the combined voltage does have a polarity effect.
From the above simulation results, it is easy to see that the partial discharge phenomenon under the combined voltage with an AC–DC ratio of 1:1 in Figure 3b is similar to that under pure AC voltage in Figure 3a. The partial discharge phenomenon under the combined voltage with an AC–DC ratio of 1:3, 1:5, and 1:7 is quite different from that under the pure AC voltage. Therefore, in order to better analyze the role of the DC component in the combined voltage, our work focuses on analyzing the results from a simulation, which is under the AC–DC voltage ratios of 1:3, 1:5, and 1:7 [43,44,45,46].

4. Analysis

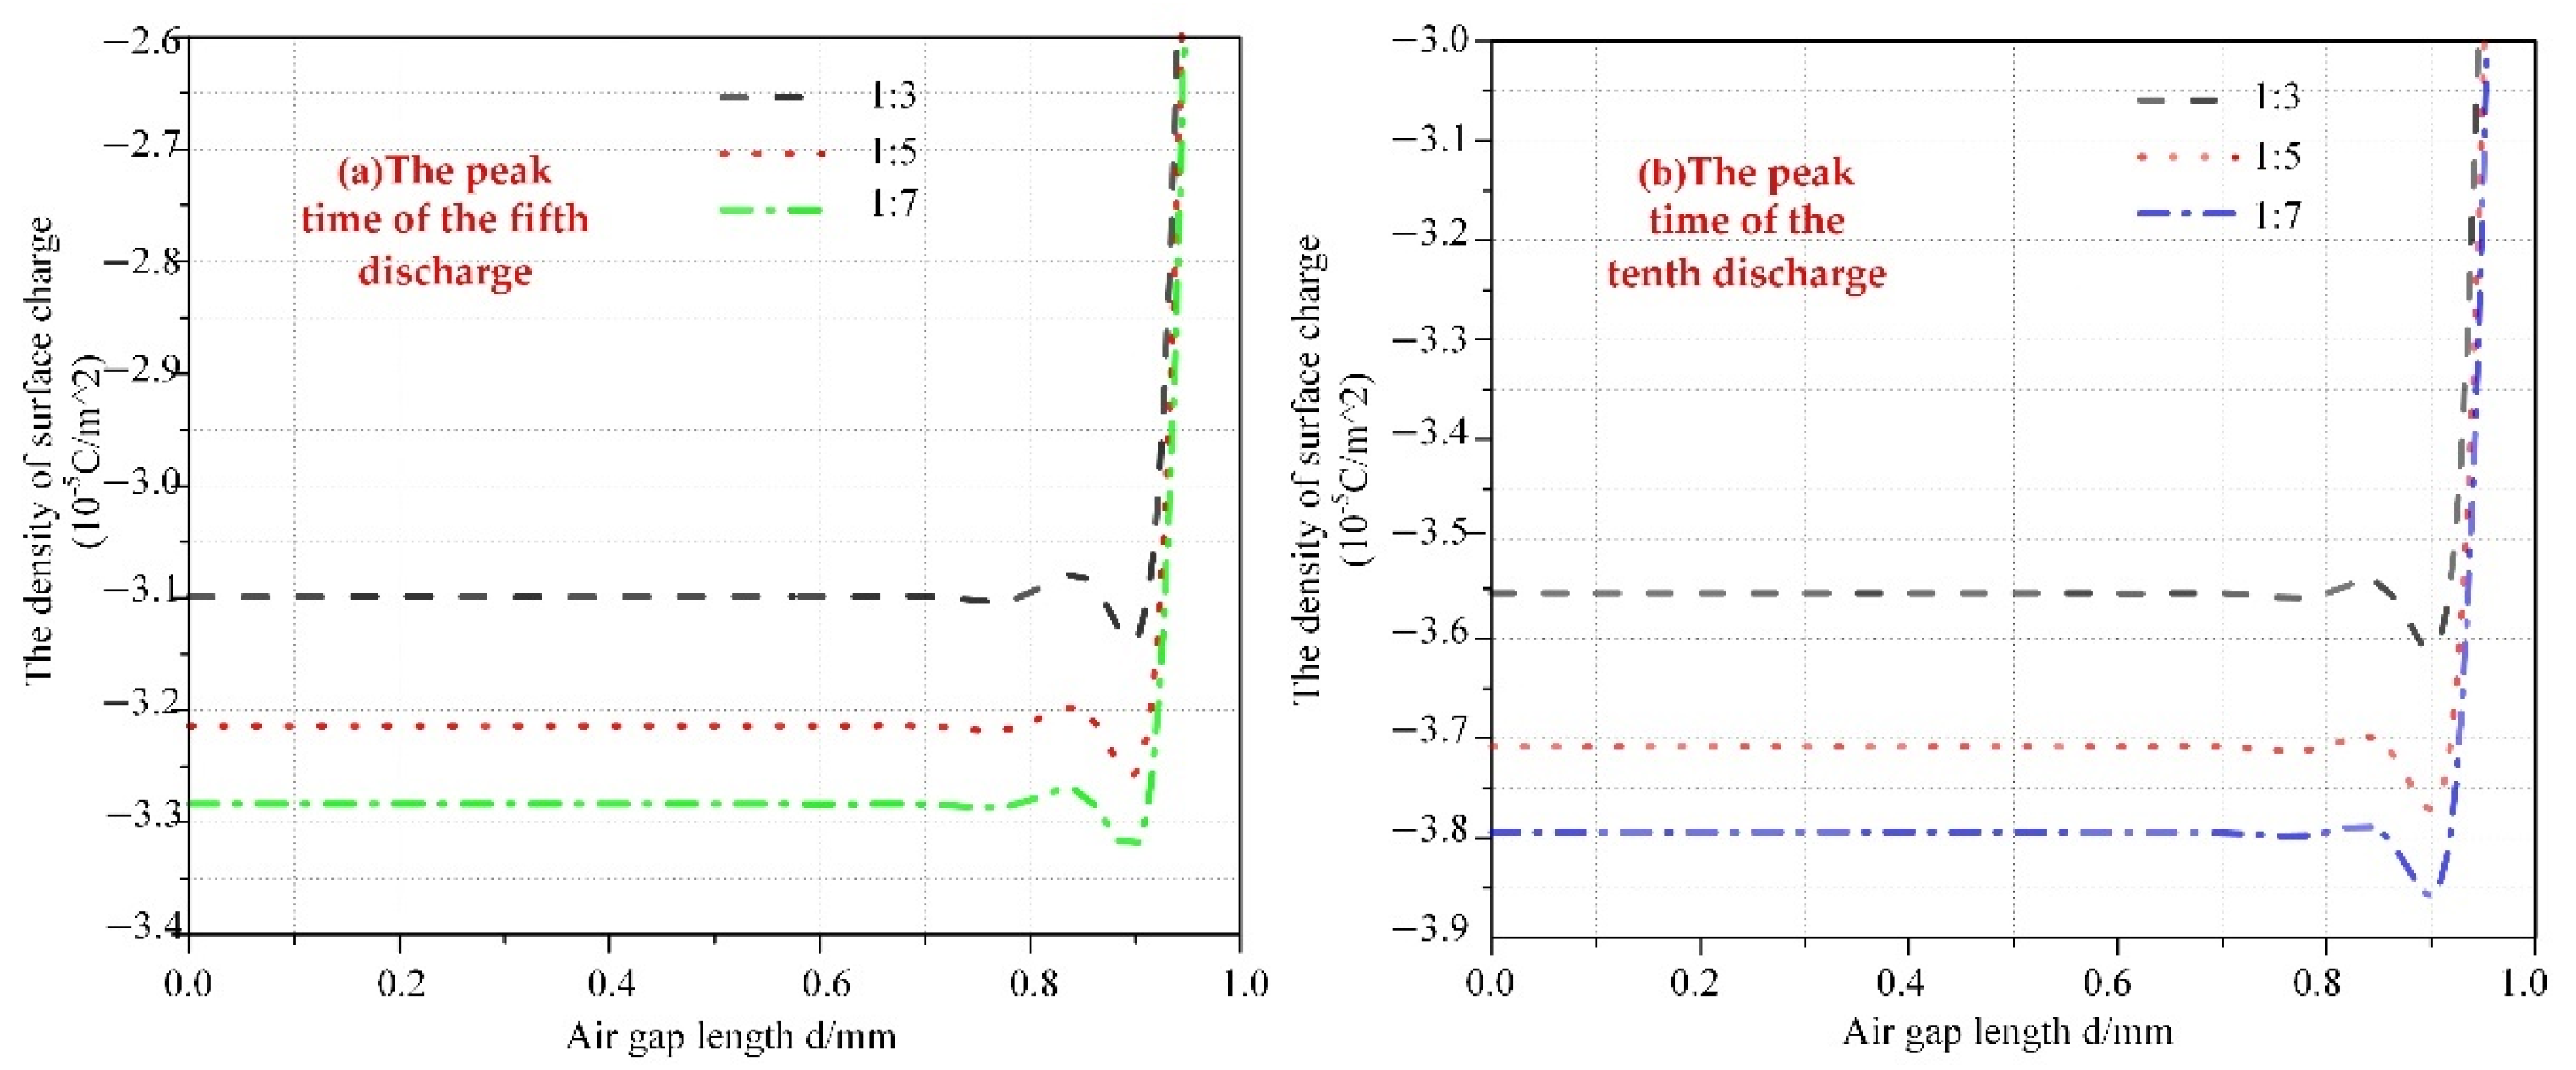
In order to further study the influential mechanism of the DC component in a combined voltage acting on the partial discharge and verify the conjecture of scholars about the action mechanism of the DC voltage component, we have drawn Figure 4 to compare the effect of the DC voltage component in the combined voltage. Figure 4 shows the change in charge density on the upper surface in the model at the peak time of the fifth and tenth discharge in the air gap under 1:3, 1:5, and 1:7 combined voltages. When the discharge reaches the fifth and tenth times, the charge distribution in the air gap is almost stable, which can help us better qualitatively analyze the simulation results.
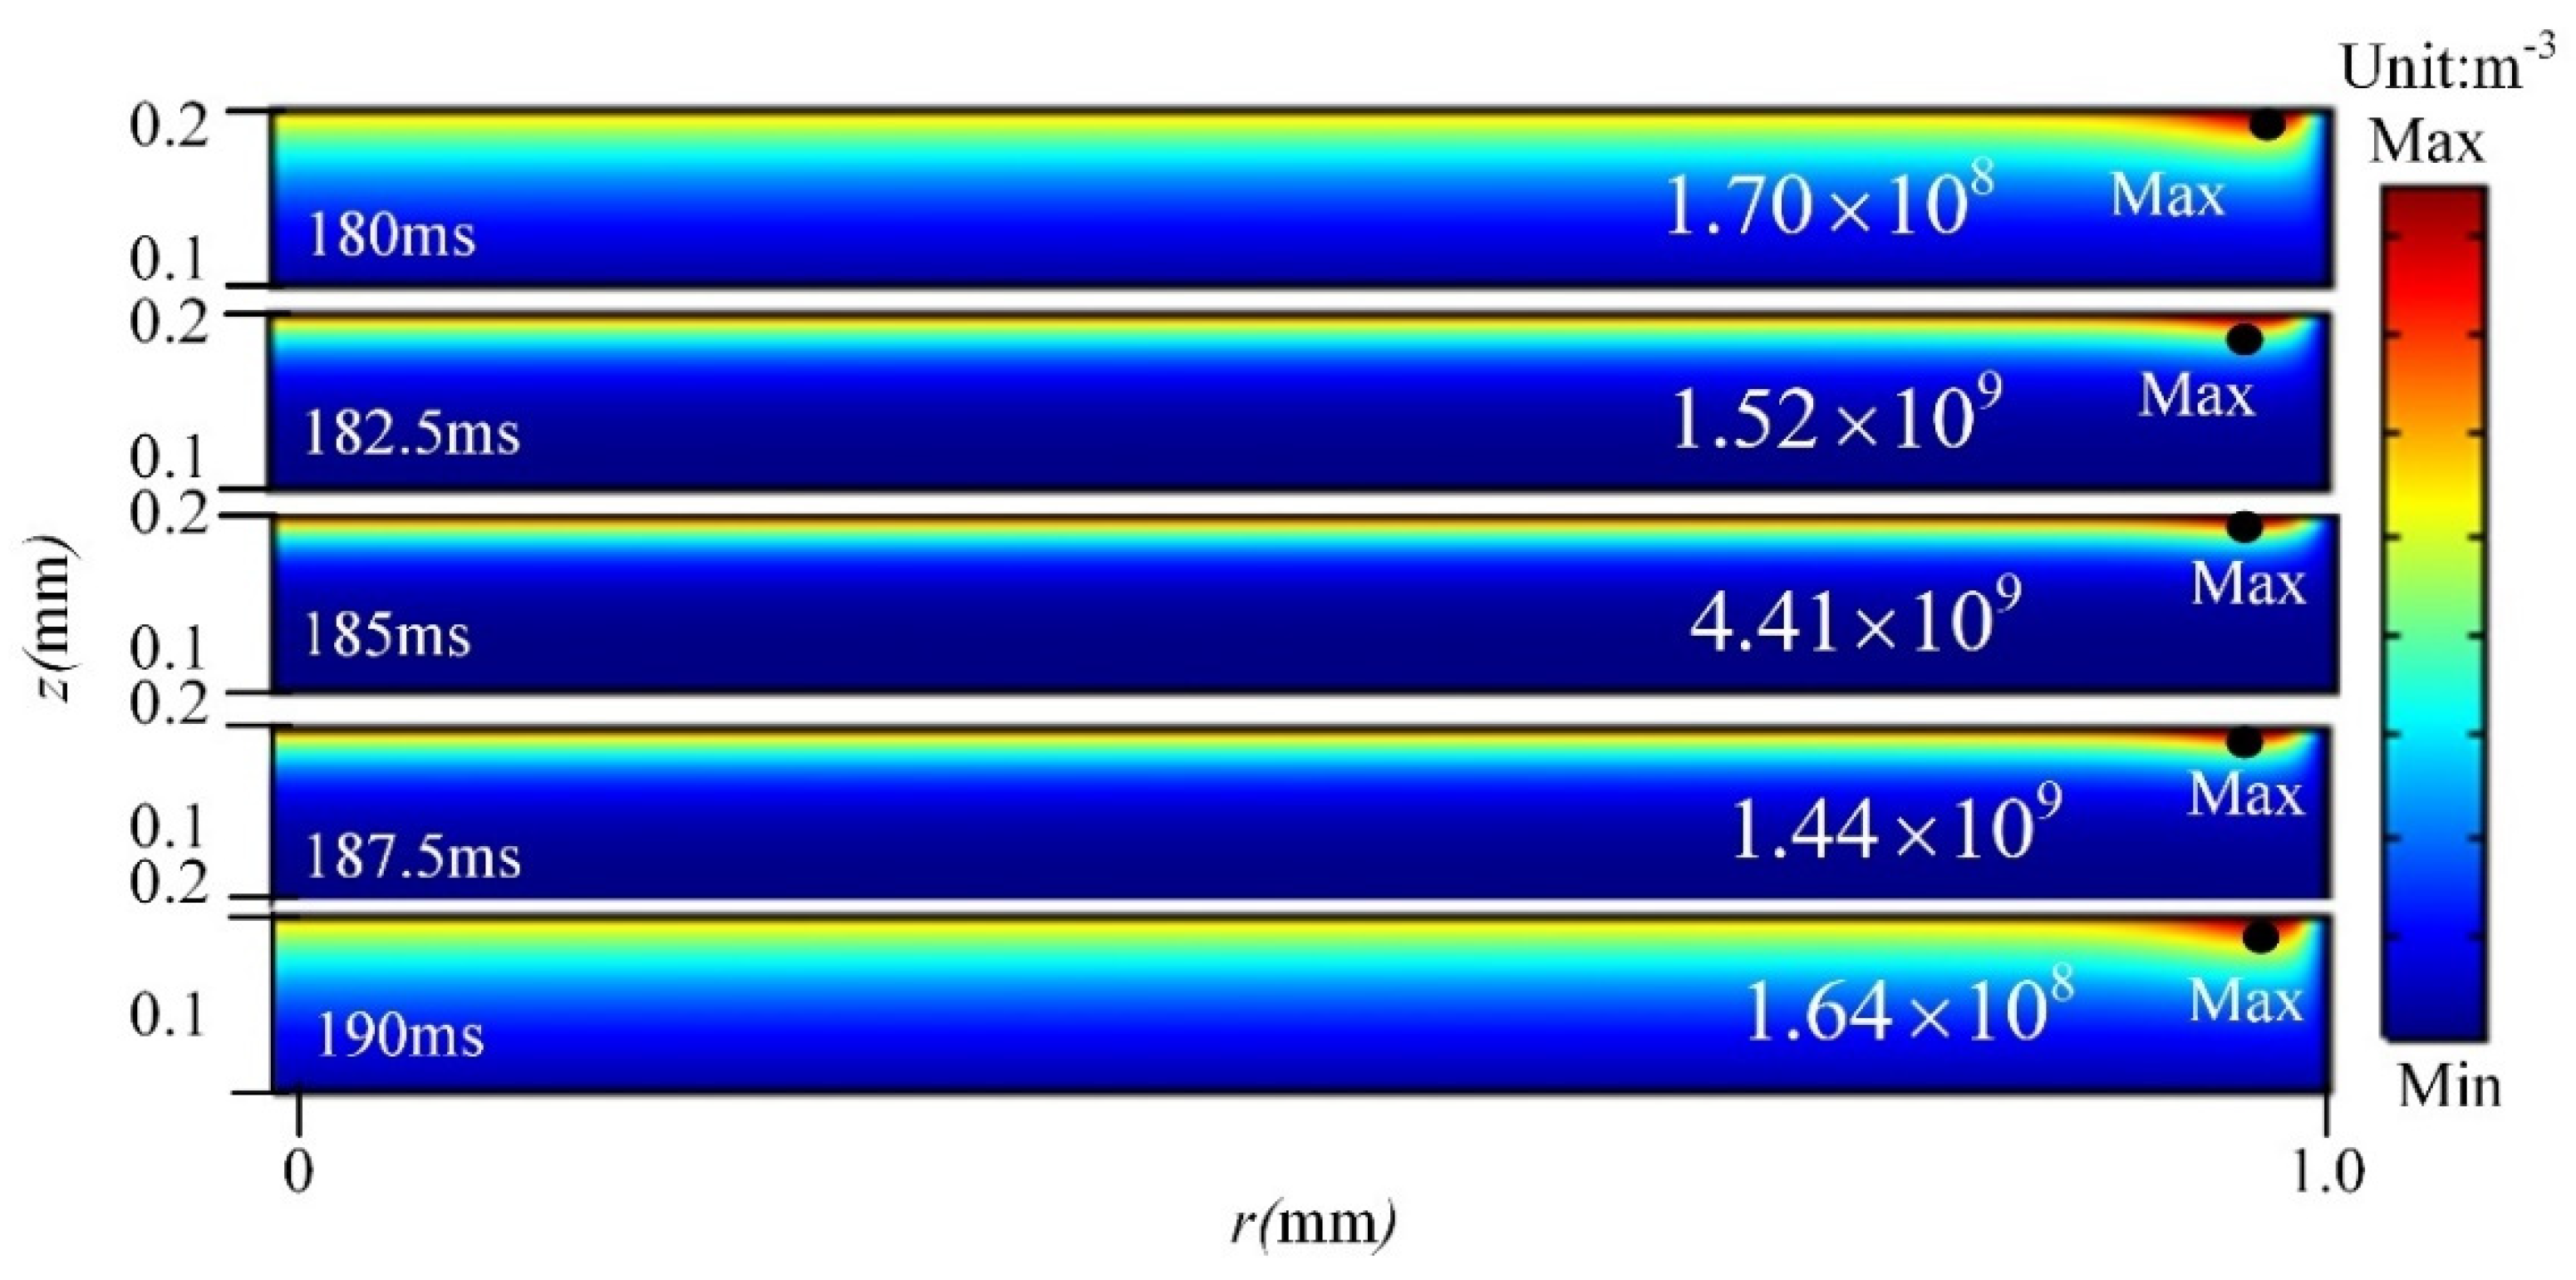
Figure 4 shows the radial surface charge distribution inside the air gap. From the figure, it can be found that the surface charge density is a straight line at the left and middle of the air gap without much change. At the right edge of the air gap, the surface charge increases suddenly. In order to further study the reason for the sudden increase in charge here, Figure 5 shows the electron density evolution diagram of the tenth discharge cycle under the combined voltage with an AC–DC ratio of 1:3. The change in electron density under combined voltage with ratios of 1:5 and 1:7 is similar to that of 1:3, so 1:5 and 1:7 are not listed here.
As can be seen from Figure 5, the maximum electron density appears on the right side of the air gap. It can be seen that the strong partial discharge in the air gap occurs here. As can be seen from Figure 6, the electric field distortion occurs at the edge of the air gap. Due to the Townsend ionization coefficient, α in the collision ionization equation is positively correlated with the electric field intensity, so the strong partial discharge first appears in the middle. With the development of discharge, more and more charges are accumulated in the middle, and a large number of accumulated space charges inhibits the internal discharge. In the tenth discharge cycle of Figure 5, the partial strong discharge has moved to the right of the air gap. The surface charge density on the right side of Figure 4 decreases sharply after a sudden increase because it is close to the insulating material wall.
It can be seen from Figure 4 that when the DC component in the combined voltage increases, the surface charge density increases. In addition, the surface charge density at the tenth discharge peak is higher than that at the fifth discharge peak. Thus, we predicted that with the development of discharge, the surface charge will accumulate.
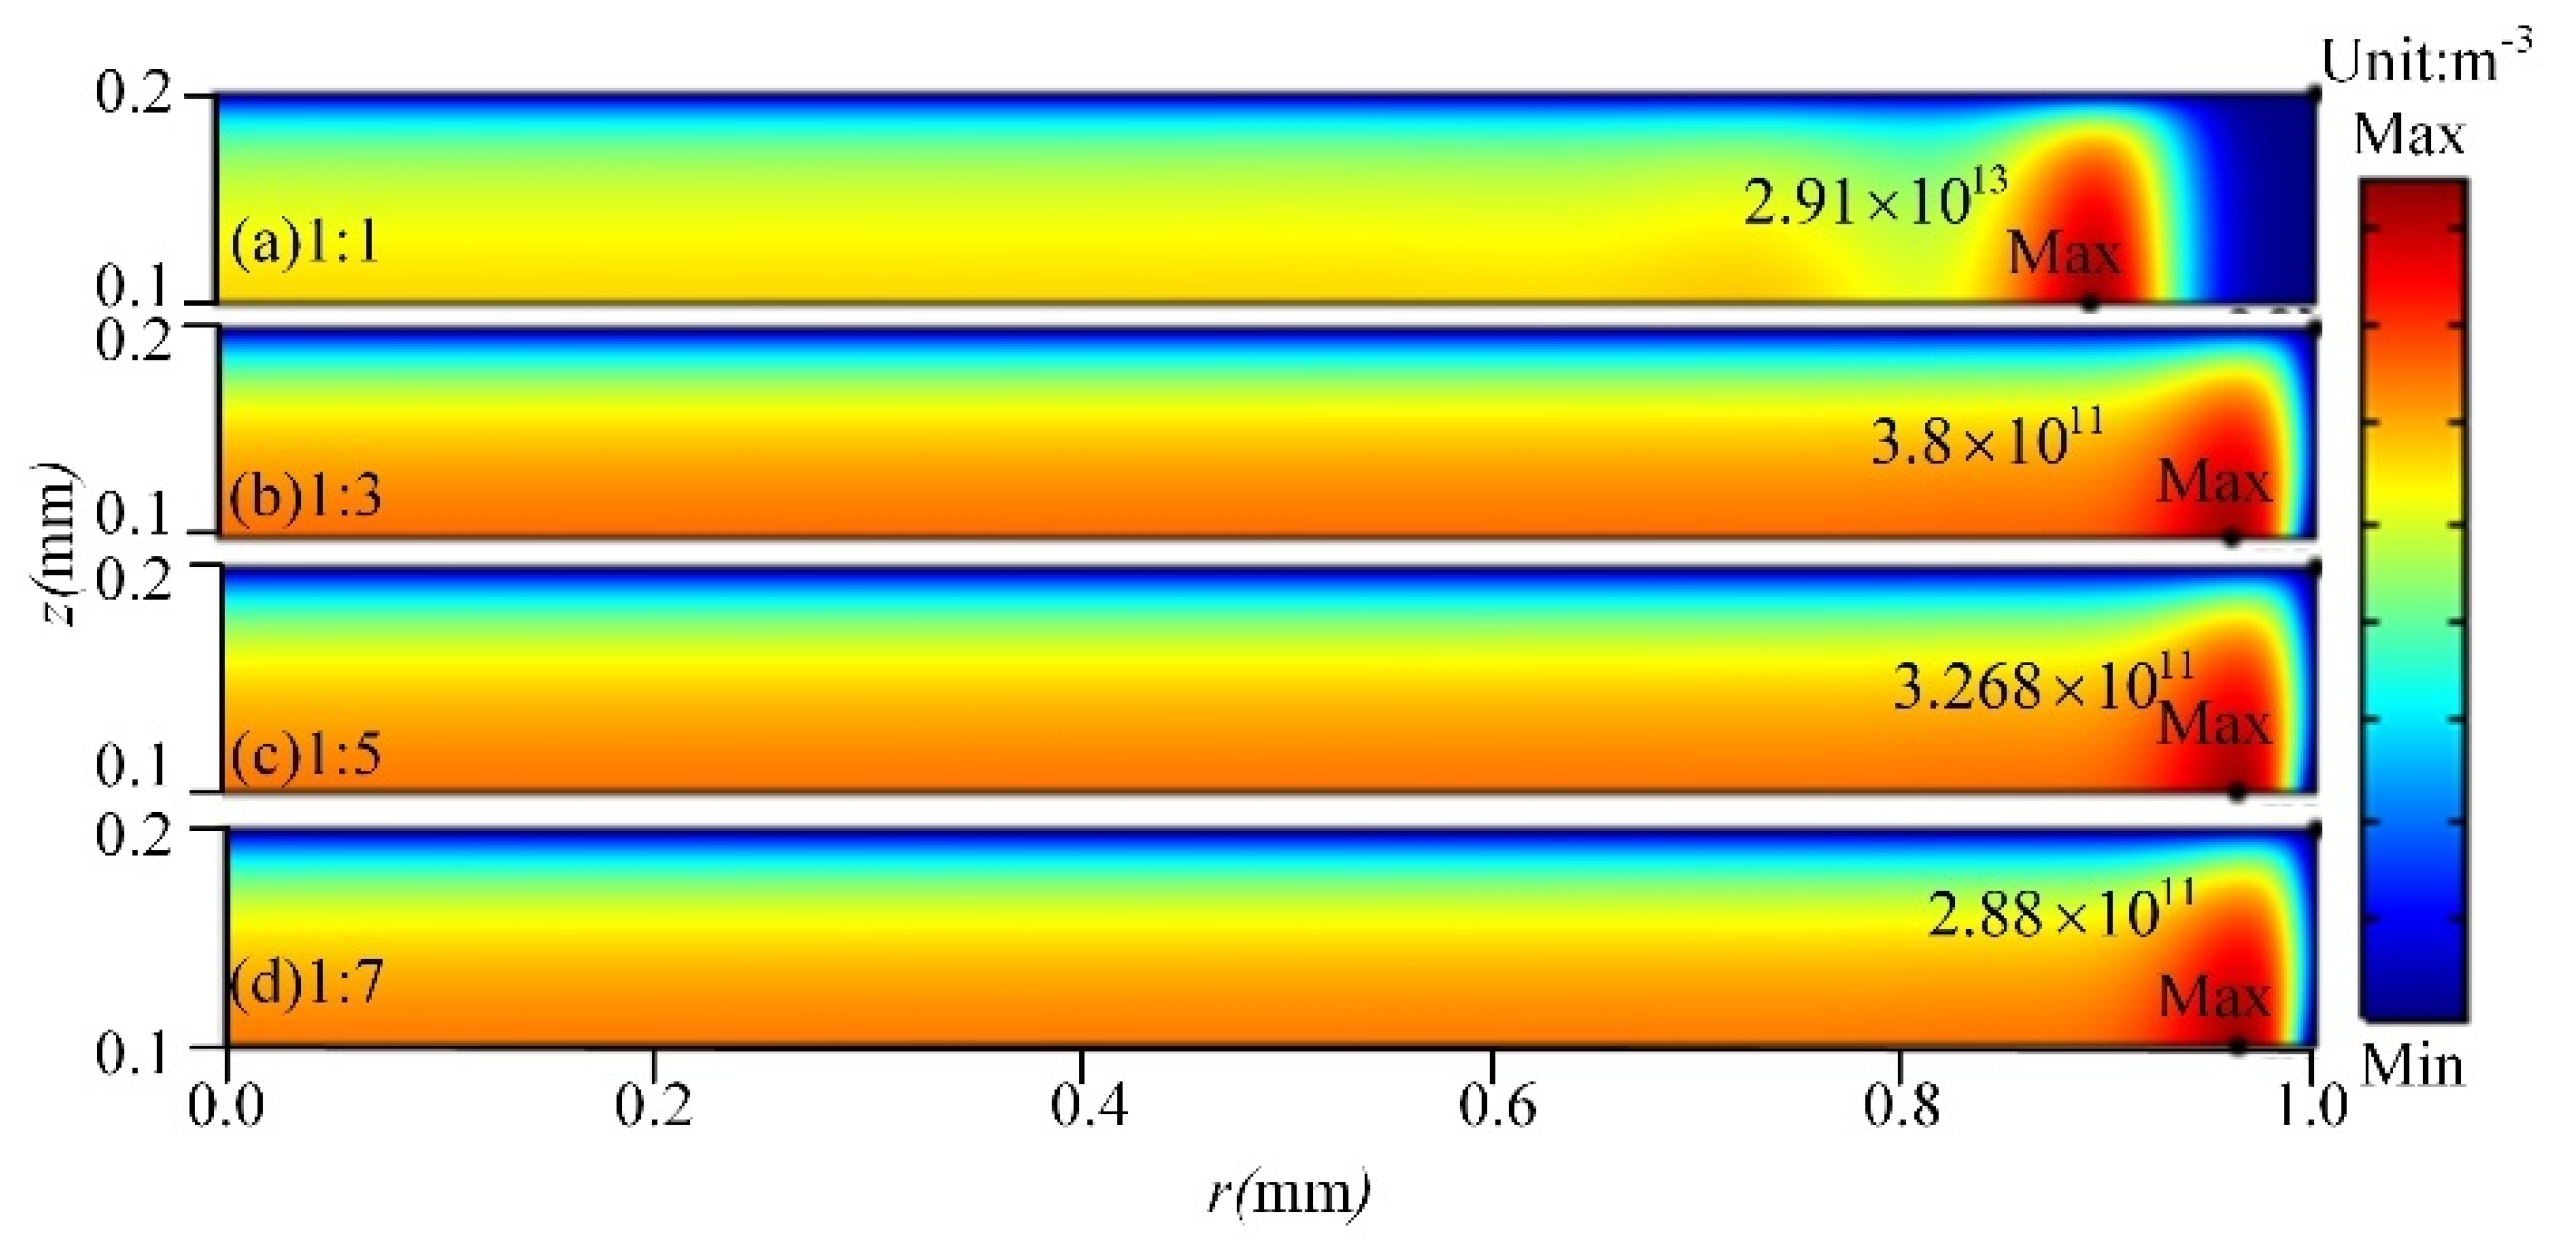
In order to further analyze the effect of the DC voltage component acting on the space charge in the air gap, Figure 7 shows the spatial distribution of positive ions in the air gap under each AC–DC combined voltage ratio. As shown in Figure 7, it can be found that under the combined voltage with an AC–DC ratio of 1:1, the spatial distribution of positive ions is mainly concentrated in the strong discharge area on the right side of the air gap, and the distribution of positive ions in other areas in the air gap is relatively thin. Comparing the spatial distribution of positive ions under the combined voltage with an AC–DC ratio of 1:3, 1:5, and 1:7, it is found that the distribution of positive ions is more dispersed, and the concentration is more uniform with an increase in the DC component. It can be seen from Figure 3 that different from the amplitude of the AC voltage changing with time, when the DC voltage component increases, the air gap is continuously affected by the electric field with the same polarity as the DC voltage throughout the discharge cycle. Therefore, under the effect of the fixed electric field, the distribution of space charge will be more uniform and dispersed, resulting in the expansion of the discharge area, but the discharge intensity is obviously weakened.
According to the analysis of Figure 4 and Figure 7, when the DC voltage component increases, the surface charge density in the air gap increases and the space charge distribution becomes more dispersed. In conclusion, the simulation results in this paper are consistent with the previous analysis of scholars that an increase in the DC voltage component will cause an increase in surface charge and space charge [17,18,19,20,21].
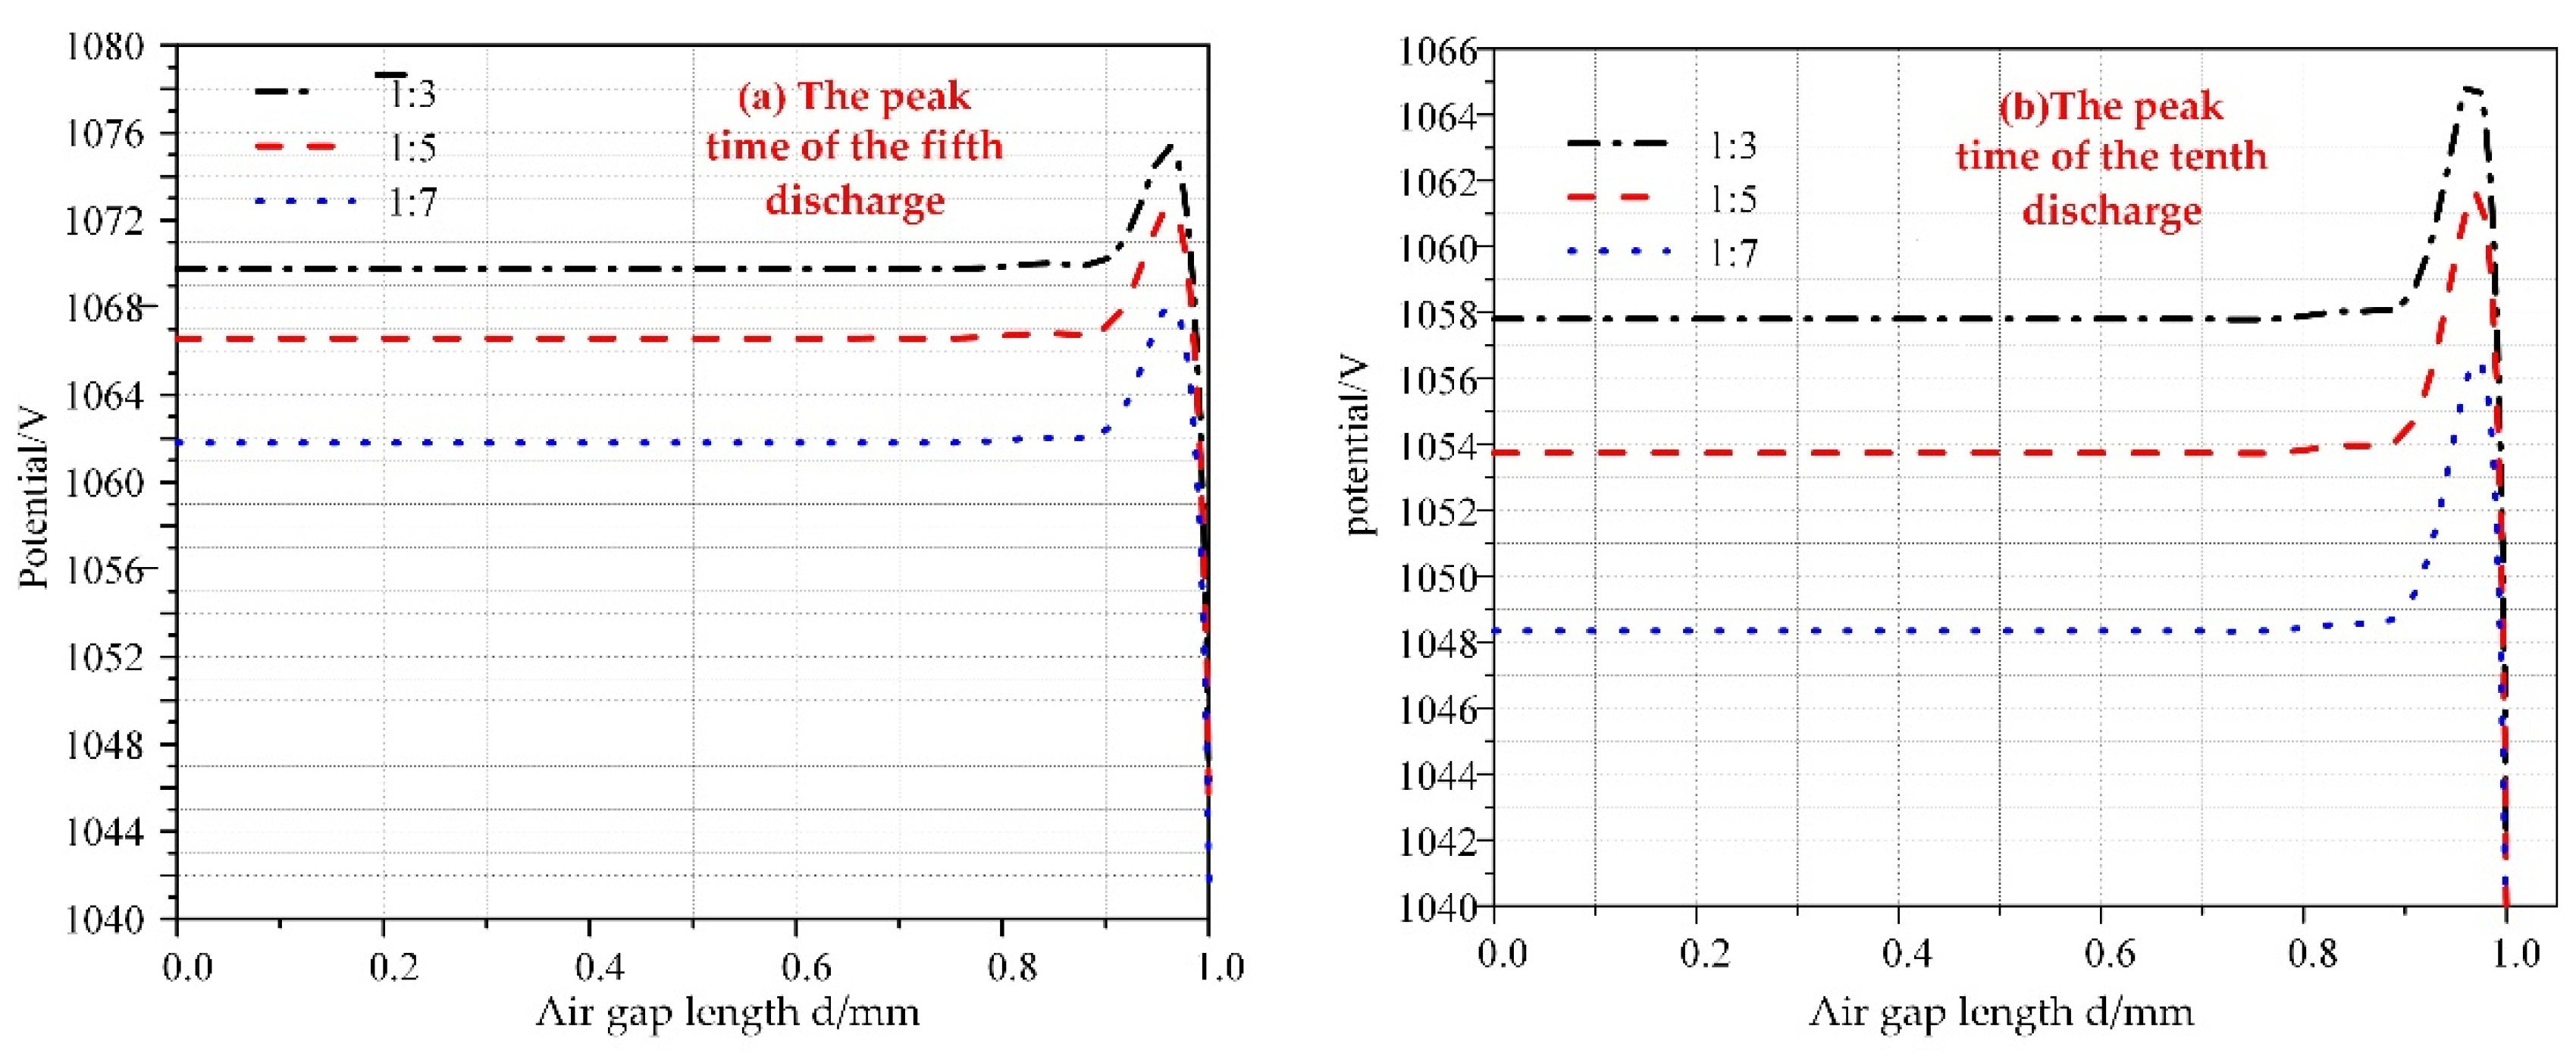
Comparing the spatial distribution of positive ions under each combined voltage ratio in Figure 7, we found that the density of positive ions decreases with an increase in the DC voltage component. We believed when the DC voltage component increases, the surface charge and space charge in the air gap become more active, resulting in a large number of charges gathering on the surfaces of the upper and lower plates. Finally, an electric field with opposite polarity to the applied external DC voltage component is generated in the air gap, which weakens the effect of the external combined voltage and inhibits the development of strong discharge in the air gap. To verify this conjecture, we drew the potential distribution at the peak time of the fifth and tenth discharge under each combined voltage ratio, as shown in Figure 8.
Figure 8 shows the surface potential inside the air gap under 1:3, 1:5, and 1:7 combined voltages. It can be seen that the surface potential of the air gap gradually decreases with an increase in the DC voltage component in the composite voltage. This phenomenon will weaken the strong discharge phenomenon in the air gap, resulting in a decrease in positive ion density and electron density in the air gap. Comparing the two figures (a) and (b) of Figure 8, it is found that the potential decreases gradually with the development of discharge. It can be seen from the above that with the development of discharge, the upper and lower surface charges in the air gap will accumulate. Thus, a larger reverse electric field is generated in the air gap, which reduces the potential in the air gap.
The simulation results in this paper qualitatively conform to the experimental phenomena of Li, Qi, and Sha and clarify the evolution process of partial discharge in air gap under combined voltage from a physical perspective.

5. Conclusions

Based on the plasma fluid model, the partial discharge characteristics and evolution mechanism of an oil-paper insulation structure of a converter transformer under AC–DC combined voltage are studied in this paper.
The numerical simulation shows that with an increase in the DC component in the combined voltage, the discharge area in the air gap expands, but the discharge intensity decreases obviously. This is because when the DC voltage component is large, the air gap is continuously affected by the electric field of the same polarity as the DC voltage, which makes the particles in the air gap more active and the space charge distribution more dispersed. With an increase in the DC voltage component in the combined voltage, the surface charge density in the air gap increases accordingly, and a large number of charges accumulate on the upper and lower surfaces of the air gap. Thus, an electric field opposite to the polarity of the DC component in the combined voltage is generated, which weakens the applied combined voltage and reduces the potential in the air gap.
The simulation results in this paper are qualitatively consistent with the experiment and simulation results of previous researchers. An increase in the DC component in the combined voltage can effectively reduce the strong discharge phenomenon in the air gap, so as to reduce the incidence of partial discharge. In this paper, the mechanism of partial discharge under AC/DC combined voltage is studied by simulation, which not only defines the evolution process of partial discharge in oil-paper insulating paperboard under combined voltage from the perspective of micro particles, but also provides a new idea and direction for reducing the occurrence of partial discharge in practical engineering.

Author Contributions

Conceptualization, J.W. and D.D.; methodology, B.L.; software, L.J.; validation, L.L., T.W.; formal analysis, D.D.; investigation, J.W.; resources, B.L.; data curation, L.J.; writing—original draft preparation, J.W. and D.D.; writing—review and editing, B.L.; visualization, T.W.; supervision, L.L.; project administration, D.D.; funding acquisition, L.J. All authors have read and agreed to the published version of the manuscript.

Funding

This research was funded by National Engineering Laboratory for Ultra High Voltage Engineering Technology (Kunming, Guangzhou), grant number NEL201906.

Institutional Review Board Statement

Not applicable.

Informed Consent Statement

Not applicable.

Conflicts of Interest

The authors declare no conflict of interest.

Appendix A

Table A1. Gas-phase reactions considered in the model.
Reaction No.Reaction EquationRate ConstantThreshold (eV)Ref.
1e + N2 ⇒ e + N2 f ( ε ¯ ) (m3 s−1)/[46]
2e + N2 ⇒ e + N2 (v = 1–4) f ( ε ¯ ) (m3 s−1)0.2889, 0.8559, 1.1342 1.4088[46]
3e + N2 ⇒ e + N2(A) f ( ε ¯ ) (m3 s−1)6.1688[46]
4e + N2 ⇒ e + N2(B) f ( ε ¯ ) (m3 s−1)11.03[46]
5e + N2 ⇒ 2e + N2+ f ( ε ¯ ) (m3 s−1)15.6[46]
6e + O2 ⇒ e + O2 f ( ε ¯ ) (m3 s−1)/[46]
7e + O2 ⇒ e + O2 (v = 1–2) f ( ε ¯ ) (m3 s−1)0.57, 0.75[46]
8e + O2 ⇒ e + O2(A) f ( ε ¯ ) (m3 s−1)0.977[46]
9e + O2(A) ⇒ e + O2 f ( ε ¯ ) (m3 s−1)−0.977[46]
10e + O2 ⇒ e + O2(B) f ( ε ¯ ) (m3 s−1)1.627[46]
11e + O2(B) ⇒ e + O2 f ( ε ¯ ) (m3 s−1)−1.627[46]
12e + O2 ⇒ e + O2(C) f ( ε ¯ ) (m3 s−1)4.5[46]
13e + O2 ⇒ O + O f ( ε ¯ ) (m3 s−1)/[46]
14e + O2 ⇒ O2 f ( ε ¯ ) (m3 s−1)/[46]
15e + O2 ⇒ e + O + O f ( ε ¯ ) (m3 s−1)5.58[46]
16e + O2 ⇒ e + O + O(1D) f ( ε ¯ ) (m3 s−1)8.4[46]
17e + O2 ⇒2e + O2+ f ( ε ¯ ) (m3 s−1)12.1[46]
18e + N2 ⇒ e + N + N1 × 10−14 × Te−0.5exp(−16/Te) (m3 s−1)9.757[24]
19e + N2+ ⇒ N + N4.8 × 10−13(Te/0.026)−0.5 (m3 s−1)/[25]
20e + N4+ ⇒ 2N22 × 10−12(Te/0.026)−0.5 (m3 s−1)/[25]
21e + O2+ ⇒ 2O1.2 × 10−14Te−0.7 (m3 s−1)/[24]
22e + 2O2 ⇒ O2 + O25.17 × 10−43Te−1 (m6 s−1)/[24]
23e + O2+ ⇒ O24 × 10−18 (m3 s−1)/[24]
24e + O4+ ⇒ 2O22.25 × 10−13Te−0.5 (m3 s−1)/[24]
25N2+ + 2N2 ⇒ N4+ + N21.9 × 10−41 (m6 s−1)/[25]
26N4+ + N2 ⇒ N2+ + 2N22.5 × 10−21 (m3 s−1)/[25]
27O + O2+ ⇒ O + O21 × 10−13 (m3 s−1)/[47]
28O2 + O2+ ⇒ 2O24.2 × 10−13 (m3 s−1)/[47]
29O2 + O2+ + O2 ⇒ 3O22 × 10−37 (m6 s−1)/[47]
30O2 + O2+ + N2 ⇒ 2O2 + N22 × 10−37 (m6 s−1)/[47]
31O2 + O4+ + O2 ⇒ 4O22 × 10−37 (m6 s−1)/[48]
32N2+ + N2 + O2 ⇒ N4+ + O25 × 10−41 (m6 s−1)/[48]
33N4+ + O2 ⇒ O2+ + 2N22.5 × 10−16 (m3 s−1)/[48]
34O2+ + 2O2 ⇒ O4+ + O22.4 × 10−42 (m6 s−1)/[48]
35O2 + O4+ + N2 ⇒ 3O2 + N22 × 10−37 (m6 s−1)/[48]
36O2 + N + N ⇒ O2 + N23.9 × 10−45(m6 s−1)/[25]
37O + O + N ⇒ O2 + N3.2 × 10−45 (m6 s−1)/[25]
38O + O2 + N2 ⇒ O3 + N26.2 × 10−46 (m6 s−1)/[48]
39O + O2 + O2 ⇒ O3 + O26.9 × 10−46 (m6 s−1)/[48]
40O + O2+ + N2 ⇒ O3 + N22 × 10−37 (m6 s−1) [35]
41O + O4+ ⇒ O3 + O2+3 × 10⁻¹⁶ (m3 s−1)/[48]
42O + O3 ⇒ O2 + O28 × 10−18 exp(−2060/300) (m3 s−1)/[24]
43O + O3 ⇒ O2 + O2 + e3 × 10−16 (m3 s−1)/[24]
44N2+ + O3 ⇒ N2 + O + O2+1 × 10⁻¹⁶ (m3 s−1)/[24]
45e + O3 ⇒ O2 + O + e1.78 × 10−12 (3Te/2)−0.614 exp(−23/3Te) (m3 s−1)/[24]
46e + O3 ⇒ O + O21 × 10−15 (m3 s−1)/[24]
47e + O3 ⇒O2 + O1 × 10−17 (m3 s−1)/[24]
Table A2. Surface reactions considered in the model.
NumberSurface ReactionReaction ProbabilityγiInitial Electron Mean Energy
S1N2+ + Surface ⇒ N216.5 × 10−43
S2N4+ + Surface ⇒ 2N216.5 × 10−43
S32O + Surface ⇒ O2100
S4O2 + Surface ⇒ O2100
S5O2+ + Surface ⇒ O216.5 × 10−43
S6O4+ + Surface ⇒ 2O216.5 × 10−43

References

  1. Wang, W.Y.; Dou, F.; Cheng, J.M.; Yu, X.; Yang, M.M.; Huang, Q.X. Modelling and Simulation of ±800 kV HVDC Electromagnetic Transients. In Proceedings of the 2020 Asia Energy and Electrical Engineering Symposium, Chengdu, China, 29–31 May 2020. [Google Scholar]
  2. Zhao, L.Y.; Huankun Zheng, H.K. Voltage Stability Analysis for AC/DC System With VSC-HVDC. In Proceedings of the 2019 2nd International Conference on Electronics Technology, Chengdu, China, 10–13 May 2019. [Google Scholar]
  3. Arjen, A.; Meer, V.D.; Ndreko, M. The Effect of FRT Behavior of VSC-HVDCConnected Offshore Wind Power Plants on AC/DC System Dynamics. IEEE Trans. Power Deliv. 2016, 31, 878–887. [Google Scholar]
  4. Zhuo, R. Feature Optimization and Fault Diagnosis of GIS Based on Combined Detection; Chongqing University: Chongqing, China, 2014. [Google Scholar]
  5. Li, S.S.; Jin, X.; Dai, S. Overview on on-line Monitoring System for Transformer Partial Discharge. Northeast. Electr. Power Technol. 2009, 8, 37–40. [Google Scholar]
  6. Li, J. Study on Methods of Recognition Feature Extraction and Fractal Compression for Partial Discharge Gray Intensity Images; Chongqing University: Chongqing, China, 2001. [Google Scholar]
  7. Fu, T.J.; Wang, J.; Zhong, J.T.; Chen, X.H.; Dang, Y.Y.; Lu, J.Z. Insulation Structure Analysis of ±800kV Converter Transformer for DC Transmission. Transformer 2009, 46, 5–9. [Google Scholar]
  8. Fu, L.J.; Liu, W.W.; Zhang, L.; Guan, Y.L.; Jiang, Z.Q. Analysis of insulation material of oil-immersion transformer. Heilongjiang Electr. Power 2019, 41, 232–237. [Google Scholar]
  9. Wang, G.J.; Li, J.J.; Wu, Y.J.; Peng, X.S.; Li, L.; Liu, T.W. Random Forest Based Feature Selection for Partial Discharge Recognition of HV Cables. Power Syst. Technol. 2019, 43, 1329–1335. [Google Scholar]
  10. Zhao, Y.K.; Zhang, G.Q.; Han, D.; Yang, F.Y.; Liu, Y. Study on Surface Discharge Characteristics of Inter-Turn Insulation Materials in High-Frequency Transformers. Trans. China Electrotech. Soc. 2019, 34, 3464–3471. [Google Scholar]
  11. Qi, B.; Wei, Z.; Li, C.R.; Zhang, X.H.; Li, F.; Wang, H.B. Discharge Characteristics of the Typical Defects in Oil-paper Insulation Under AC-DC Compound Voltage. High Volt. Eng. 2015, 41, 639–646. [Google Scholar]
  12. Yang, J.; Du, J.P.; Zong, W. Analysis of Air Gap Partial Discharge in Transformer Insulation. Transformer 2011, 48, 25–29. [Google Scholar]
  13. Bo, Q.; Zhen, W.; Li, C.R. Creepage Discharge of Oil-pressboard Insulation in AC-DC Composite Field: Phenomenon and Characteristics. IEEE Trans. Dielectr. Electr. Insul. 2016, 23, 237–245. [Google Scholar]
  14. Li, P.H.; Du, H. Effects of Combined AC-DC Voltage on Breakdown Characteristics in Epoxy Resin Considering High Temperature Superconducting Insulation. In Proceedings of the 2018 IEEE International Conference on Applied Superconductivity and Electronmagnetic Devices, ASEMD, Tianjin, China, 15–18 April 2018. [Google Scholar]
  15. Mei, D.H.; Fang, Z.; Shao, T. Recent Progress on Characteristics and Applications of Atmospheric Pressure Low Temperature Plasmas. Proc. CSEE 2020, 40, 1339–1358. [Google Scholar]
  16. Li, L.C.; Rao, H.; Dong, X.Z.; Cheng, J.W.; Zhao, X.H.; Luo, B. Prospect of Computational High Voltage Engineering. High Volt. Eng. 2018, 44, 3441–3453. [Google Scholar]
  17. Qi, B.; Wei, Z. Influences of Different Ratios of AC-DC Combined Voltage on Internal Air-gap Discharge in Oil-pressboard Insulation. IEEE Trans. Power Deliv. 2016, 31, 1026–1033. [Google Scholar] [CrossRef]
  18. Wen, X.M. Characteristics Research on Surface Discharge of Oil-Paper Insulation Structure under Combined AC-DC Voltage; Dalian University of Technology: Dalian, China, 2018; pp. 4–25. [Google Scholar]
  19. Wang, Y.S.; Zhou, Y.X.; Li, G.F. Space Charge Phenomena in Oil-Paper Insulation Materials Under High Voltage Direct Current. High Volt. Eng. 2008, 5, 873–877. [Google Scholar]
  20. Sha, Y.C.; Zhou, Y.X. Partial Discharge Characteristics in Oil-paper Insulation under Combined AC-DC Voltage. IEEE Trans. Dielectr. Electr. Insul. 2014, 21, 1529–2539. [Google Scholar] [CrossRef]
  21. Callender, G.; Tanmaneeprasert, T.; Lewin, P.L. Simulating partial discharge activity in a cylindrical void using a model of plasma dynamics. J. Phys. D Appl. Phys. 2019, 52, 169501. [Google Scholar] [CrossRef]
  22. Callender, G.; Golosnoy, I.O.; Lewin, P.L. Critical Analysis of Partial Discharge Dynamics in Air Filled Spherical Voids. J. Phys. D Appl. Phys. 2018, 51, 125601. [Google Scholar] [CrossRef] [Green Version]
  23. Brauer, I. Simulation of self-organized filaments in a dielectric barrier glow discharge plasma. J. Appl. Phys. 1999, 85, 7569. [Google Scholar] [CrossRef]
  24. Ning, W.J.; Dai, D.; Zhang, Y.H. Simulation of Nonlinear Phenomena in Short-gap Atmospheric Helium Dielectric Barrier Discharge with One-dimensional Fluid Model. High Volt. Eng. 2017, 43, 1845–1853. [Google Scholar]
  25. Wang, Q.; Ning, W.J.; Dai, D.; Zhang, Y.H.; Ouyang, J.T. Characteristics and mechanisms of transition from filament to homogeneous glow in atmospheric helium dielectric barrier discharges under variation of the applied voltage amplitude. J. Phys. D Appl. Phys. 2019, 52, 205201. [Google Scholar] [CrossRef]
  26. Wan, J.; Ning, W.J.; Zhang, Y.H.; Dai, D. Influence of Gap Width on the Multipeak Characteristics of Atmospheric Pressure Helium Dielectric Barrier Discharges a Numerical Approach. Trans. China Electrotech. Soc. 2019, 34, 871–879. [Google Scholar]
  27. Bourdon, A.; Pasko, V.P.; Liu, N.Y.; Marode, E. Efficient models for photoionization produced by non-thermal gas discharges in air based on radiative transfer and the Helmholtz equations. Plasma Sources Sci. Technol. 2007, 16, 656–678. [Google Scholar] [CrossRef]
  28. Zhang, Y.H.; Dai, D. Influence of nitrogen impurities on the characteristics of a patterned helium dielectric barrier discharge at atmospheric pressure. Plasma Sci. Technol. 2019, 21, 074003. [Google Scholar] [CrossRef]
  29. Martens, T.; Bogaerts, A.; Brok, W.J.M. The dominant role of impurities in the composition of high pressure noble gas plasmas. Appl. Phys. Lett. 2008, 92, 041504. [Google Scholar] [CrossRef] [Green Version]
  30. Sakiyama, Y.; Graves, D.B.; Chang, H.W. Plasma chemistry model of surface microdischarge in humid air and dynamics of reactive neutral species. J. Phys. D Appl. Phys. 2012, 45, 425201. [Google Scholar] [CrossRef]
  31. Gao, F.; Wang, Q.; Dai, D. Numerical study on partial discharge in a dry air cavity with a two-dimensional fluid model considering practical reactions. J. Phys. D Appl. Phys. 2020, 53, 345202. [Google Scholar] [CrossRef]
  32. Hagelaar, G.J.M.; Pitchford, L.C. Solving the Boltzmann equation to obtain electron transport coefficients and rate coefficients for fluid models. Plasma Sources Sci. Technol. 2005, 14, 722–733. [Google Scholar] [CrossRef]
  33. Purwins, H.G.; Stollenwerk, L. Synergetic aspects of gas-discharge: Lateral patterns in dc systems with a high ohmic barrier. Plasma Phys. Control. Fusion 2014, 56, 123001. [Google Scholar] [CrossRef]
  34. Lazarou, C.; Belmonte, T.; Chiper, A.S. Numerical modelling of the effect of dry air traces in a helium parallel plate dielectric barrier discharge. Plasma Sources Sci. Technol. 2016, 25, 055023. [Google Scholar] [CrossRef] [Green Version]
  35. Lazarou, C.; Koukounis, D.; Chiper, A.S. Numerical modeling of the effect of the level of nitrogen impurities in a helium parallel plate dielectric barrier discharge. Plasma Sources Sci. Technol. 2015, 24, 035012. [Google Scholar] [CrossRef]
  36. Zhang, Y.H.; Ning, W.J.; Dai, D. Numerical investigation on the dynamics and evolution mechanisms of multiple-current-pulse behavior in homogeneous helium dielectric-barrier discharges at atmospheric pressure. AIP Adv. 2018, 8, 035008. [Google Scholar] [CrossRef] [Green Version]
  37. Yan, W.; Xia, Y.; Bi, Z.H. Numerical and experimental study on atmospheric pressure ionization waves propagating through a U-shape channel. J. Phys. D Appl. Phys. 2017, 50, 345201. [Google Scholar] [CrossRef]
  38. Morshuis, P.H.F.; Smit, J.J. Partial discharges at DC voltage: Their mechanism, detection and analysis. IEEE Trans. Dielectr. Electr. Insul. 2005, 12, 328–340. [Google Scholar] [CrossRef] [Green Version]
  39. Huang, Z.; Hao, Y.; Yang, L. Two-dimensional simulation of spatiotemporal generation of dielectric barrier columnar discharges in atmospheric helium. Phys. Plasmas 2015, 22, 123509. [Google Scholar] [CrossRef]
  40. MAI, H.; Jin, X.C.; Li, J.H.; Li, Y.M. PD Characteristic Research of Air Gap Defect in Oil-Paper Insulation under AC/DC Composite Voltage. Transformer 2014, 51, 54–59. [Google Scholar]
  41. Zhou, Y.X.; Sha, Y.C. Partial Discharge Initiating Process of Transformer Oil Under Combined AC and DC Voltage. High. Volt. Eng. 2012, 38, 1163–1171. [Google Scholar]
  42. Tang, Z.G.; Tang, M.Z.; Li, J.Z. Review on Partial Discharge Pattern Recognition of Electrical Equipment. High. Volt. Eng. 2017, 43, 173–187. [Google Scholar]
  43. Kang, Q.; Gu, X.; Xu, Y. Review of Partial Discharge Detection Under DC Voltage. South. Power Syst. Technol. 2015, 65, 75–83. [Google Scholar]
  44. Yang, Z.; Song, H.M.; Wang, W.L.; Jia, M.; Jin, D. Thermal characterisation of dielectric barrier discharge plasma actuation driven by radio frequency voltage at low pressure. High. Volt. 2018, 3, 154–160. [Google Scholar]
  45. Li, J.H.; Han, H.T.; Liu, Z.H.; Yao, X.; Li, Y.M. PD Characteristics of oil-pressboard Insulation under AC and DC Mixed Voltage. IEEE Trans. Dielectr. Electr. Insul. 2016, 23, 444–450. [Google Scholar] [CrossRef]
  46. Lxcat Program. Biagi Database [DB]. Available online: https://www.lxcat.net/ (accessed on 27 March 2019).
  47. Kossyi, I.A.; Kostinsky, A.Y.; Matveyev, A.A. Kinetic scheme of the non-equilibrium discharge in nitrogen-oxygen mixtures. Plasma Sources Sci. Technol. 1992, 1, 207–220. [Google Scholar] [CrossRef]
  48. Lxcat Program. TRINITI Database [DB]. Available online: https://www.lxcat.net/ (accessed on 27 March 2019).
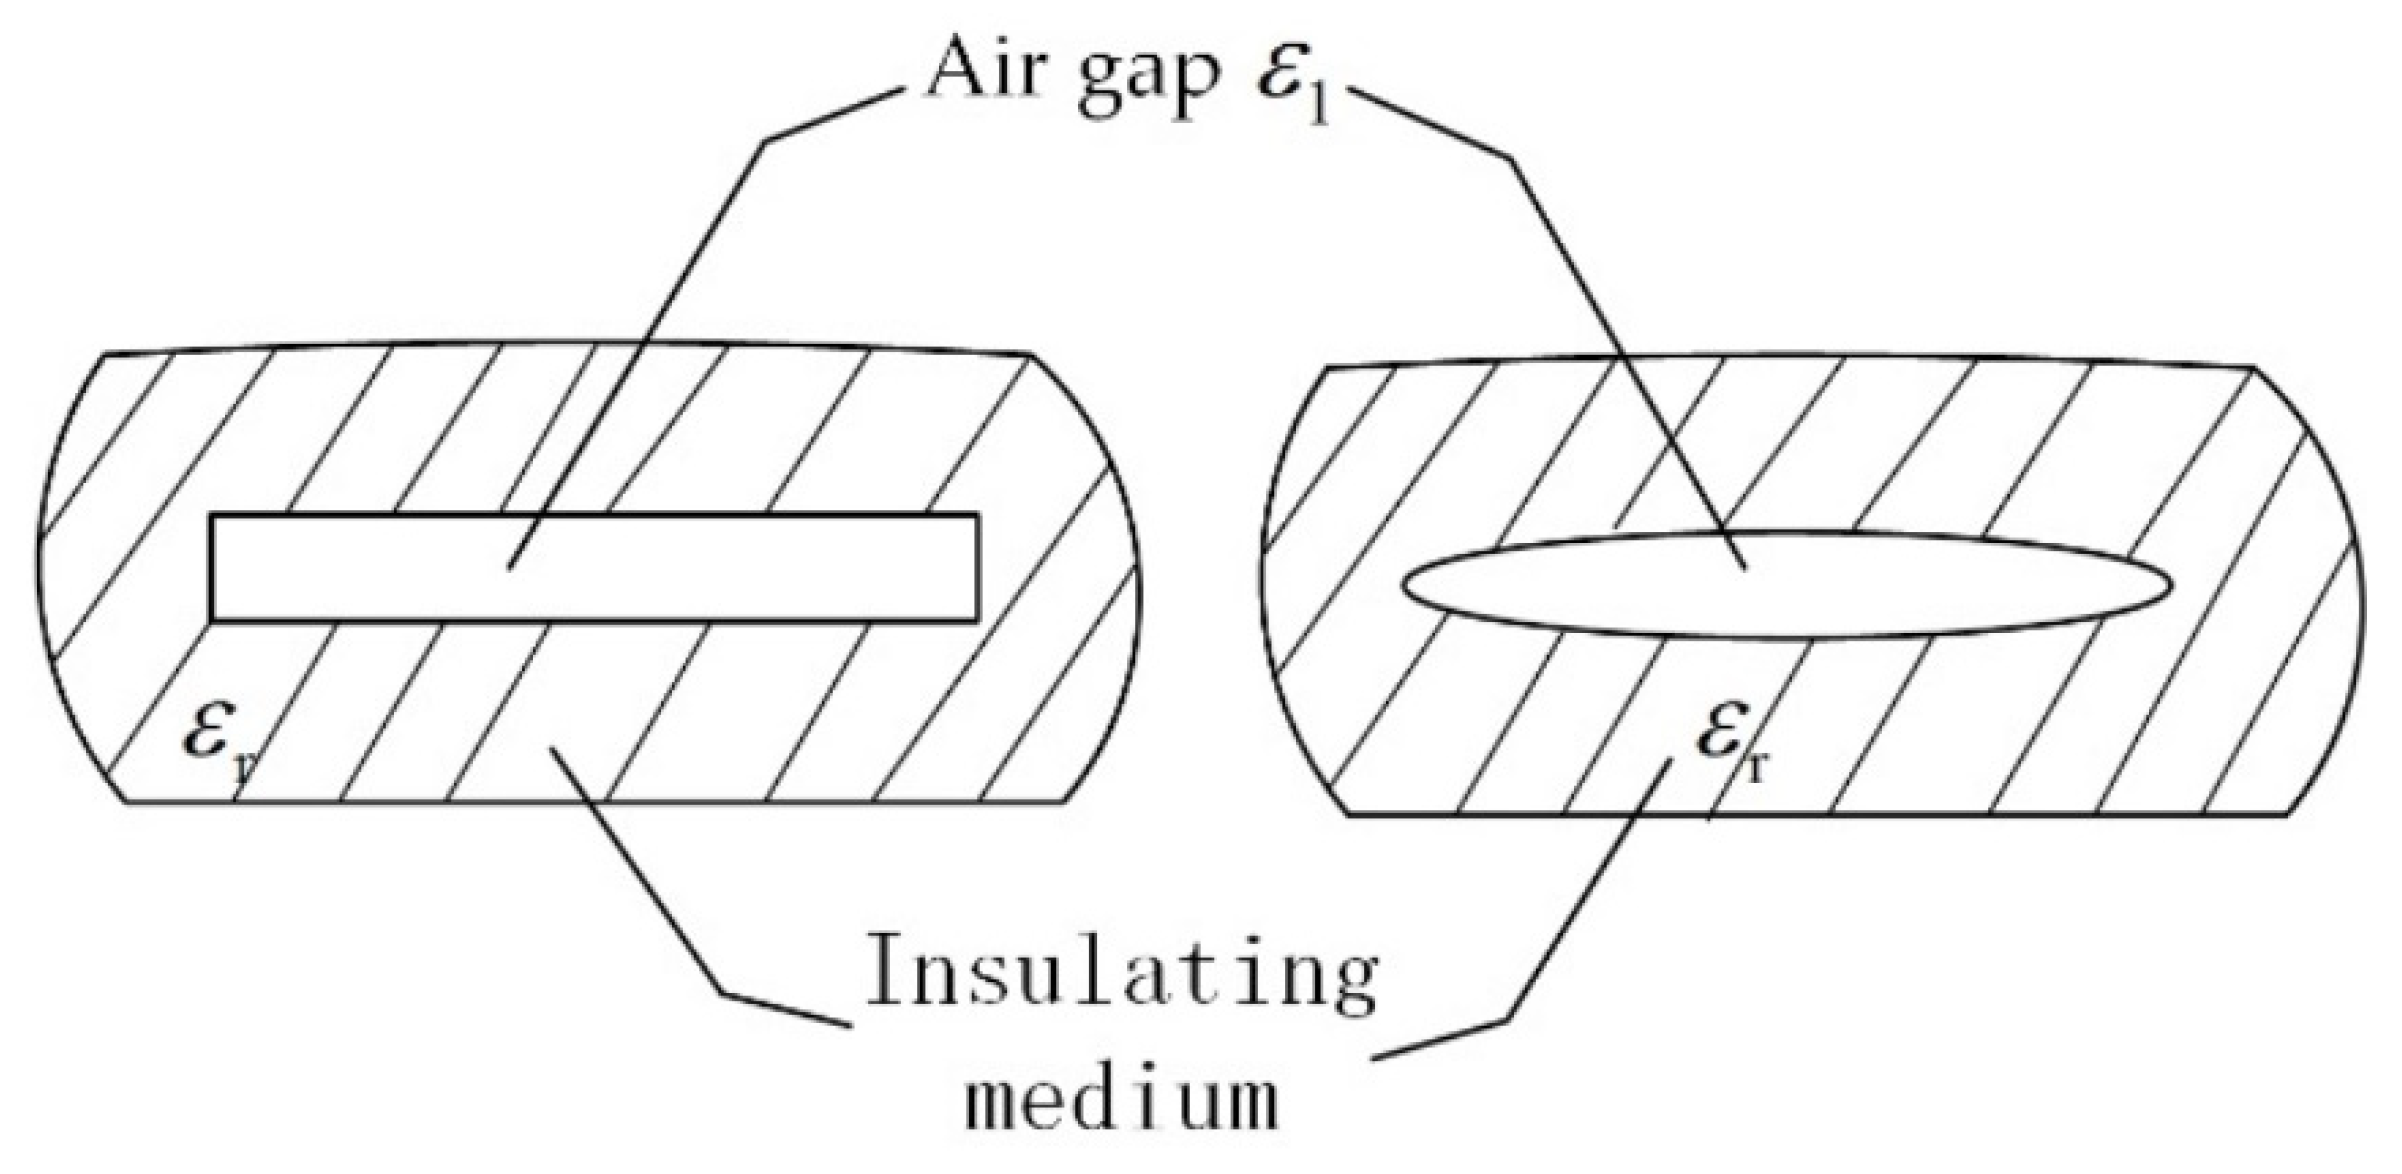
Figure 1. The model of air gap in an insulation board.
Energies 14 06995 g001
Figure 2. The model of simulation.
Energies 14 06995 g002
Figure 3. Normalized periodic electron density under different ratios of combined voltage. (a) pure AC, (b) AC:DC = 1:1; (c) AC:DC = 1:3; (d) AC:DC = 1:5; (e)AC:DC = 1:7.
Energies 14 06995 g003
Figure 4. The density of surface charge at the fifth and the tenth discharge peak. (a) The peak time of the fifth discharge. (b) The peak time of the tenth discharge.
Energies 14 06995 g004
Figure 5. Evolution of spatial distribution of electron density in the 10th discharge air gap under composite voltage of 1:3.
Energies 14 06995 g005
Figure 6. Distribution of electric field and potential at peak discharge moment.
Energies 14 06995 g006
Figure 7. The spatial distribution of positive ions.
Energies 14 06995 g007
Figure 8. The potential at the fifth and the tenth discharge peak. (a) The peak time of the fifth discharge. (b) The peak time of the tenth discharge.
Energies 14 06995 g008
Publisher’s Note: MDPI stays neutral with regard to jurisdictional claims in published maps and institutional affiliations.