Article

Experimental Study on the Effect of Temperature on the Mechanical Properties of Unconsolidated Silty Sandstones

by
Juan Alejandro Arias-Buitrago
1,
Guillermo A. Alzate-Espinosa
2,
Alejandra Arbelaez-Londoño
2,*,
Gonzalo Zambrano-Narvaez
1 and
Rick Chalaturnyk
1
1
Department of Civil and Environmental Engineering, University of Alberta, Edmonton, AB T2G 2R3, Canada
2
Departamento de Procesos y Energía, Universidad Nacional de Colombia, Cra 80#65–223, Medellin 050034, Colombia
*
Author to whom correspondence should be addressed.
Energies 2021, 14(21), 7007; https://doi.org/10.3390/en14217007
Submission received: 16 September 2021 / Revised: 17 October 2021 / Accepted: 23 October 2021 / Published: 26 October 2021
(This article belongs to the Special Issue Geomechanics for Energy)

Abstract

:
Hydrocarbon reservoirs can be subjected to temperature changes due to different processes during production. Heat injection has become an advantageous method to produce heavy oils in Canada and Venezuela because it increases oil recovery. The heat reduces oil viscosity and oil flows easily. Colombia has significant heavy oil reserves in unconsolidated silty sandstones. It is important to understand the mechanical behavior of these reservoirs in thermal recovery conditions (temperature and effective stress). The reconstituted samples from a Colombian heavy oil outcrop were evaluated using a high-temperature and high-pressure triaxial cell. Twelve isotropically consolidated drained triaxial tests were conducted at three different effective stresses (0.4, 4.0, and 8.2 MPa) and a temperature range from 50 to 230 °C to represent the initial and thermal recovery conditions, and obtain parameters, such as Young’s and Bulk moduli, internal friction angle, and cohesion. The samples at higher confining stress (4.0 and 8.2 MPa) were under contraction, while samples at lower confining stress (0.4 MPa) were under dilation. The stiffness increased as the confining stress increased and decreased as temperature increased, and the strength properties significantly decreased as temperature increased. Finally, the Colombian samples exhibited low friction angles when compared to clean sandstones as Canadian sands.

1. Introduction

Heavy oil reservoirs represent a relevant amount of the total hydrocarbon resources around the world. Heavy oil reserves are estimated to be around 9.70 TB (TB = trillion barrels of oil), and from this amount, approximately 7 TB are contained in unconsolidated sandstones [1]. Currently, more than 50% of the oil production in Colombia corresponds to heavy oil [2]. Part of this production comes from reservoirs that are produced using different thermal processes, such as Cyclic Steam Stimulation (CSS) and steam flooding (SF) in the Middle Magdalena basin [3]. The reservoirs in this area are known for being highly stratified as well as having a high fines content (30%) [4], which complicates the geomechanical characterization. Understanding the thermal hydro-mechanical behavior of these formations under different conditions of stress and temperature is crucial to model many phenomena during oilfield development, such as reservoir dilation, permeability enhancement, and surface heave.
Heavy oil is used to define very dense hydrocarbons with densities lower than 20°API, which commonly present very high viscosity values. The high oil viscosity makes its flow through the porous medium towards the wellbore very difficult, especially at low temperatures, such as the ones registered in reservoirs in Canada. This behavior has been conducive to developing recovery techniques that aim to reduce the fluid viscosity using chemicals or high temperatures, such as steam-assisted gravity drainage (SAGD) and CSS. Thermal techniques have been demonstrated to be very efficient in reducing the fluid viscosity due to the exponential behavior of the oil’s viscosity with temperature [5], which results in high recovery factors. The understanding of what happens to the reservoir during thermal processes has become a topic of interest to the scientific community and industry to get more accurate and reliable models to forecast the reservoir behavior during thermal recovery, including the geomechanics issues. Accurate models allow the prediction of important information, such as required steam, oil and water production, and the recovery factor.
Even before thermal recovery became popular to extract heavy oil from the subsurface, some researchers tried to understand the behavior of reservoir rocks under different temperature conditions. In 1961, Serdengecti and Boozer [6] carried out some experiments on Berea sandstone and Solenhofe limestone to identify the effect of the temperature and strain rate on the mechanical behavior, finding that these kinds of rocks lose their stiffness at high temperatures. Mobarack and Somerton in 1971 [7] studied the effect of temperature in samples of Berea, Boise, and Bandera sandstones from 300 to 1000 °C. They found that when temperature increases, the compressive strength and Young’s and Bulk moduli decrease.
Among the initial studies about thermal recovery in the oil sands of Canada, Agar in 1984 [8] studied the effect of temperature (20–200 °C) on the geomechanical behavior of reconstituted samples from McMurray formation. It was found that the compressive strength and the stiffness of the samples increase at high temperatures but do not follow a clear trend, behavior that can be explained based on grain reorganization and porosity reduction. Then, Kosar, in 1989 [9], performed triaxial tests on samples from the Athabasca deposit (middle McMurray formation) at different temperatures (20–300 °C). In this case, both the stiffness and peak strength of the material increased (up to 100%) with temperature, a process that is referred as thermal densification, and was accompanied by a reduction of porosity. On the other hand, Chalaturnyk, in 1995 [10], completed drained bulk compressibility and permeability tests for the McMurray formation as well, followed by coupled numerical simulation for SAGD processes, suggesting a volume increment during heating leading to porosity and permeability enhancement.
Lintao et al., in 2017 [11], studied the effect of high temperatures (20–1000 °C) on sandstone samples using a computed tomography scan. They used multistage triaxial tests to determine the mechanical properties, X-ray diffraction and thermal analyses to investigate the changes in physical and chemical properties of increasing temperature, and micro-computed tomography analyses to determine the microstructural changes during the heating process, finding that the mechanical properties of sandstone are closely related to alterations of the microstructure that result from increased temperatures.
Moreover, Wei et al., in 2019 [12], studied the effect of high temperatures (100–1000 °C) on the mechanical properties in coarse sandstones by uniaxial compression and triaxial compression tests, finding that the longitudinal wave velocity decreases and the damage factor increases with the temperature increase. The compressive strength increases, with the temperature increase below 500 °C showing a strengthening effect, and the compressive strength decreases with the temperature increase above 500 °C, showing a weakening effect. From triaxial compression tests at a temperature lower than 800 °C and confining pressure lower than 15 MPa, the rock strength is positively correlated with temperature and confining pressure, and when the temperature is over 800 °C and the confining pressure is above 15 MPa, the rock strength is negatively correlated with temperature and confining pressure, and the actual fracture angle is negatively correlated with the confining pressure.
In general, the effect of temperature on the mechanical behavior of sandstones is not well understood yet. Variables, such as the grain size distribution, confining stress, consolidation, and lithification state, play a key role in the hydro-thermo-mechanical behavior of sandstone reservoir rocks. While some studies found a reduction in stiffness and strength, others have reported thermal densification that leads to an increase in strength and stiffness [13]. Nevertheless, there is a lack of data on high-pressure and high-temperature triaxial experiments for unconsolidated silty sandstones to attain certain conclusions on the thermal-mechanical properties of this class of material.
Still, performing geomechanical laboratory tests as triaxial tests, which can reproduce in situ conditions, represents a significant challenge due to the handling of unconsolidated material in high-pressure and high-temperature conditions. Under these extreme conditions, materials that are commonly used to isolate the sample from the confining fluids could lose the ability to seal, increasing the risk of premature failure of internal instrumentation.
This study aimed to attain the mechanical behavior of unconsolidated silty sandstones with poor grain selection, typically found in fluvial sedimentary environments. This objective was achieved by conducting 12 isotropically consolidated drained triaxial tests for reconstituted samples from a Colombian heavy oil formation at three different effective stress (0.4, 4.0, and 8.2 MPa) and temperature conditions (50–230 °C) using a high-temperature and high-pressure triaxial cell, replicating the initial and the thermal recovery conditions and obtaining parameters, such as Young’s and Bulk moduli, internal friction angle, and cohesion.

2. Materials and Methods

2.1. Samples Description

The material was collected from an outcrop of Picacho formation, friable sand saturated with bitumen [4], located at the Eastern Cordillera of Colombia. The average values obtained from X-ray diffraction tests show that it is mainly composed of quartz (95%) with some kaolinite (4%) and pyrite (1%). The formation has been dated as an Eocene formation, and it was deposited in a fluvial environment [4,14]. Fluvial deposits are characterized by having poor selection for particle size. Figure 1 illustrates a piece taken from one of the samples under a scanning electronic microscope (SEM), which exhibits its poor selection.
The particle size distribution was obtained using Sieve Analysis and Hydrometer according to ASTM standards [15,16]. The particle size analysis results show that Picacho formation has a poor selection with d30 = 0.084 mm, d50 = 0.250 mm, and d90 = 1.425 mm. Figure 2 illustrates the particle size distribution for the Picacho formation, and it is compared to the particle size distribution of the middle McMurray formation from Canada [9]. It can be observed that the Picacho formation sand has poorer selection compared to the Middle McMurray formation, which is considered clean sand. The fines content for the Picacho formation is high (>30%) due to the fluvial depositional environment, which was alternations of flooded plains and meanders, and it can therefore be classified as silty sand according to Folk [17]. On the other hand, the Middle McMurray formation was deposited in an estuarine environment, giving it a well-sorted grain size distribution [18].

2.2. Equipment for Triaxial Testing

The experimental setup consisted of an electro-hydraulic servo-controlled loading frame of 600 kN of capacity and a high-pressure high-temperature triaxial cell with internal deformation sensors. The setup also included one high-capacity syringe pump (70 MPa), which controlled the confining pressure, and a second syringe pump of 30 MPa capacity to control the pore pressure.
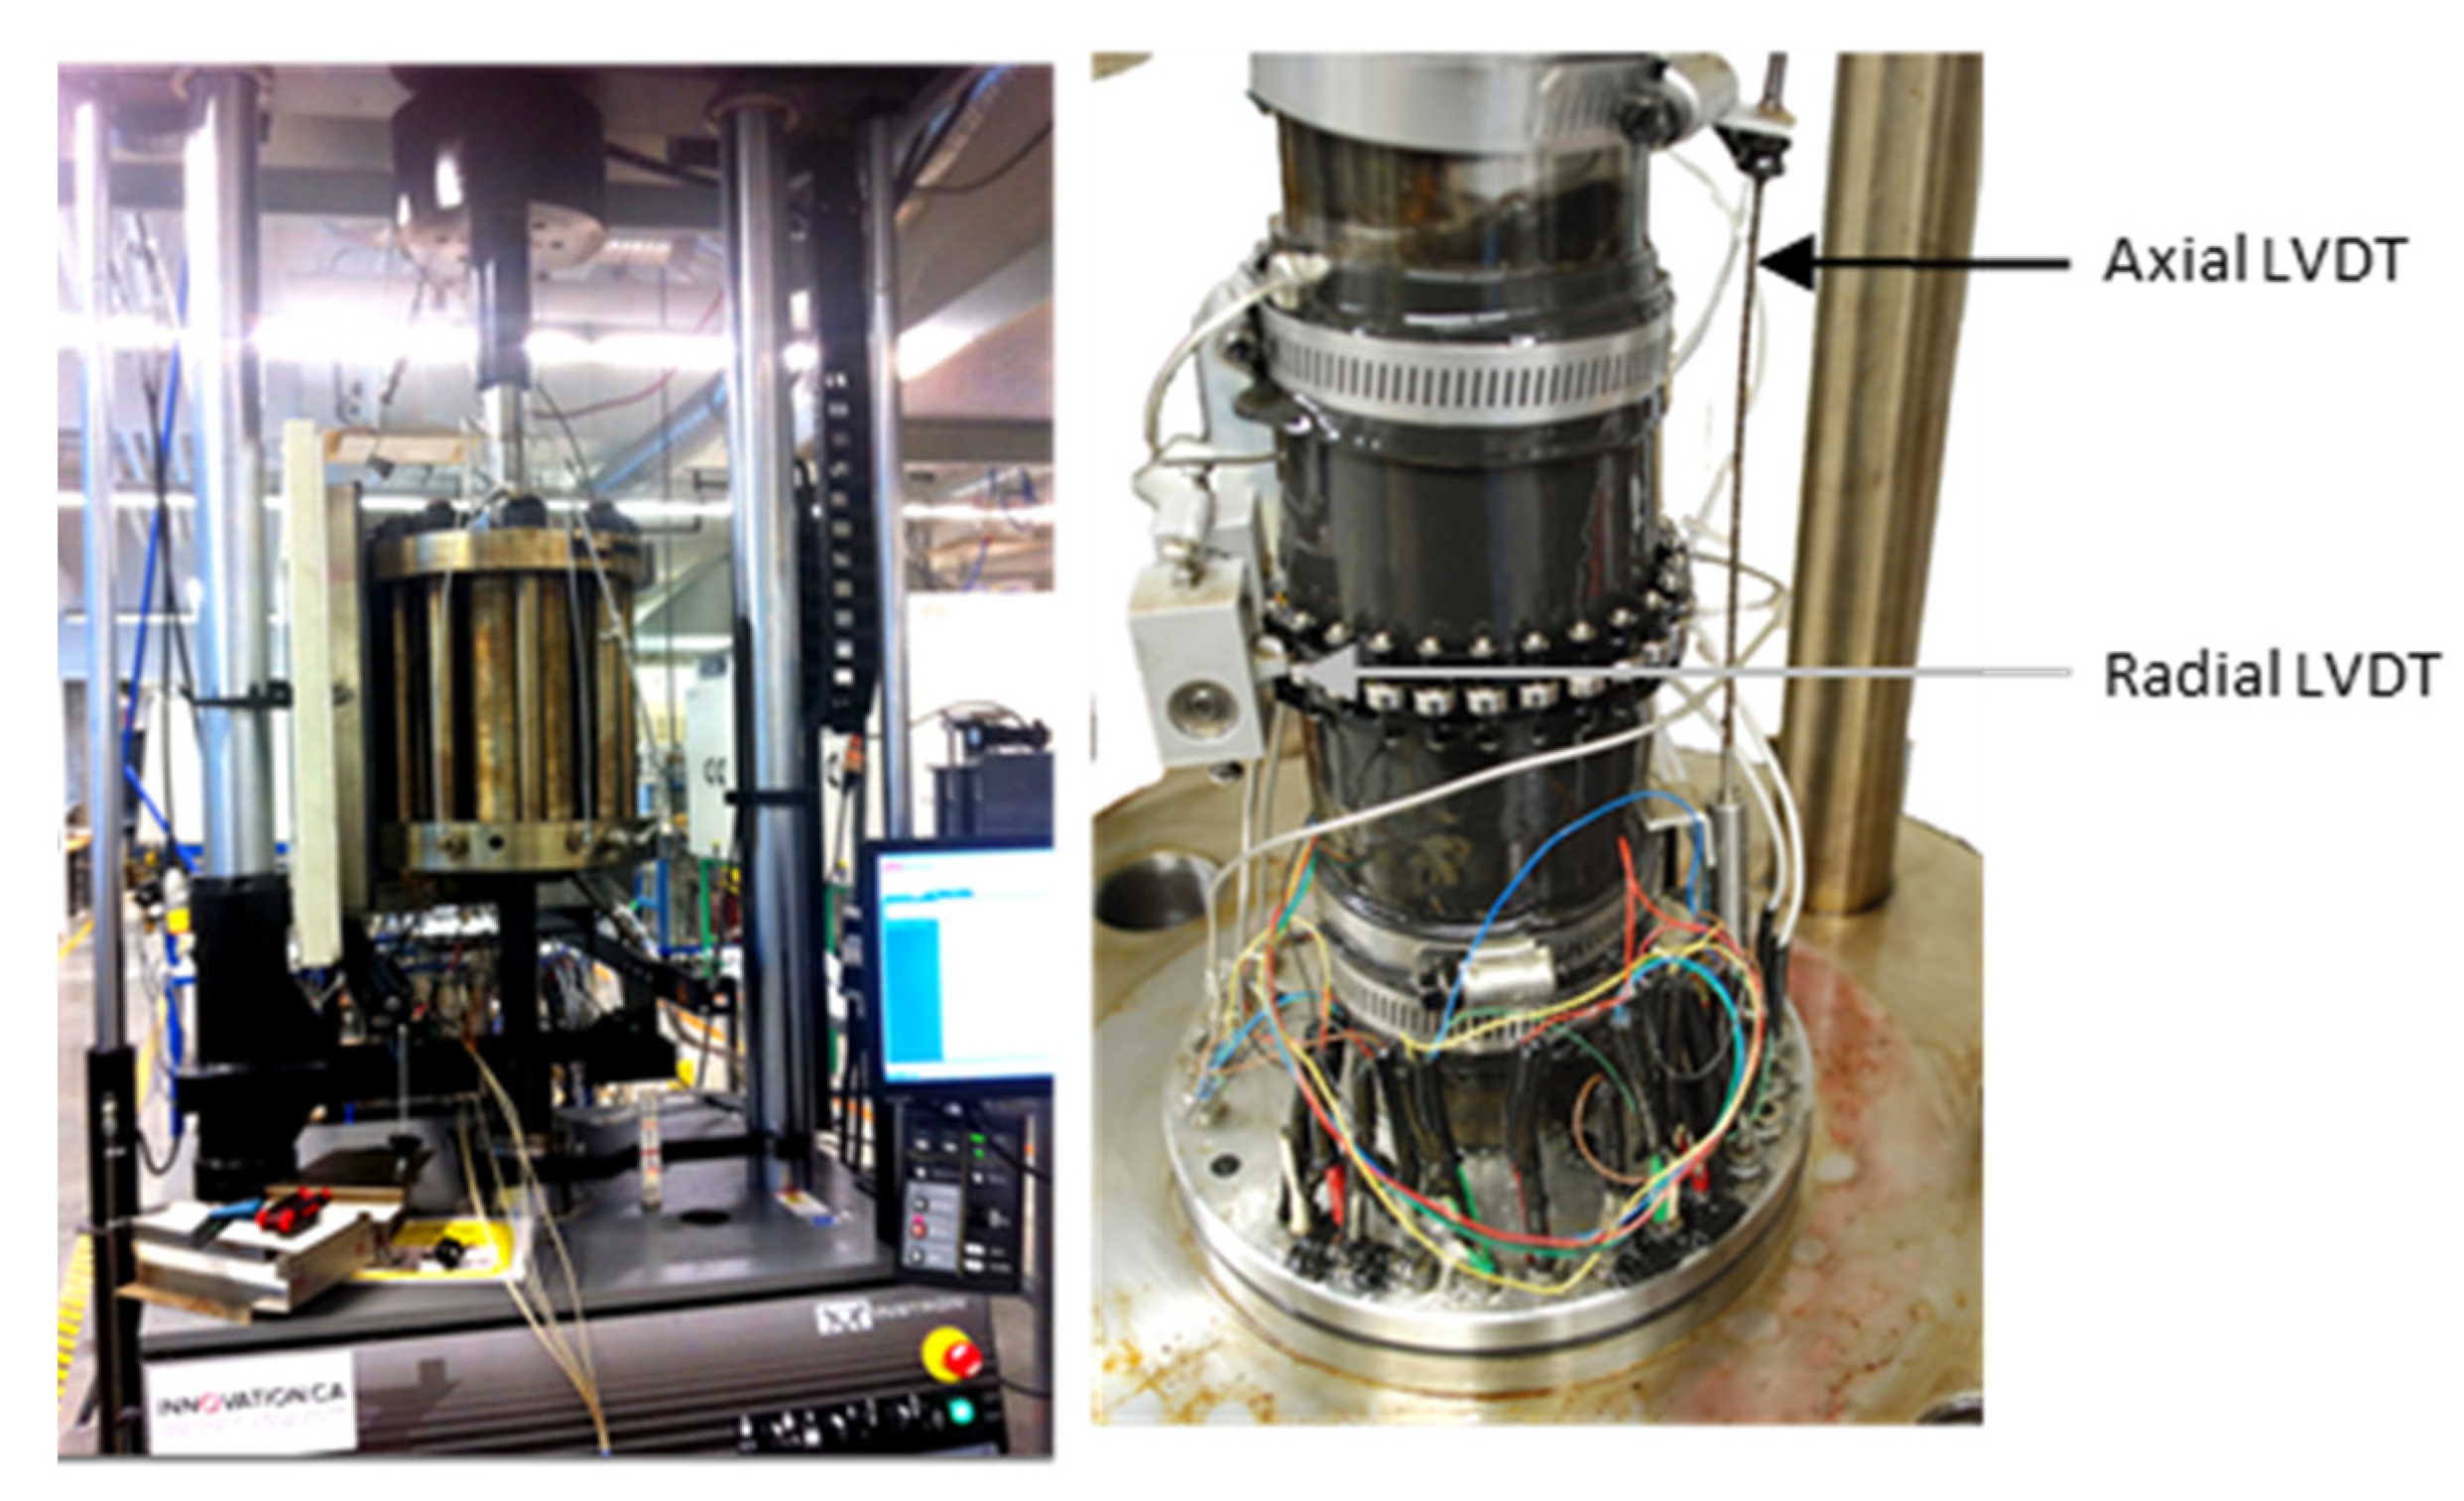
Internal measurements of displacement were used to attain more accurate sample deformations. The axial and radial local-strain system included three identical LVDTs (Linear Variable Differential Transformer) with a measurement range of ±12 mm and accuracy ±25 µm. Two LVDTs were used to measure the axial deformation, and the remaining one was used to measure radial deformation (Figure 3). The axial LVDTs were attached to the endcaps at opposite sides of the sample, while the radial LVDT was placed at the middle height of the sample, as presented in Figure 3. Pressure transducers with a maximum capacity of 70 MPa and accuracy ±0.7 MPa were placed at the entrance of the triaxial cell to monitor the pore pressure and confining conditions.
The triaxial cell was placed in an environmental chamber that allowed heating/cooling of the system to acquire the desired conditions. The environmental chamber has a maximum operating temperature of 350 °C and allows setting of the heating rate. An additional thermocouple to measure the sample temperature was fixed a few millimeters from the sample inside the cell. Figure 3 and Figure 4 illustrate the equipment used in the tests.

2.3. Experimental Procedure

Due to the unconsolidated and uncemented nature of the samples used in this study, an unconfined test could not be completed. Hence, confining was applied in all samples to keep all the grains together and replicate the in situ conditions [19,20]. Therefore, to evaluate the temperature effect on the geomechanical behavior of unconsolidated sandstones, the samples were first isotropically consolidated, and then they were sheared under drained triaxial compression (CIDTXC). The test program allowed evaluation of four temperatures within the range that was expected during CSS operations (50, 120, 180, and 230 °C).
All the fluids (bitumen and water) contained in the material were extracted using the Dean–Stark technique. Then, the samples were reconstituted using a methodology developed at the University of Alberta, which aimed to obtain samples as dense as possible without applying any mechanical effort to avoid grain crushing. The reconstitution process was performed by vibrating and tapping the saturated sample in a steel container, and then the sample was frozen to maintain its final structure and stored in a freezer at −18 °C to preserve the porosity reached during the reconstitution process. More detail can be found in Wang et al. [21]. The samples reached a minimum average porosity of 27%. Cylindrical samples of 2.5 inches in diameter by 5 inches in height were used for the triaxial apparatus. Figure 5 shows pictures of the final reconstituted samples obtained.
The samples were placed in the cell for the triaxial test, and all the sensors were connected. Once the cell was inside the chamber, the pore and confining pressures were slowly increased, maintaining low effective stress. Once the pore pressure reached the desired value, the sample was allowed to saturate for 24 h at 0.1 MPa effective stress. The pore pressure was kept constant during the complete experiment at 5.5 MPa to represent in situ conditions for a reservoir 550 m deep (hydrostatic pressure). After the saturation stage, the B test was carried out to confirm that the sample was fully saturated. This test evaluated the saturation in terms of the Skempton’s pore pressure coefficient B. The pore pressure control was turned off, and the confining of the sample was increased, then the response/increase of pore pressure to that confining increase was measured. If the sample was fully saturated, the ratio of confining change and pore pressure change should be 1 or at least close [22].
Subsequently, the samples were isotropically consolidated in four stages: 1 MPa, 2 MPa, 4 MPa until reaching a final effective confining stage of 8.2 MPa (in situ conditions). The consolidation was then performed in four stages: 1, 2, 4, and 8.2 MPa. Finally, the sample was unloaded to the desired effective confining stress for each test if applicable. The isotropic unloading process in the lab simulated the fluid injection in the reservoir since the effective stress was reduced by increasing the pore pressure. Table 1 summarizes the conditions designed for each test.
Sample heating was performed at drained conditions, where the confining and the pore pressure were constant during the heating process. Each sample was heated slowly to the targeted temperature (6 °C/h) to avoid thermal shock, which could cause grain crushing as well as pressure overshooting due to thermal expansion of the fluids modifying the stress condition. The pressure was controlled using servo-controlled pumps, which allowed the desired conditions (confining and pore pressure) to be maintained even with the fluid expansion due to heating.
Once the sample was under the desired confining and temperature conditions, the sample was sheared by exerting deviator stress in the axial direction using the loading frame at a constant strain rate of 5%/day (approximately 0.0044 mm/min). The strain rate was calculated based on the consolidation curves, ensuring enough time to have pore pressure dissipation as it is suggested in the ASTM standard [23]. Figure 6 illustrates the stresses applied and acting on the sample during the shearing process. The elastic moduli of the samples were obtained during the shearing stage of the test. The Young’s modulus reported in this article corresponds to tangential and was calculated by dividing the deviator stress into the axial obtained from the axial LVDT. Similarly, the Bulk modulus was calculated by dividing the mean confining stress into the volumetric strain obtained from axial and radial LVDTs.

3. Results and Discussion

3.1. Tests at Effective Confining Stress of 0.4 MPa

Tests at low confining stress were carried out to analyze different in situ conditions. These conditions are representative of a reservoir with high pore pressures during steam injection. According to the proposed procedure, the samples were isotropically consolidated to 8.2 MPa and then unloaded, in this case, to 0.4 MPa.
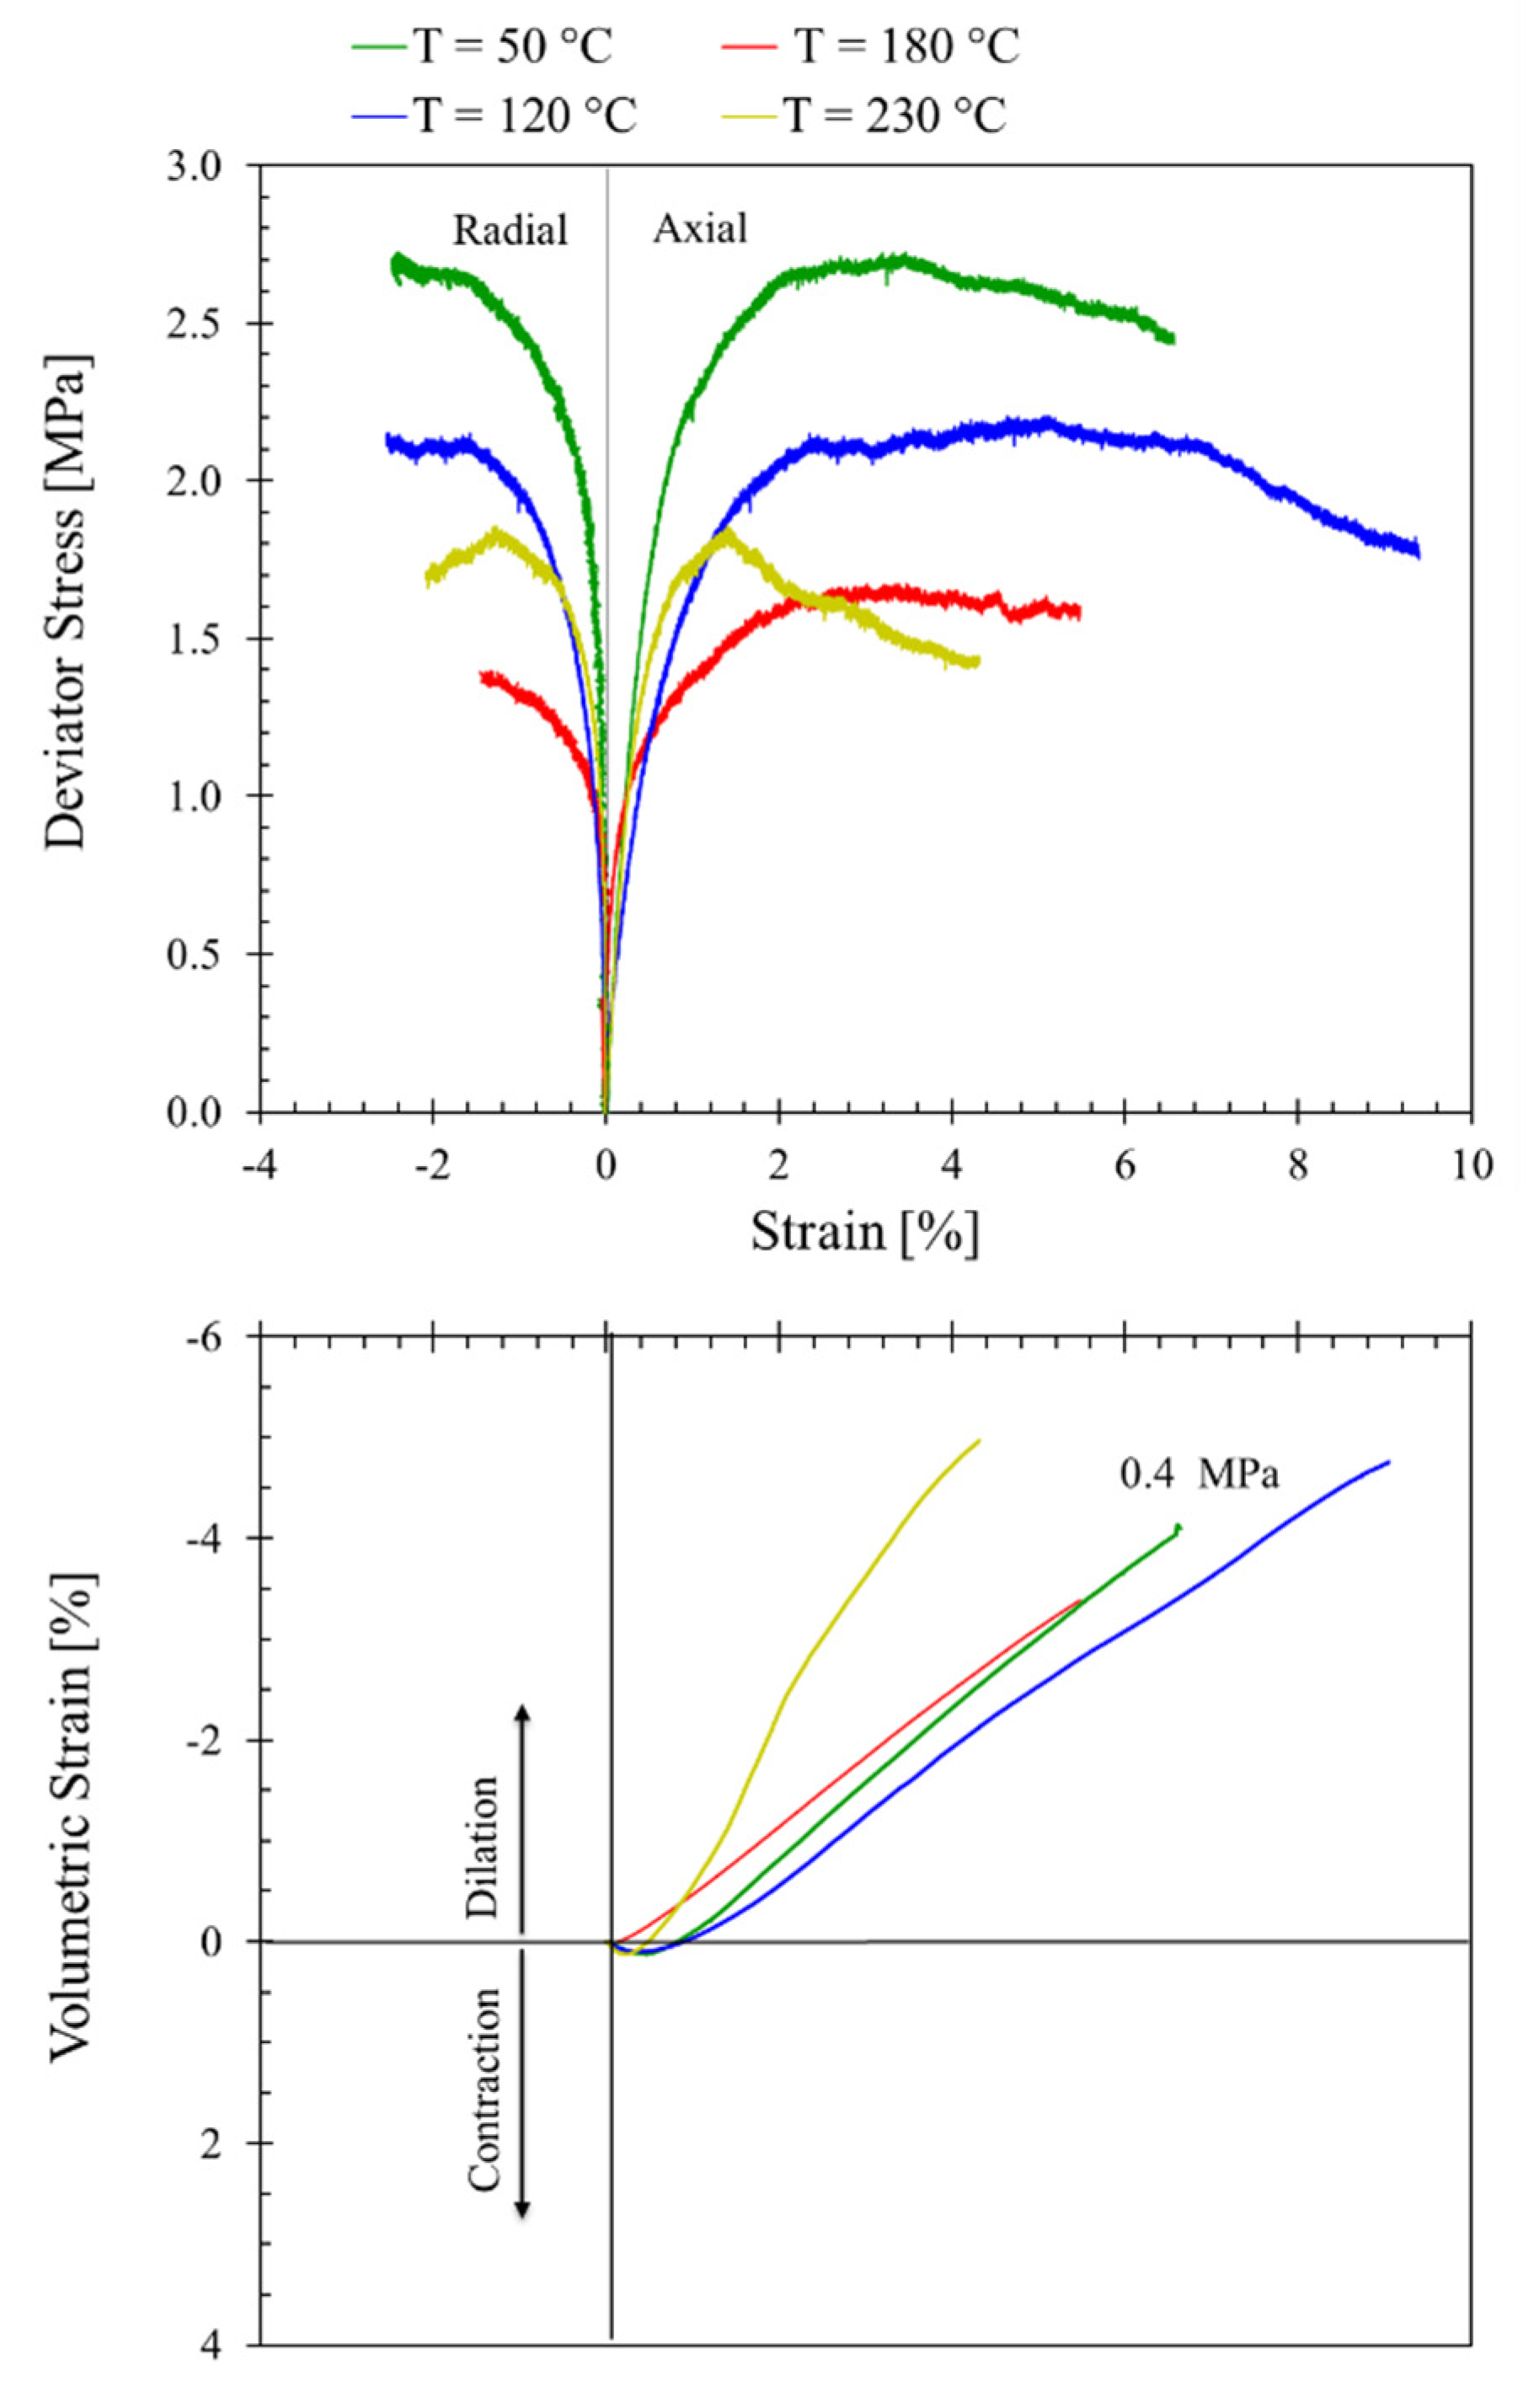
As seen in Figure 7, for all the temperatures tested, at low confining stress (0.4 MPa), the unconsolidated samples describe a dilatant behavior, with a strain-hardening behavior after yielding until reaching the peak strength and then presenting strain-softening behavior. In terms of the volumetric strain, the curves for low confining stress (0.4 MPa) present a small initial contraction but, after yielding, present dilatation.
For this confining condition (0.4 MPa), the temperature has a more severe influence on the geomechanical behavior. A proportional influence of the heat on the strength of the material can be seen for the curves of 50, 120, and 180 °C, where the strength reduces as temperature increases. Above 180 °C, the sample seems to gain some strength again but is still lower than the one shown at 50 °C.
The curve at 180 °C (red curve) describes a stiffer behavior compared to the other curves but exhibits lower peak strength than them. Again, this behavior could be caused by the thermal consolidation of the fines where the material gains some stiffness. Similar results were reported by Kosar [9] for oil sand samples with a high fine content and that behavior was attributed to the densification of thin discontinuous shale seam.
For the highest temperature (230 °C), the yellow curve, the material shows a strain-softening behavior, which is different from all the results obtained in this study, and it could be related to the high dilation of the sample that is caused by the porosity increments. A more detailed analysis of porosity changes with temperature can be found in a previous work [24].

3.2. Test at Effective Confining Stress of 4.0 and 8.2 MPa

The results from all tests performed at 4.0 and 8.2 MPa are shown in Figure 8. In all cases, there is a significant influence of temperature on the geomechanical behavior of the material. It seems that for these confining stresses, the material exhibits higher strength at the low temperature (50 °C). The influence of temperature is more noticeable when it rises from the reservoir conditions to 120 °C than at higher temperatures, which suggests that there are significant changes in the sample structure in the range between 50 and 120 °C. These changes are governed mainly by the grains’ thermal expansion of fines in the sample at this temperature range [25]. The thermal expansion of quartz, for instance, leads to an increase in grain compressibility [26].
The curves describe a strain hardening behavior in all cases, and the samples are always contracting during shearing. The stress and volumetric strain curves of the specimens tested at 50 °C are slightly different from those tested at higher temperatures (120, 180, and 230 °C). The plots suggest a decrease in the strength and stiffness of the material when the temperature rises. For high-temperature tests, the curves are very similar and overlap in some cases, which means there is no representative effect of the temperature above 120 °C. Similar results were found for clean sand in the McMurray formation by Kosar [9].
The contractive behavior of the samples is caused by the high confining stress, which does not allow the sample to dilate; instead, there is grain rearrangement, which leads to increments of the internal friction angle, describing a strain hardening behavior [27].
Figure 9 presents an SEM image that shows the structure of the material after a triaxial test at 4 MPa and 120 °C. Grain crushing is observed for the sample tested at high temperature (see white arrows), which is believed to be generated by the compressive load and thermal stress applied to the samples during the test. It is also found that grain crushing increased significantly at higher confining stress. This has been observed previously by Kosar [9] and occurs when the grains expand due to the temperature increment, and the confining restriction causes the stress to increase dramatically, overcoming the compressive strength of the grains. In addition, the thermal expansion of grains with random geometry leads to unpredictable shear forces between grains, as previously found by Yang et al. [28]. These findings are in agreement with the previous results (Figure 8).
Figure 10 shows a photograph of a sample after the test at 4 MPa and 120 °C. After testing, all samples show a similar shape and do not develop a clear shear plane but bulge during experiments. This behavior is typical for granular material, such as sand, under high confining stresses, as reported previously [29].

3.3. Effect of Temperature on the Samples’ Stiffness

Young’s modulus was obtained using the definition of the tangent modulus. Figure 11 illustrates how this parameter changes with temperature for all the effective confining stresses studied. For temperatures between 50 and 120 °C, Young’s modulus decreases as temperature increases, leading to a loss in the stiffness of the material, and hence the material behaves in a more ductile manner. Then, for the tests conducted at temperatures between 120 and 180 °C, Young’s modulus increases as temperature increases, which might be attributed to thermal consolidation of the fine grains. However, when the confining stress is 4.0 MPa, this changes slightly. Finally, for temperatures between 180 and 230 °C, Young’s modulus increases as the temperature increases due to the ductile behavior of the minerals that compose the samples at these high temperatures, and the intermediate confining stress (4.0 MPa) seems not to vary.
As shown in Figure 11, the values of Young’s modulus for the lower confining condition (0.4 MPa) do not follow a clear tendency. The data are dispersed and fluctuate significantly in the range of the temperature of this study. Moreover, for higher confining conditions (4.0 and 8.2 MPa), Young’s modulus follows a second-grade polynomial behavior with the temperature, obtaining a good correlation coefficient for the regression.
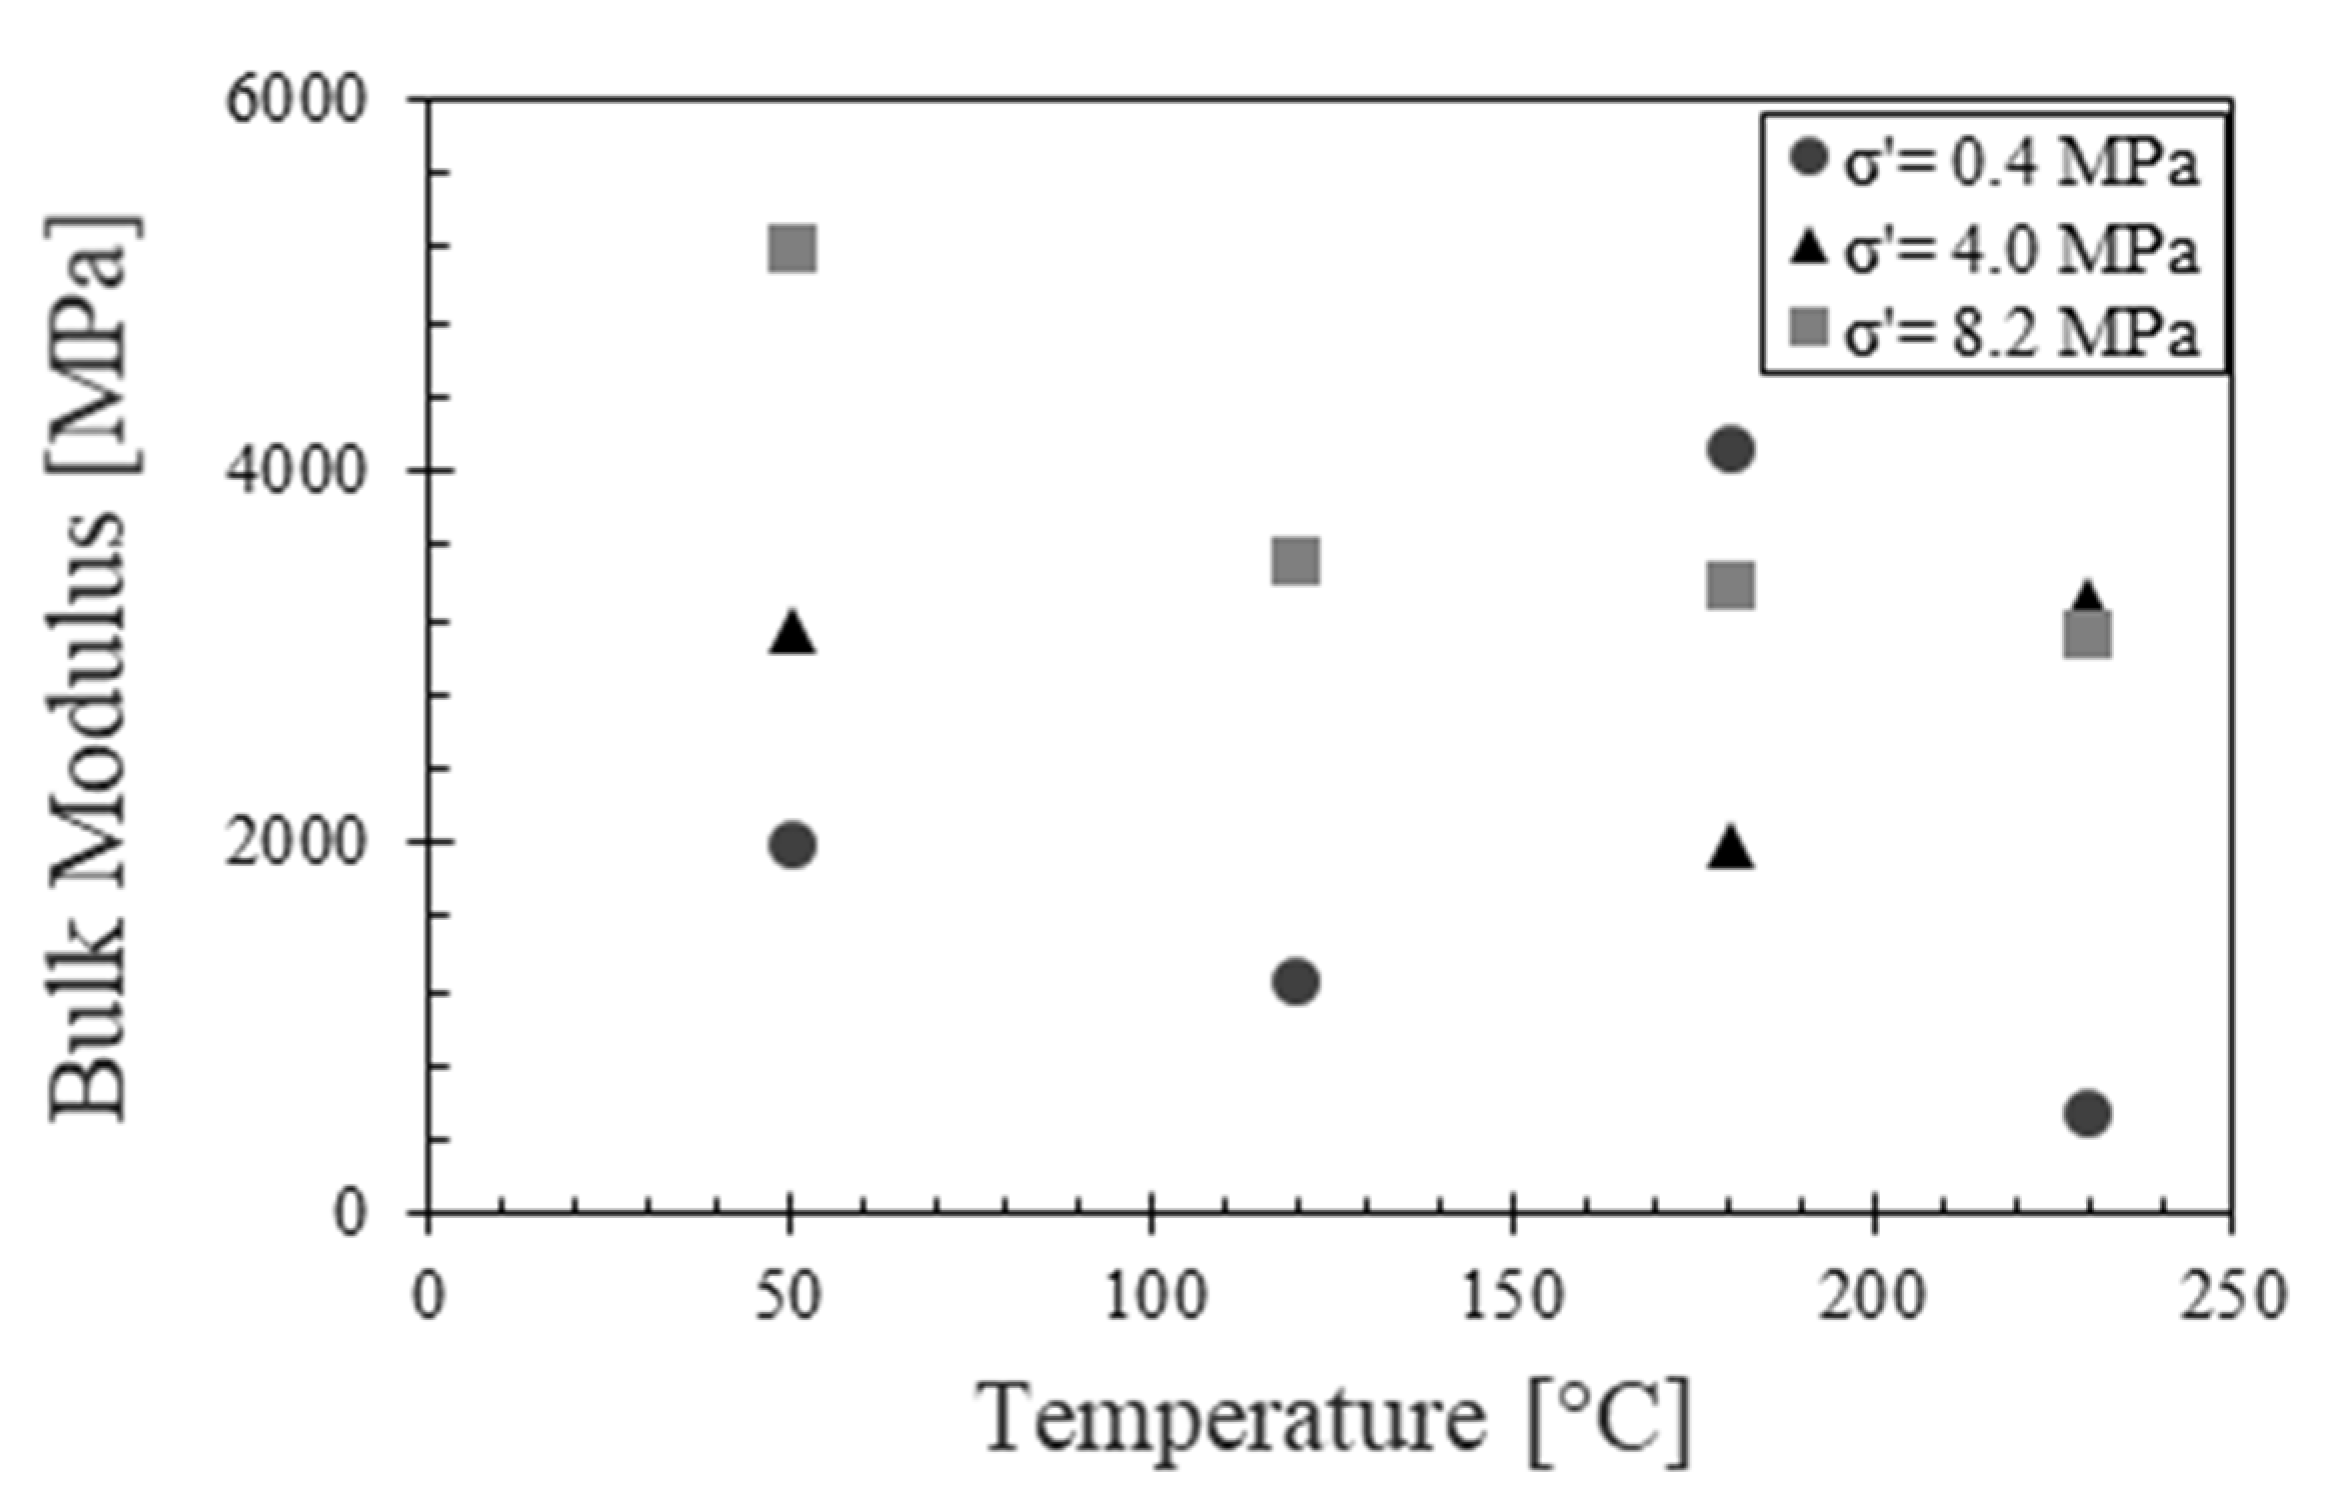
The effect of temperature on the Bulk modulus of Picacho samples was also analyzed. Figure 12 shows the behavior of this property with temperature.
For all the effective confining stresses (0.4, 4.0, and 8.2 MPa), there is a significant reduction in the Bulk modulus when the temperature goes from 50 to 120 °C, and it has a slow increment afterward. This stiffness loss corresponds to a softening process caused by the temperature. As the temperature increases, the solid particles of the samples become more compressible. On the other hand, an exponential behavior at 8.2 MPa suggests the effect of temperature on the material properties is highly dependent on the confining stress. This behavior is similar to the one found for petrophysical properties of the samples, which are directly proportional to the volumetric deformations. This exponential behavior with temperature is analogous to rock compressibility when the effective stress increases, as has been stated by Zimmerman et al. [30].

3.4. Effect of Temperature on the Yielding Parameters

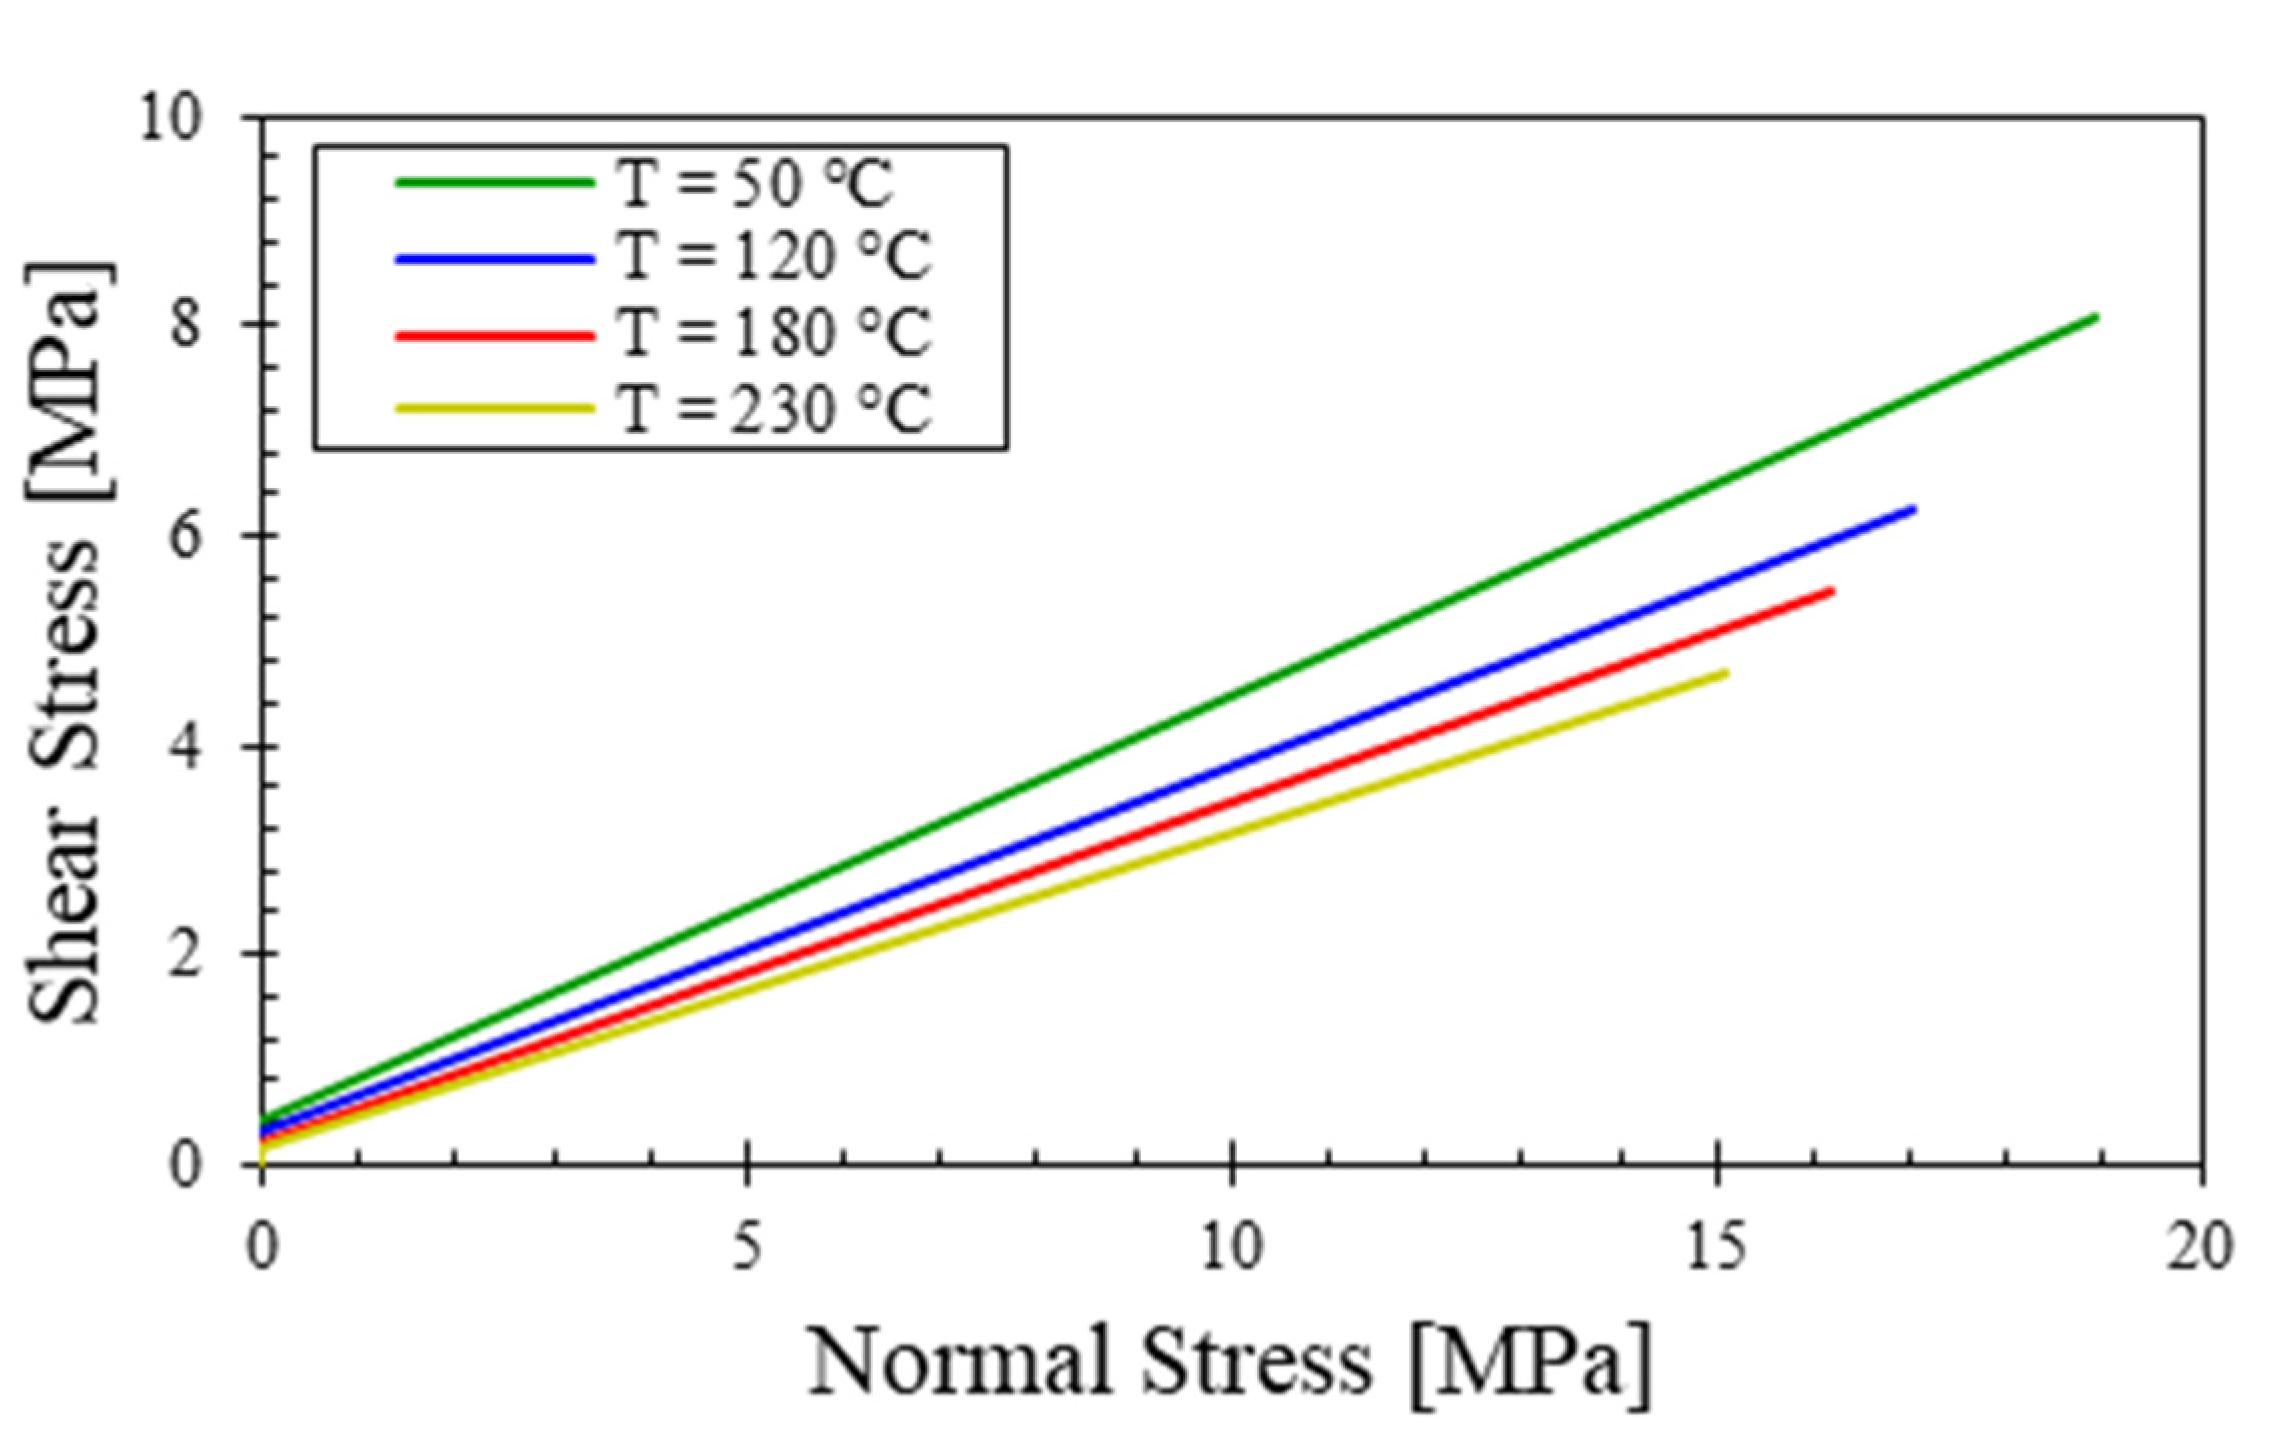
From the data above, the yield envelope of the material was estimated to identify the impact of temperature on the material’s strength. The results shown in Figure 13 describe a significant influence of temperature on the yield envelope, which indicates the material’s strength reduces with temperature. The results describe a reduction of both the cohesion and internal frictional angle of the material as temperature increases. Additionally, it can be seen that there is a significant impact on the frictional angles (slope), while the cohesion variation is not noticeable (intercept). Similar to the stiffness changes, the most significant change occurs when the temperature goes from 50 to 120 °C. The yielding envelopes in Figure 13 show that the material yields more easily at high temperatures, which is in agreement with most previous studies.
The impact of temperature on the friction angle is caused by the expansion of the grains, which affects the geometry of the grains, changing the intergranular contact and forces. Further, Morales-Monsalve et al. [31] performed an analysis of the results using analytical tools to evaluate the effect of temperature on post-yield strength parameters of this material, identifying a significant influence of temperature in the plastic region.
Figure 14 shows the changes of the internal frictional angle and cohesion with temperature. Both parameters show a clear reduction when the temperature of the sample increases. In this case, the relationship between the strength parameters and the temperature is linear. The internal friction angle can be reduced up to 30% when the sample is heated from 50 to 230 °C, approaching more typical values of clays than sands. The cohesion reduces to 65% within the evaluated range of temperatures. The internal friction angle is usually related to the shape and size of the material [32]. Therefore, the impact of temperature on the friction angle may be caused by a change of the shape and size of grains due to thermal expansion as observed on the SEM images (Figure 9). This behavior was previously explained by Campanella and Mitchell [33]. This significant influence of temperature on strength has not been reported in clean sands, where the influence of temperature is neglectable, as reported by Kosar [9] and Agar [8].
From the results already shown, it is possible to conclude that when the temperature increases, the material’s strength will decrease, which may imply a more likely scenario for material failure during thermal recovery processes, which can lead to operational and environmental problems. The results reached in this investigation indicate some principal ideas as follows:
  • Temperature increases have a remarkable effect on the mechanical behavior of the unconsolidated silty sandstones. As the temperature increases, the strength parameter of the material reduces, showing a higher tendency to fail under high-temperature conditions.
  • The effect of temperature on the mechanical properties of silty sandstones is mediated by the effect of confining stress. At lower effective confinement stress (0.4 MPa), the effect of temperature is more noticeable on the material’s strength, which is associated with the possibility of the sample deforming. On the other hand, at high and medium effective confining stress (4.0 and 8.2 MPa), the effect of temperature on the material’s strength is less noticeable since confining prevents sample deformation.
  • Generally, silty sandstones subjected to higher temperatures become more ductile, although this behavior may change due to the fines content associated with high temperatures.
  • These results show the remarkable effect of the temperature on the mechanical behavior for the unconsolidated silty sandstones and then, it is necessary to take into account the change of these parameters through thermal operations. Failure to take this effect into account may lead to several operational and environmental issues associated with the lower strength of these types of soft rocks.

4. Comparison with Canadian Sands

Canadian sands have been widely studied to identify their geomechanical behavior at elevated temperatures for different deposits, such as Athabasca, Cold Lake, and Peace River. The following plots show the difference that deposits from the Eastern Cordillera in Colombia (Picacho Formation) presents when compared with McMurray formation in the Athabasca deposit.
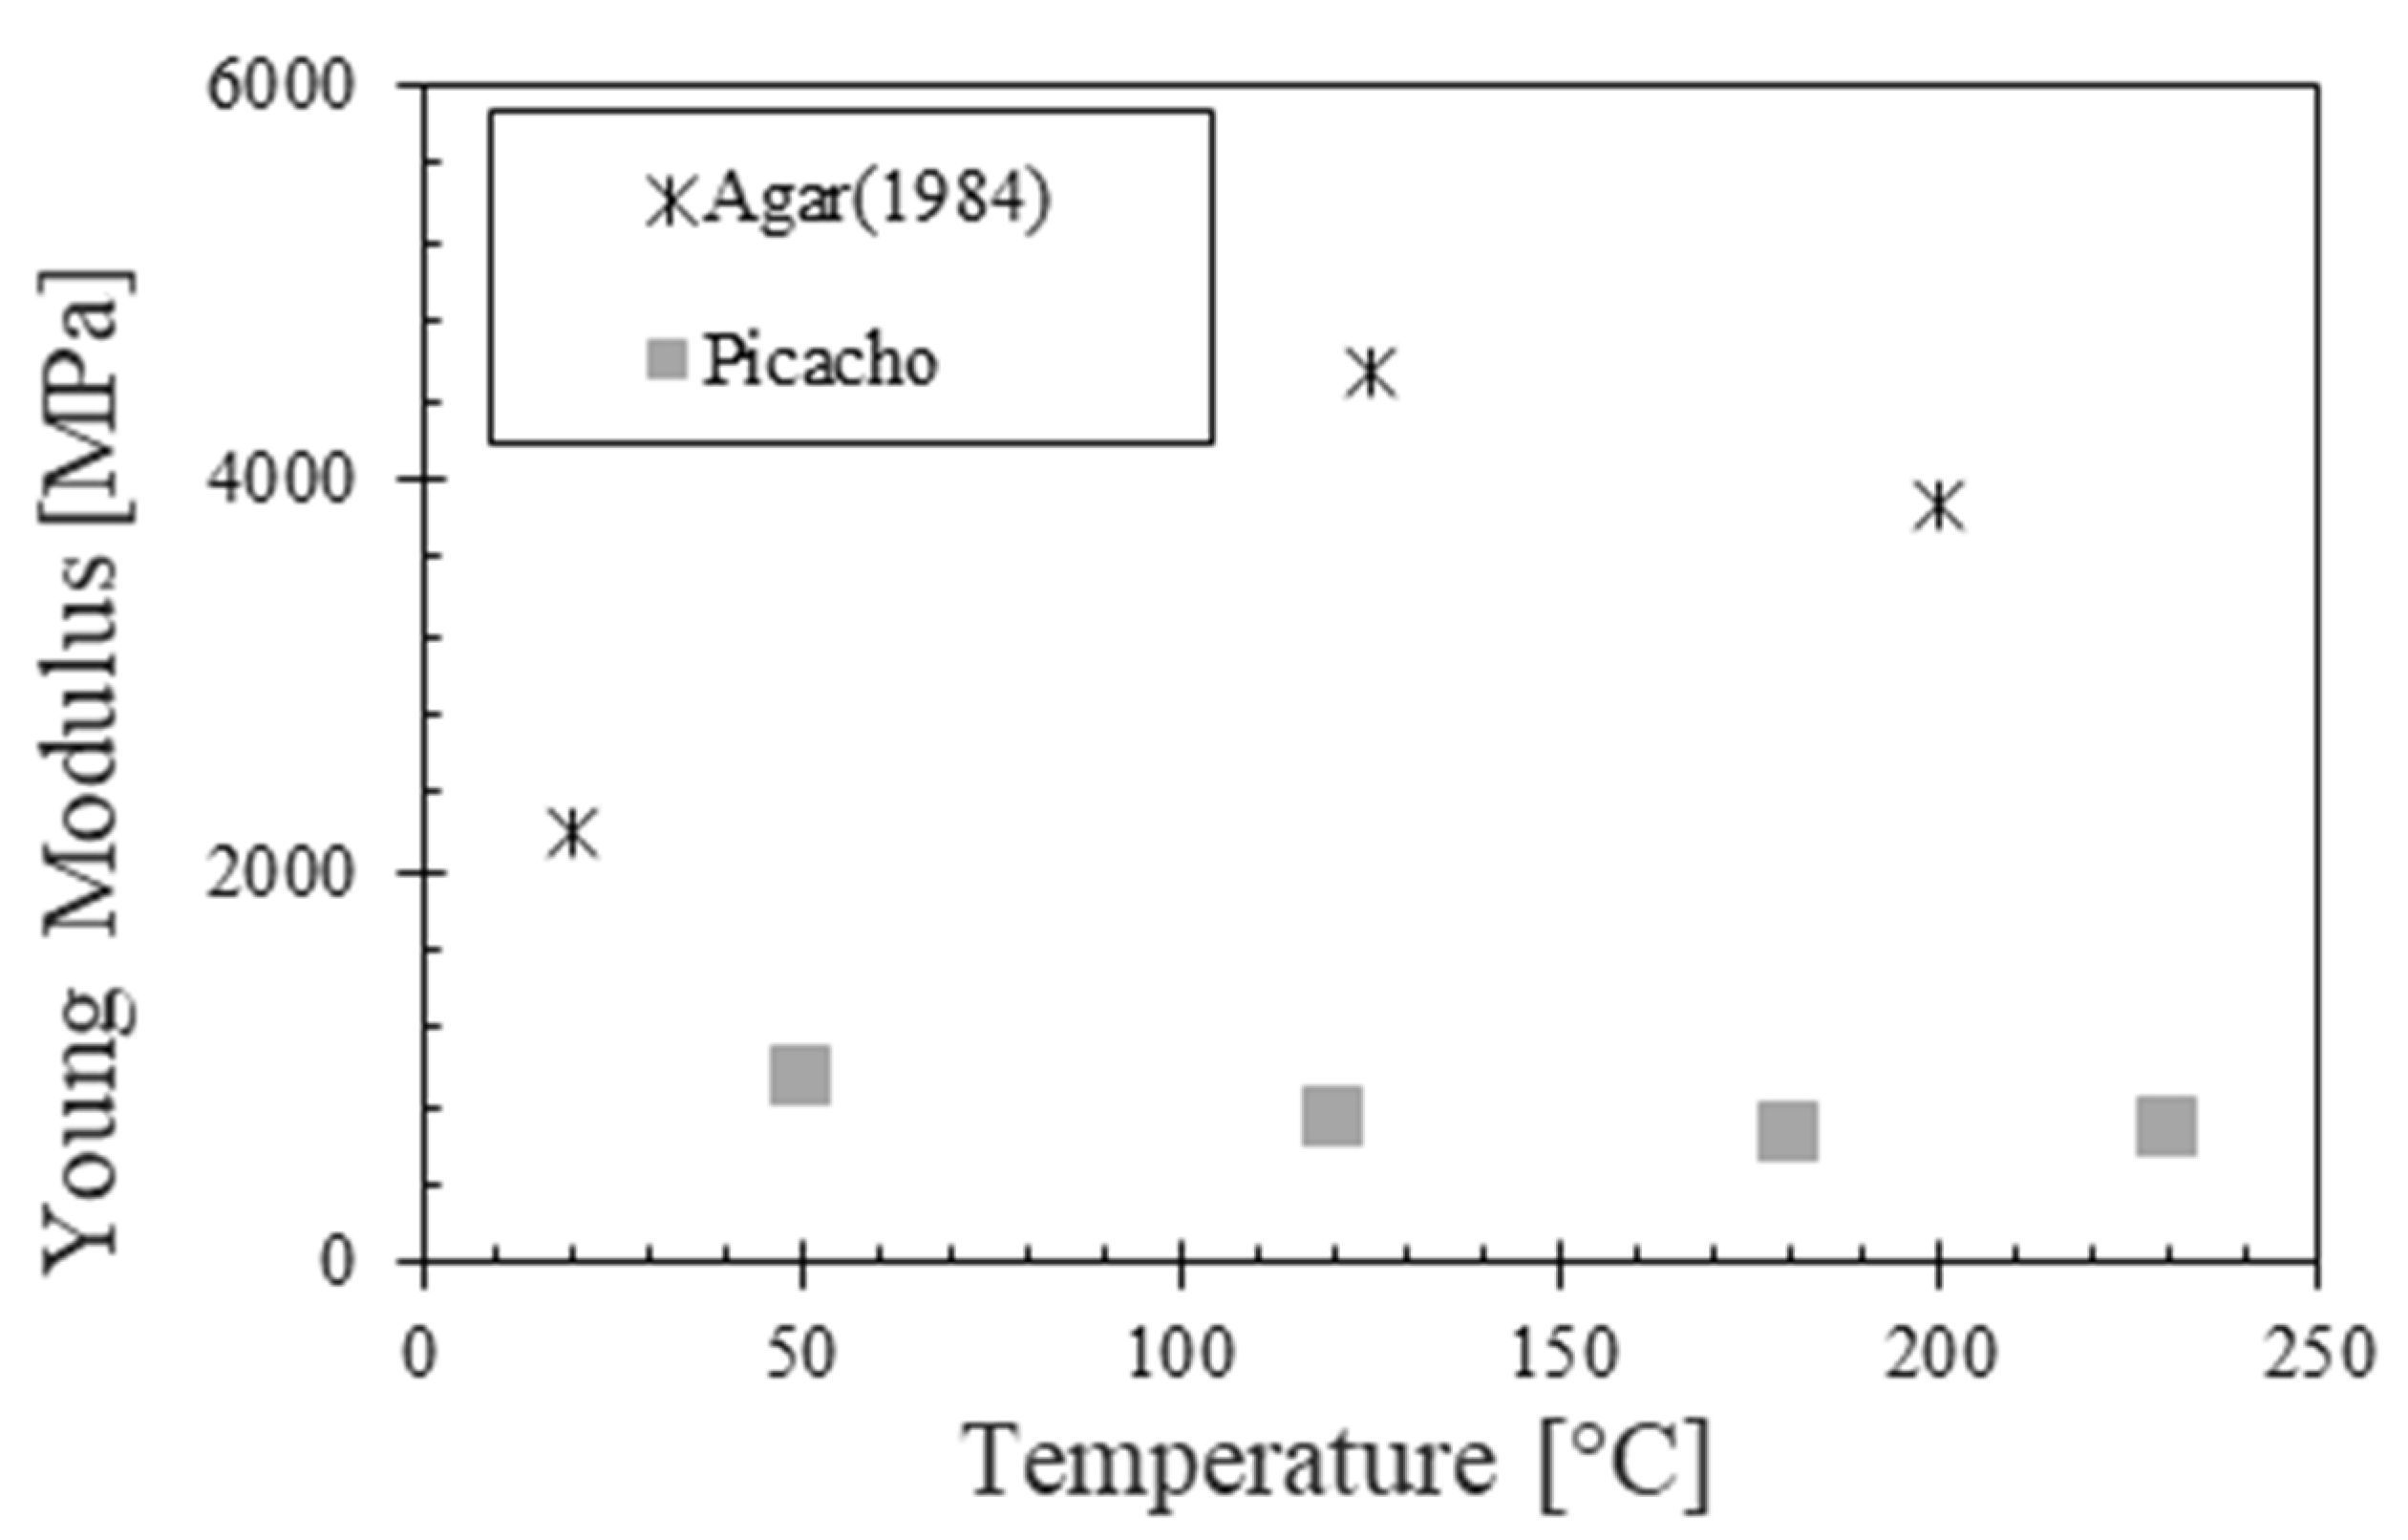
In Figure 15, the results obtained from the present work for Young’s modulus are compared with results obtained by Agar [8] for McMurray formation at effective confining of 4.0 MPa. It can be observed that McMurray samples initially increased, followed by a reduction in the temperature range studied. In contrast, Picacho’s sample exhibited a negative exponential behavior with temperature in the studied range. It is noticeable that the values obtained by Agar [8] are considerably higher than the ones obtained for Picacho’s sand, which can be explained by the interlocked grains feature of McMurray formation generated by the loading cycles during glaciations, as was explained by Dusseault [34].
The comparison of the Bulk’s modulus with the values obtained for McMurray formation is illustrated in Figure 16. All values were obtained in similar conditions of confining effective stress (4.0 MPa). In this case, the values obtained for Picacho formation are very similar to the ones attained for McMurray formation. It is noticeable that the results obtained do not follow a common trend for both formations.

5. Conclusions

An experimental program, which aims to find the influence of temperature in the geomechanical behavior of heavy oil reservoirs with high content of fines (30%), was outlined. The tests included high-temperature consolidated triaxial tests under drained conditions.
For the temperature range (50–230 °C), at low confining stress (0.4 MPa), the unconsolidated sandstones presented a dilatant behavior, with a strain-hardening behavior after yielding, until reaching the peak strength and then showing strain-softening behavior. The curves of volumetric strain at low confining stress (0.4 MPa) showed a slight initial contraction but, after yielding, show dilatation.
For the range of temperature (50–230 °C), at high confining stress (4.0 and 8.2 MPa), the unconsolidated sandstones presented strain hardening behavior and contract during shearing. The stress and volumetric strain curves of the samples tested at 50 °C were slightly different from those at higher temperatures (120, 180, and 230 °C), presenting a decrease in the strength and stiffness of the formation as the temperature increases. For high-temperature tests, the impact effect of the temperature was not relevant above 120 °C.
It is possible to conclude that when the temperature increases, the unconsolidated sandstone will experience a decrease in strength that may imply a more likely scenario for formation failure during thermal recovery processes, which can lead to operational and environmental problems. The effect of temperature on the stiffness and strength of the reservoir is more relevant for shallow reservoirs, which are subjected to low confining conditions. However, the stiffness properties, such as Young’s and Bulk’s moduli, initially describe a reduction followed by a slight increment when the temperature rises above 180 °C.
Despite having no clear trend, the overall data show that elastic moduli reduce when temperature increases. Furthermore, the reduction of elastic moduli can be very significant in some cases. For instance, Bulk’s modulus decreases up to 70% when the temperature goes from 50 °C (reservoir conditions) to the maximum temperature evaluated in this study (230 °C).
On the other hand, the parameters that describe the yielding envelope show a strong temperature dependence. For both the cohesion and internal friction angle, the relationship is linear. In contrast, the maximum reduction of the internal friction angles was 30%, and the cohesion reduced by 70% when the temperature rose from 50 to 230 °C. This condition should be taken into account when designing thermal recovery to avoid undesired events related to the yield of the formation.
It seems that the high content of fines modifies the mechanical behavior of sandstones significantly. Mostly, the samples exhibit low friction angles when compared to clean sandstones, such as Canadian ones. Additionally, the results showed that Colombian sandstones are less stiff when comparing to Canadian ones. This behavior is attributed to the interlocked grains and high compaction of Canadian sandstones caused by geological events, such as glaciations.
The results of this study show the importance of taking into account the effect of temperatures in the mechanical behavior of heavy oil reservoirs subjected to thermal recovery. Reproduction of in situ conditions at the laboratory must have special care, even for cases that do not involve the use of thermal techniques. Using conditions at the laboratory that differ from the in situ conditions could lead to an overestimation or underestimation of the material properties and a wrong simulation of the actual phenomena.
The thermomechanical properties of unconsolidated sandstones with high fines content (30%) are temperature and stress dependent. Coupled numerical simulations without consideration of this behavior will result in incorrect prediction and poor forecasting of oil production and risk assessment.

Author Contributions

J.A.A.-B. draft text writing and editing, lab tests, data collecting and analysis, instrumentation; G.A.A.-E. and A.A.-L. conceptualization and planning, research supervising, data analysis, conclusions, writing—review and editing; G.Z.-N. and R.C. research consulting, lab tests and methodology, data analysis, conclusions, and text verification. All authors have read and agreed to the published version of the manuscript.

Funding

This research has been funded by Ecopetrol S.A. and Minciencias through Grant No. 0264-2013, project No. 30553 “Geomechanical issues of the production and recovery of heavy and extra-heavy crudes”.

Institutional Review Board Statement

Not applicable.

Informed Consent Statement

Not applicable.

Data Availability Statement

The data presented in this study are available on request from the corresponding author.

Acknowledgments

The authors also wish to acknowledge the contribution of the staff from the GeoRef laboratory at the University of Alberta. This project is part of a collaboration agreement between Reservoir Geomechanics Research Group (RG2) at the University of Alberta and the Group of Applied Geomechanics Research (GIGA) at the Universidad Nacional de Colombia, Medellin Campus.

Conflicts of Interest

The authors declare no conflict of interest.

References

  1. Shafiei, A.; Dusseault, M.B. Geomechanics of thermal viscous oil production in sandstones. J. Pet. Sci. 2013, 103, 121–139. [Google Scholar] [CrossRef]
  2. ANH. Produccion Fiscalizada de Petroleo por Campo (Barriles Promedio por Dia Calendario—BPDC). 2014. Available online: https://www.anh.gov.co/estadisticas-del-sector/sistemas-integrados-operaciones/estad%C3%ADsticas-producción (accessed on 25 September 2021).
  3. Trigos, E.M.; Gonzales, A.R.; Pinilla, J.M.; Munoz, S.M.; Mercado, D.P. Feasibility study of applying steamflooding in a reservoir with high shale/sand: Teca field. In Proceedings of Trinidad and Tobago Energy Resources Conference, Port of Spain, Trinidad and Tobago, 27–30 June 2010. [Google Scholar] [CrossRef]
  4. Geoestudios. Cartografía Geológica Cuenca Cordillera Oriental-Sector Soapaga. ANH. Bogota, Colombia. 2006. Available online: https://www.anh.gov.co/Informacion-Geologica-y-Geofisica/Tesis/CARTOGRAFIA%20GEOLOGICA%20SOAPAGA-C.ORIENTAL%202005.pdf (accessed on 25 September 2021).
  5. Nissan, A.H.; Grunberg, I. The viscosity of hydrocarbons. In Proceedings of the Third World Petroleum Congress, The Hague, The Netherlands, 28 May–6 June 1951; pp. 279–311. [Google Scholar]
  6. Serdengecti, S.; Boozer, G.D. The effect of strain rate and temperature on behavior of rocks subjected to triaxial compression. In Proceedings of the 4th U.S. Symposium on Rock Mechanics, University Park, PA, USA, 30 March–1 April 1961. [Google Scholar]
  7. Mobarack, S.A.; Somerton, W.H. The effect of temperature and pressure on wave velocities in porous rocks. In Proceedings of the Fall Meeting of the Society of Petroleum Engineers of AIME, New Orleans, LA, USA, 3 October 1971. [Google Scholar]
  8. Agar, J.G. Geotechnical Behavior of Oil Sand at Elevated Temperatures. Ph.D. Thesis, The University of Alberta, Edmonton, AB, Canada, 1984. [Google Scholar] [CrossRef]
  9. Kosar, K.M. Geotechnical Properties of Oil Sands and Related Strata. Ph.D. Thesis, The University of Alberta, Edmonton, AB, Canada, 1989. [Google Scholar] [CrossRef]
  10. Chalaturnyk, R.J. Geomechanics of the Steam Assisted Gravity Drainage Process in Heavy Oil Reservoirs. Ph.D. Thesis, The University of Alberta, Edmonton, AB, Canada, 1995. [Google Scholar] [CrossRef]
  11. Lintao, Y.; Marshall, A.M.; Wanatowski, D.; Stace, R.; Ekneligoda, T. Effect of high temperatures on sandstone—A computed tomography scan study. Int. J. Phys. 2017, 17, 75–90. [Google Scholar] [CrossRef]
  12. Wei, S.; Yang, Y.; Su, C.; Cardosh, S.R.; Wang, H. Experimental study of the effect of high temperature on the mechanical properties of coarse sandstone. Appl. Surf. Sci. 2019, 9, 2424. [Google Scholar] [CrossRef] [Green Version]
  13. Luo, J.; Wang, L. High-temperature mechanical properties of mudstone in the process of underground coal gasification. Rock Mech. Rock Eng. 2011, 44, 749–754. [Google Scholar] [CrossRef]
  14. Dengo, C.A.; Covey, M.C. Structure of the Eastern Cordillera of Colombia: Implications for trap styles and regional tectonics. Am. Assoc. Pet. Geol. Bull. 1993, 77, 1315–1337. [Google Scholar] [CrossRef]
  15. ASTM D6913-04. Standard Test Methods for Particle-Size Distribution (Gradation) of Soils Using Sieve Analysis; ASTM International: West Conshohocken, PA, USA, 2009; Available online: www.astm.org (accessed on 25 September 2021).
  16. ASTM D422-63. Standard Test Method for Particle-Size Analysis of Soils; ASTM International: West Conshohocken, PA, USA, 2009; Available online: www.astm.org (accessed on 25 September 2021).
  17. Folk, R. Petrology of the Sedimentary Rocks, 2nd ed.; Hemphill Publishing: Austin, TX, USA, 1980. [Google Scholar] [CrossRef]
  18. Research Council of Alberta. Geology of the McMurray Formation, Part III, General Geology of the McMurray Area; Alberta Geological Survey: Edmonton, AB, Canada, 1959. [Google Scholar]
  19. Yu, J.; Chen, S.; Chen, X.; Zhang, Y.; Cai, Y. Experimental investigation on mechanical properties and permeability evolution of red sandstone after heat treatments. J. Zhejiang Univ. Sci. 2015, 16, 749–759. [Google Scholar] [CrossRef] [Green Version]
  20. Dwivedi, R.D.; Goel, R.K.; Prasad, V.V.R.; Sinha, A. Thermo-mechanical properties of Indian and other granites. Int. J. Rock Mech. Min. Sci. 2008, 45, 303–315. [Google Scholar] [CrossRef]
  21. Wang, X.; Chalaturnyk, R.; Huang, H.; Leung, J. Permeability variations associated with various stress state during pore pressure injection. In Proceedings of the 49th U.S. Rock Mechanics/Geomechanics Symposium, San Francisco, CA, USA, 29 June–1 July 2015. [Google Scholar]
  22. Charley, R.C.; Stevens, E.; Sheth, N. Suggested test method for determination of degree of saturation of soil samples by B value measurement. Geotech. Test. J. 1979, 2, 158–162. [Google Scholar] [CrossRef]
  23. ASTM D7181-20. Standard Test Method for Consolidated Drained Triaxial Compression Test for Soils; ASTM International: West Conshohocken, PA, USA, 2020; Available online: www.astm.org (accessed on 25 September 2021).
  24. Arias-Buitrago, J.A.; Alzate-Espinosa, G.; Arbelaez-Londono, A.; Morales, C.B.; Chalaturnyk, R.J.; Zambrano, G. Influence of confining stress in petrophysical properties changes during thermal recovery in silty sands Colombia. In Proceedings of the SPE Latin America and Caribbean Heavy and Extra Heavy Oil Conference, Lima, Peru, 19–20 October 2016. [Google Scholar] [CrossRef]
  25. Huertas, F.J. Transformation reactions in phyllosilicates at low temperature: An experimental approach. Diagenesis Low-Temp. Metamorphism. Theory Methods Reg. Asp. 2007, 3, 65–74. [Google Scholar]
  26. Girsperger, U.; Thompson, S.; Bruce, A. Thermal expansion, compressibility and volumetric changes of quartz obtained by single crystal dilatometry to 700 °C and 3.5 Kilobars. Schweiz. Mineral. Petrogr. Mitt. 2002, 82. [Google Scholar] [CrossRef]
  27. Bolton, M.D. The strength and dilatancy of sands. Geotechnique 1986, 36, 65–78. [Google Scholar] [CrossRef] [Green Version]
  28. Yang, Z.X.; Yang, J.; Wang, L.Z. On the influence of inter-particle friction and dilatancy in granular materials: A numerical analysis. Granular Matter 2012, 14, 433–447. [Google Scholar] [CrossRef]
  29. U.S. Army Engineer Waterways Experiment Station. Calculation of stress and strain from triaxial test data on undrained soil specimens. J. Terramech. 1971, 8, 73. [Google Scholar] [CrossRef] [Green Version]
  30. Zimmerman, R.W.; Somerton, W.H.; King, M.S. Compressibility of porous rocks. J. Geophys. Res. Solid Earth 1986, 91, 12765–12777. [Google Scholar] [CrossRef]
  31. Morales-Monsalve, C.; Lara-Restrepo, I.; Araujo-Guerrero, E.; Alzate-Espinosa, G.A.; Arbelaez-Londono, A.; Naranjo-Agudelo, A. Effect of temperature on the strength parameters at the plastic domain for unconsolidated sandstones. Geotech. Geol. Eng. 2018, 36, 3537–3549. [Google Scholar] [CrossRef]
  32. Popescu, M.E. An Introduction to Geotechnical Engineering; Holtz, R.D., Kovacs, W.D., Eds.; Prentice-Hall: Englewood Cliff, NJ, USA, 1986; p. 733. [Google Scholar] [CrossRef]
  33. Campanella, R.G.; Mitchell, J.K. Influence of temperature variations on soil behavior. J. Soil Mech. Found. Div. 1968, 94, 709–734. [Google Scholar] [CrossRef]
  34. Dusseault, M.B. The Geotechnical Characteristics of Athabasca Oil Sands. Ph.D. Thesis, The University of Alberta, Edmonton, AB, Canada, 1977. [Google Scholar] [CrossRef]
Figure 1. SEM picture of the sample ×50 of Picacho formation.
Energies 14 07007 g001
Figure 2. Particle size distribution for the Picacho formation (high fines content) and McMurray formation (clean sand).
Energies 14 07007 g002
Figure 3. Photo of the experimental setup. Left: cell inside the environmental chamber placed in the load frame. Right: sample setup, including the Viton membrane and the local LVDT’s; all the instruments and wires must keep their integrity at high temperatures.
Energies 14 07007 g003
Figure 4. Scheme of the setup used for triaxial tests, including pumps, transducers, and computers that control the devices.
Energies 14 07007 g004
Figure 5. Reconstituted samples of Picacho formation after the reconstitution process.
Energies 14 07007 g005
Figure 6. Scheme of the stresses applied to the sample during shear.
Energies 14 07007 g006
Figure 7. Deviator stress and volumetric strain vs. axial strain for the CIDTX tests performed at 0.4 MPa of effective stress.
Energies 14 07007 g007
Figure 8. Deviator stress and volumetric strain vs. axial and radial strain for the CIDTX tests performed at 4.0 and 8.2 MPa of effective stress.
Energies 14 07007 g008
Figure 9. SEM picture of sample material after testing at 4 MPa and 120 °C where grain crushing is observed caused by thermal expansion and shearing.
Energies 14 07007 g009
Figure 10. Picture of one reconstituted sample of Picacho formation after testing at 4 MPa and 120 °C.
Energies 14 07007 g010
Figure 11. Tangent Young’s modulus as a function of temperature for the different effective confining conditions evaluated.
Energies 14 07007 g011
Figure 12. Bulk’s modulus changes with temperature for all the effective confining conditions evaluated.
Energies 14 07007 g012
Figure 13. Comparison of yielding envelopes with temperature from CIDTX tests for reconstituted samples of Picacho formation.
Energies 14 07007 g013
Figure 14. Internal friction angle changes with temperature for Picacho formation.
Energies 14 07007 g014
Figure 15. Young’s modulus vs. temperature comparison with Canadian sandstones at 4 MPa.
Energies 14 07007 g015
Figure 16. Bulk’s modulus vs. temperature comparison with previous studies with Canadian sandstone at 4 MPa.
Energies 14 07007 g016
Table 1. Tests conditions.
TestTemperature [°C]Effective Confining Stress [MPa]
1508.2
2504.0
3500.4
41208.2
51204.0
61200.4
71808.2
81804.0
91800.4
102308.2
112304.0
122300.4
Publisher’s Note: MDPI stays neutral with regard to jurisdictional claims in published maps and institutional affiliations.