Article

Impact of Simulated Biogas Compositions (CH4 and CO2) on Vibration, Sound Pressure and Performance of a Spark Ignition Engine

by
Donatas Kriaučiūnas
1,
Tadas Žvirblis
2,
Kristina Kilikevičienė
3,
Artūras Kilikevičius
3,
Jonas Matijošius
3,*,
Alfredas Rimkus
1 and
Darius Vainorius
3
1
Department of Automobile Engineering, Transport Engineering Faculty, Vilnius Gediminas Technical University, Jono Basanavičiaus Street 28, LT-03224 Vilnius, Lithuania
2
Department of Mechanical and Material Engineering, Vilnius Gediminas Technical University, Jono Basanavičiaus Street 28, LT-03224 Vilnius, Lithuania
3
Institute of Mechanical Science, Vilnius Gediminas Technical University, Jono Basanavičiaus Street 28, LT-03224 Vilnius, Lithuania
*
Author to whom correspondence should be addressed.
Energies 2021, 14(21), 7037; https://doi.org/10.3390/en14217037
Submission received: 17 September 2021 / Revised: 16 October 2021 / Accepted: 22 October 2021 / Published: 27 October 2021
(This article belongs to the Special Issue Energy Decision Making: Problems, Methods, and Tools)

Abstract

:
Biogas has increasingly been used as an alternative to fossil fuels in the world due to a number of factors, including the availability of raw materials, extensive resources, relatively cheap production and sufficient energy efficiency in internal combustion engines. Tightening environmental and renewable energy requirements create excellent prospects for biogas (BG) as a fuel. A study was conducted on a 1.6-L spark ignition (SI) engine (HR16DE), testing simulated biogas with different methane and carbon dioxide contents (100CH4, 80CH4_20CO2, 60CH4_40CO2, and 50CH4_50CO2) as fuel. The rate of heat release (ROHR) was calculated for each fuel. Vibration acceleration time, sound pressure and spectrum characteristics were also analyzed. The results of the study revealed which vibration of the engine correlates with combustion intensity, which is directly related to the main measure of engine energy efficiency—break thermal efficiency (BTE). Increasing vibrations have a negative correlation with carbon monoxide (CO) and hydrocarbon (HC) emissions, but a positive correlation with nitrogen oxide (NOx) emissions. Sound pressure also relates to the combustion process, but, in contrast to vibration, had a negative correlation with BTE and NOx, and a positive correlation with emissions of incomplete combustion products (CO, HC).

1. Introduction

The development of the transport sector has been successful due to declining use of fossil fuels and carbon dioxide (CO2) emissions, as defined in the EU Transport white paper [1]. The simplest way to ensure environmental friendliness and to reduce air pollution is to use alternatives to fossil fuels [2,3]. Spark ignition engines can run on both liquid and gaseous alternative fuels [4]. Each of these types has its own advantages and disadvantages, which are reflected in the economical use of such fuels and the technologies that ensure stable operation of the SI engine [5]. Gaseous fuels can be of fossil or biological origin. The latter have a whole host of advantages: raw materials for fuel could be used from local resources, including industry, and the production of biological origin fuel contributes to waste management [6]. Therefore, the use and production of biogas is important for energy independence, waste treatment and support for local industry.
In case of biogas, it has a great potential as it can be obtained as waste in various industries where fermentation or decay processes take place [7] (in the food industry e.g., cheese production [8], landfill gas treatment [9], fertilizer production—manure and slurry processing [10]). Clearly, the use of such fuels also has negative consequences, as CO2 in biogas reduces the calorific value of fuels and changes their combustion properties [11], decreases the maximum in-cylinder pressure [12] and the lower heating value (LHV) of the air—fuel mixture [13]. Also, biogas contains CO, hydrogen sulfide (H2S), siloxanes, nitrogen (N2), oxygen (O2) and hydrogen (H2) [14] which could damage an internal combustion (IC) engine, therefore they should be separated by biological desulphurization [15] and membrane separation process [16]. Replacing gasoline with biogas will result in higher brake specific fuel consumption (BSFC) and lower BTE values [17]. The compression ratio is increased to increase engine efficiency, but then the maximum brake torque values decrease, and HC emissions increase [18]. Propane or hydrogen can be used to increase the LHV of biogas and to improve the combustion process of biogas [19]. Port injection of methanol can also be used to increase combustion and ecological parameters of biogas [20], but ethanol content should be limited to 18% of the total fuel supplied [17]. As an option, additional oxygen supply to biogas is possible. Increasing the oxygen content in biogas by 1–2% extends the lean ignition limit [21]. The supply of pure hydrogen to biogas increases engine power and efficiency [22]. All the above cases render an ecological effect, CO and HC emissions decrease, but NOx emissions increase [19,20,21,22].
For the smooth operation of an IC engine, vibrations, which cause jolty performance of the engine, are measured [23]. Vibration and sound pressure can also help to identify various dynamic processes that take place in buses [24], engine exhaust decontamination (for particulate matter (PM) agglomeration) [25], and the prediction of dynamic parameters of bridges and other structures [26].
Multi-criteria evaluation models can also be used as a tool for predicting biogas performance in IC engines, such as prognostic statistical models for estimating the impact of biogas flow on engine performance [27], or the selection of the optimal proportions of diesel/n-butanol/biogas in the fuel mixture [28]. The 0-D model was used to predict IC engine performance [29]. The prediction of the performance of pure methane as fuel can be based on the hybrid SWARA-ARAS model, but it was only used to estimate the HC, CO, CO2 and compilation ratios [30]. The operational competitiveness rating was used to predict the performance of cotton waste biodiesel in the compression ignition (CI) engine, which predicted BSFC [31]. MULTIMOORA and SWARA models were used to predict the performance of nitromethane blends with biodiesel in the CI engine, which allowed to evaluate the ecological (CO, CO2, HC, NOx, smoke) and energy (BSFC, BTE) characteristics of a CI engine [32].
Prediction models for various parameters under different fuel mixtures in IC engines have been described and examined in literature. However, a detailed assessment of the energy and environmental performance of a SI engine has not been provided. Therefore, the purpose of this study is to analyze IC engine parameters using statistical analysis models and to evaluate the relationship between engine vibration and sound pressure data with ecologic and energetic parameters.

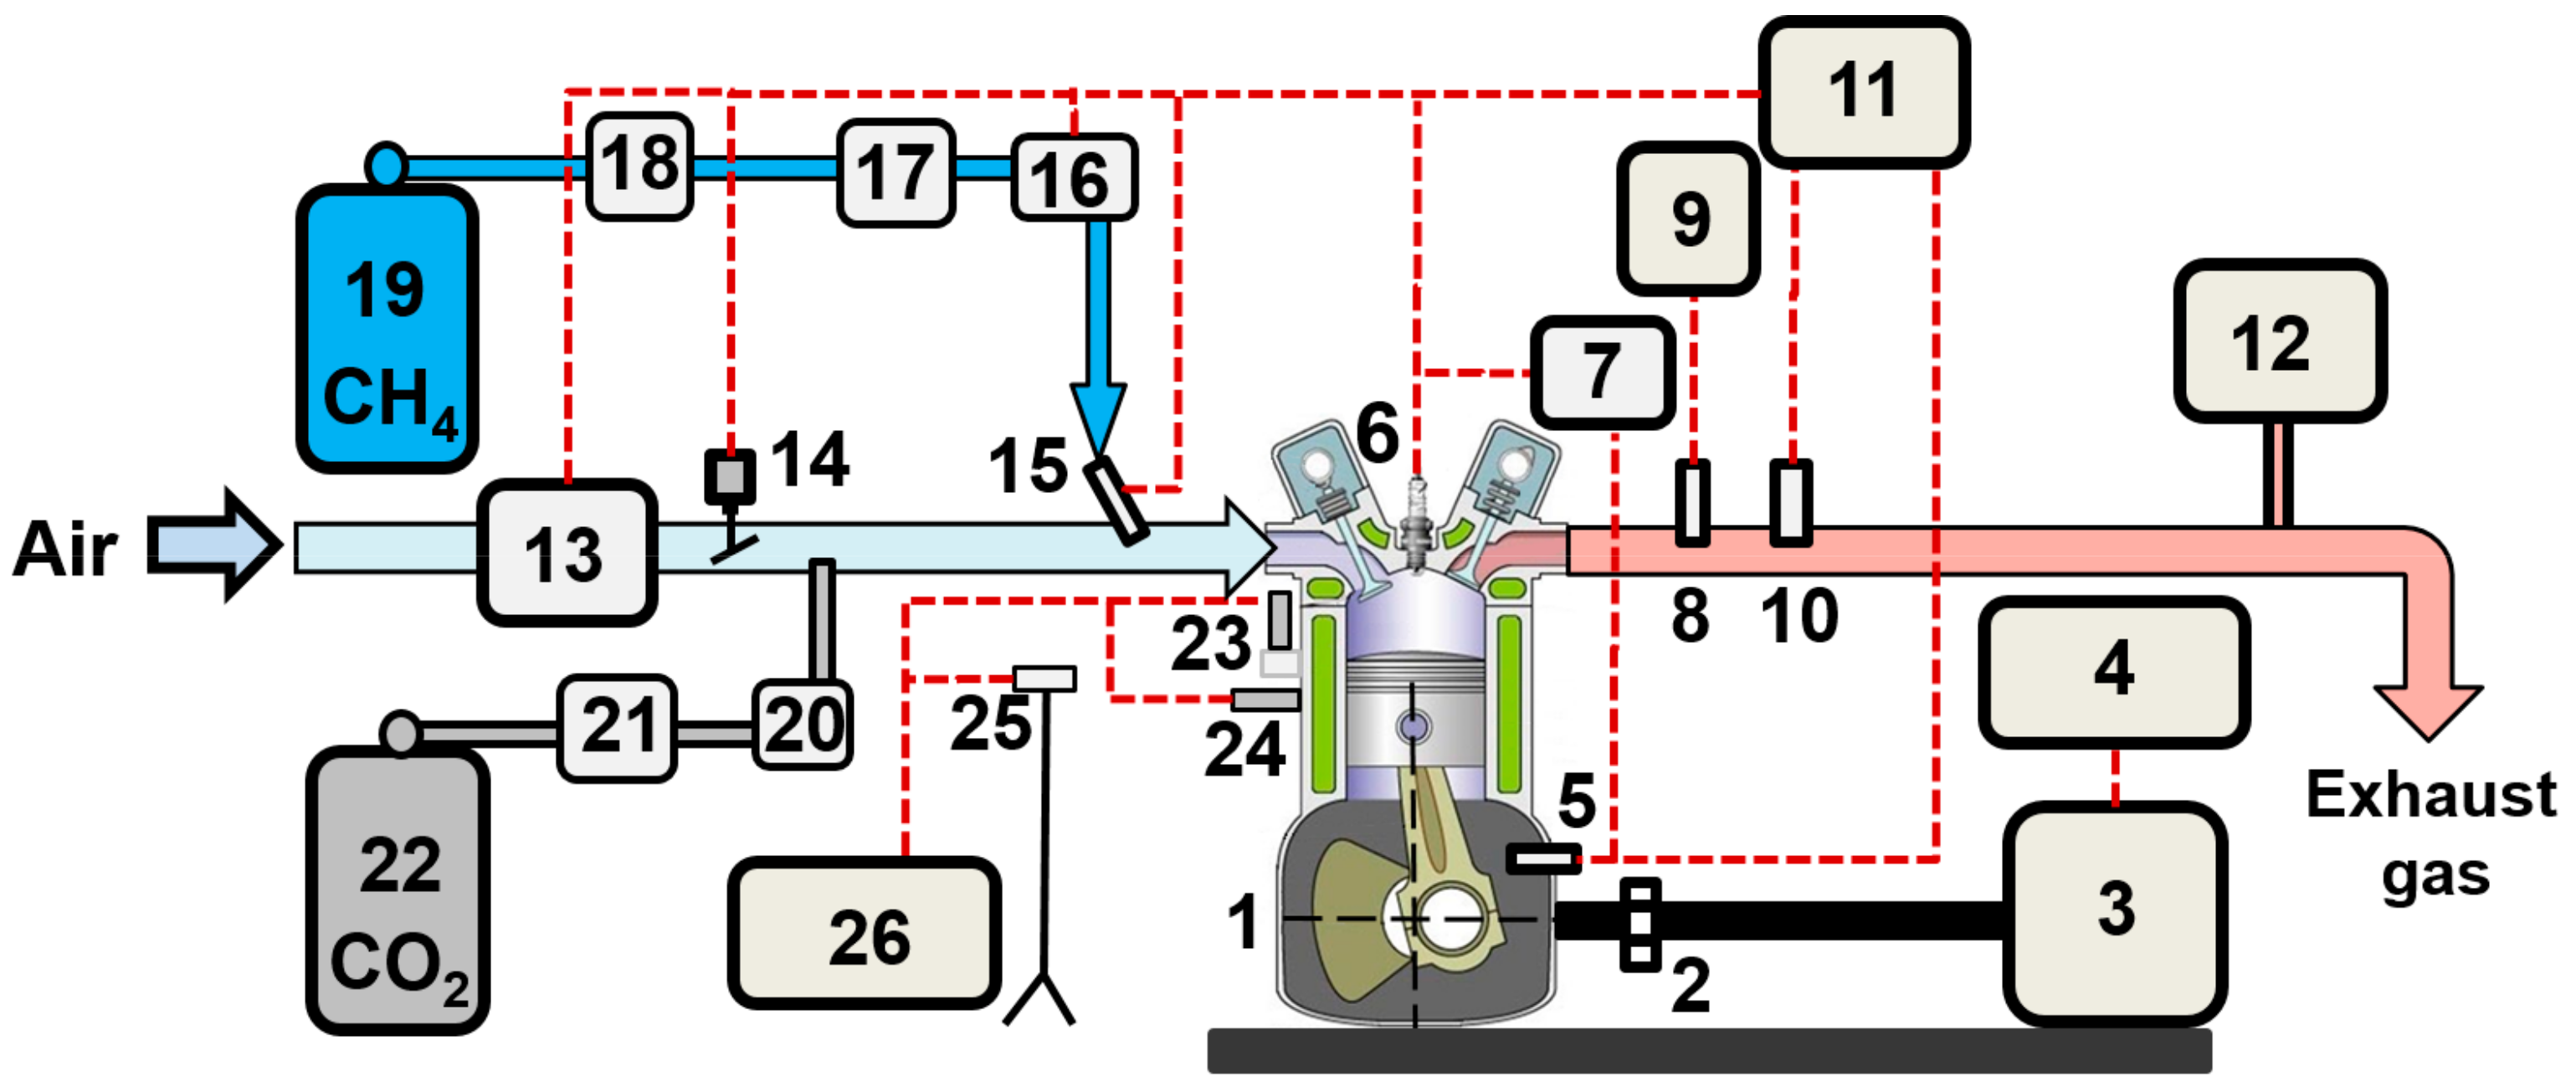
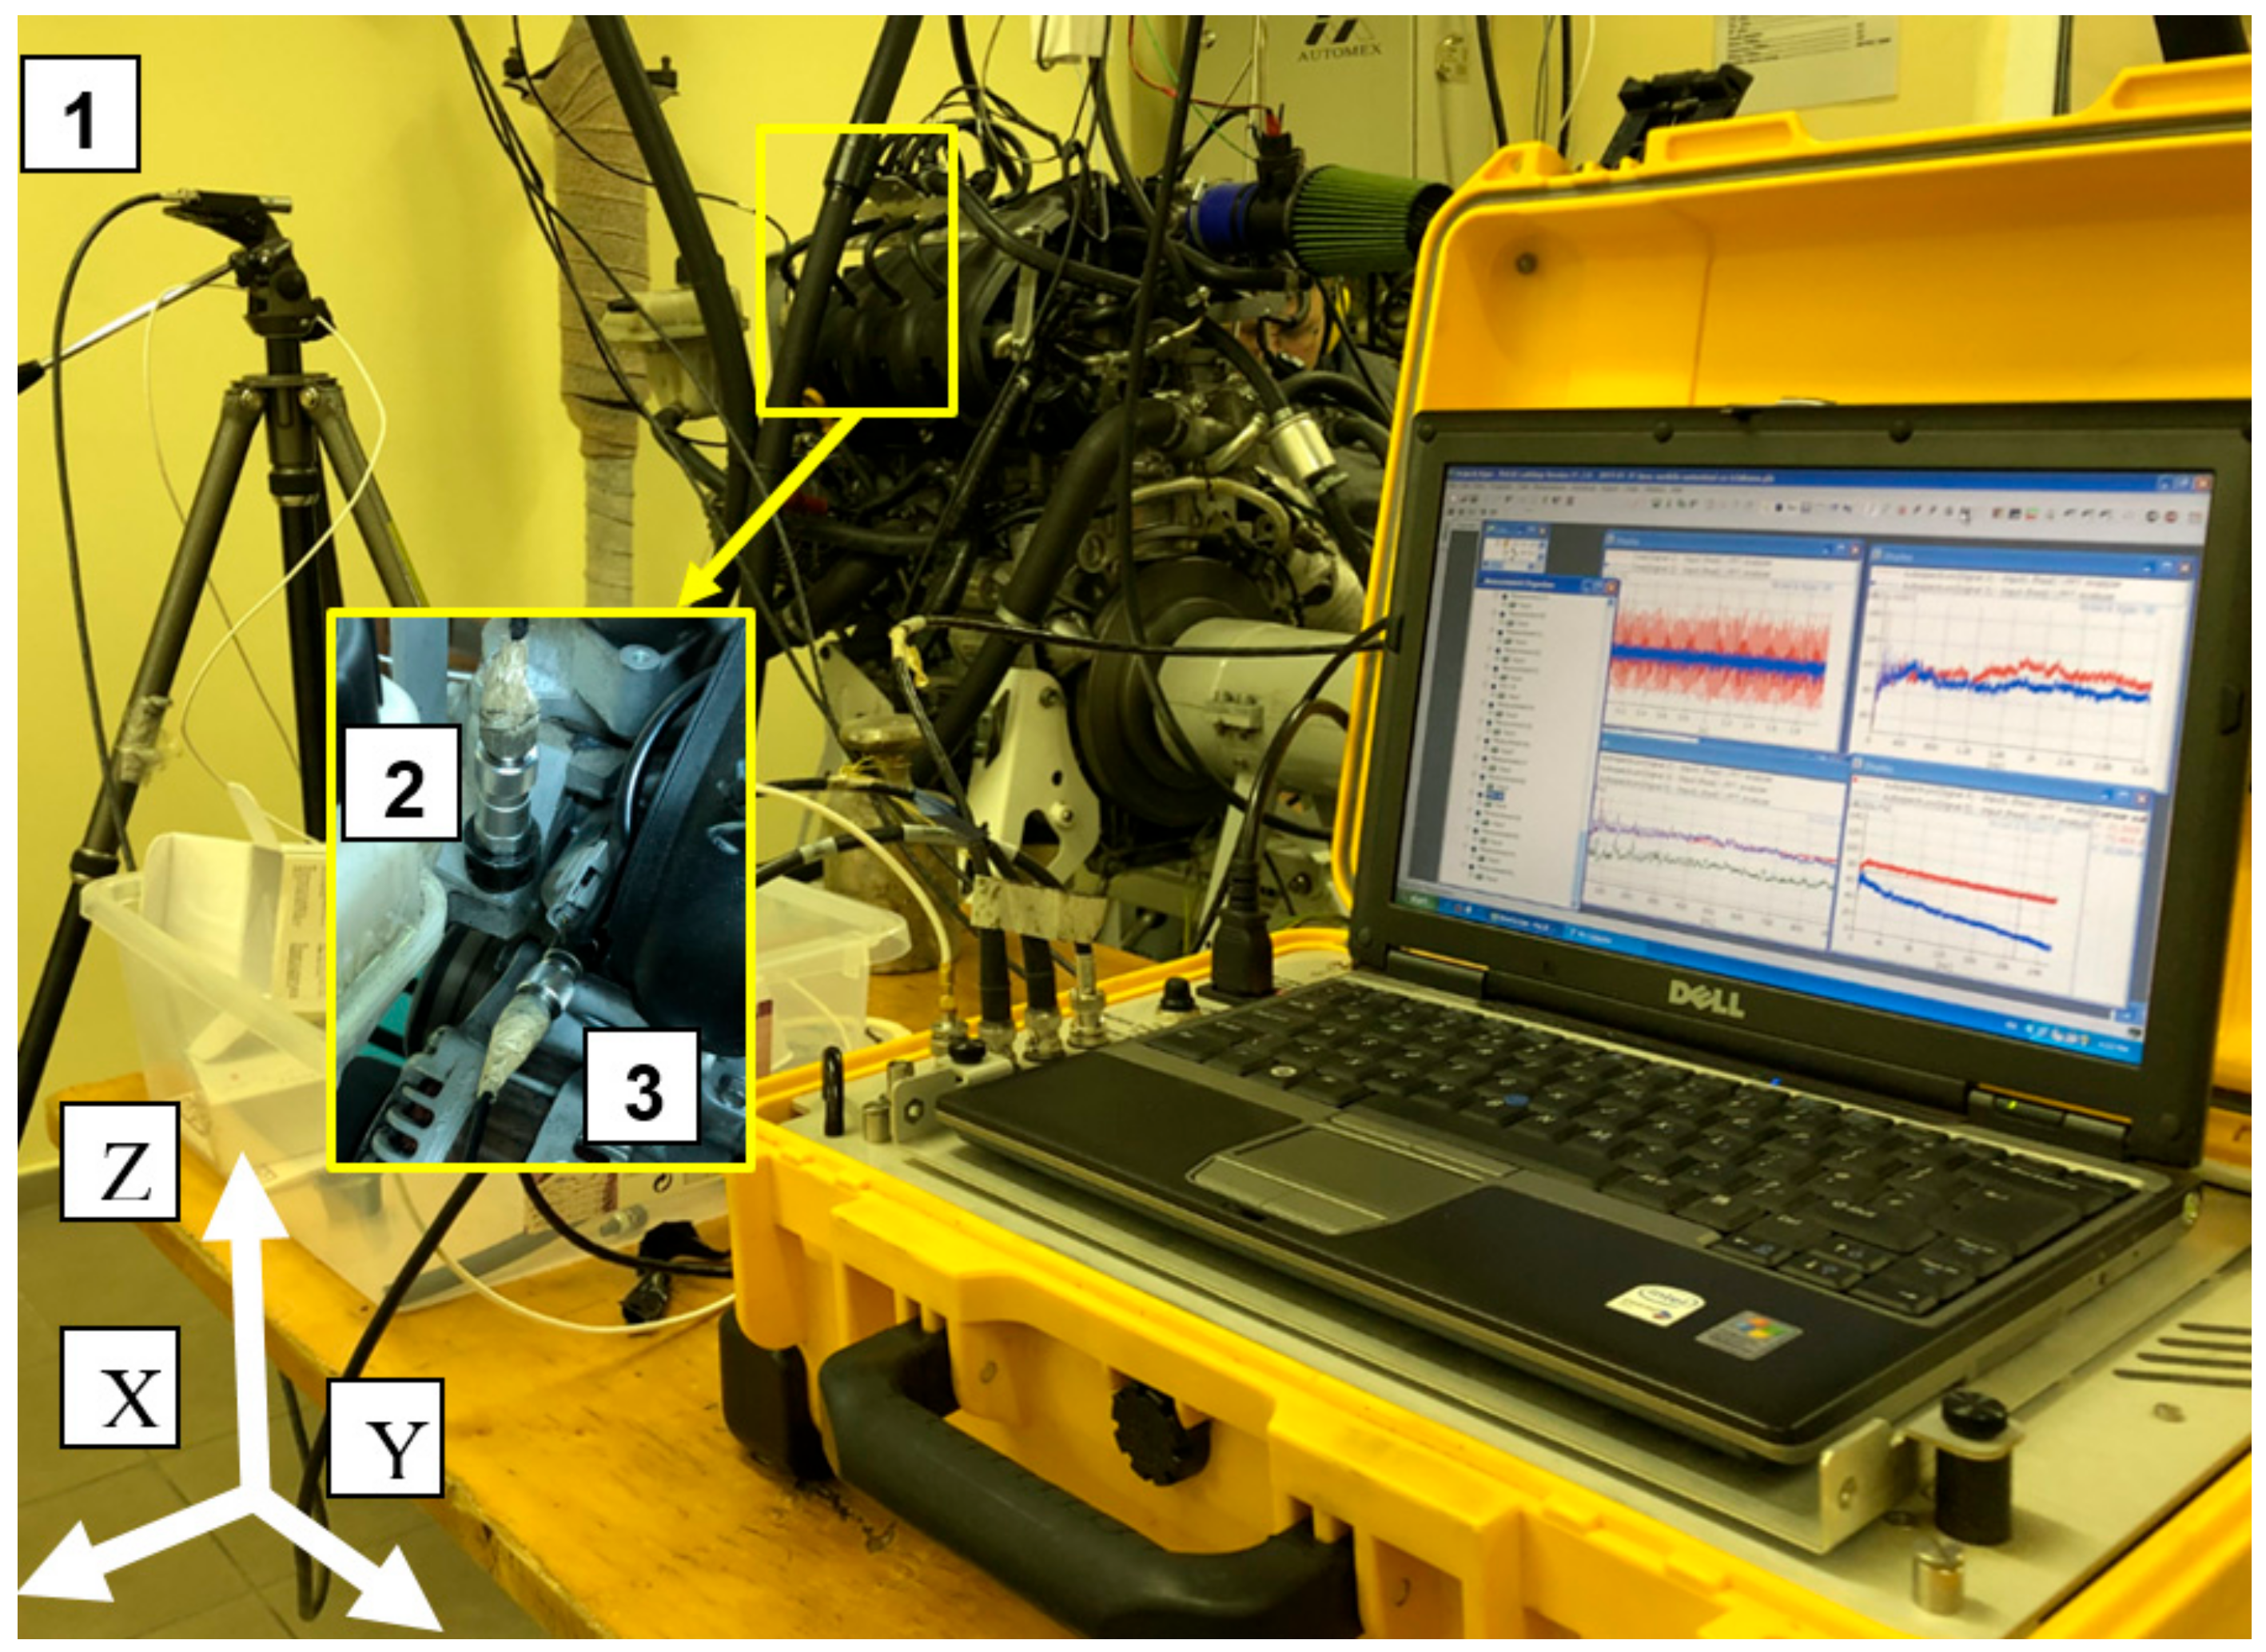
2. Materials and Methods
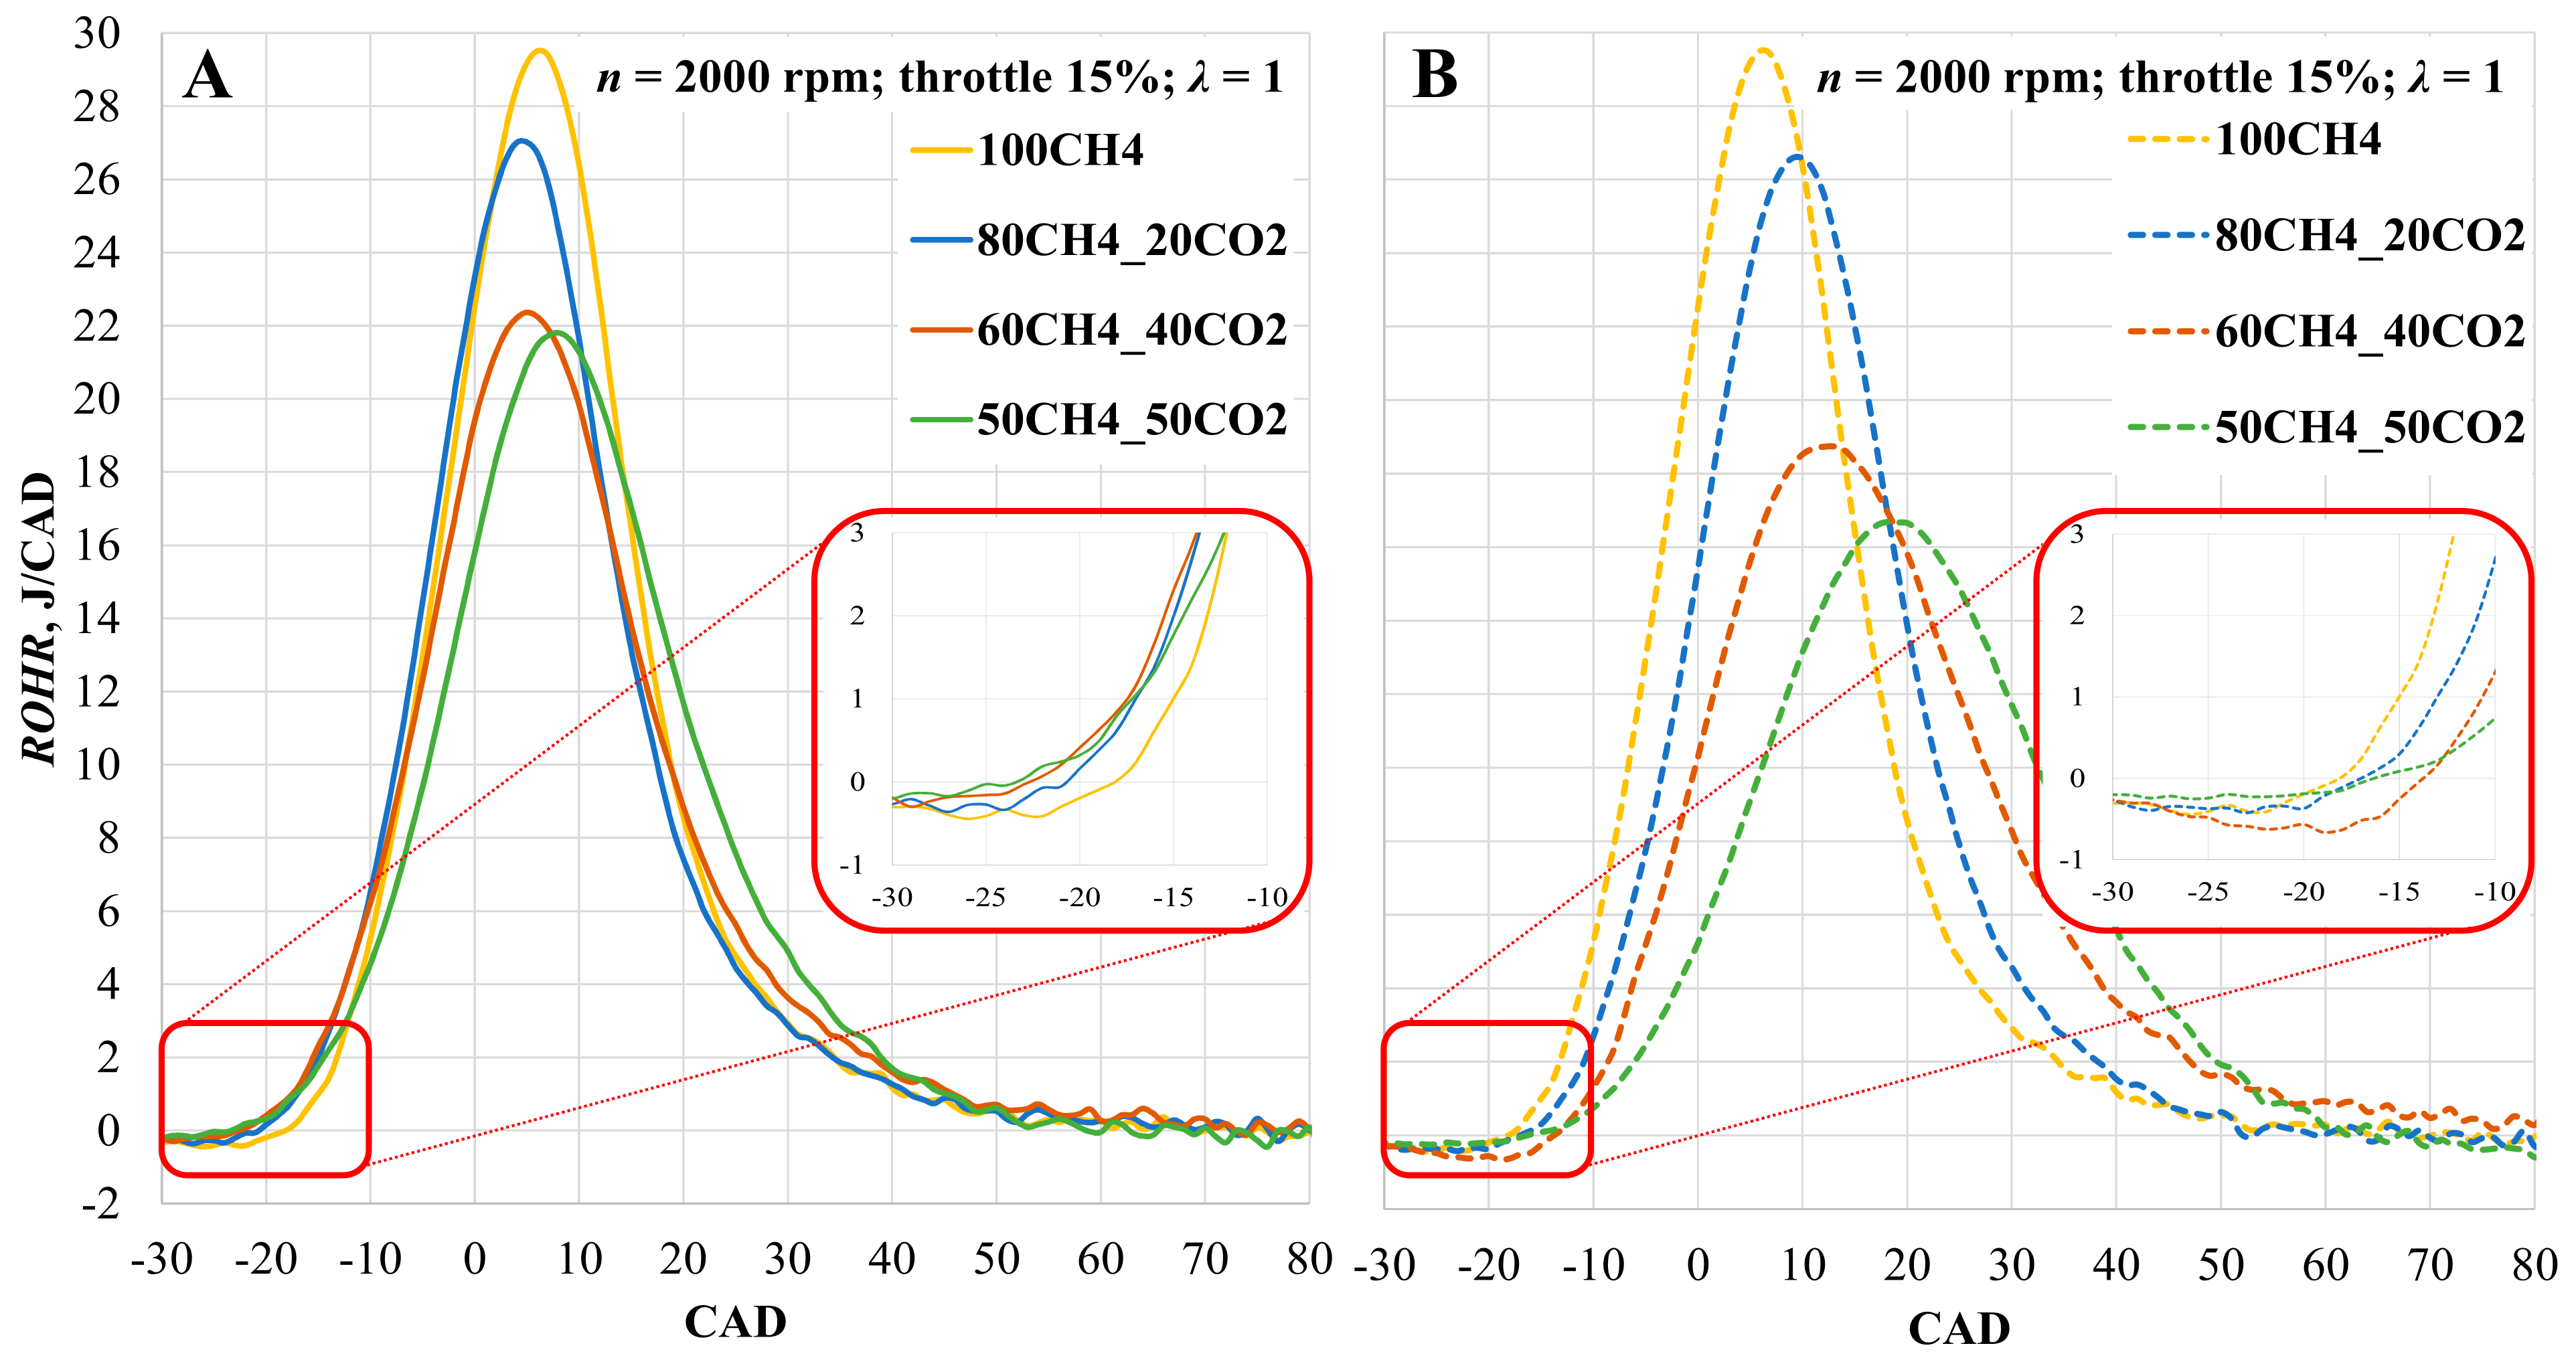
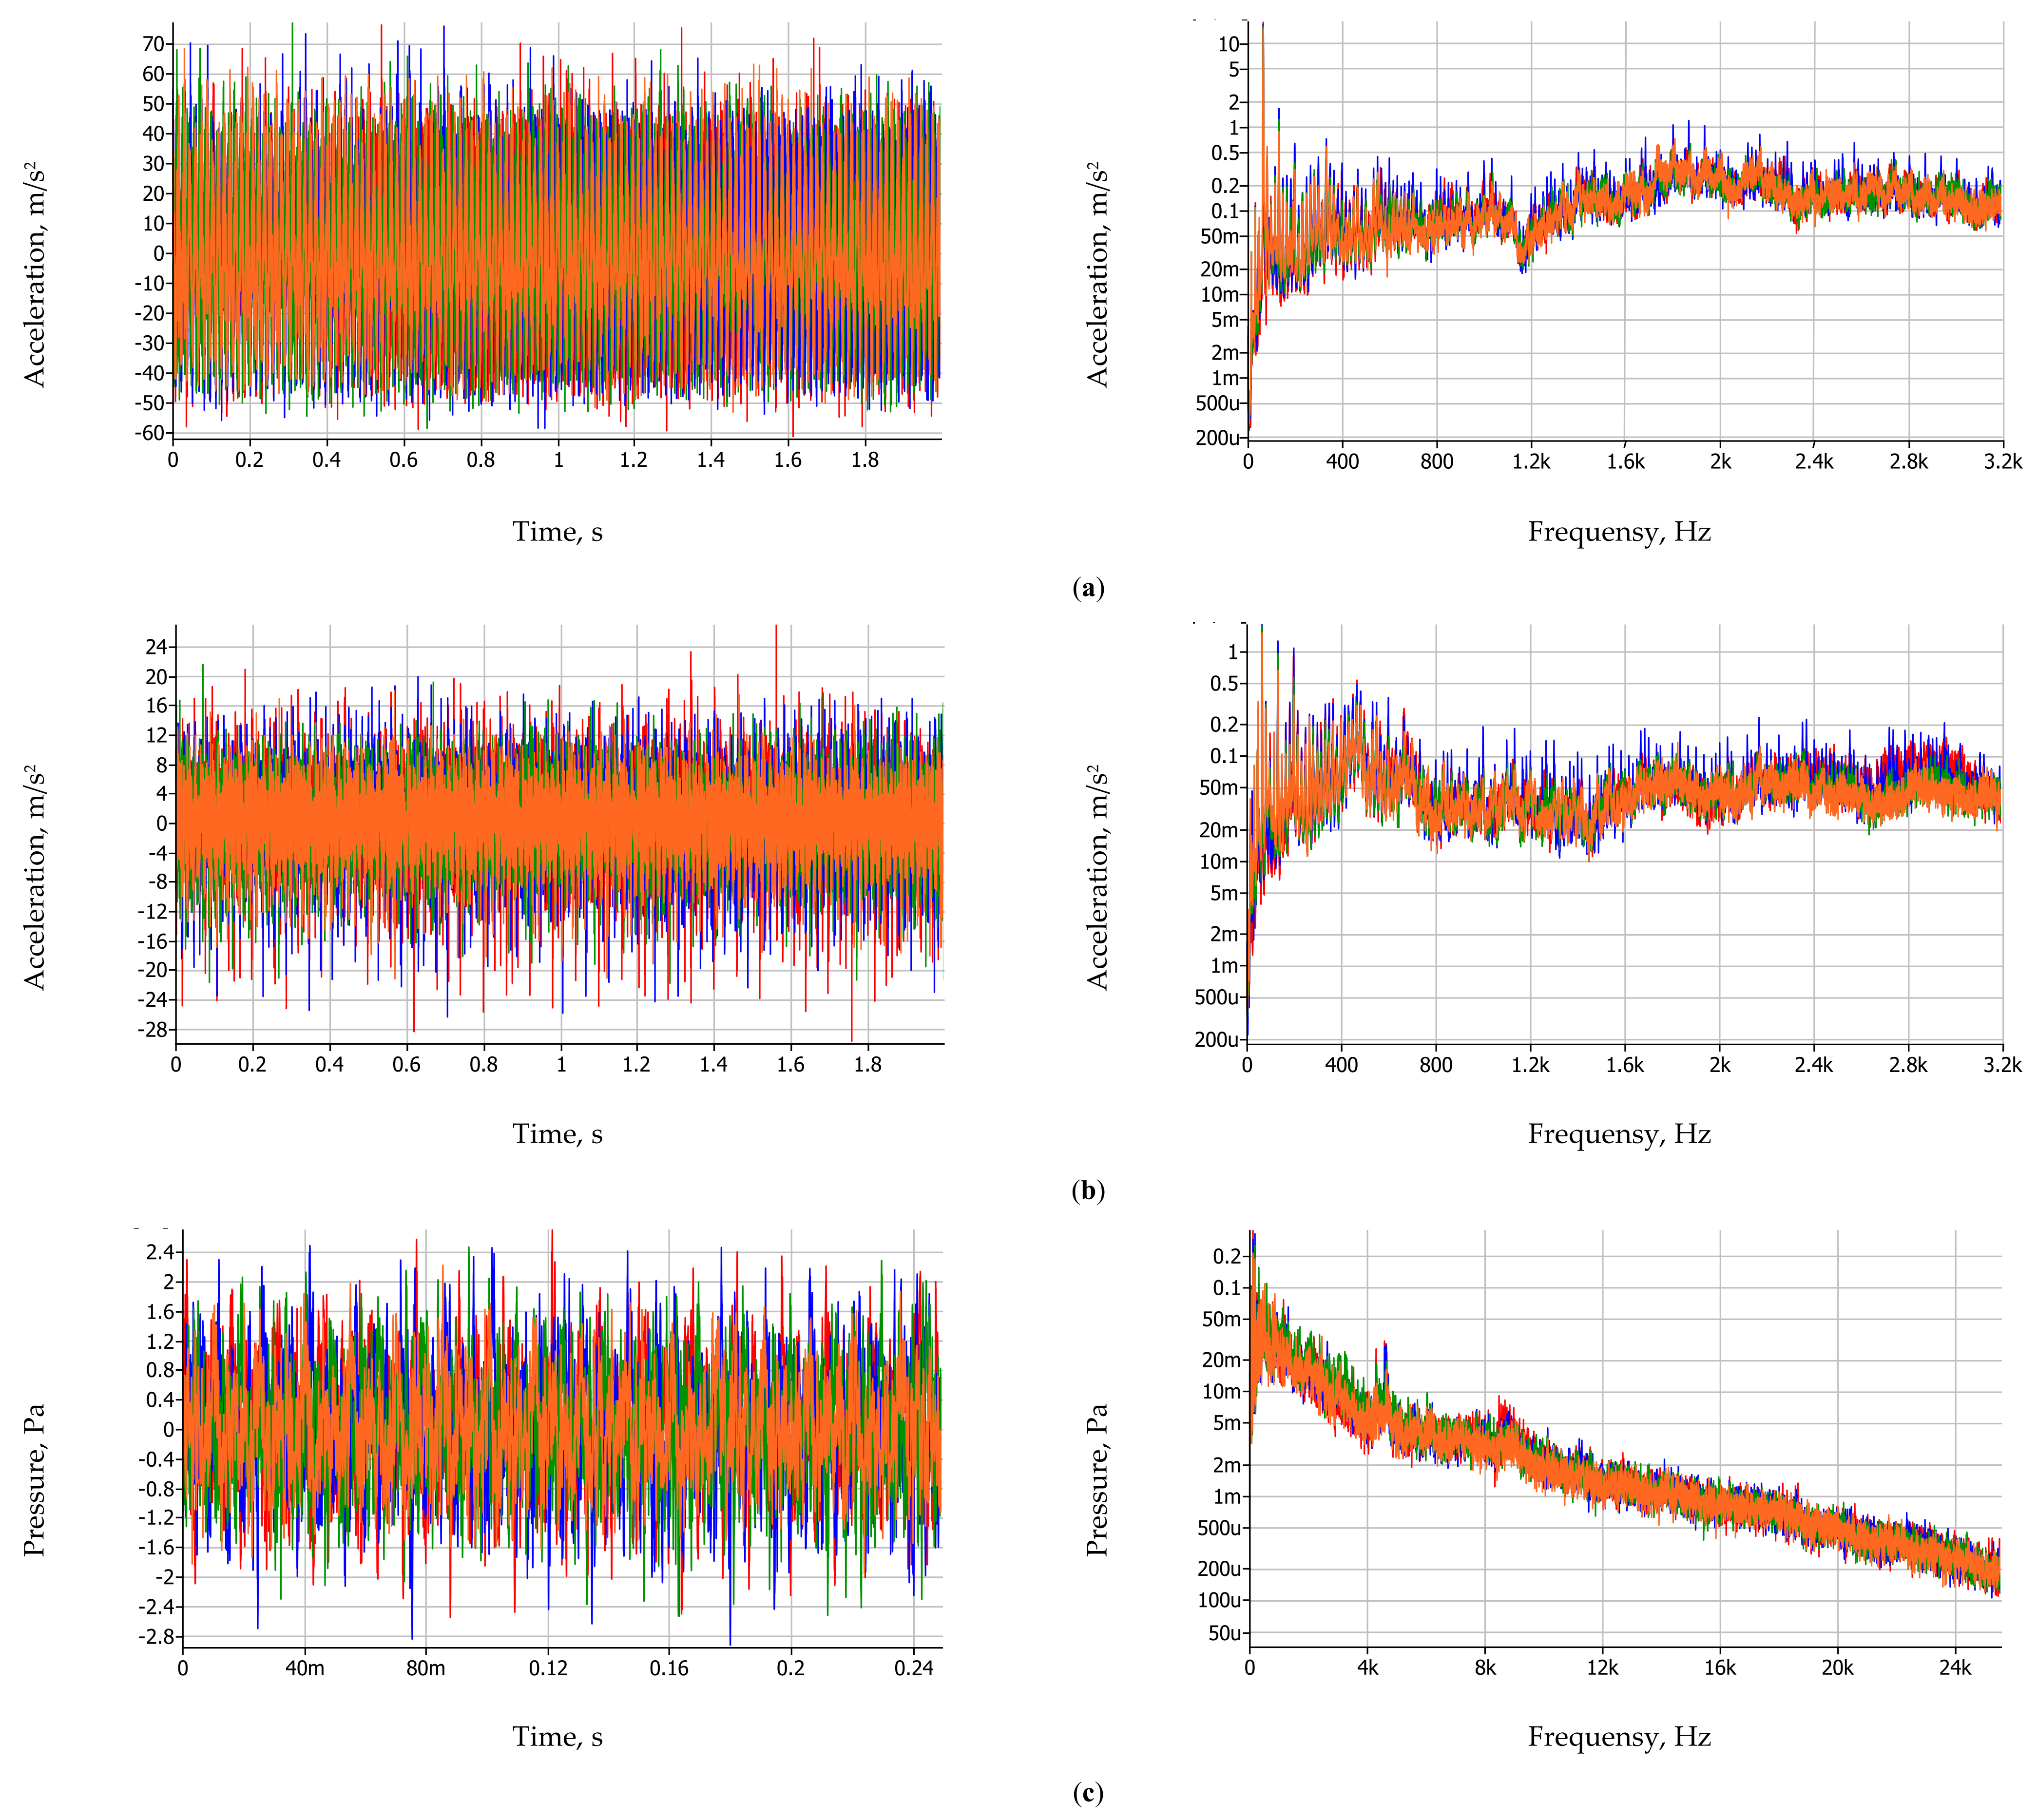
Experimental tests were carried out using an in-line four-cylinder spark ignition engine HR16DE (Table 1) manufactured by Nissan. Fuel mass flow meters, exhaust gas analyzer and SI engine were adapted for biogas. A methane (CH4) injector was added to the engine intake manifold. The engine ECU was replaced with a reprogrammable MoTeC M800 ECU. New engine ECU allowed to adjust spark timing (ST) and the amount of injected biogas. A wideband oxygen sensor Bosch LSU 4.9 was added for monitoring the air and fuel ratio. To maintain a stable engine operating temperature, a plate heat exchanger was added to engine cooling system.
Engine load and crankshaft speed were controlled using the engine load stand AMX200/100, with an accuracy of 0.9 Nm. Intake air mass was measured using a Bosch HFM 5 m with an accuracy of 2%. Composition of biogas recreated using two separate cylinders of CH4 (purity of 99.9995%) and CO2 (purity of 99.995%). Methane was port injected through the injectors marked as 15 (Figure 1) and carbon dioxide was premixed with intake air. Mass flow of gas was measured using two separated Coriolis-type Rheonik RHM 015 mass flowmeters with a measuring range of 0.004–0.6 kg/min and accuracy of ±0.10%. A schematic diagram of the engine test bench and measuring equipment is presented in Figure 1.
The in-cylinder pressure was measured using an AVL ZI31_Y7S pressure sensor (sensitivity 12 pC/bar, measuring range 0–200 bar) integrated in the spark plug. The output of pressure sensor was processed using the AVL DiTEST DPM 800 signal amplifier and recorded with the LabView Real Time module. Two hundred combustion cycles were recorded for each experiment. The composition of exhaust gas was measured directly from engine using the AVL DiCom 4000 exhaust gas analyser. All the parameters are listed in Table 2.
The sound pressure of the working engine was measured using a Gras 46AE free-field microphone (frequency range: 3.15 Hz to 20 kHz; dynamic range: 17 dB(A) to 138 dB; sensitivity: 50 mV/Pa). Engine vibration was measured in longitudinal and transverse directions using two Bruel and Kjear 8341 CCLD accelerometers (frequency range: 0.3–10,000 Hz; sensitivity: 10 mV/ms–2). Figure 2 illustrates the layout of the sound pressure and vibration measuring equipment.
Sound pressure and vibration data were obtained using the Bruel and Kjear machine diagnostics toolbox consisting of a machine diagnostics toolbox type 9727 and the versatile machine diagnostics toolbox software bundle Type 7910. Type 9727 includes the multichannel PULSE data acquisition unit Type 3560-B (5-channel). For each experiment, vibration and sound pressure data were collected from the engine block with the 3.2 kHz (for vibration) and 25.2 kHz (for sound pressure) sampling frequencies for 2 s (for vibration) and 0.24 s (for sound pressure).
Four different compositions of biogas were simulated in the experiment. Biogas composition was simulated after cleaning hydrogen sulfide and other impurities, therefore the simulated biogas consisted of methane and CO2. Methane with 0 vol.% of CO2 was chosen as a baseline for comparison, simulating biogas of the total of four different contents: 0, 20, 40 and 50 vol.% of CO2. In all the experiments, the air–fuel (A/F) ratio was set as stoichiometric, with the engine speed being 2000 rpm and the throttle valve opening at 15%. Two different ST cases were chosen for adjusted spark timing of the engine: in the first case, biogas was used in a compressed natural gas (CNG) engine with optimal ST for CNG. In this case (2000 rpm, throttle 15%), the optimal ST for CNG was 26 crank angle degrees (CAD) ahead of the top dead center (BTDC), and it was constant for all simulated biogas compositions. In the second case, ST was chosen based on the engine’s output (maximum torque generated). The biogas composition used, the lower heat value and ST cases are presented in Table 3.
The BURN feature of the AVL BOOST software was used for the analysis of the data of the experiment to evaluate combustion parameters using collected air and fuel consumption data and the in-cylinder pressure.
Fuel properties. Biogas consists of methane and carbon dioxide. Methane is the main component of biogas, and its concentration in terms of volume varies from 40 to 85% and that of carbon dioxide from 15–60 vol.% [33]. Uncleaned biogas may contain low concentrations of water, hydrogen sulfide, oxygen, carbon monoxide and nitrogen [34]. The concentration of impurities depends on raw materials and conditions of anaerobic digestion [35]. Biogas could be produced from different raw materials and classified as a first-generation alternative fuel (sugarcane, silage maize, energy crops) [36], or the second (food waste, agricultural residue, wood chips, lignocellulosic crops) [37], third (algal biomass) [38] or fourth (algae and other microbes) alternative [39]. Table 4 presents a comparison of properties of biogas consisting of 57 vol.% CH4 and 41 vol.% CO2 and conventional fuel.
Its high autoignition temperature and resistance to impact allows using biogas in engines with an increased compression ratio (CR), while in some studies biogas was used in spark ignition engines with CR of 14. However, the maximum value of brake thermal efficiency and the lowest brake specific fuel consumption were achieved with a CR of 12 [18]. Although high CR results in an increased in-cylinder pressure, temperature and emission of nitrogen oxides [21], the use of biogas which contains CO2 lowers these parameters [44]. Therefore, the possibility to use alternative fuel (1–4 generation depending on raw material) in high CR engines and to reduce NOx emission makes biogas a suitable fuel for SI engines.
Statistical methods. Descriptive statistics for engine parameters, vibration and sound pressure data were calculated. The relationship between the vibration and sound pressure data and the engine parameters was evaluated using Spearman correlation coefficients [45]:
ρ = cov x , y σ x 2 σ y 2   ,
where x and y denote the ranks of x and y , respectively, cov x , y is a covariance between x and y ; and σ x 2 and σ y 2 denote dispersion of x and y , respectively.
A Mann-Whitney U test was used to compare engine parameters, vibration and sound pressure data between different angle size groups. The test can be expressed by the formula [46]:
U = n 1 n 2 + n 1 n 1 + 1 2 T   ,
where n 1 and n 2 denote the sample size of x 1 , x 2 , , x n 1 and y 1 , y 2 , , y n 2 , respectively and T is the sum of the ranks of the y ′s in the ordered sequence of x ′s and y ′s.
Non-parametric statistical methods were used due to a small sample size.

3. Results

In all the experiments, the engine speed was 2000 rpm, the throttle valve was opened 15% and a stoichiometric mixture of air and fuel was determined. The obtained combustion process results were further analyzed using the AVL BOOST software utility BURN. Five ecologic and six energetic parameters were selected from the processed data of engine parameters for further analysis (Table 5).
ROHR was used to determine the correlation between the sound pressure and vibration and the parameters from Table 5. Variation of the remaining parameters depended on ROHR. While ST is optimal for CNG (26 CAD BTDC), the maximum ROHR value declined by 9.9, 36.5 and 43.4% using simulated biogas with 20, 40 and 50 vol.% of CO2 in comparison to methane, respectively. Having adjusted ST, ROHR declined by a mere 8.3, 22.4 and 26.1% with the same biogas composition. Change in ROHR affected the maximum in-cylinder pressure and, with optimal CNG, ST dropped by 9.5, 30.1 and 40.6% while increasing CO2 concentration in biogas. for the mixture-optimal ST resulted in pressure drops of −0.5, 9.3 and 13.1% using simulated biogas with 20, 40 and 50 vol.%, respectively, of CO2 in comparison to methane. A change in the maximum ROHR value also affected other parameters, such as an increase in the maximum in-cylinder pressure or combustion duration (CD). A decrease in the value of these parameters was observed because of the reduced LHV of biogas with higher CO2 concentration, lower combustion intensity and speed (a notable improvement of the value was observed having optimized ST for simulated biogas). The sound pressure and vibration charts illustrate changes in CO2 concentration in BG and changes in ROHR. For a further analysis of ecologic parameters, ROHR should be analyzed per cycle. Figure 3 illustrates the dependence of ROHR on BG composition and ST.
In case of the optimal CNG spark timing [47], ROHR shifts from TDC. This increases the exhaust gas temperature by 0.3, 1.4 and 3.7% while increasing CO2 concentration in biogas, which prolongs combustion duration and increases exhaust loses. With mixture-optimal ST, the maximum ROHR value ranges from TDC to 10 CAD ATDC (intensive heat release is in the lower volume of the cylinder) and NOx concentration increases by 13.5, 26.2 and 16.3% using simulated biogas with 20, 40 and 50 vol.% of CO2 in comparison to NOx concentration with the optimal CNG ST of 26 CAD BTDC.
A change in ROHR affects ecologic and energetic parameters of an internal combustion engine [48], its vibration and sound pressure. Different timings of the maximum ROHR value creates distinct vibration and sound pressure patterns in the engine [49]. This is visible in the sound pressure, vibration acceleration time and spectrum characteristics illustrated in Figure 4 (mixture-optimal ST) and 5 (CNG-optimal ST). To measure the vibrations of the engine block, two measurement points were selected in the longitudinal and transverse directions. Simulated biogas was marked as follows in Figure 4 and Figure 5: red—100CH4, blue—80CH4_20CO2, green—60CH4_40CO2, and orange—50CH4_50CO2.
The analysis of the results in Figure 4 and Figure 5 and Table 6 and Table 7 revealed that the maximum vibration level (estimating the standard deviation (SD)) for all simulated biogas compositions at CNG-optimal ST was 23.137 m/s2 (vibration direction—transverse direction, fuel used—80CH4_20CO2) and 5.375 m/s2 (vibration measurement direction—longitudinal direction, fuel used—100CH4). It was found that by reducing the methane content from 80 to 50% when the ST was CNG optimal, the vibration level in the longitudinal direction decreased from 23.137 to 22.625 m/s2 (comparing the measurement results using 80CH4_20CO2 and 60CH4_40CO2) and the vibration level decreased from 23.137 to 21.404 m/s2 (comparing the measurement results when 80CH4_20CO2 and 50CH4_50CO2 were used). The evaluation of the vibration level in the transverse direction revealed the same tendencies. The reduction of the methane content from 80 to 50% also decreased the vibration level. The assessment of the sound pressure level when the ST was CNG optimal revealed the same trends as when assessing vibrations, and the reduction of the methane content from 80 to 50% also reduced the sound pressure level. The analysis of the vibration levels (estimating the standard deviation) found that when the ST was optimal for mixtures (100CH4 at ST 26; 80CH4_20CO2 at ST 30; 60CH4_40CO2 at ST 35; 50CH4_50CO2 at ST 40), the maximum acceleration values were 23.542 m/s2 (vibration measuring direction—transverse direction, fuel used—80CH4_20CO2) and 5.525 m/s2 (vibration measuring direction—longitudinal direction, fuel used—80CH4_20CO2). It was found that the reduction of the methane content from 80 to 50% when the ST was optimal for mixtures reduced the vibration level from 23.542 to 22.855 m/s2 (comparing the measurement results using 80CH4_20CO2 and 60CH4_40CO2) and the vibration level, respectively decreased from 23.542 to 22.332 m/s2 (comparing the measurement results of fuels 80CH4_20CO2 and 50CH4_50CO2). Accordingly, when evaluating the sound pressure level with STs optimal for mixtures, the opposite tendencies were observed compared to those in the case of CNG-optimal ST, i.e., the reduction of the methane content from 80 to 50% increases the sound pressure level from 0.790 to 0.836 Pa.
Some of the energetic parameters tended to differ between the groups with optimal CNG and ST for mixture, although the level of statistical significance was not reached. Higher maximum in-cylinder pressures and smaller standard deviations were recorded in the group with mixture-optimal ST, which means that at the optimal ST angle and simulated biogas composition had little impact on the maximum in-cylinder pressure. In general, the standard deviation of almost all (except for methane) energetic parameters in the group of mixture-optimal ST was about 2 times lower than in the group of CNG-optimal ST (Table 8).
HC and Tex pollution rates tended to differ in different ST cases the most. Higher HC levels were observed in the group of mixture-optimal ST, with the mean (SD) in the CNG-optimal ST and optimal ST for mixture groups being, 0.009 (0.0007) and 0.011 (0.0018) g/kWh (p = 0.081), respectively. Meanwhile, a higher mean Tex was observed in the CNG-optimal ST group, but no statistically significant difference was found (p = 0.061) (Table 8).
Higher vibration and sound pressure values were observed in the mixture-optimal ST group. Vertical position vibrations were 2.3%, horizontal vibrations were 8.0%, and sound pressure was as much as 11% higher in the mixture-optimal ST group than in the CNG-optimal ST group (Table 8).
The statistical correlation coefficients (presented in Figure 6) of the parameters are presented in Table 9 and Figure 6.
Throughout the sample (n = 8), the vibration data had explicit correlations with the energetic and ecologic parameters. CO and Tex were the only two ecologic parameters that had a negative moderate correlation with vibration data, while all other studied parameters had strong or very strong correlations. Sound pressure correlated only with Tex (rho = −0.833, p = 0.010). HC was the only indicator which correlated neither with the vibration data nor with the sound pressure (Table 9, Figure 6).
A correlation analysis of the groups of CNG-optimal ST and mixture-optimal ST showed very strong correlations of the parameters with the vibration data in the horizontal direction. CO and HC had weak correlations with horizontal vibrations, while other parameters had an absolute correlation (rho = ±1.000, p < 0.001) (Table 9, Figure 6). In the group of mixture-optimal ST, a higher correlation of sound pressure with the energetic and ecologic parameters appeared. The energetic parameters of methane, BTE and ROHRmax had a negative correlation with sound pressure (rho = −1.000, p < 0.001). The CO ecologic parameter was the only one which did not correlate with the sound pressure, and the parameters CO2, HC, NOx, and Tex had an absolute correlation (rho = ±1.000, p < 0.001) (Table 9, Figure 6).

4. Conclusions

The analysis of the statistical comparison of engine parameters via vibration and sound did not reveal statistically significant differences in the groups of CNG-optimal ST and mixture-optimal ST. Although the means of some parameters tended to differ more in different ST cases, a small sample did not allow achieving a statistical significance.
Standard deviations of the studied parameters were significantly higher in case of CNG-optimal ST. The ratio of the mean and the standard deviation in the CNG-optimal ST and mixture-optimal ST were 11.7 and 22.3, respectively, which means that the standard deviation of the engine parameters was nearly twice as small than in the case of the CNG-optimal ST. This justifies the importance of ST regulation and the stability of engine parameters when replacing the standard CNG fuel with BG.
The correlation analysis of the vibration data and the energetic and ecologic parameters showed that there was a moderate or strong correlation between these parameters. The correlations between vibration and engine parameters were positive, i.e., as the numerical values of the engine parameters increased, the vibration requirements also increased. The opposite phenomenon, with the exception of NOx, was observed in the correlation of ecologic parameters, i.e., as pollution emissions decreases, vibrations tend to acquire higher values.
Additional correlation analysis of sound pressure, energetic and ecologic parameters showed predominantly weak correlations. However, using different ratios of CH4 and CO2 and the optimal ST led to a negative correlation between sound pressure and NOx, although the correlation between vibrations and NOx was positive. This means that an earlier and more intense combustion leads to a higher combustion temperature and pressure (increased vibration), which results in higher NOx emissions, therefore combustion ends earlier and the exhaust energy (sound pressure) decreases. Similarly, sound pressure negatively correlates with ROHR Max, Max pressure, and BTE, meaning that as the sound pressure decreases, engine performance increases.

Author Contributions

Conceptualization, D.K., A.K. and A.R.; methodology, D.K., T.Ž., A.K., J.M. and A.R.; software, T.Ž. and D.V.; validation, K.K., A.R. and J.M.; formal analysis, D.V. and T.Ž.; investigation, D.K., A.R. and A.K.; resources, K.K. and D.V.; data curation, J.M.; writing—original draft preparation, D.K., T.Ž., A.K. and A.R.; writing—review and editing, K.K., J.M., D.K. and D.V.; visualization, D.K. and T.Ž.; supervision, A.K. and J.M.; project administration, J.M.; funding acquisition, A.K. and J.M. All authors have read and agreed to the published version of the manuscript.

Funding

This research received no external funding.

Institutional Review Board Statement

Not applicable.

Informed Consent Statement

Not applicable.

Data Availability Statement

Not applicable.

Acknowledgments

The authors thank the AVL company for the opportunity to use the engine simulation tool AVL BOOST, which was used to analyze the combustion process and present the results. A cooperation agreement has been concluded between the faculty of the Transport Engineering of Vilnius Gediminas Technical University and AVL Advanced Simulation Technologies.

Conflicts of Interest

The authors declare no conflict of interest.

References

  1. Kallas, S. White Paper on Transport: Roadmap to a Single European Transport Area—Towards a Competitive and Resource-Efficient Transport System; European Commission, Ed.; Publications Office of the European Union: Luxembourg, 2011; ISBN 978-92-79-18270-9. [Google Scholar]
  2. Fuc, P.; Lijewski, P.; Ziolkowski, A.; Dobrzynski, M. Dynamic Test Bed Analysis of Gas Energy Balance for a Diesel Exhaust System Fit with a Thermoelectric Generator. J. Electron. Mater. 2017, 46, 3145–3155. [Google Scholar] [CrossRef]
  3. Kończak, M.; Kukla, M.; Warguła, Ł.; Talaśka, K. Determination of the Vibration Emission Level for a Chipper with Combustion Engine. In IOP Conference Series: Materials Science and Engineering; IOP Publishing: Bristol, UK, 2020; Volume 776, p. 012007. [Google Scholar] [CrossRef] [Green Version]
  4. Bereczky, A. The Past, Present and Future of the Training of Internal Combustion Engines at the Department of Energy Engineering of BME. In Vehicle and Automotive Engineering; Jarmai, K., Bollo, B., Eds.; Springer: Cham, Switzerland, 2017; pp. 225–234. [Google Scholar]
  5. Hunicz, J.; Mikulski, M.; Koszałka, G.; Ignaciuk, P. Detailed Analysis of Combustion Stability in a Spark-Assisted Compression Ignition Engine under Nearly Stoichiometric and Heavy EGR Conditions. Appl. Energy 2020, 280, 115955. [Google Scholar] [CrossRef]
  6. Sarkan, B.; Stopka, O.; Gnap, J.; Caban, J. Investigation of Exhaust Emissions of Vehicles with the Spark Ignition Engine within Emission Control. Procedia Eng. 2017, 187, 775–782. [Google Scholar] [CrossRef]
  7. Bazooyar, B.; Gohari Darabkhani, H. The Design Strategy and Testing of an Efficient Microgas Turbine Combustor for Biogas Fuel. Fuel 2021, 294, 120535. [Google Scholar] [CrossRef]
  8. Ivanchenko, A.; Yelatontsev, D.; Savenkov, A. Anaerobic Co-Digestion of Agro-Industrial Waste with Cheese Whey: Impact of Centrifuge Comminution on Biogas Release and Digestate Agrochemical Properties. Biomass Bioenergy 2021, 147, 106010. [Google Scholar] [CrossRef]
  9. Rasapoor, M.; Young, B.; Brar, R.; Baroutian, S. Improving Biogas Generation from Aged Landfill Waste Using Moisture Adjustment and Neutral Red Additive—Case Study: Hampton Downs’s Landfill Site. Energy Convers. Manag. 2020, 216, 112947. [Google Scholar] [CrossRef]
  10. Zeng, W.; Wang, D.; Wu, Z.; He, L.; Luo, Z.; Yang, J. Recovery of Nitrogen and Phosphorus Fertilizer from Pig Farm Biogas Slurry and Incinerated Chicken Manure Fly Ash. Sci. Total Environ. 2021, 782, 146856. [Google Scholar] [CrossRef]
  11. Feroskhan, M.; Ismail, S.; Panchal, S.H. Study of Methane Enrichment in a Biogas Fuelled HCCI Engine. Int. J. Hydrogen Energy 2021. [Google Scholar] [CrossRef]
  12. Park, J.; Choi, J. A Numerical Investigation of Lean Operation Characteristics of Spark Ignition Gas Engine Fueled with Biogas and Added Hydrogen under Various Boost Pressures. Appl. Therm. Eng. 2017, 117, 225–234. [Google Scholar] [CrossRef]
  13. Nadaleti, W.C.; Przybyla, G. Emissions and Performance of a Spark-Ignition Gas Engine Generator Operating with Hydrogen-Rich Syngas, Methane and Biogas Blends for Application in Southern Brazilian Rice Industries. Energy 2018, 154, 38–51. [Google Scholar] [CrossRef]
  14. Piechota, G. Biogas/Biomethane Quality and Requirements for Combined Heat and Power (CHP) Units/Gas Grids with a Special Focus on Siloxanes—A Short Review. Sustain. Chem. Eng. 2021, 3, 1–10. [Google Scholar] [CrossRef]
  15. Kougias, P.G.; Treu, L.; Benavente, D.P.; Boe, K.; Campanaro, S.; Angelidaki, I. Ex-Situ Biogas Upgrading and Enhancement in Different Reactor Systems. Bioresour. Technol. 2017, 225, 429–437. [Google Scholar] [CrossRef]
  16. Makaruk, A.; Miltner, M.; Harasek, M. Membrane Biogas Upgrading Processes for the Production of Natural Gas Substitute. Sep. Purif. Technol. 2010, 74, 83–92. [Google Scholar] [CrossRef]
  17. Hotta, S.K.; Sahoo, N.; Mohanty, K. Comparative Assessment of a Spark Ignition Engine Fueled with Gasoline and Raw Biogas. Renew. Energy 2019, 134, 1307–1319. [Google Scholar] [CrossRef]
  18. Hotta, S.K.; Sahoo, N.; Mohanty, K.; Kulkarni, V. Ignition Timing and Compression Ratio as Effective Means for the Improvement in the Operating Characteristics of a Biogas Fueled Spark Ignition Engine. Renew. Energy 2020, 150, 854–867. [Google Scholar] [CrossRef]
  19. Gómez Montoya, J.P.; Amell, A.A.; Olsen, D.B.; Amador Diaz, G.J. Strategies to Improve the Performance of a Spark Ignition Engine Using Fuel Blends of Biogas with Natural Gas, Propane and Hydrogen. Int. J. Hydrogen Energy 2018, 43, 21592–21602. [Google Scholar] [CrossRef]
  20. Da Costa, R.B.R.; Valle, R.M.; Hernández, J.J.; Malaquias, A.C.T.; Coronado, C.J.R.; Pujatti, F.J.P. Experimental Investigation on the Potential of Biogas/Ethanol Dual-Fuel Spark-Ignition Engine for Power Generation: Combustion, Performance and Pollutant Emission Analysis. Appl. Energy 2020, 261, 114438. [Google Scholar] [CrossRef]
  21. Porpatham, E.; Ramesh, A.; Nagalingam, B. Experimental Studies on the Effects of Enhancing the Concentration of Oxygen in the Inducted Charge of a Biogas Fuelled Spark Ignition Engine. Energy 2018, 142, 303–312. [Google Scholar] [CrossRef]
  22. Zhang, Y.; Zhu, M.; Zhang, Z.; Chan, Y.L.; Zhang, D. Combustion and Emission Characteristics of Simulated Biogas from Two-Phase Anaerobic Digestion (T-PAD) in a Spark Ignition Engine. Appl. Therm. Eng. 2018, 129, 927–933. [Google Scholar] [CrossRef]
  23. Karagöz, M.; Sarıdemir, S.; Deniz, E.; Çiftçi, B. The Effect of the CO2 Ratio in Biogas on the Vibration and Performance of a Spark Ignited Engine. Fuel 2018, 214, 634–639. [Google Scholar] [CrossRef]
  24. Kilikevičius, A.; Kilikevičienė, K.; Fursenko, A.; Matijošius, J. The Analysis of Vibration Signals of Critical Points of the Bus Body Frame. Period. Polytech. Transp. Eng. 2020, 48, 296–304. [Google Scholar] [CrossRef] [Green Version]
  25. Kilikevičienė, K.; Kačianauskas, R.; Kilikevičius, A.; Maknickas, A.; Matijošius, J.; Rimkus, A.; Vainorius, D. Experimental Investigation of Acoustic Agglomeration of Diesel Engine Exhaust Particles Using New Created Acoustic Chamber. Powder Technol. 2020, 360, 421–429. [Google Scholar] [CrossRef]
  26. Kilikevičius, A.; Skeivalas, J.; Kilikevičienė, K.; Matijošius, J. Analysis of Dynamic Parameters of a Railway Bridge. Appl. Sci. 2019, 9, 2545. [Google Scholar] [CrossRef] [Green Version]
  27. Feroskhan, M.; Thangavel, V.; Subramanian, B.; Sankaralingam, R.K.; Ismail, S.; Chaudhary, A. Effects of Operating Parameters on the Performance, Emission and Combustion Indices of a Biogas Fuelled HCCI Engine. Fuel 2021, 298, 120799. [Google Scholar] [CrossRef]
  28. Mahla, S.K.; Safieddin Ardebili, S.M.; Sharma, H.; Dhir, A.; Goga, G.; Solmaz, H. Determination and Utilization of Optimal Diesel/n-Butanol/Biogas Derivation for Small Utility Dual Fuel Diesel Engine. Fuel 2021, 289, 119913. [Google Scholar] [CrossRef]
  29. De Faria, M.M.N.; Vargas Machuca Bueno, J.P.; Ayad, S.M.M.E.; Belchior, C.R.P. Thermodynamic Simulation Model for Predicting the Performance of Spark Ignition Engines Using Biogas as Fuel. Energy Convers. Manag. 2017, 149, 1096–1108. [Google Scholar] [CrossRef]
  30. Balki, M.K.; Erdoğan, S.; Aydın, S.; Sayin, C. The Optimization of Engine Operating Parameters via SWARA and ARAS Hybrid Method in a Small SI Engine Using Alternative Fuels. J. Clean. Prod. 2020, 258, 120685. [Google Scholar] [CrossRef]
  31. Erdoğan, S.; Aydın, S.; Balki, M.K.; Sayin, C. Operational Evaluation of Thermal Barrier Coated Diesel Engine Fueled with Biodiesel/Diesel Blend by Using MCDM Method Base on Engine Performance, Emission and Combustion Characteristics. Renew. Energy 2020, 151, 698–706. [Google Scholar] [CrossRef]
  32. Zavadskas, E.K.; Čereška, A.; Matijošius, J.; Rimkus, A.; Bausys, R. Internal Combustion Engine Analysis of Energy Ecological Parameters by Neutrosophic MULTIMOORA and SWARA Methods. Energies 2019, 12, 1415. [Google Scholar] [CrossRef] [Green Version]
  33. Yousef, S.; Šereika, J.; Tonkonogovas, A.; Hashem, T.; Mohamed, A. CO2/CH4, CO2/N2 and CO2/H2 Selectivity Performance of PES Membranes under High Pressure and Temperature for Biogas Upgrading Systems. Environ. Technol. Innov. 2021, 21, 101339. [Google Scholar] [CrossRef]
  34. Andriani, D.; Wresta, A.; Atmaja, T.D.; Saepudin, A. A Review on Optimization Production and Upgrading Biogas through CO2 Removal Using Various Techniques. Appl. Biochem. Biotechnol. 2014, 172, 1909–1928. [Google Scholar] [CrossRef] [PubMed]
  35. Fuksa, P.; Hakl, J.; Míchal, P.; Hrevušová, Z.; Šantrůček, J.; Tlustoš, P. Effect of Silage Maize Plant Density and Plant Parts on Biogas Production and Composition. Biomass Bioenergy 2020, 142, 105770. [Google Scholar] [CrossRef]
  36. Banja, M.; Jégard, M.; Motola, V.; Sikkema, R. Support for Biogas in the EU Electricity Sector–A Comparative Analysis. Biomass Bioenergy 2019, 128, 105313. [Google Scholar] [CrossRef]
  37. Dahman, Y.; Dignan, C.; Fiayaz, A.; Chaudhry, A. 13-An introduction to biofuels, foods, livestock, and the environment. In Biomass, Biopolymer-Based Materials, and Bioenergy, Woodhead Publishing Series in Composites Science and Engineering; Verma, D., Fortunati, E., Jain, S., Zhang, X., Eds.; Woodhead Publishing: Sawston, UK, 2019; pp. 241–276. ISBN 978-0-08-102426-3. [Google Scholar]
  38. Dębowski, M.; Zieliński, M.; Grala, A.; Dudek, M. Algae Biomass as an Alternative Substrate in Biogas Production Technologies—Review. Renew. Sustain. Energy Rev. 2013, 27, 596–604. [Google Scholar] [CrossRef]
  39. Dutta, K.; Daverey, A.; Lin, J.-G. Evolution Retrospective for Alternative Fuels: First to Fourth Generation. Renew. Energy 2014, 69, 114–122. [Google Scholar] [CrossRef]
  40. Khatri, N.; Khatri, K.K. Hydrogen Enrichment on Diesel Engine with Biogas in Dual Fuel Mode. Int. J. Hydrogen Energy 2020, 45, 7128–7140. [Google Scholar] [CrossRef]
  41. Rimkus, A.; Stravinskas, S.; Matijošius, J. Comparative Study on the Energetic and Ecologic Parameters of Dual Fuels (Diesel–NG and HVO–Biogas) and Conventional Diesel Fuel in a CI Engine. Appl. Sci. 2020, 10, 359. [Google Scholar] [CrossRef] [Green Version]
  42. Xu, Y.; Zhang, Y.; Gong, J.; Su, S.; Wei, Z. Combustion Behaviours and Emission Characteristics of a Retrofitted NG/Gasoline Duel-Fuel SI Engine with Various Proportions of NG-Gasoline Blends. Fuel 2020, 266, 116957. [Google Scholar] [CrossRef]
  43. Chiong, M.-C.; Valera-Medina, A.; Chong, W.W.F.; Chong, C.T.; Mong, G.R.; Mohd Jaafar, M.N. Effects of Swirler Vane Angle on Palm Biodiesel/Natural Gas Combustion in Swirl-Stabilised Gas Turbine Combustor. Fuel 2020, 277, 118213. [Google Scholar] [CrossRef]
  44. Fischer, M.; Jiang, X. An Investigation of the Chemical Kinetics of Biogas Combustion. Fuel 2015, 150, 711–720. [Google Scholar] [CrossRef]
  45. Spearman, C. The Proof and Measurement of Association between Two Things. Am. J. Psychol. 1904, 15, 72. [Google Scholar] [CrossRef]
  46. Mann, H.B.; Whitney, D.R. On a Test of Whether One of Two Random Variables Is Stochastically Larger than the Other. Ann. Math. Stat. 1947, 18, 50–60. [Google Scholar] [CrossRef]
  47. Kukharonak, H.; Ivashko, V.; Pukalskas, S.; Rimkus, A.; Matijošius, J. Operation of a Spark-Ignition Engine on Mixtures of Petrol and N-Butanol. Procedia Eng. 2017, 187, 588–598. [Google Scholar] [CrossRef]
  48. Gutarevych, Y.; Shuba, Y.; Matijošius, J.; Karev, S.; Sokolovskij, E.; Rimkus, A. Intensification of the Combustion Process in a Gasoline Engine by Adding a Hydrogen-Containing Gas. Int. J. Hydrogen Energy 2018, 43, 16334–16343. [Google Scholar] [CrossRef]
  49. Gutarevych, Y.; Mateichyk, V.; Matijošius, J.; Rimkus, A.; Gritsuk, I.; Syrota, O.; Shuba, Y. Improving Fuel Economy of Spark Ignition Engines Applying the Combined Method of Power Regulation. Energies 2020, 13, 1076. [Google Scholar] [CrossRef] [Green Version]
Figure 1. Experimental setup. 1—HR16DE SI engine; 2—connecting shaft; 3—engine load stand; 4—load stand ECU and display; 5—crankshaft position sensor; 6—spark plug with pressure sensor; 7—in-cylinder pressure recording equipment; 8—exhaust gas temperature sensor; 9—exhaust gas temperature display; 10—wideband oxygen sensor; 11—reprogrammable engine ECU; 12—exhaust gas analyzer; 13—air mass flow meter; 14—throttle control servo motor; 15—CH4 injector; 16—low pressure regulator; 17—high pressure regulator; 18—fuel mass flow meter for CH4; 19—CH4 cylinder; 20—high pressure regulator; 21—fuel mass flow meter for CO2; 22—CO2 cylinder; 23—accelerometer for longitudinal direction; 24—accelerometer for transverse direction; 25—microphone; 26—Bruel and Kjear machine diagnostics toolbox.
Energies 14 07037 g001
Figure 2. Sound pressure and vibration measuring equipment layout. 1—Gras 46AE free-field microphone; 2—accelerometer for transverse direction measurements; 3—accelerometer for longitudinal direction measurements.
Energies 14 07037 g002
Figure 3. ROHR in the cylinder depending on simulated BG composition and ST. (A)—with optimal ST for mixture; (B)—with optimal CNG ST.
Energies 14 07037 g003
Figure 4. Results of vibrations and sound pressure at optimal ST for mixture. Fuel mixtures marked in: red—100CH4, blue—80CH4_20CO2, green—60CH4_40CO2, orange—50CH4_50CO2. (a)—Vibration acceleration time and spectrum characteristic in the vertical direction, (b)—Vibration acceleration time and spectrum characteristic in the longitudinal direction, (c)—sound pressure and spectrum characteristics.
Energies 14 07037 g004
Figure 5. Results of vibrations and sound pressure at CNG optimal ST. Fuel mixtures marked in: red—100CH4, blue—80CH4_20CO2, green—60CH4_40CO2, orange—50CH4_50CO2. (a)—Vibration acceleration time and spectrum characteristic in the vertical direction, (b)—vibration acceleration time and spectrum characteristic in the longitudinal direction, (c)—sound pressure and spectrum characteristics.
Energies 14 07037 g005
Figure 6. Vibration and sound pressure correlation to engine parameters. (a)—Ecologic parameters when CNG is optimal for ST; (b)—ecologic parameters when ST is optimal for mixture; (c)—energy parameter when CNH is optimal for ST; (d)—energy parameter when ST is optimal for mixture.
Energies 14 07037 g006
Table 1. Technical characteristics of SI engine HR16DE.
ParameterValue
Number of cylinders4
Displacement, dm 31.598
Cylinder bore, mm78.0
Piston stroke, mm86.6
Engine power, kW (at rpm)84 (6000)
Engine torque, Nm (at rpm)156 (4400)
Compression ratio10.7
Intake valves open (CAD BTDC 1) 24
Intake valves close (CAD ABDC 2)72
Exhaust valves open CAD BBDC 3)24
Exhaust valves close (CAD ATDC 4)10
1 Crank angle degrees ahead of the top dead center. 2 Crank angle degrees behind the bottom dead center. 3 Crank angle degrees ahead of the bottom dead center. 4 Crank angle degrees behind the top dead center.
Table 2. AVL DICOM 4000 measurement range and accuracy.
ParameterMeasuring RangeAccuracy
NOx0~5000 ppm, by vol.±1 ppm
CO0~10%, by vol.±0.01%
CO20~20%, by vol.±0.1%
HC0~20,000 ppm, by vol.±1 ppm
O20~25%, by vol.±0.01%
Table 3. Simulated biogas properties and ST cases.
CH4, vol.%CO2, vol.%LHV, MJ/kgStoichiometric A/F RatioMarkingST, CAD BTDC
CNG OptimalOptimal for Mixture
100050.0417.2100CH42626
802029.6910.280CH4_20CO22630
604017.696.160CH4_40CO22635
505013.374.650CH4_50CO22640
Table 4. Biogas properties comparison.
ParameterBiogas [23,40,41]Petrol [42]Natural Gas [43]
CompositionCH4—57 vol.%C5H12—C12H26C14H30—C18H38
CO2—41 vol.%
N2—1 vol.%
O2—0.6 vol.%
CO—0.18 vol.%
H2—0.18 vol.%
H2S—0~130 ppm
Flammability limit, vol.% in air7.5—14.01.4–7.65.0–14.3
Density, kg/m31.26870.79
Calorific value, MJ/kg17.044.450.0
Laminar burning velocity, m/s0.250.39–0.470.34
Methane number142-100
Autoignition temperature, °C650228–471537
Stoichiometric air fuel ratio, kg/kg5.814.717.3
Table 5. Selected parameters and their values.
Parameter100CH480CH4_20CO260CH4_40CO250CH4_50CO2
CNG OptimalOptimal for MixtureCNG OptimalOptimal for MixtureCNG OptimalOptimal for MixtureCNG OptimalOptimal for Mixture
NOx 1, g/kWh1.411.410.971.160.190.560.090.32
CO 2, g/kWh19.919.917.417.919.817.930.8120.2
CO2 3, g/kWh641.7641.7801.2808.11215.51113.71548.71310.7
HC 4, g/kWh0.009680.009680.008880.010330.008740.011300.010200.01387
Tex 5, °C655655657650664645679640
CH4 6, vol.%100100808060605050
BTE7, %35.5435.5435.2635.3332.3834.3829.1833.77
Pmax8, MPa3.893.893.523.912.723.532.313.38
ROHRmax9, J/deg29.5129.5126.5827.0718.7422.3616.6921.81
Prisemax10, bar/deg1.511.511.101.500.601.200.341.10
CD11, deg53.053.055.956.577.865.478.564.7
1 Nitrogen oxide concentration. 2 Carbon monoxide concentration. 3 Carbon dioxide concentration. 4 Hydrocarbon concentration. 5 Exhaust gas temperature. 6 Methane concentration in biogas. 7 Brake thermal efficiency. 8 Maximum in-cylinder pressure. 9 Maximum rate of heat release. 10 Maximum in-cylinder pressure rise. 11 Combustion duration.
Table 6. Biogas properties and ST cases.
BiogasSTAcceleration, m/s2Sound Pressure, Pa
Transverse DirectionLongitudinal Direction
SDMinMaxSDMinMaxSDMinMax
100CH42622.963−62.05479.5525.375−27.71326.9760.784−2.5572.694
80CH4_20CO23023.542−67.19582.4135.525−30.05422.4560.790−2.5272.990
60CH4_40CO23522.855−57.72372.9575.173−22.97519.9530.832−3.3362.684
50CH4_50CO24022.332−62.32276.9294.953−23.99321.8500.836−2.6103.163
Table 7. Biogas properties and ST cases.
BiogasSTAcceleration, m/s2Sound Pressure, Pa
Transverse DirectionLongitudinal Direction
SDMinMaxSDMinMaxSDMinMax
100CH42622.963−62.05479.5525.375−27.71326.9760.784−2.5572.694
80CH4_20CO22623.137−58.57875.8155.197−26.38019.8780.800−2.9562.482
60CH4_40CO22622.625−58.62377.0564.592−21.80121.5350.722−2.5362.462
50CH4_50CO22621.404−53.26168.3254.247−21.18717.9630.613−1.9692.216
Table 8. Comparison of vibration, sound pressure and emission parameters between angles (constant and optimal).
ParametersCNG Optimal ST
Mean (SD)
Optimal ST for Mixture
Mean (SD)
p-Value
Methane, vol.%66.7 (8.37)69.8 (4.52)0.665
BTE, %33 (0.03)35 (0.008)0.561
Max pressure in cilinder, bar3.1 (0.72)3.7 (0.26)0.245
ROHR max, J/deg23 (6.28)25.2 (3.72)0.665
Max pressure gain, bar/deg0.9 (0.52)1.3 (0.19)0.384
CD66.2 (13.9)59.9 (6.12)0.885
CO, g/kWh21.95 (6.009)18.97 (1.268)1.000
CO2, g/kWh1052 (410.2)969 (300.4)1.000
HC, g/kWh0.009 (0.0007)0.011 (0.0018)0.081
NOx, g/kWh0.67 (0.635)0.86 (0.511)0.561
Tex, °C663.7 (10.75)647.5 (6.54)0.061
Vertical direction22.46 (0.723)22.97 (0.512)0.312
Horizontal direction4.87 (0.547)5.26 (0.248)0.470
Sound pressure, Pa0.73 (0.087)0.81 (0.034)0.312
Table 9. Comparison of vibration, sound pressure and emission parameters correlation.
ParametersVertical Direction
( ρ , p-Value)
Horizontal Direction
( ρ , p-Value)
Sound Pressure, Pa
( ρ , p-Value)
CN-optimal ST and mixture-optimal ST
Methane, vol.%0.732, p = 0.0390.830, p = 0.011−0.049, p = 0.909
BTE, %0.755, p = 0.0310.922, p = 0.0010.216, p = 0.608
Max pressure in cylinder, bar0.850, p = 0.0070.970, p < 0.0010.240, p = 0.568
ROHR max, J/deg0.714, p = 0.0470.929, p = 0.0010.238, p = 0.570
Max pressure increase, bar/deg0.671, p = 0.0690.934, p = 0.0010.311, p = 0.453
CD−0.595, p = 0.120−0.833, p = 0.010−0.310, p = 0.456
CO, g/kWh−0.659, p = 0.076−0.395, p = 0.333−0.335, p = 0.417
CO2, g/kWh−0.731, p = 0.040−0.826, p = 0.011−0.120, p = 0.778
HC, g/kWh−0.108, p = 0.7990.012, p = 0.9780.527, p = 0.180
NOx, g/kWh0.755, p = 0.0310.922, p = 0.0010.216, p = 0.608
Tex, °C−0.238, p = 0.570−0.405, p = 0.320−0.833, p = 0.010
CNG-optimal ST
Methane, vol.%0.800, p = 0.2001.000, p < 0.0010.800, p = 0.200
BTE, %0.800, p = 0.2001.000, p < 0.0010.800, p = 0.200
Max pressure in cylinder, bar0.800, p = 0.2001.000, p < 0.0010.800, p = 0.200
ROHR max, J/deg0.800, p = 0.2001.000, p < 0.0010.800, p = 0.200
Max pressure increase, bar/deg0.800, p = 0.2001.000, p < 0.0010.800, p = 0.200
CD−0.800, p = 0.200−1.000, p < 0.001−0.800, p = 0.200
CO, g/kWh−0.800, p = 0.200−0.400, p = 0.600−0.800, p = 0.200
CO2, g/kWh−0.800, p = 0.200−1.000, p < 0.001−0.800, p = 0.200
HC, g/kWh−0.400, p = 0.600−0.200, p = 0.800−0.400, p = 0.600
NOx, g/kWh0.800, p = 0.2001.000, p < 0.0010.800, p = 0.200
Tex, °C−0.800, p = 0.200−1.000, p < 0.001−0.800, p = 0.200
Mixture-optimal ST
Methane, vol.%0.800, p = 0.2000.800, p = 0.200−1.000, p < 0.001
BTE, %0.800, p = 0.2000.800, p = 0.200−1.000, p < 0.001
Max pressure in cylinder, bar1.000, p < 0.0011.000, p < 0.001−0.800, p = 0.200
ROHR max, J/deg0.800, p = 0.2000.800, p = 0.200−1.000, p < 0.001
Max pressure increase, bar/deg1.000, p < 0.0011.000, p < 0.001−0.800, p = 0.200
CD−0.600, p = 0.400−0.600, p = 0.4000.800, p = 0.200
CO, g/kWh−0.400, p = 0.600−0.400, p = 0.6000.200, p = 0.800
CO2, g/kWh−0.800, p = 0.200−0.800, p = 0.2001.000, p < 0.001
HC, g/kWh−0.800, p = 0.200−0.800, p = 0.2001.000, p < 0.001
NOx, g/kWh0.800, p = 0.2000.800, p = 0.200−1.000, p < 0.001
Tex, °C0.800, p = 0.2000.800, p = 0.200−1.000, p < 0.001
Publisher’s Note: MDPI stays neutral with regard to jurisdictional claims in published maps and institutional affiliations.

