1. Introduction
Double-fed wind turbine main transmission systems are mainly composed of a hub, main shaft, bearings, gearbox, and couplings. They not only provide a transmission channel for energy but also a transmission path for the unit load. Under long-term operation in harsh working environments, such as extreme climatic conditions, which involve a wide range of working speeds and a wide excitation band, time-varying wind loads often cause oscillation in wind turbine towers, which are somewhat flexible. Then, the inertial forces of the components of the transmission system may combine with the system’s pneumatic load and increase the degree of force fluctuations in the components, leading to increased failure rates. Failures of the main transmission system account for 40–60% of wind turbine downtime [
1]. One of the causes of abnormal transmission system conditions is that the real-time dynamic loads and the dynamic behaviour of the transmission system under diverse working conditions remain unclear. The operating environments of the main transmission system are usually complex and harsh. Different wind speeds, wind directions, and rotor speeds have different effects on the energy output of a wind turbine [
2], which makes it very difficult to monitor the condition of its main transmission system. Therefore, it is essential to classify the working conditions reasonably and accurately before conducting a conditions assessment.
At present, there are few studies on classifying the working conditions of wind turbine main transmission systems. Most consider the working conditions of the whole wind turbine and classify the working conditions according to the operating characteristics of the wind turbine and the use of clustering algorithms. Yan [
3] and Mei [
4] divided the wind turbine speed and torque control process into four phases: start-up, maximum wind energy tracking, constant speed generation, and constant power generation. Dai et al. [
5] classified wind turbine operation according to the relationship between rotor speed and power as start-up, first transition, maximum power point tracking, second transition, and full power. Yang et al. [
6] classified wind turbine operation according to power curve parameters into four phases. Cheng et al. [
7] classified wind turbine operating conditions based on wind speed-power curves, rotational speed-power curves, rotational speed-pitch angle curves, and power-pitch angle curves into seven states: normal operation, normal shutdown, power-limited operation, adjustment process, off-grid process, abnormal shutdown, and on-grid acceleration. Ling [
8] identified the working conditions of the main bearing according to wind speed and classified the working conditions as low power, rapid power increase, and stable power. Gu et al. [
9] used statistical analysis to classify the working conditions according to ambient temperature first and then by wind speed. However, the number of classes was relatively small and does not effectively describe the complex and variable working conditions of wind turbines. This causes a high false-alarm rate during the monitoring of actual conditions.
Alternatively, working conditions have been classified using clustering algorithms. Dong et al. [
10], Xing et al. [
11], Zhang et al. [
12], and Wang et al. [
13] selected the characteristic parameters of working conditions by analysing the correlations in SCADA data and using the
k-means clustering algorithm to classify historical working conditions during normal wind turbine operation. Liu et al. [
14] proposed semi-supervised
k-means clustering with stream-wise distance as a similarity measure for analysing massive SCADA datasets to classify wind turbine working conditions. Jin [
15] and Liu et al. [
16] selected working conditions feature parameters and used the fuzzy C-means (FCM) clustering algorithm to classify the operating conditions. Yin et al. [
17] and Chen et al. [
18] used a Gaussian mixture model (GMM)-based clustering method to classify wind turbine operating conditions based on condition monitoring data. Ma et al. [
19] proposed the adaptive classification of conditions using GMM. Wang et al. [
20] selected three parameters—wind speed, generator speed, and active power—and applied the GMM clustering algorithm to classify training data into three sub-conditions. Han. [
21] divided SCADA data by month and determined the optimal interval length according to particle swarm optimization (PSO) and then carried out interval clustering. Han et al. [
22] proposed a clustering method for wind farms based on correlation analysis and significance testing (CA-ST). Zheng et al. [
23] proposed a PSO optimization kernel principal element analysis (KPCA) method for classifying the working conditions of offshore wind turbines. However, most of these studies are based on the direct application of a clustering algorithm to data and do not consider the wind turbines’ operating mechanisms. Hence, the correlations between wind turbine operating parameters and operating conditions are unclear and lack theoretical support.
In the field of machine learning, clustering is a classical unsupervised learning method. Commonly used clustering algorithms and their advantages and disadvantages are summarised in
Table 1.
Based on a comparative analysis of the clustering algorithms in
Table 1, the
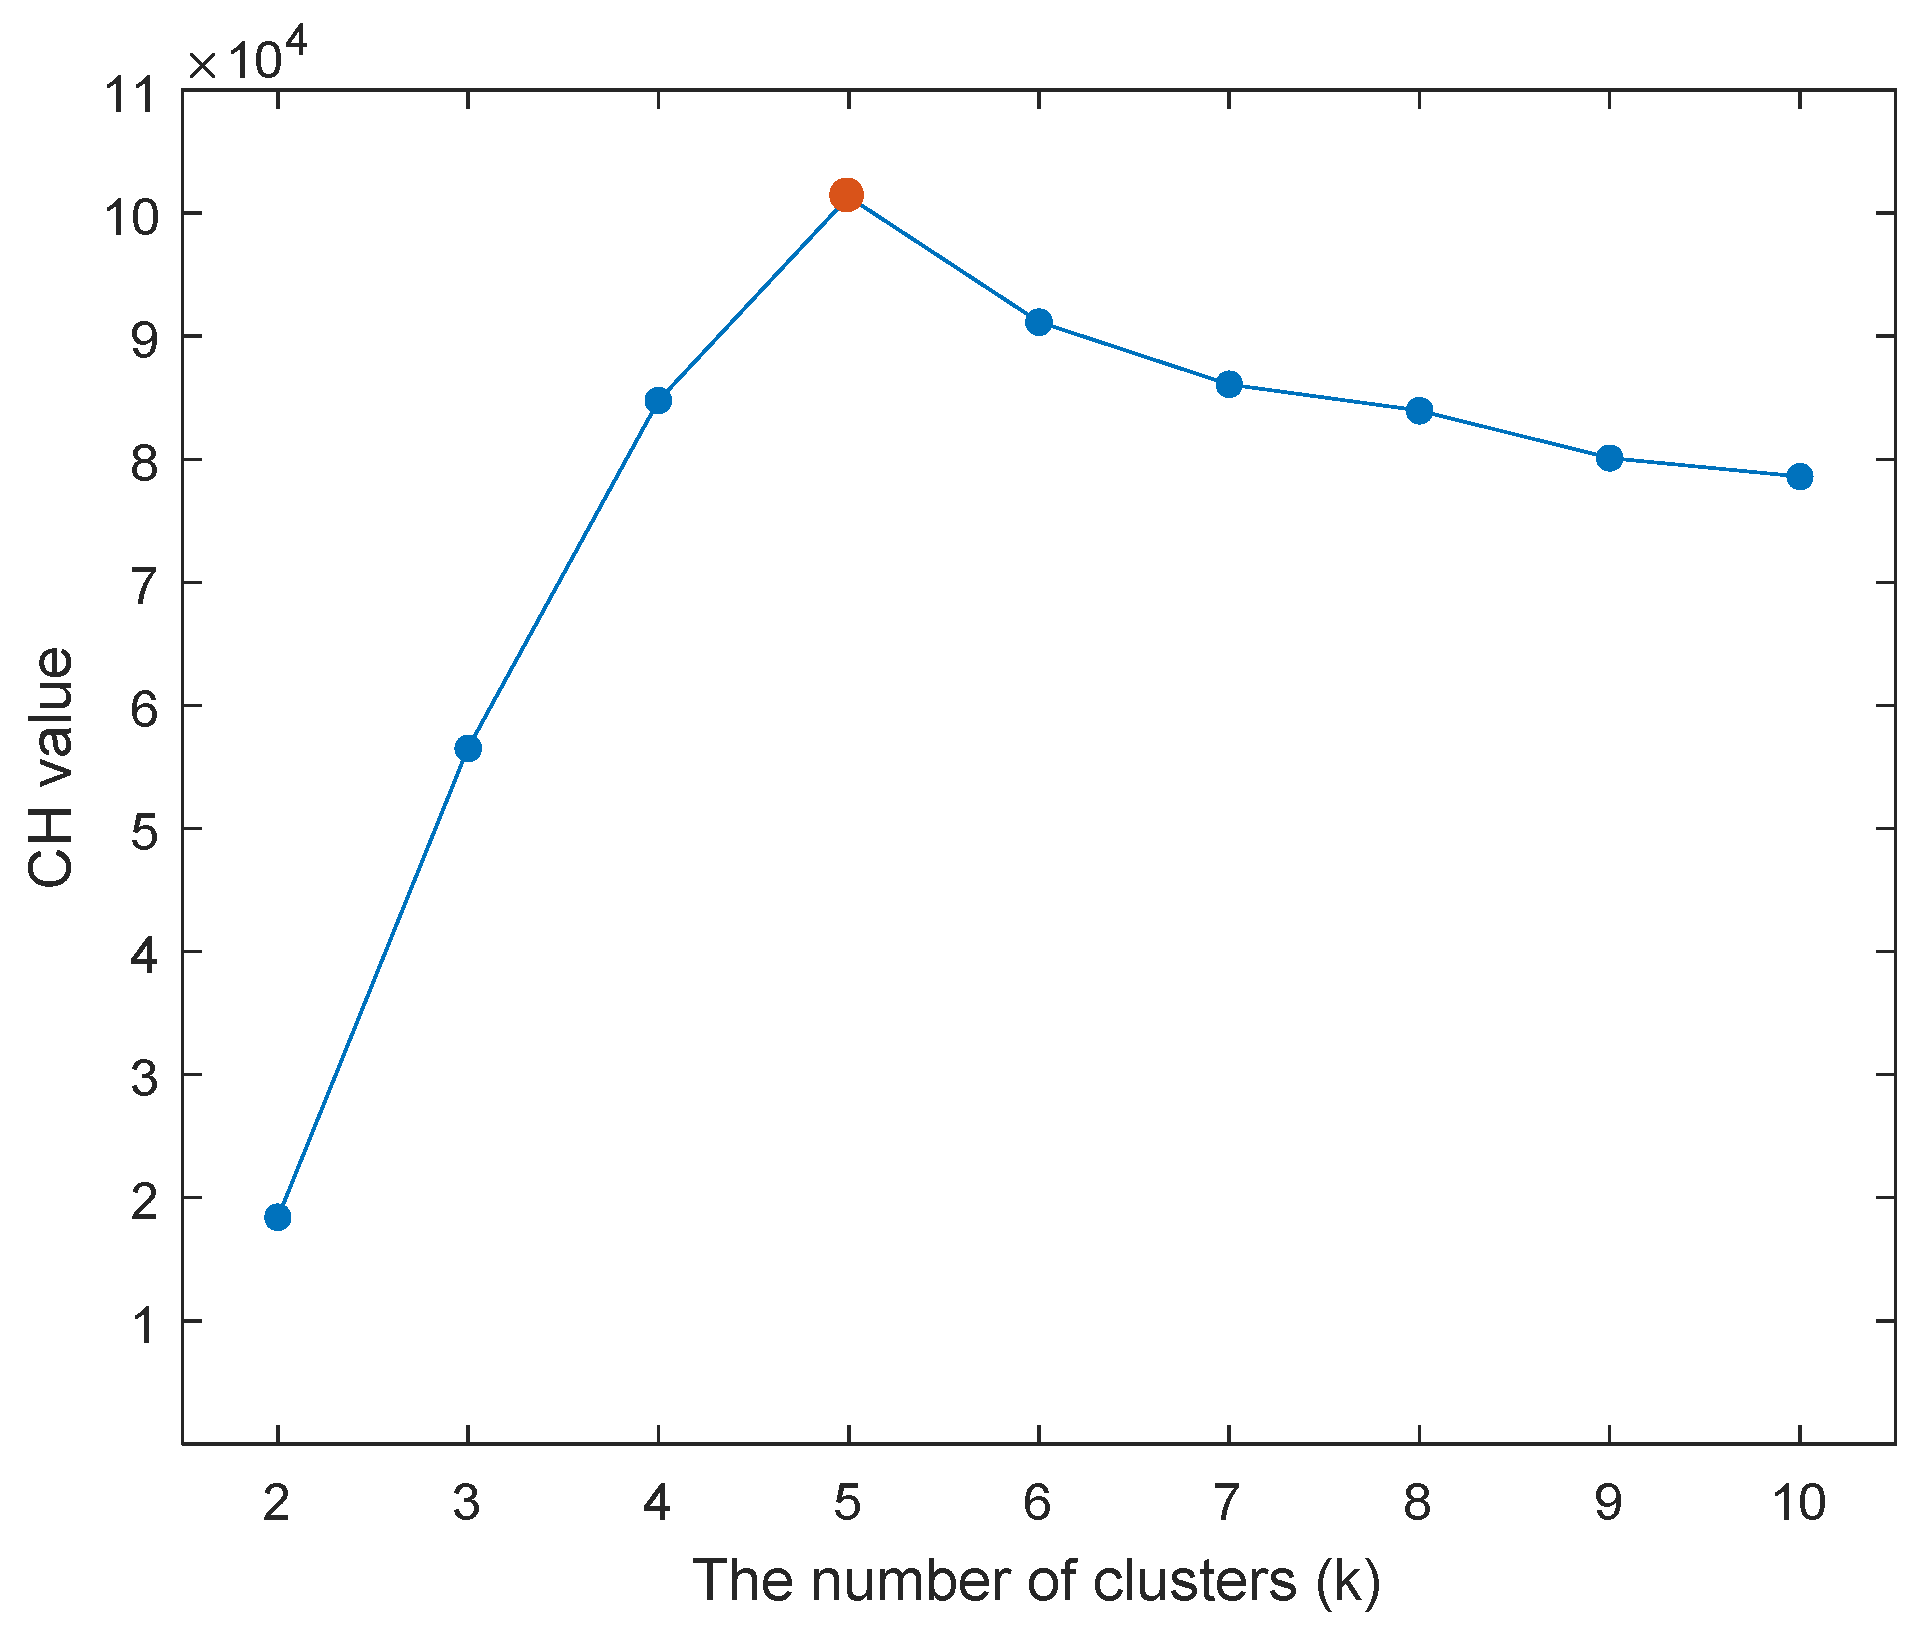
k-means clustering algorithm was selected to cluster the working conditions of the main transmission system of a wind turbine due to the large number of dimensions in the large amount of SCADA data. The Calinski–Harabasz (CH) criterion was used to determine the number of clusters in the
k-means clustering algorithm, while the initial cluster centres were selected by the
k-means++ algorithm. The specific method is described in
Section 3.1.2.
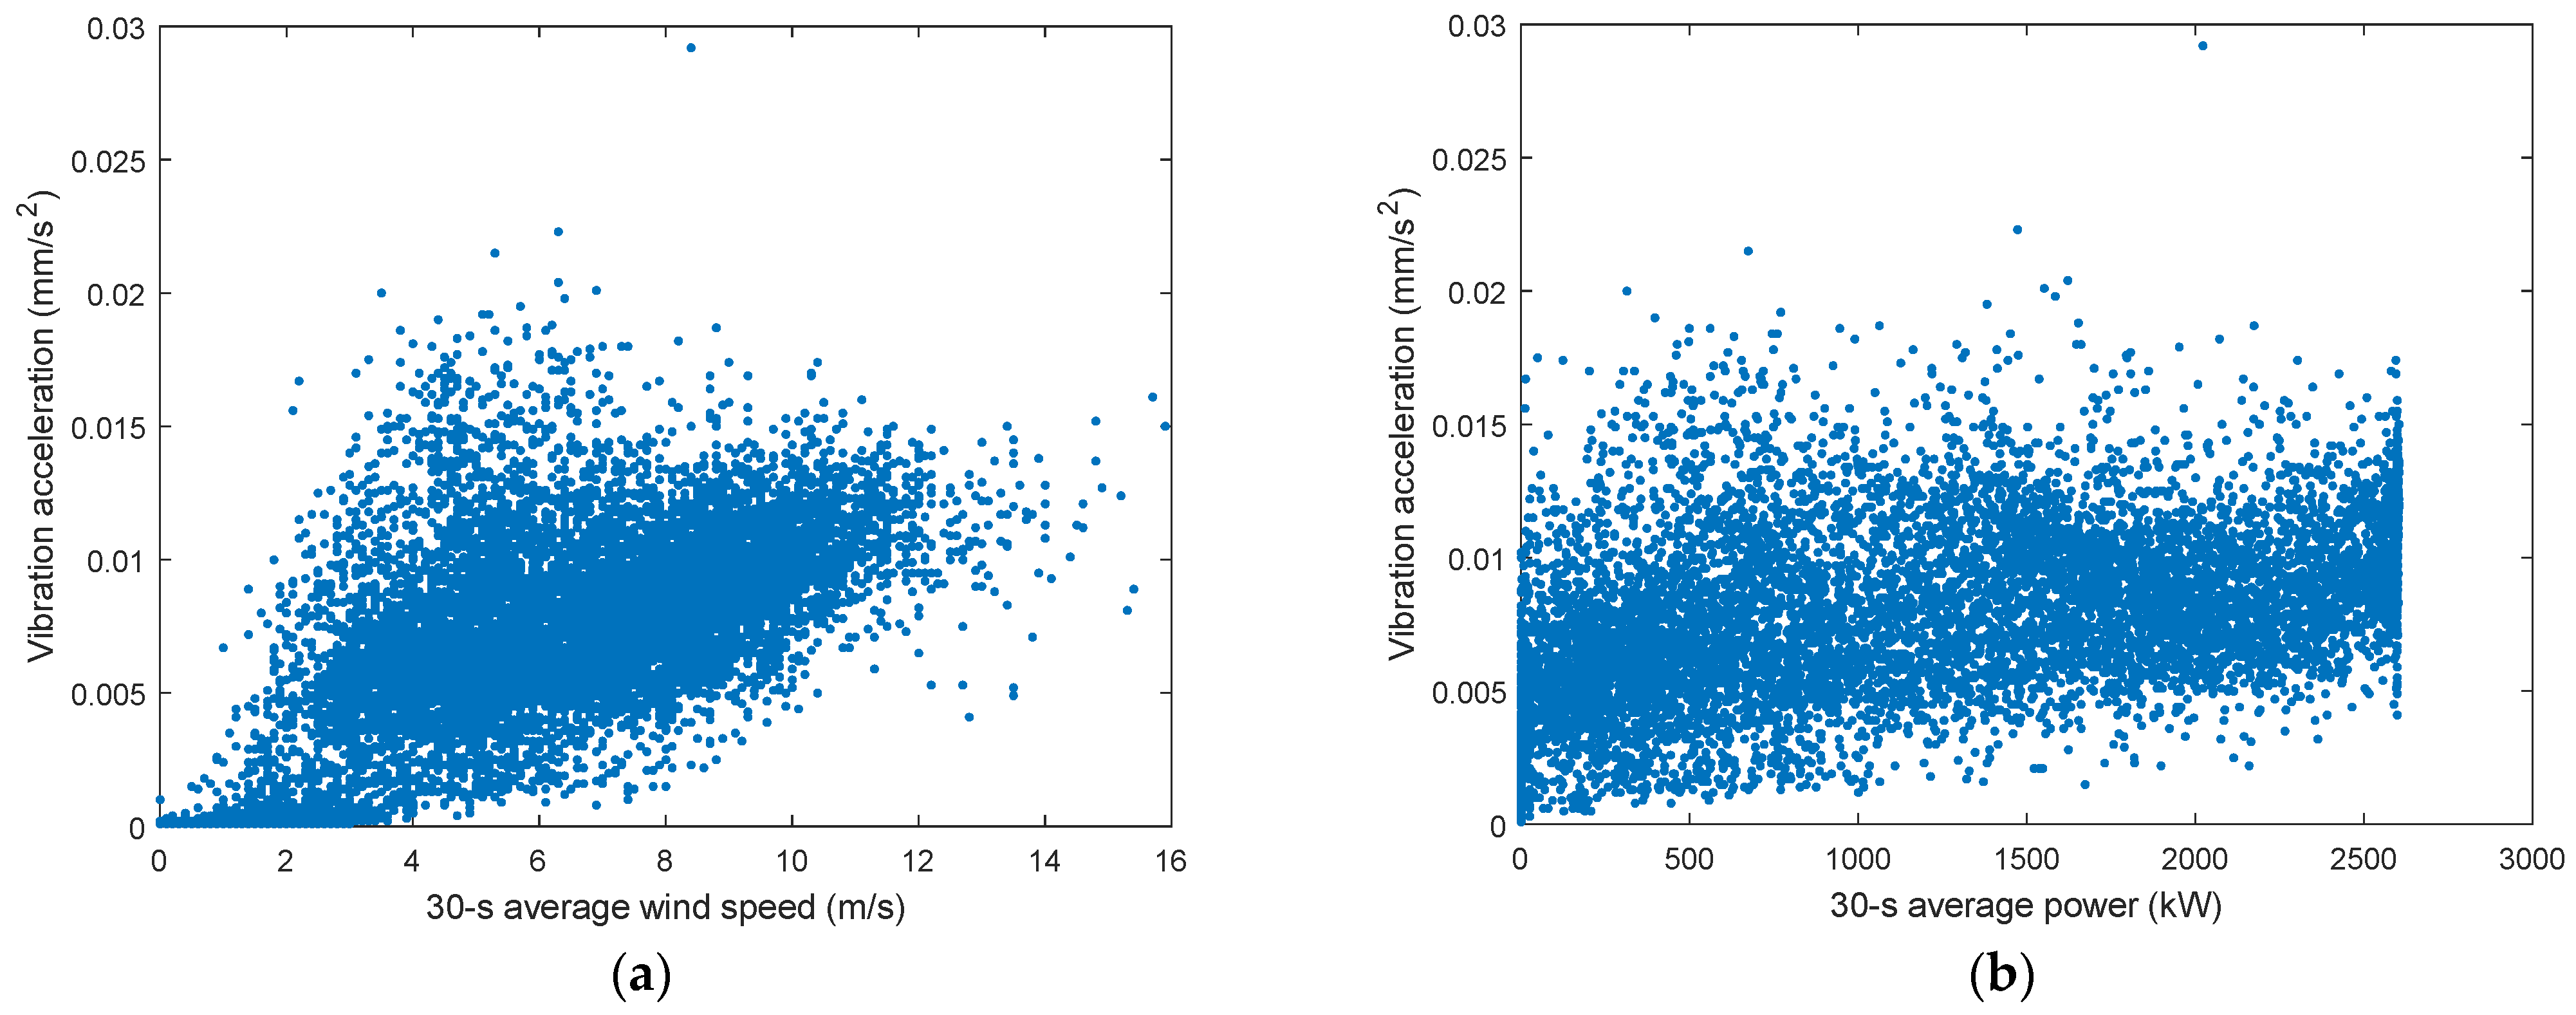
The working conditions of a wind turbine’s main transmission system are relatively complex.
Figure 1 shows the variation in the vibrational acceleration of the main shaft of a 2.5-MW wind turbine according to wind speed and power. As can be seen, even when an operating parameter is fixed, the vibration still shows a very high variability [
24]. In classifying the main transmission system’s working conditions, there is a small number of conditions after classification, and the vibrational acceleration may change drastically within each condition. Therefore, it is not possible to determine whether the vibrational acceleration changed drastically due to a fault in the main transmission system fault, and it is difficult to make an accurate judgment of the system’s operating status.
To address the above problems, this paper proposes a method for classifying a wind turbine main transmission system’s conditions based on analysis of the wind turbine’s operating characteristics and use of a k-means clustering algorithm. The main contributions of this paper are as follows:
A transmission system working condition classification based on wind turbine operating characteristics and a k-means clustering algorithm is proposed. It can solve the problems of traditional classification systems, such as classes being insufficient in clarity or number and high false-alarm rates in the main drivetrain vibration detection process.
A method for selecting the status parameters of the main transmission system based on correlation analysis is proposed. It avoids the influence of feature parameter omissions in the process of selecting feature parameters and improves the validity of SCADA data.
During vibration monitoring, the false-alarm rate is used as an index to verify the validity of the transmission system’s working condition classification.
The remaining parts of the paper are organized as follows. The main transmission system’s status feature parameters are selected according to correlation analysis in
Section 2. Classification of the transmission system’s historical working conditions based on turbine operating characteristics is combined with a clustering algorithm in
Section 3. The false-alarm rate in vibration detection is used as an index for the evaluation of classification results in
Section 4. A case study is used to validate the proposed method in
Section 5. Conclusions are drawn in
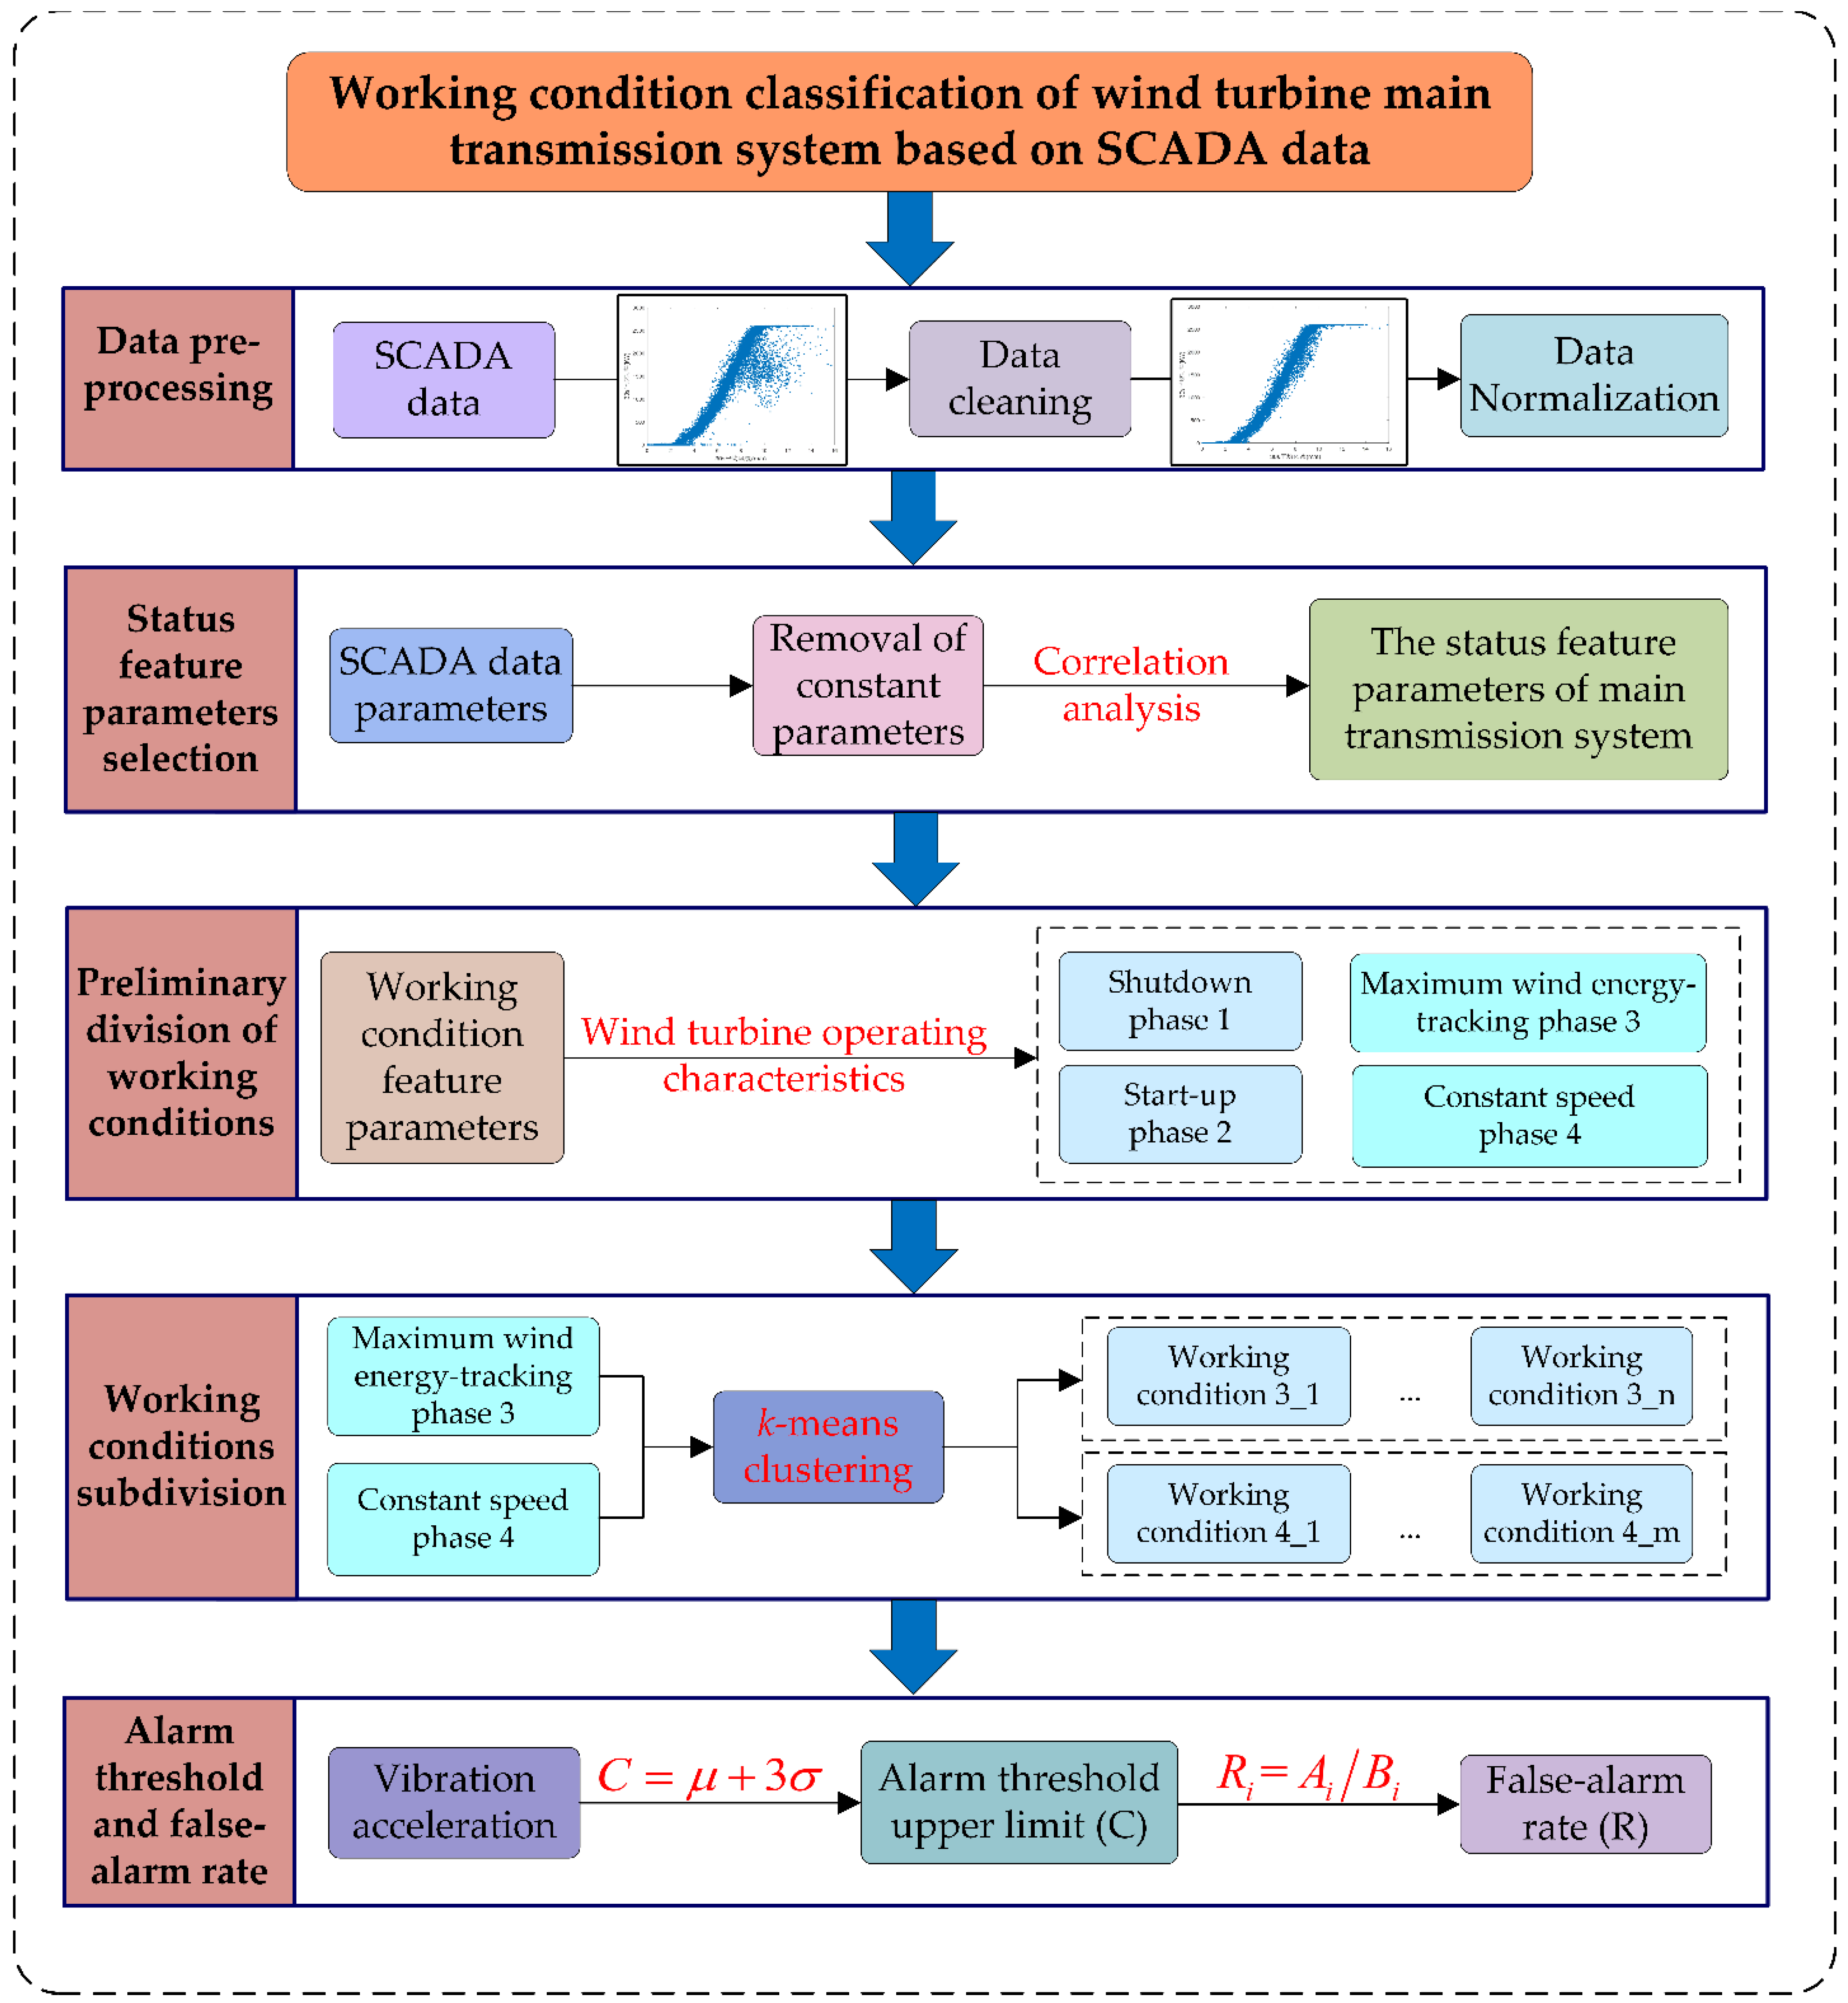
Section 6. A flowchart of the working condition classification system is shown in
Figure 2.
2. Selection of the Main Transmission System’s Status Feature Parameters
The main transmission system of wind turbine includes a hub, main shaft, bearings, gearbox, and couplings. The SCADA system collects a large amount of data with a large number of dimensions. The data contains many redundant variables, so in condition assessment, it is necessary to eliminate variables that are unrelated to the main transmission system. The Pearson correlation coefficient is used to select the characteristic parameters of the main transmission system’s operating status from the original SCADA data.
The Pearson correlation coefficient is used to measure the degree of linear correlation between two random variables. Assuming the existence of variables
X and
Y, the Pearson correlation coefficient between them is:
where
is the covariance of
X and
Y, and
,
are their standard deviations.
If the total number of
X and
Y samples is
n, then the correlation coefficient between
X and
Y is:
The Pearson correlation coefficient
r quantifies the linear correlation between the variables
X and
Y with the range [–1, 1]. Higher values indicate a stronger correlation. In general, it is considered that
is necessary to consider that two variables are correlated [
33].
The SCADA system collects a large amount of data with a large number of dimensions. This includes some constant parameters, such as power factor, pitch standby supply voltage, and grid-side voltage, which do not express the operating status of the wind turbine at the site and therefore need to be eliminated. Based on expert experience [
33], a total of 18 status parameters related to the operating state of the main transmission system were selected from the SCADA system, as shown in
Table 2. Here, the average 30-s power is used as the performance index. Status parameters with a strong relationship to the active power are selected from the SCADA system and the Pearson correlation coefficient is calculated, as shown in
Table 2.
From the correlation analysis, the state parameters in
Table 2 with correlation coefficients
were selected as the status parameters of the main transmission system. Among the average wind speed, 30-s average wind speed, and 600-s average wind speed, the 30-s average wind speed had the highest correlation with the active power and so was selected as the wind speed status parameter. The 30-s average power was selected as the power parameter rather than the 600-s average power. The average main shaft speed, 30-s average wind speed, 30-s average power, average torque, average main bearing temperature, average gearbox high-speed end-bearing temperature, average gearbox low-speed end-bearing temperature, average main shaft vibration acceleration, average gearbox oil filter inlet pressure, and average gearbox oil distributor outlet pressure were selected as the 10 status parameters of the main transmission system.
4. Determination of Alarm Thresholds
In the process of wind turbine SCADA system detection, the vibrational acceleration of the main transmission system can be detected by sensors to reflect the operating status. A vibrational acceleration alarm is mostly an over-limit alarm; i.e., as long as the threshold is exceeded, the alarm will be generated; otherwise, it will not [
35]. The data used in this paper refer to normal wind turbine operation without failure. Theoretically, the detection system should not issue an alarm; however, during actual state monitoring, false alarms are difficult to avoid, which requires adjustment of the alarm threshold to reduce the false-alarm rate as much as possible.
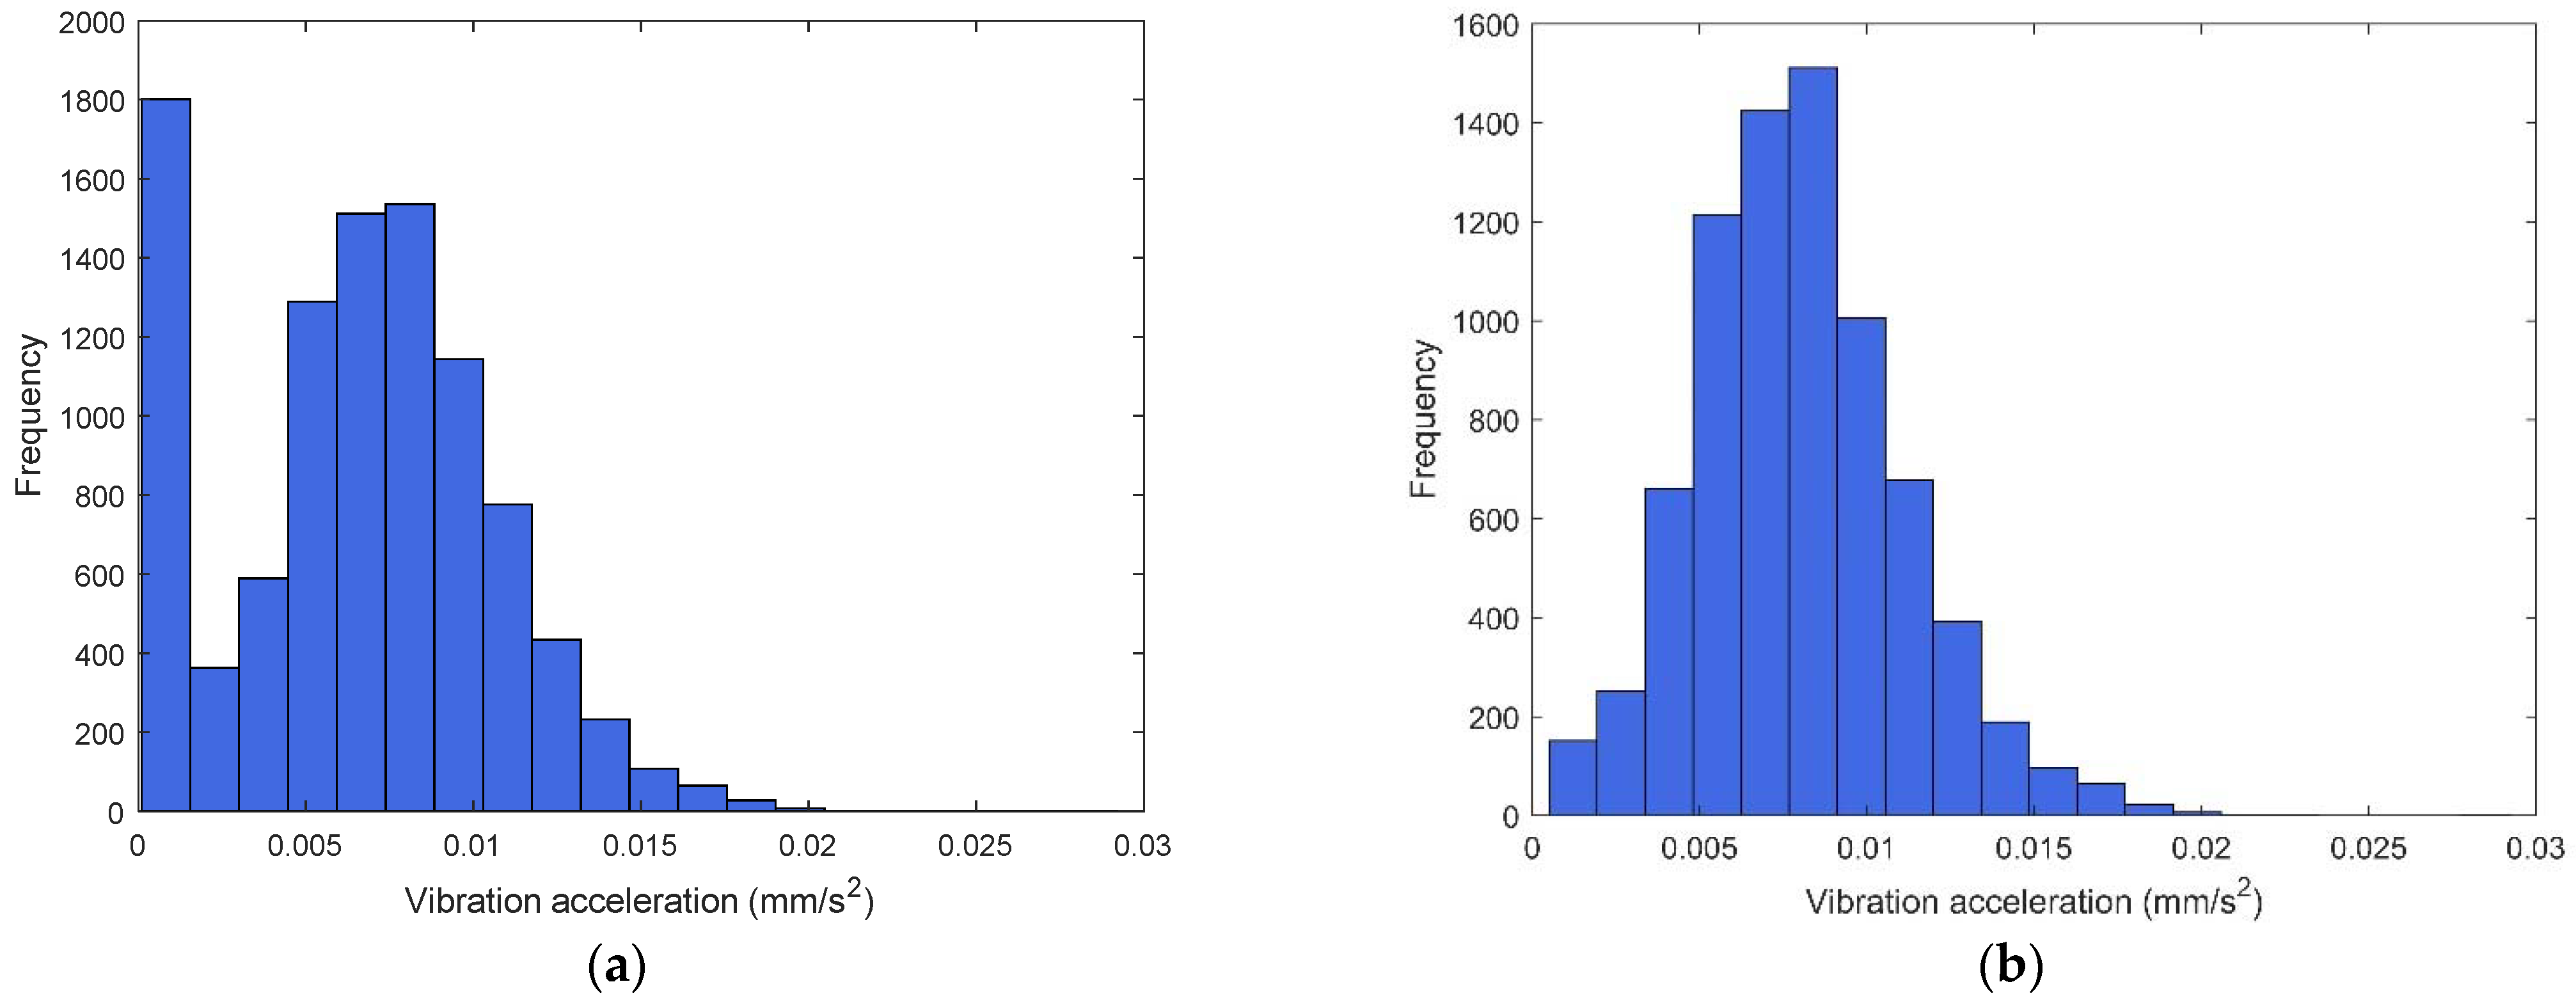
Figure 4 shows the frequency distribution of the average spindle vibrational acceleration from SCADA data. The frequency distribution of
Figure 4a contains all vibration data of the wind turbine. In addition, when the wind turbine is running, the vibration acceleration frequency distribution is shown as
Figure 4b. Comparing the two graphs, we can see that the peak on the left side of
Figure 4a, which appears in the shutdown phase of the wind turbine, we do not consider.
We choose its arithmetic mean
and standard deviation
as the basis for the threshold and set the alarm threshold
according to the
criterion.
If the vibrational acceleration value exceeds the threshold , an alarm is generated. To evaluate the reasonableness of this classification, a definition of the false-alarm rate is introduced.
In the SCADA historical dataset, it is assumed that the main transmission system has
n different working conditions corresponding to
n alarm thresholds relating to the characteristic value of vibrational acceleration. For the
i-th normal operating conditions, the total number of samples is
, and the number of samples exceeding the alarm threshold is
. Then, the false-alarm rate
for the
i-th working conditions is:
Therefore, the false-alarm rate is used as an index of the merit of the classification system. The lower the rate, the better the classification.
6. Conclusions
This paper addresses the engineering reality of the un-known real-time dynamic loads and multi-state dynamic behaviour of the main transmission system of a wind turbine, which can lead to the early onset of abnormal working conditions. A transmission system historical working condition classification method based on wind turbine operating characteristics analysis and a k-means clustering algorithm was proposed. The proposed method is based on the data collected using the SCADA acquisition system. This is oriented toward the division of working conditions for the later main transmission system condition assessment.
The selection method of state parameters based on correlation analysis is proposed. In order to avoid the omission of relevant state parameters and the interference of irrelevant variables to the results, the redundant variables are eliminated by using Pearson correlation coefficient. Finally, 10 state characteristic parameters of main transmission system are selected.
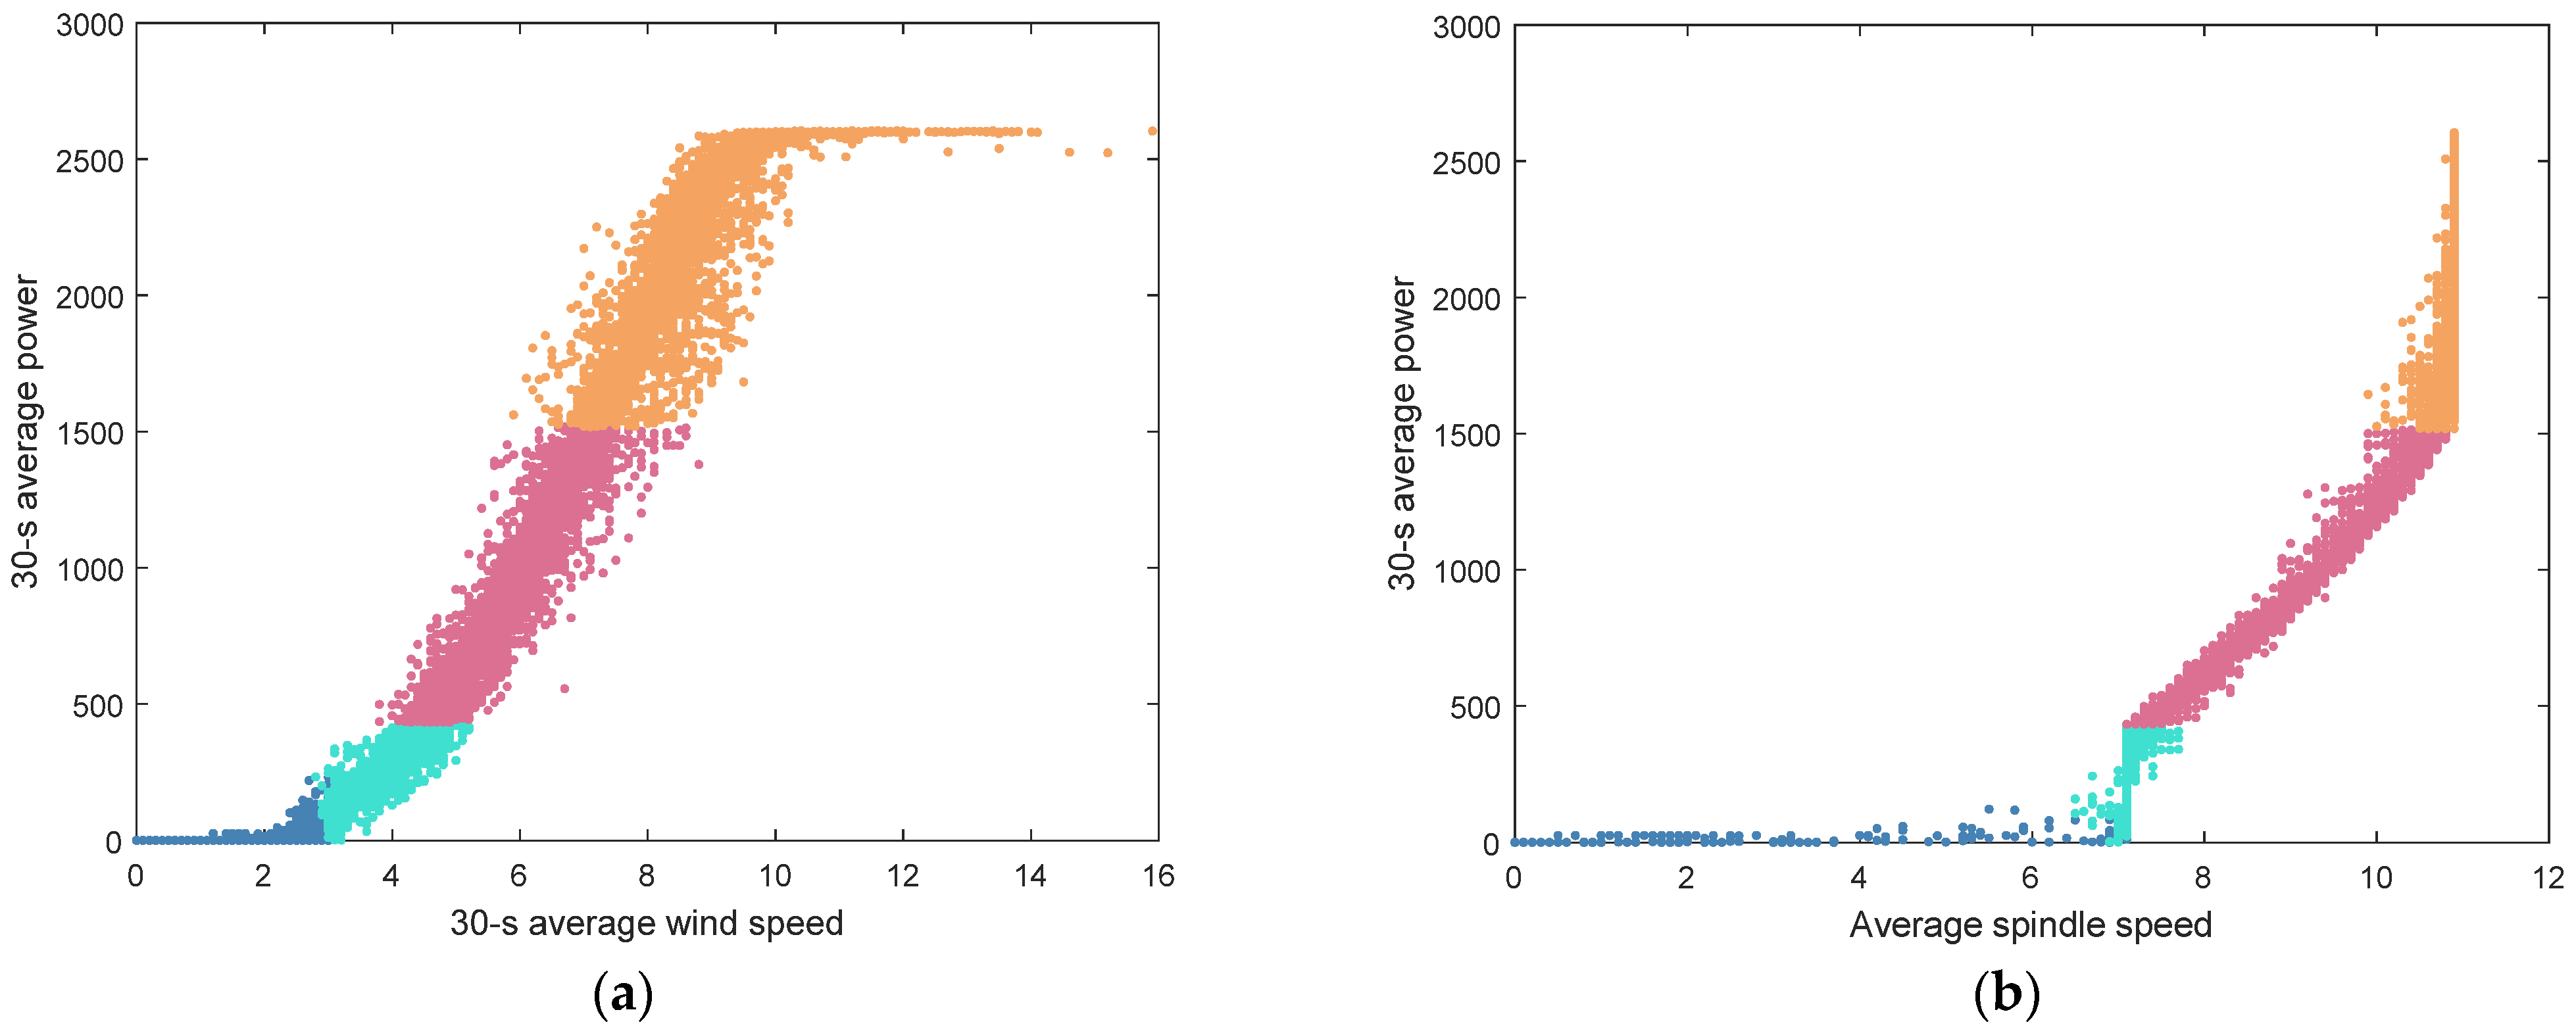
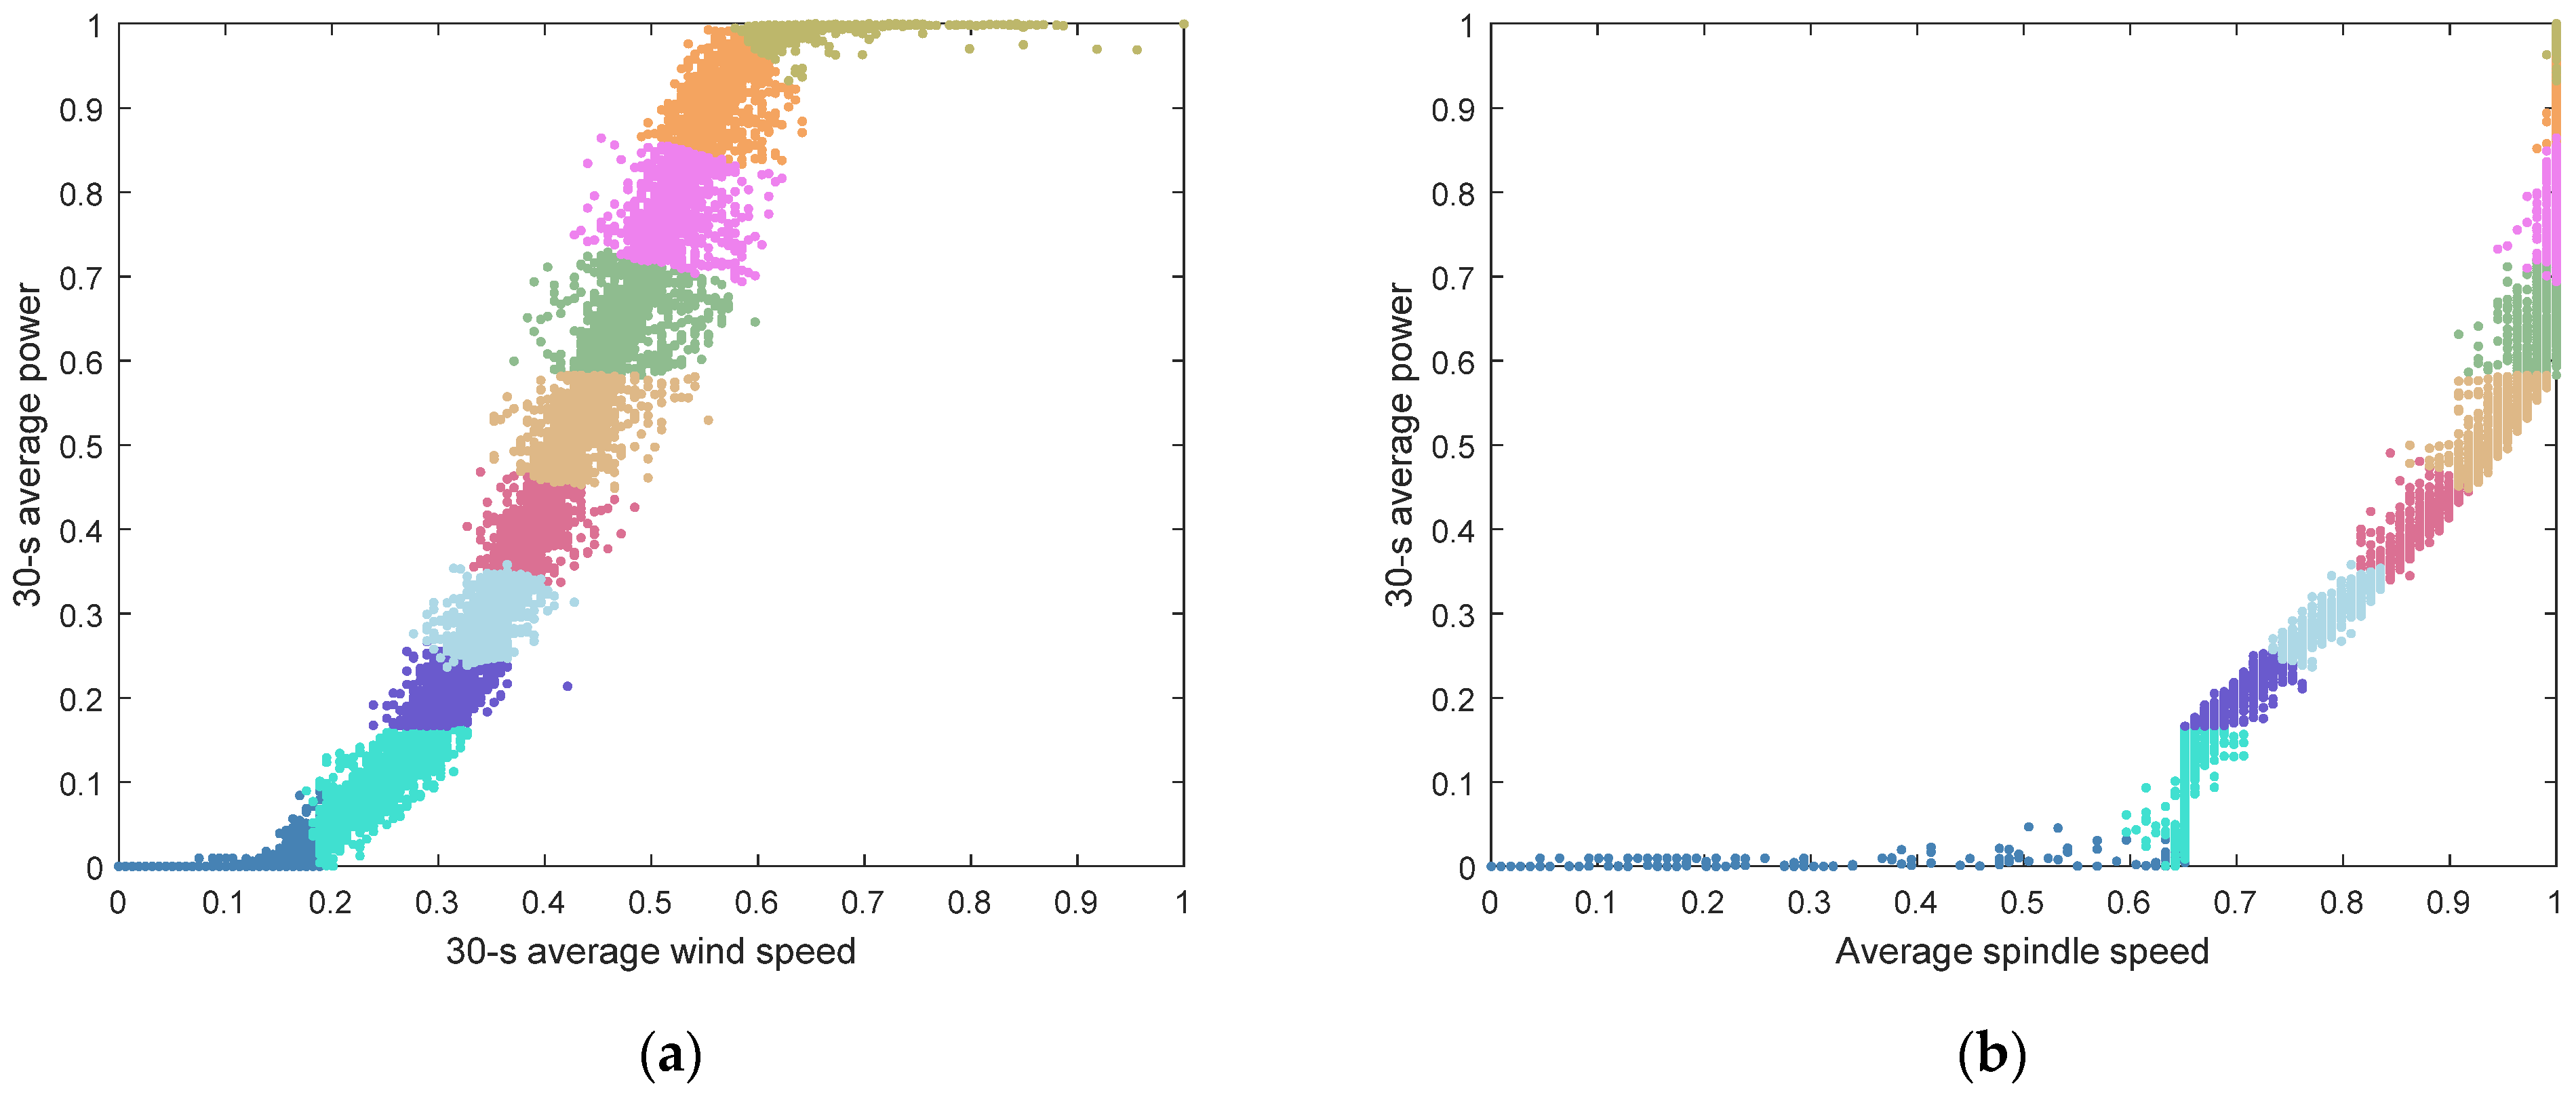
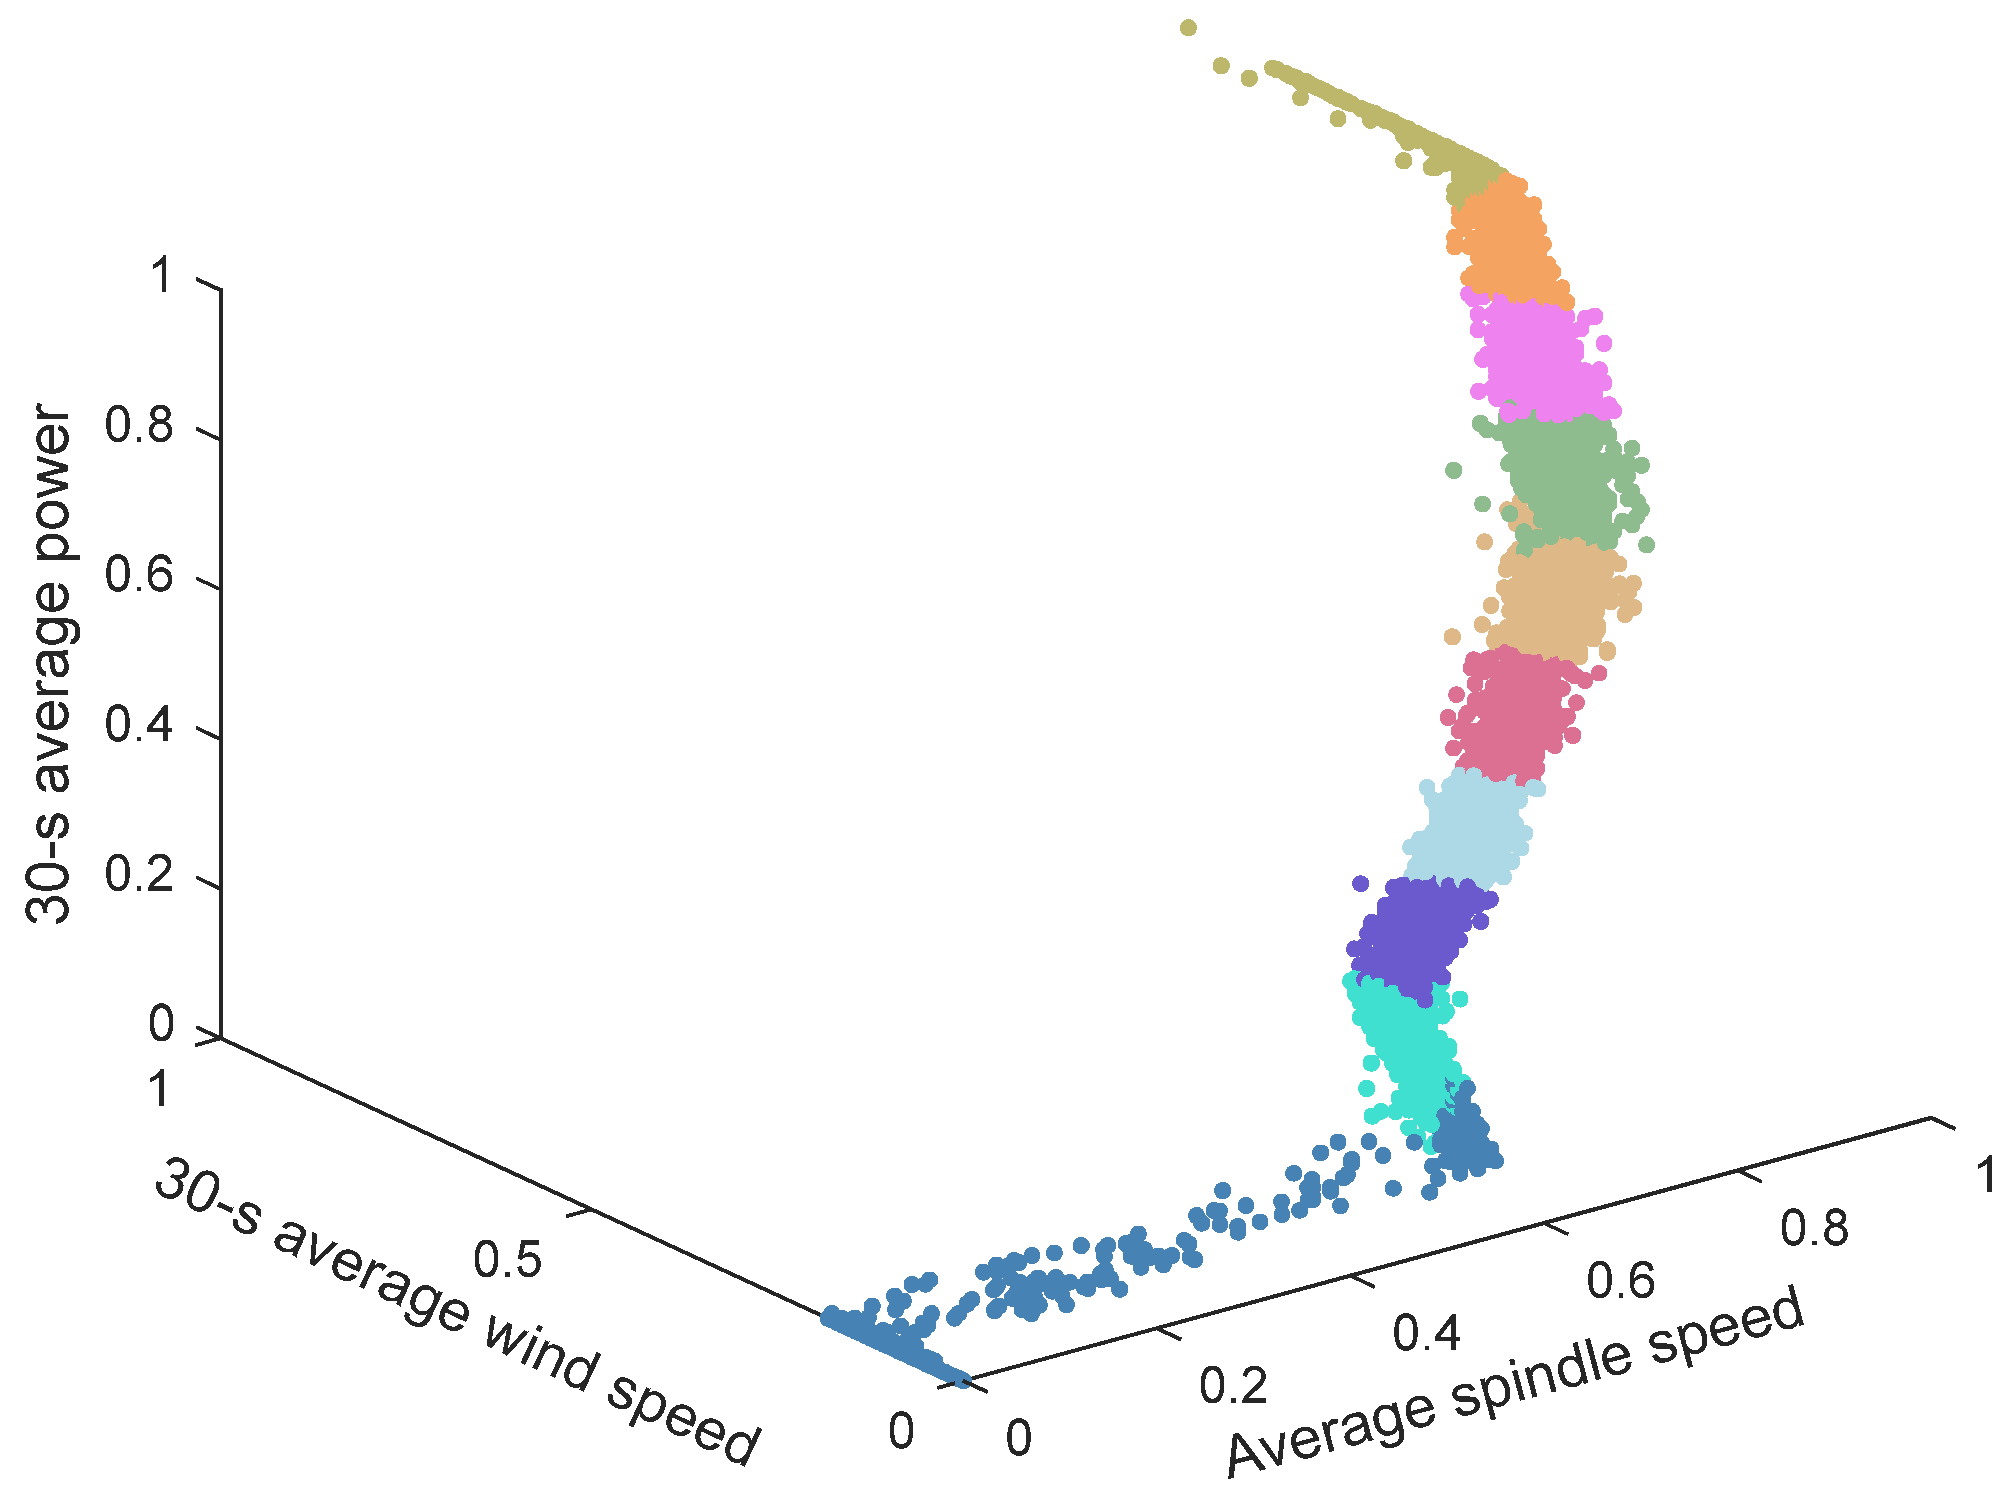
Most traditional working conditions are classified without taking into account the operating characteristics of the wind turbine. An improved method of working conditions classification is proposed. The working conditions are initially divided into four stages. Then, the k-means clustering algorithm is used to subdivide the maximum wind-energy tracking stage and constant speed stage, which account for a relatively large number of operating conditions. This provides more accurate working conditions for the subsequent condition assessment of the main transmission system.
The method was applied to a real case study of a wind turbine. To test its effectiveness, the false-alarm rates during vibration detection was calculated. Furthermore, the false-alarm rates were significantly reduced by compared with working conditions classification using the direct k-means clustering algorithm. The results show that the proposed classification method can solve the problems of unclear condition classification, too-few condition categories, and high false-alarm rates that could occur with direct clustering classification based on vibration detection.
The working condition classification method can be applied to the real-time monitoring of the wind turbine main transmission system at a later stage. In the process of its condition monitoring, it can reduce the false-alarm rates, improve the accuracy of main transmission system condition assessment, reduce maintenance costs, and ensure the safety and economy of wind turbines operating.


