Article

A Study of the Energy Exchange within a Hybrid Energy Storage System and a Comparison of the Capacities, Lifetimes, and Costs of Different Systems

Division of Electromagnetic Engineering, KTH Royal Institute of Technology, SE-100 44 Stockholm, Sweden
*
Author to whom correspondence should be addressed.
Energies 2021, 14(21), 7045; https://doi.org/10.3390/en14217045
Submission received: 28 September 2021 / Revised: 20 October 2021 / Accepted: 22 October 2021 / Published: 28 October 2021

Abstract

:
By combining the advantages of different energy storage technologies, the hybrid energy storage system (HESS) can satisfy the multiple requirements of prosumer systems. However, the required capacity of the HESS is larger than that of the single-battery energy storage system (ESS). This paper investigates the energy exchange within the HESS caused by the phase shift of the low-pass filter controller and its relevant impact on the HESS. The results show that unnecessary energy exchange results in an oversized capacity and increased energy loss. In addition, the increase in the time constant of the low-pass filter controller leads to a larger phase shift, further contributing to the increases in the total capacity and energy loss. Furthermore, this paper compares the single-battery ESS, the battery-supercapacitor HESS, and the battery-flywheel HESS implemented in a household-prosumer system along with a renewable energy source (RES). The comparison of the ESS combinations demonstrates the differences between their power flows, the required capacities of their individual energy storage devices (ESDs), their energy losses, their battery lifetimes, and their project costs. The results indicate that techno-economic analysis should be performed carefully to select the appropriate ESS solution for specific household-prosumer systems.

1. Introduction

Distributed renewable energy sources (RESs), represented by photovoltaic (PV) and wind power generation, have developed rapidly in recent decades. Prosumer systems can utilize RESs generation locally (i.e., self-production and self-consumption), which increases renewable energy penetration. However, the output power of RESs is easily affected by the environment and features relatively poor stability, weak continuity, and low reliability. In addition, there are spatial and temporal gaps between intermittent energy and its consumption, which causes an imbalance between the available RESs and their end users [1,2]. These problems challenge the stability and power quality of prosumer systems. To overcome the intermittent aspect of RESs, introducing an energy storage system (ESS) is an effective approach for suppressing power fluctuations, achieving load shifting, and improving stability and reliability [3].
Currently, there is no single energy storage technology that fully satisfies the multiple requirements of prosumer systems, such as high energy and high power density, short response time, long lifetime, and low cost. Energy storage devices (ESDs) with a high energy density usually have a relatively larger storage capacity but a slower response time and a lower lifecycle [4]. For example, the capacity of Li-ion batteries fades when the charging/discharging operation employs high frequencies [5]. In addition, redox flow batteries are usually cost-effective, but they require long-term usage and large-scale applications [6,7]. By contrast, supercapacitors (SCs) and flywheels can quickly respond to high power demands and feature long lifetimes, which are suitable for small-scale applications with rapid charge and discharge requirements. Thus, the concept of hybrid energy storage systems (HESSs), which combine the advantages of different energy storage technologies, is a promising solution for research and applications. A HESS usually consists of two individual ESDs: one ESD features high energy density for primary storage, e.g., fuel cells or batteries, and the other ESD features a high power density for secondary storage, e.g., SCs or flywheels. Synergies are achieved by combining the different advantages of the two ESDs, i.e., by providing both high power and high energy density [4,8].
Due to the various frequency and amplitude fluctuations of the power demands in RES prosumer applications, a control strategy of a HESS that adequately handles both low- and high-frequency power responses is preferable. Consequently, the filtration-based controller is one of the most widely used control strategies for distributing the power demand of HESSs, since it is simple and easy to utilize and tune [9]. However, its disadvantage is the unavoidable phase shift from its linear filter controllers [10]. As a result, the total required capacity of the HESS is larger than that of the single-battery ESS [11,12]. Most previous studies have emphasized the benefits of HESSs and the extension of the battery lifetime [13,14,15]. However, the required capacity of a HESS, particularly due to its oversized capacity and its relevant impact, has not been thoroughly investigated to date. Furthermore, several published studies have developed and introduced different HESSs into prosumer systems [16,17], among which battery-SC HESSs and battery-flywheel HESSs are often utilized to achieve load shifting and energy management [15,16,17]. Nevertheless, SCs and flywheels feature different working principles and charge/discharge characteristics. Recent attempts to understand HESSs do not fully address these nuances. Specific analyses and comparative studies of battery-SC HESSs and battery-flywheel HESSs are needed.
Although different HESSs have been researched, most studies are restricted to the adjustment of the SOC and dynamic response performance. However, previous studies ignore the oversized capacity problem that stems from the primary filter circuit. No systematic analysis of the association between the required capacity of HESSs and the time constant of the low-pass filter controller has been performed. Clearly, further work is needed to address the oversized capacity problem and to indicate an appropriate approach to the optimization of smart control strategies. Therefore, this paper aims to investigate the energy exchange caused by the phase shift and the relevant impact on the required capacity and energy loss of a HESS. This study will help to address the aforementioned gaps in previous research and provide a reference for selecting the appropriate ESS combinations in RES household-prosumer systems.
In this study, the analysis of the power flows in a HESS explores the time delay that stems from the phase shift of the low-pass filter. The time delay causes an unnecessary energy exchange between the primary ESD and the secondary ESD within the HESS. It leads to increases in the required capacity and energy losses. A scaled-down experimental setup was built to validate the simulation results. In addition, this paper compares the single-battery ESS, the battery-SC HESS, and the battery-flywheel HESS. The comparison discusses these ESS combinations in a stand-alone prosumer application that contains a RES (wind-powered or PV-powered) and a residential load. The lifetimes of the batteries and the project costs for the HESSs are evaluated. The lifetimes of the batteries in the ESS combinations are compared using nickel manganese cobalt oxide (NMC) batteries and lithium iron phosphate (LFP) batteries. The total costs of the ESS combinations that consist of NMC/LFP batteries and SCs/flywheels with a 30 year project lifetime are compared.
This paper is organized as follows. After the introduction in Section 1, Section 2 describes the HESS topology and the control strategy. Section 3 analyses the energy exchange in a simulated HESS, which results in the oversized capacity and increased energy loss of the HESS. In addition, an experimental setup was built to validate the simulations. Section 4 compares the single-battery ESS with the battery-SC HESS and the battery-flywheel HESS in the RES household-prosumer system. Furthermore, the lifetimes of the batteries and the project costs of the ESS combinations are estimated. Finally, Section 5 provides the conclusions of the study.

2. HESS Topology and Control Strategy
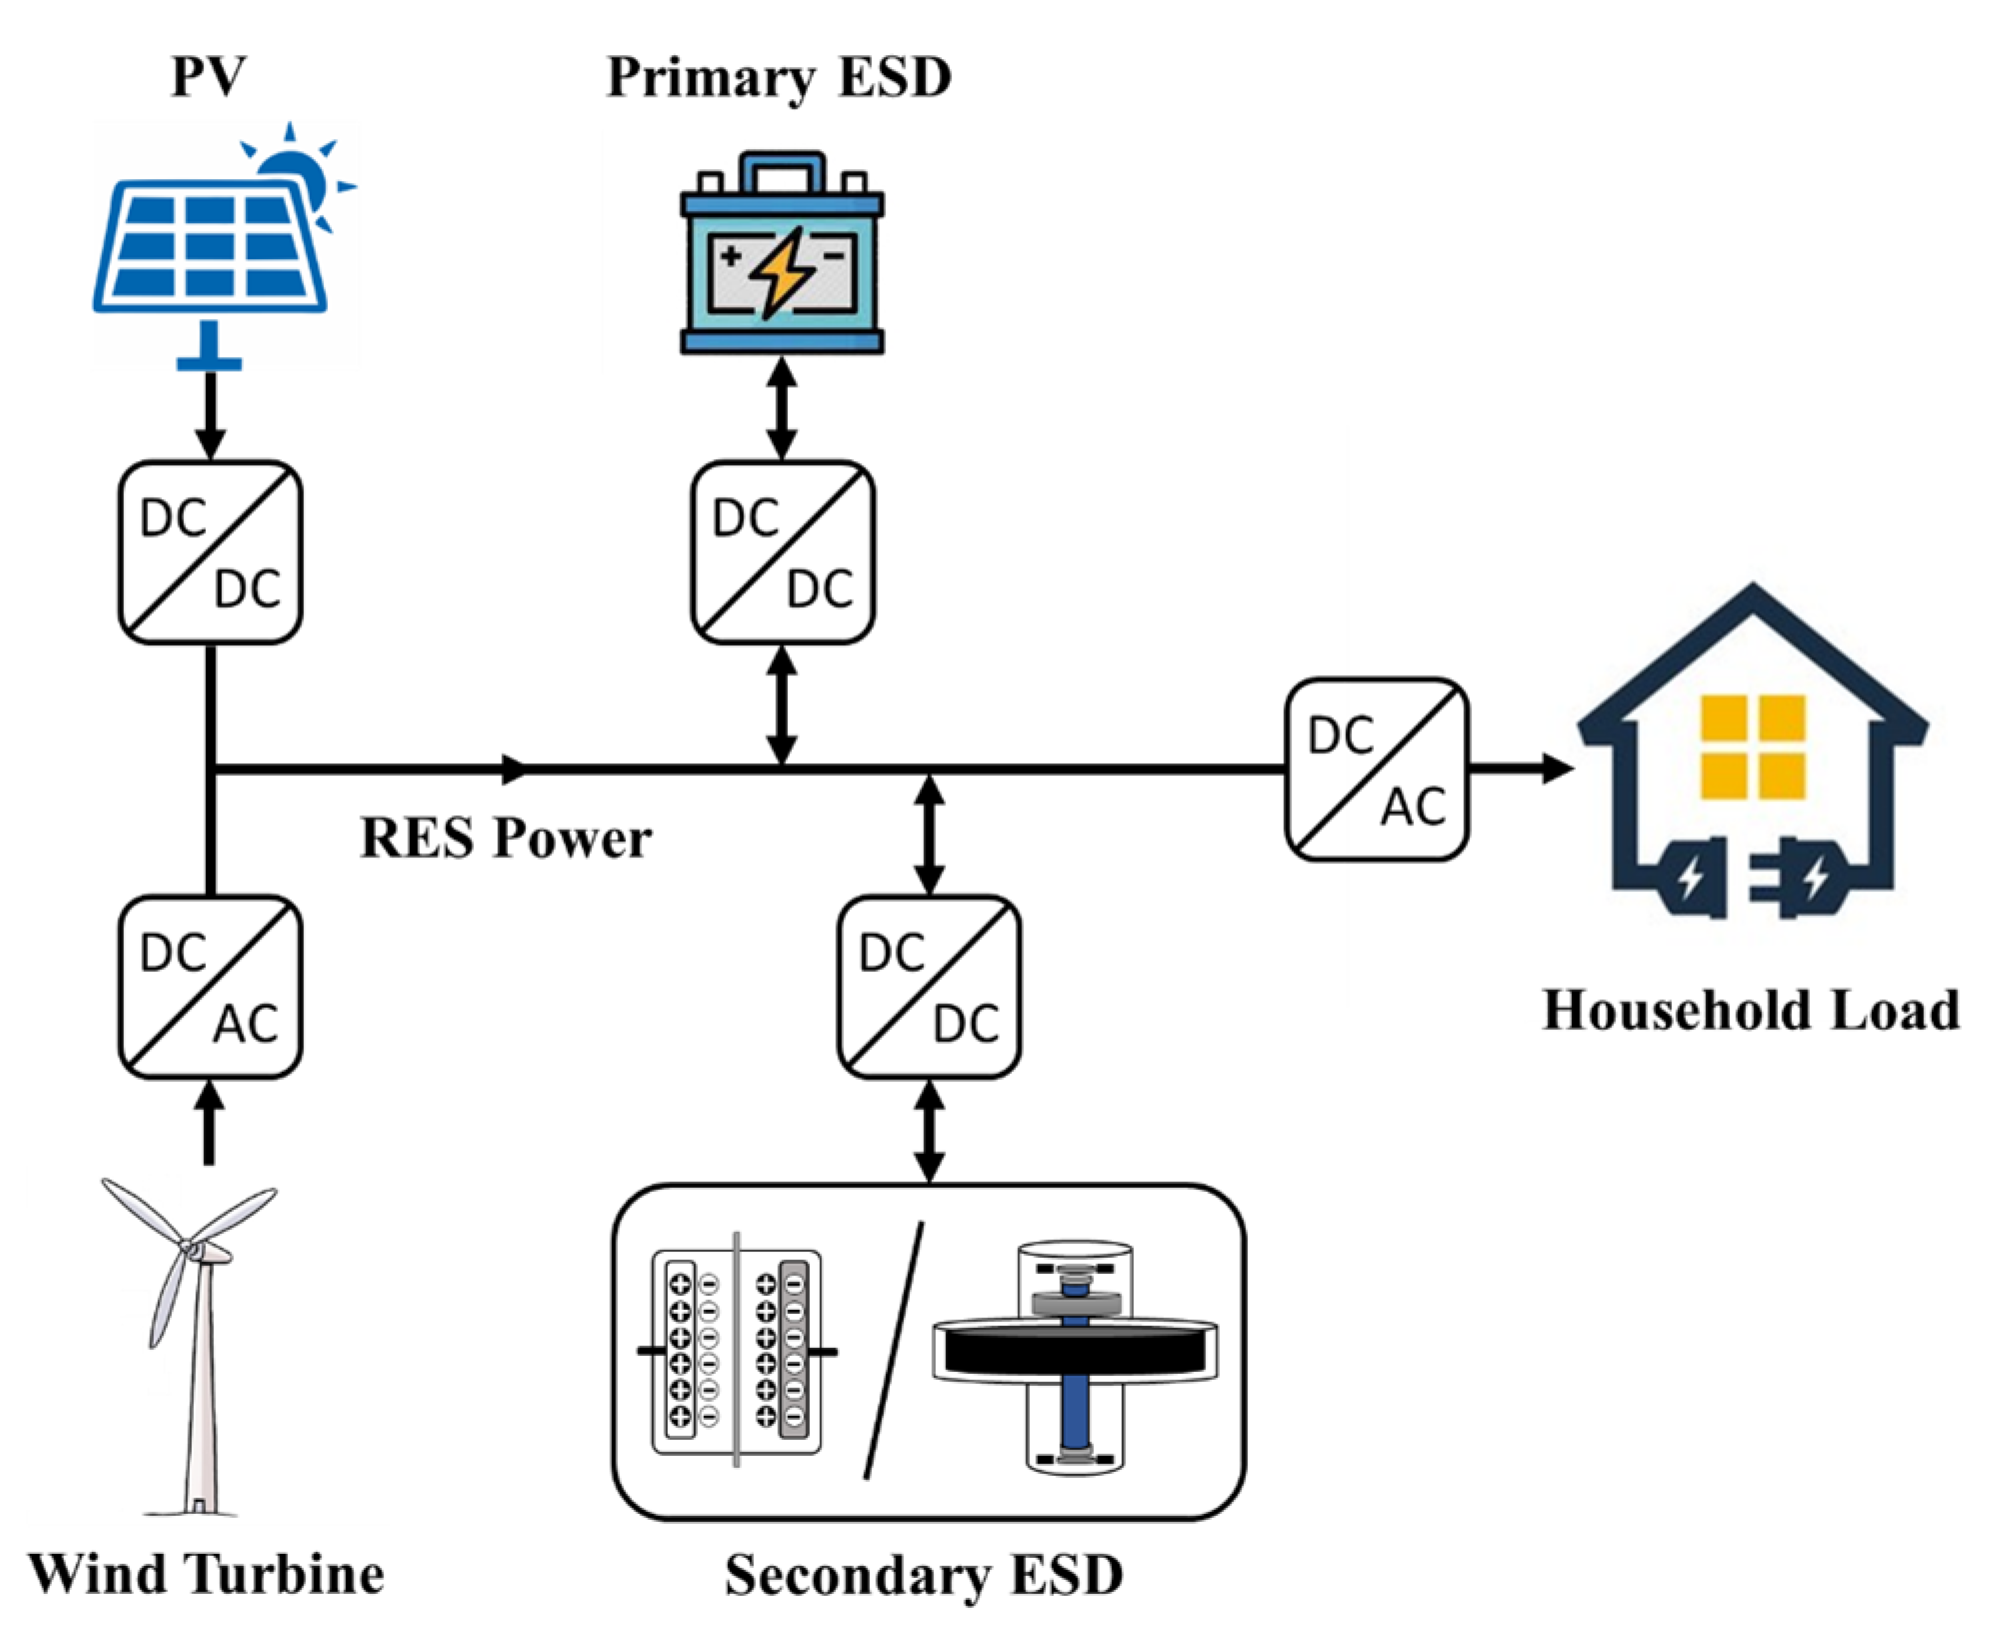
This section presents the details of the HESS topology and the applied controller. A parallel active topology was used. In addition, as the main objective is to investigate the energy exchange between the individual ESDs, a filtration-based controller was applied to control the HESS.

2.1. HESS Topology

HESS topologies can be classified into passive, semi-active, and active topologies [18]. Passive topologies are simple, low-cost, and highly efficient, but cannot be controlled. Semi-active topologies feature a converter at the terminals of one ESD, whereas the other ESD is directly connected to the DC bus. This allows some degree of controllability with a low cost, but cannot utilize all of the capacities of both the ESDs. However, active topologies are capable of flexibly and independently controlling the power flows of both the ESDs. In this study, as shown in Figure 1, a parallel active HESS topology was applied. The primary ESD and the secondary ESD were connected to the DC bus in parallel by the bi-directional DC/DC converters.

2.2. HESS Control Strategy

Control strategies of HESSs play a vital role in system power balance and voltage regulation. The low-pass filter is the core component in many controllers because it splits the power demand into low- and high-frequency parts [19]. However, linear filtering controllers are often incapable of achieving an optimal power distribution. This can be improved by adding more intelligent control strategies so that the parameter values of the controller can be adjusted. In addition, intelligent algorithms that are even more complex can be implemented to realize multi-parameter and multi-objective optimization, such as neural networks, fuzzy logic controllers, and evolutionary algorithms [20]. Therefore, a conventional low-pass filter controller was used in this study to explore the impact of the energy exchange in the HESSs.
Figure 2 presents the block diagram of the low-pass filter controller. The primary ESD (battery) releases and absorbs the low-frequency power flow, whereas the secondary ESD (SC or flywheel) responds to high-frequency power fluctuations.
The power flows of the two ESDs are given by:
{ P E S D 1 = P H E S S 1 1 + s T f P E S D 2 = P H E S S P E S D 1
This power distribution reduces the stress on the primary ESD and thus extends its lifetime. However, the energy stored in the secondary ESD decays with time due to the high self-discharge rate of the SC/flywheel and needs to be compensated. The self-discharge loss of the primary ESD is ignored here due to the relatively low self-discharge rate of the battery.

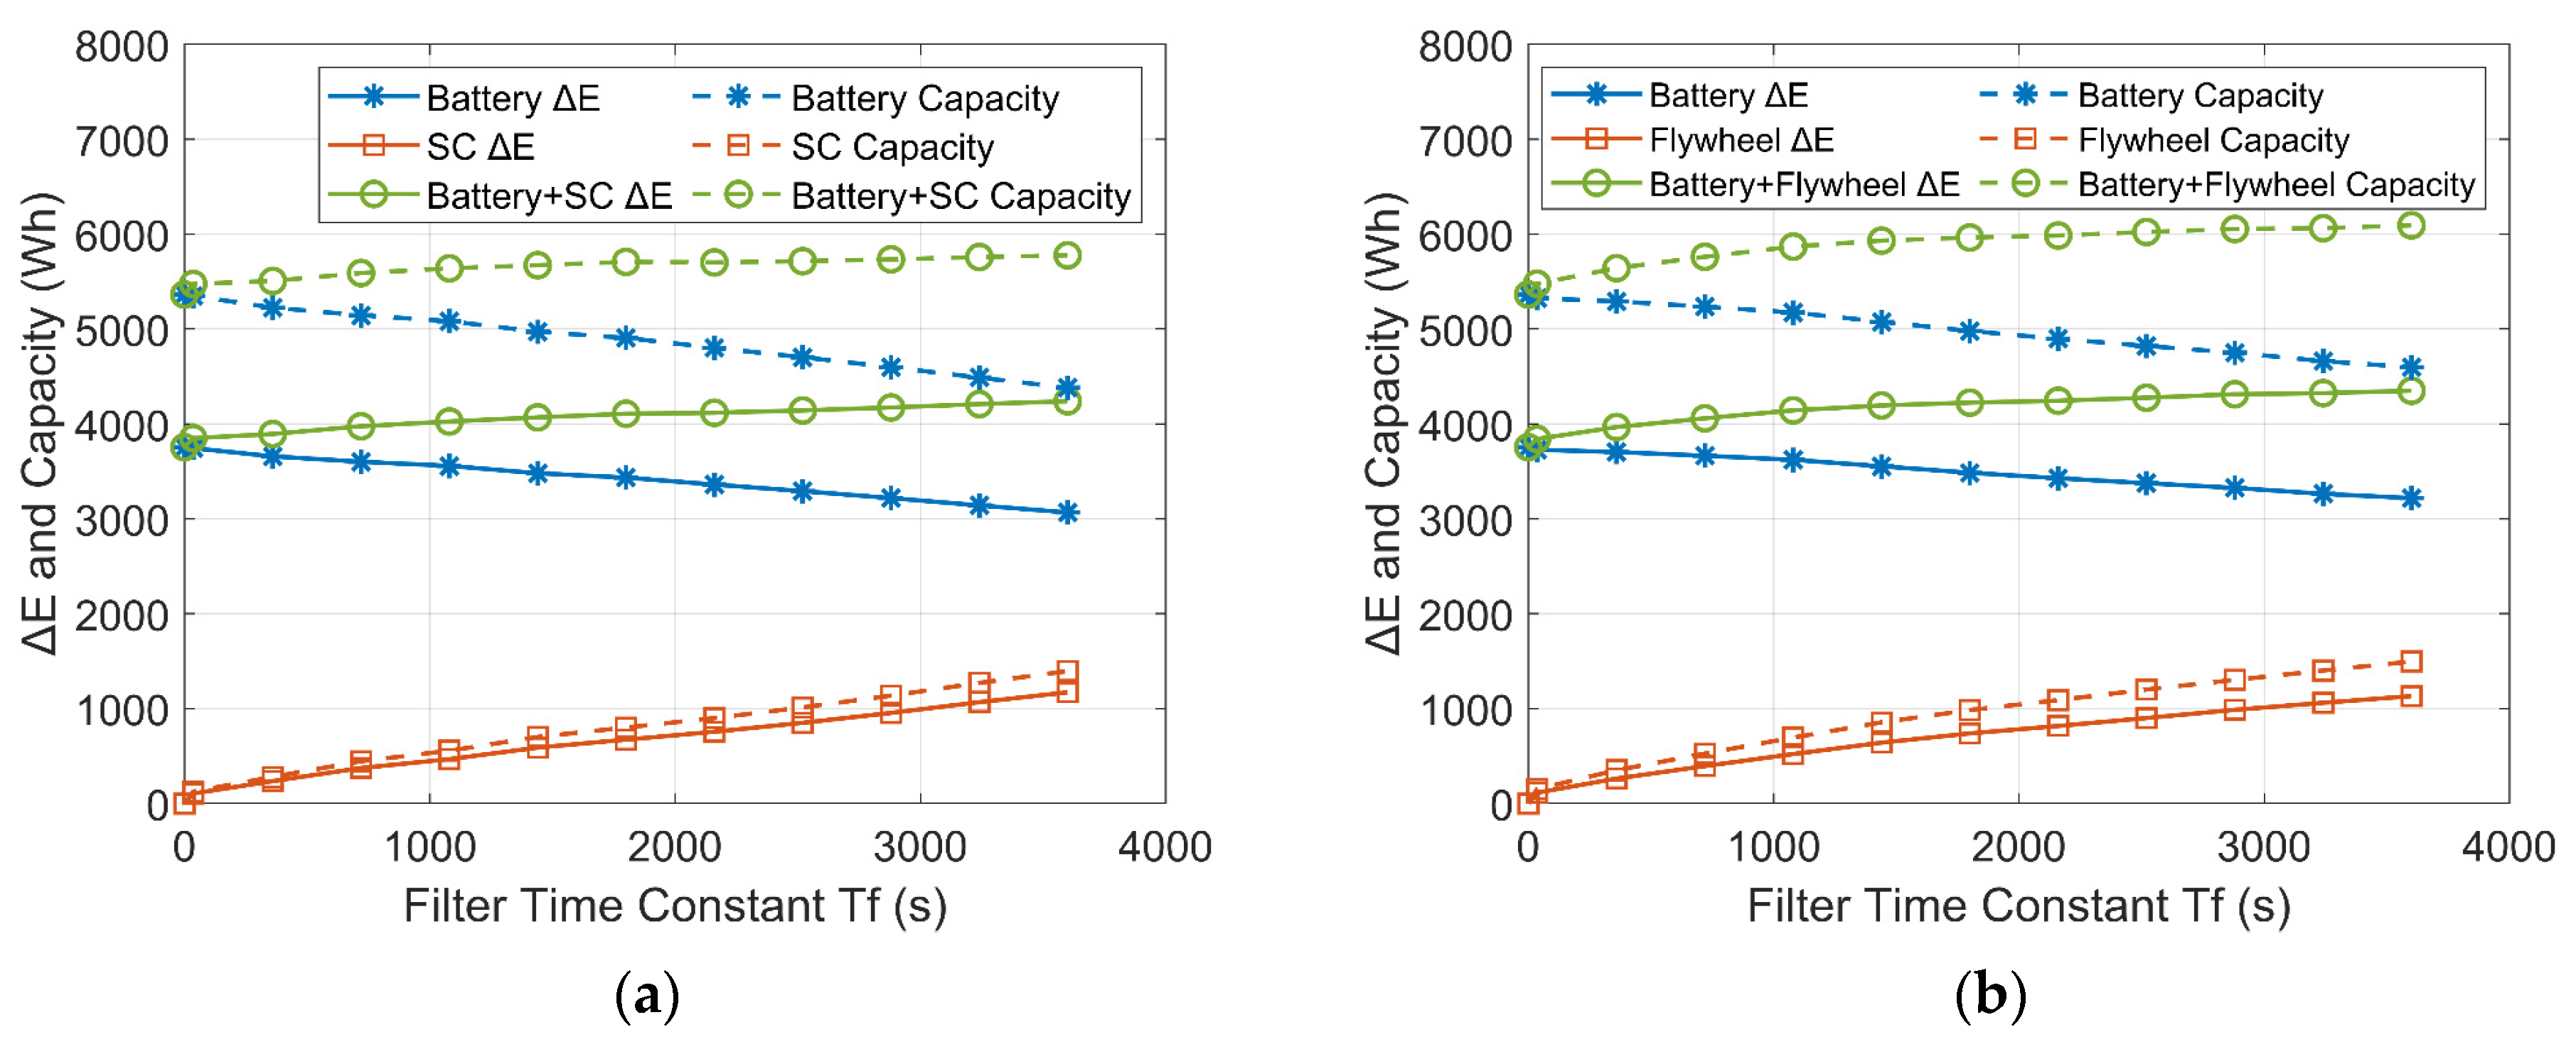
3. Analysis of Oversized Capacity of HESS

This section discusses and analyzes an example to explore the energy exchange between the individual ESDs and the relevant impact on the required capacity and the energy loss of the HESS.

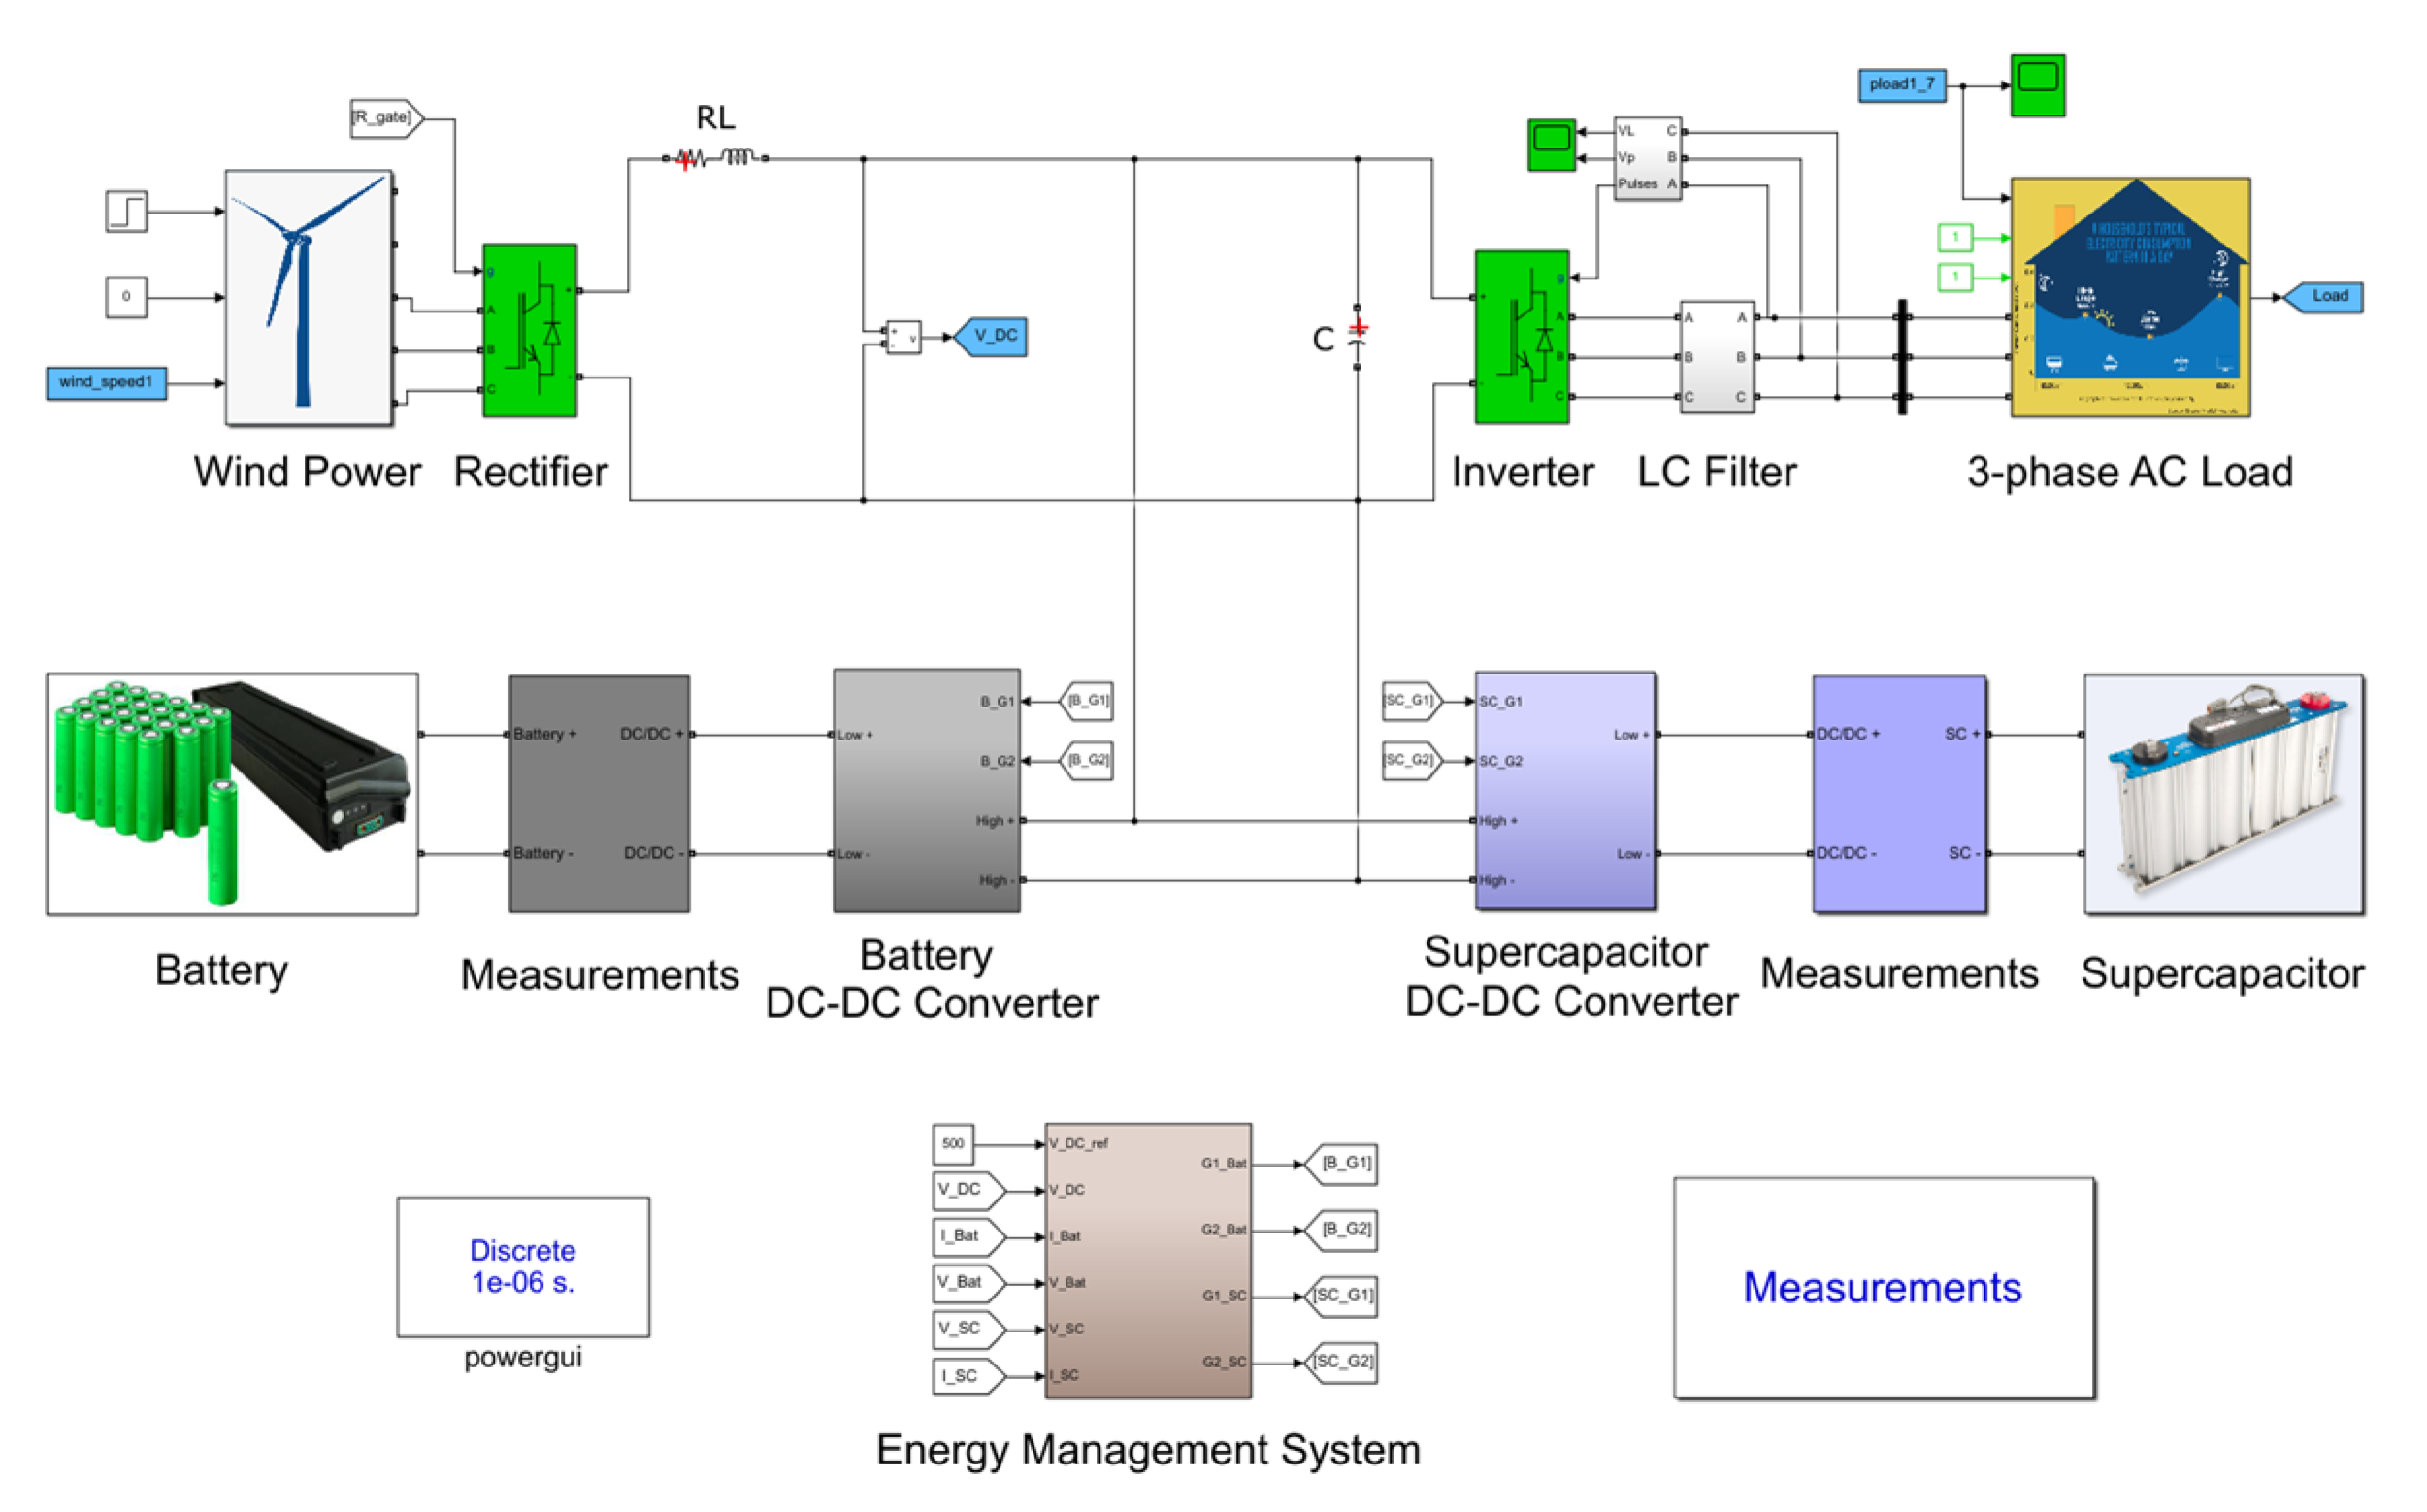
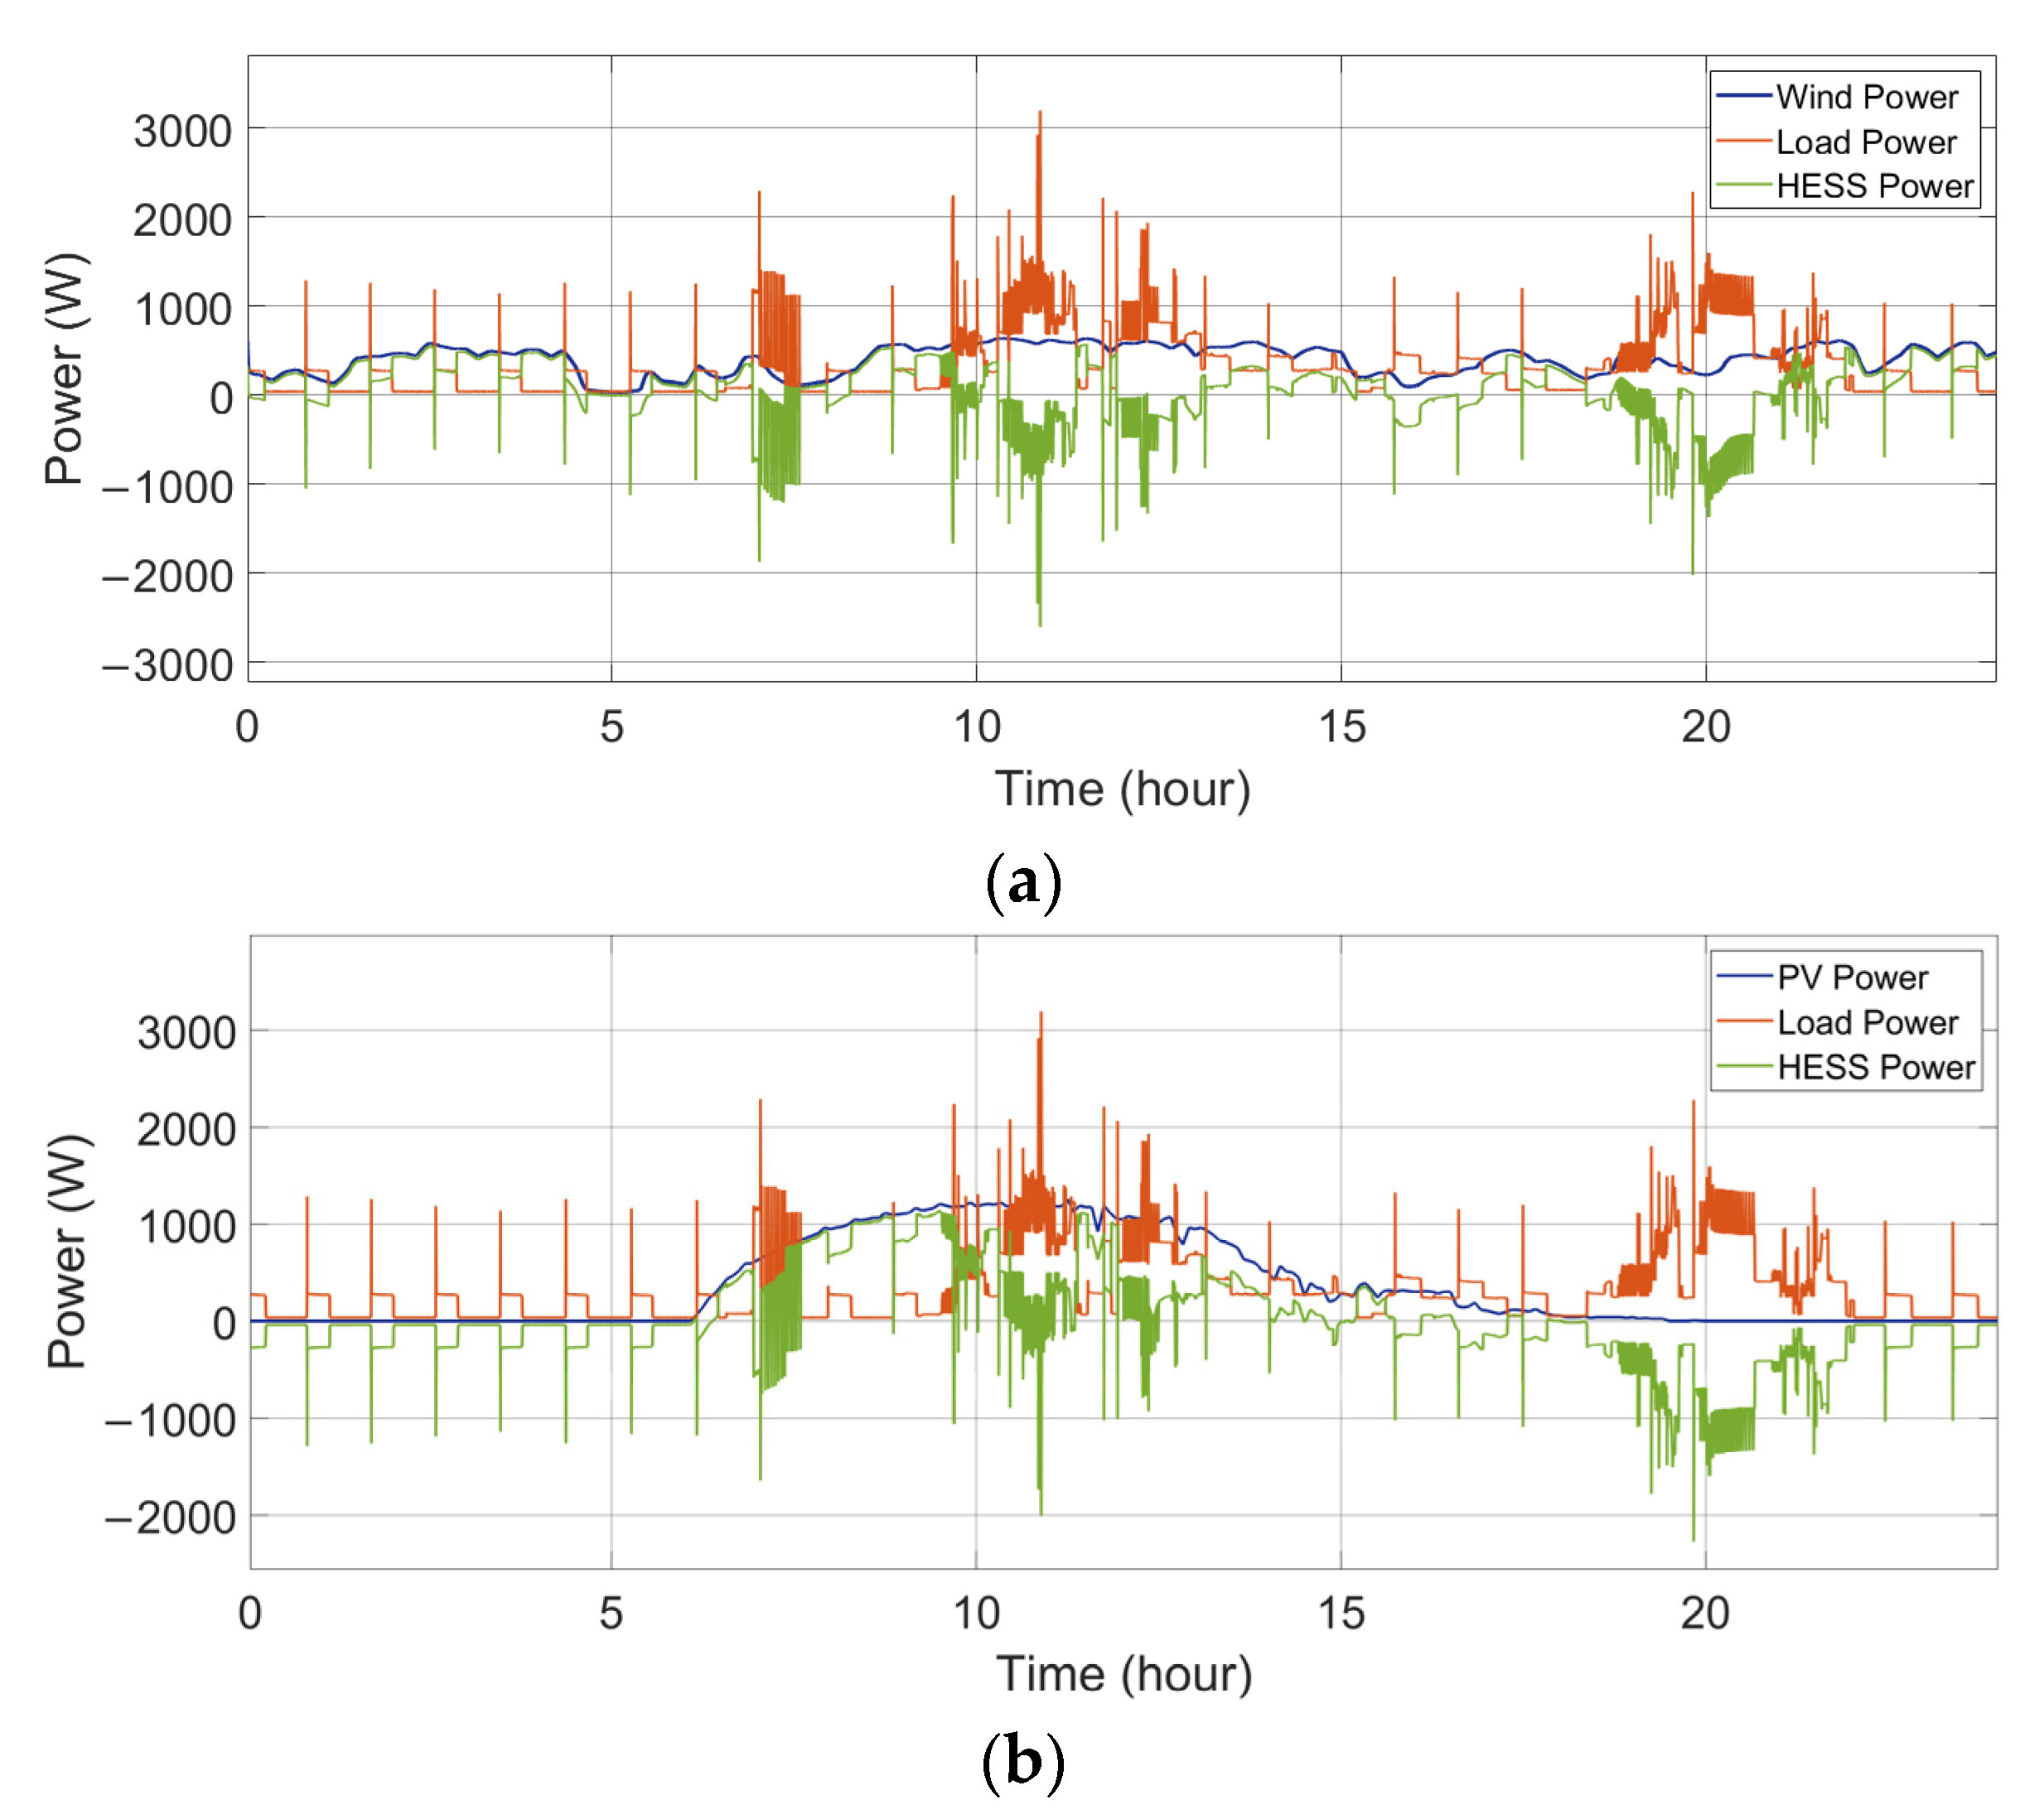
3.1. Analysis Based on a Simulated Model

A simulated example is presented and analyzed to illustrate the cause of the oversized HESS capacity. The simulation was built in the SimPowerSystem toolbox on the MATLAB-Simulink platform [21]. Figure 3 shows the simulation of the battery-SC HESS in a wind-powered household-prosumer system.
When the output power generated by the RES surpasses the load power, the HESS absorbs the excess power. By contrast, the HESS discharges when the RES output power fails to meet the power demand. The wind speed data used in the simulation were obtained from the Sotavento wind farm [22] in Spain. A 600 W wind turbine was built in the simulation. The PV-powered generation data were obtained from a 2.4 kW PV array located in southern Sweden [23]. The residential load data profiles were obtained from the Reference Energy Disaggregation Data Set (REDD) [24]. The HESS consists of a 7.2 kWh battery bank and a 1.8 kWh secondary ESD pack (SC or flywheel). The low-pass filter controller introduced in Section 2.2 is used to build the energy management strategy in the simulation.
Figure 4 shows the wind output power, the consumed load power, and the power handled by the HESS.
The total power flow that needs to be handled by the HESS, ΔP, can be written as:
Δ P = P R E S P l o a d P l o s s
In the system, the power losses originate from the converters and the ESDs:
P l o s s e s = ( 1 η 1 ) P R E S + ( 1 η 2 η 2 ) P l o a d + P D C / D C _ l o s s + P E S D _ l o s s
To calculate the losses from the converters, the efficiency parameters η1, η2, and η3 are assumed as fixed values. Both the converter efficiencies η1 and η2 are set to 97% [25] and the bi-directional DC/DC converter efficiency η3 is set to 95% [26].
In addition, the losses of the bi-directional DC/DC converters are calculated as:
P D C / D C _ l o s s = { ( 1 η 3 ) | P E S D | ,   f o r   P E S D < 0 ( 1 η 3 η 3 ) | P E S D | ,   f o r   P E S D 0
where PESD represents the power flows of the ESD. The ESD releases power into the system when PESD < 0 and is charged when PESD ≥ 0.
In HESSs, the losses of the ESDs mainly stem from cycle losses and self-discharge losses. The series internal resistance causes the cycle losses of the ESDs during charging and discharging. In addition, the equivalent parallel resistance represents self-discharge losses and affects the long-term performance of the ESDs. Most ESDs with high power density, such as SCs and flywheels, suffer from high leakage rates, which produce a high self-discharge rate.
P E S D _ l o s s = P c y c l e _ l o s s + P s e l f - d i s _ l o s s
A comparison of the single-battery ESS and the HESS is presented to illustrate the HESS’s behavior. As shown in Figure 5a and Figure 6a, in both the wind-powered and PV-powered household-prosumer systems, when Tf of the low-pass filter is 0 s (single-battery ESS), there is only the battery to handle the entire power demand and the high power peaks. These power peaks correspond to large discharge current rates, which reduce the battery’s lifespan. When the time constant Tf is 1800 s, the power flow of the battery in the HESS is smooth. The battery handles fewer power peaks and experiences fewer current polarity reversals. Meanwhile, the SC (or the flywheel) responds to high-frequency power fluctuations, as shown in Figure 5b and Figure 6b. In addition, due to the different power losses in the HESSs, there are slight differences between the power flows in the battery-SC HESS and the battery-flywheel HESS, even though their Tf are the same.
In addition, the phase shift of the low-pass filter leads to a time delay in the battery power compared with the original power demand (since the primary ESD is set to respond slowly to the power demand). For example, the time delay, Δt1 and Δt2, can be observed at the zero crossing points of the battery power. One ESD charges while the other ESD discharges during these time intervals:
P b a t > 0 ,   P S C / f l y w h e e l < 0 ,   or   P b a t < 0 ,   P S C / f l y w h e e l > 0 , { P b a t + P S C / f l y w h e e l = Δ P | P b a t | + | P S C / f l y w h e e l | > | Δ P |
The sum of the absolute values of the ESDs is larger than the absolute value of the original power demand ΔP. It is concluded that there is an energy exchange between the two ESDs. Instead of serving the DC bus, the ESDs deliver energy to each other. Thus, it is unnecessary and not beneficial to the HESS.
The energy states of the individual ESDs in the HESS are plotted in Figure 7 and Figure 8. The deviation between the maximum point and the minimum point of the curve is:
Δ E = E max E min
where ΔE is thus the maximum deviation of the energy states over the testing interval, i.e., the available capacity of the ESD to meet the power demand. The ΔE of the ESD determines the required installed capacity and thus the cost of the HESS, which are discussed in Section 4. In addition, it should be noted that, due to the comparison between various energy storage technologies, the unit representing the capacities of the different ESDs is uniformly converted to represent energy (Wh).
Figure 7a and Figure 8a present the battery energy states for the batteries in the ESS combinations in the wind-powered and PV-powered household-prosumer systems, respectively. As can be seen, the required available capacities, ΔE, of the batteries are reduced when Tf increases. In addition, the required ΔE of the secondary ESDs are plotted in Figure 7b and Figure 8b. The required available capacity ΔE of the battery is reduced by the SC/flywheel, since the secondary ESD responds to the high-frequency power demand. If there is no energy exchange between the primary and secondary ESDs, the total ΔE of the HESS should preferably be the same as that of the single-battery ESS (assuming other losses to be equal). Nevertheless, due to the unavoidable time delay in the power flow, the total ΔE of the HESS is larger than that of the single-battery ESS, which implies that the HESS is oversized.
Furthermore, the loss originates in the DC/DC converters and the ESDs. The amplitudes of the battery power and the SC/flywheel power (|Pbat| and |PSC/flywheel|) determine the losses of the converters and the cycle losses of the ESDs. The increased power flow caused by the unnecessary energy exchange leads to increased losses in the DC/DC converters. In addition, the cycle losses of the ESDs increase due to the increased throughput power of the ESDs. Additionally, the self-discharge loss of the SC/flywheel affects the loss of the HESS. The energy loss of the HESS is calculated from the components and is reflected in the initial points and the end points of the energy curves (see Figure 7 and Figure 8). The losses in different ESS combinations are listed in Table 1.
Therefore, the unnecessary energy exchange between the primary and the secondary ESDs mainly results in two consequences:
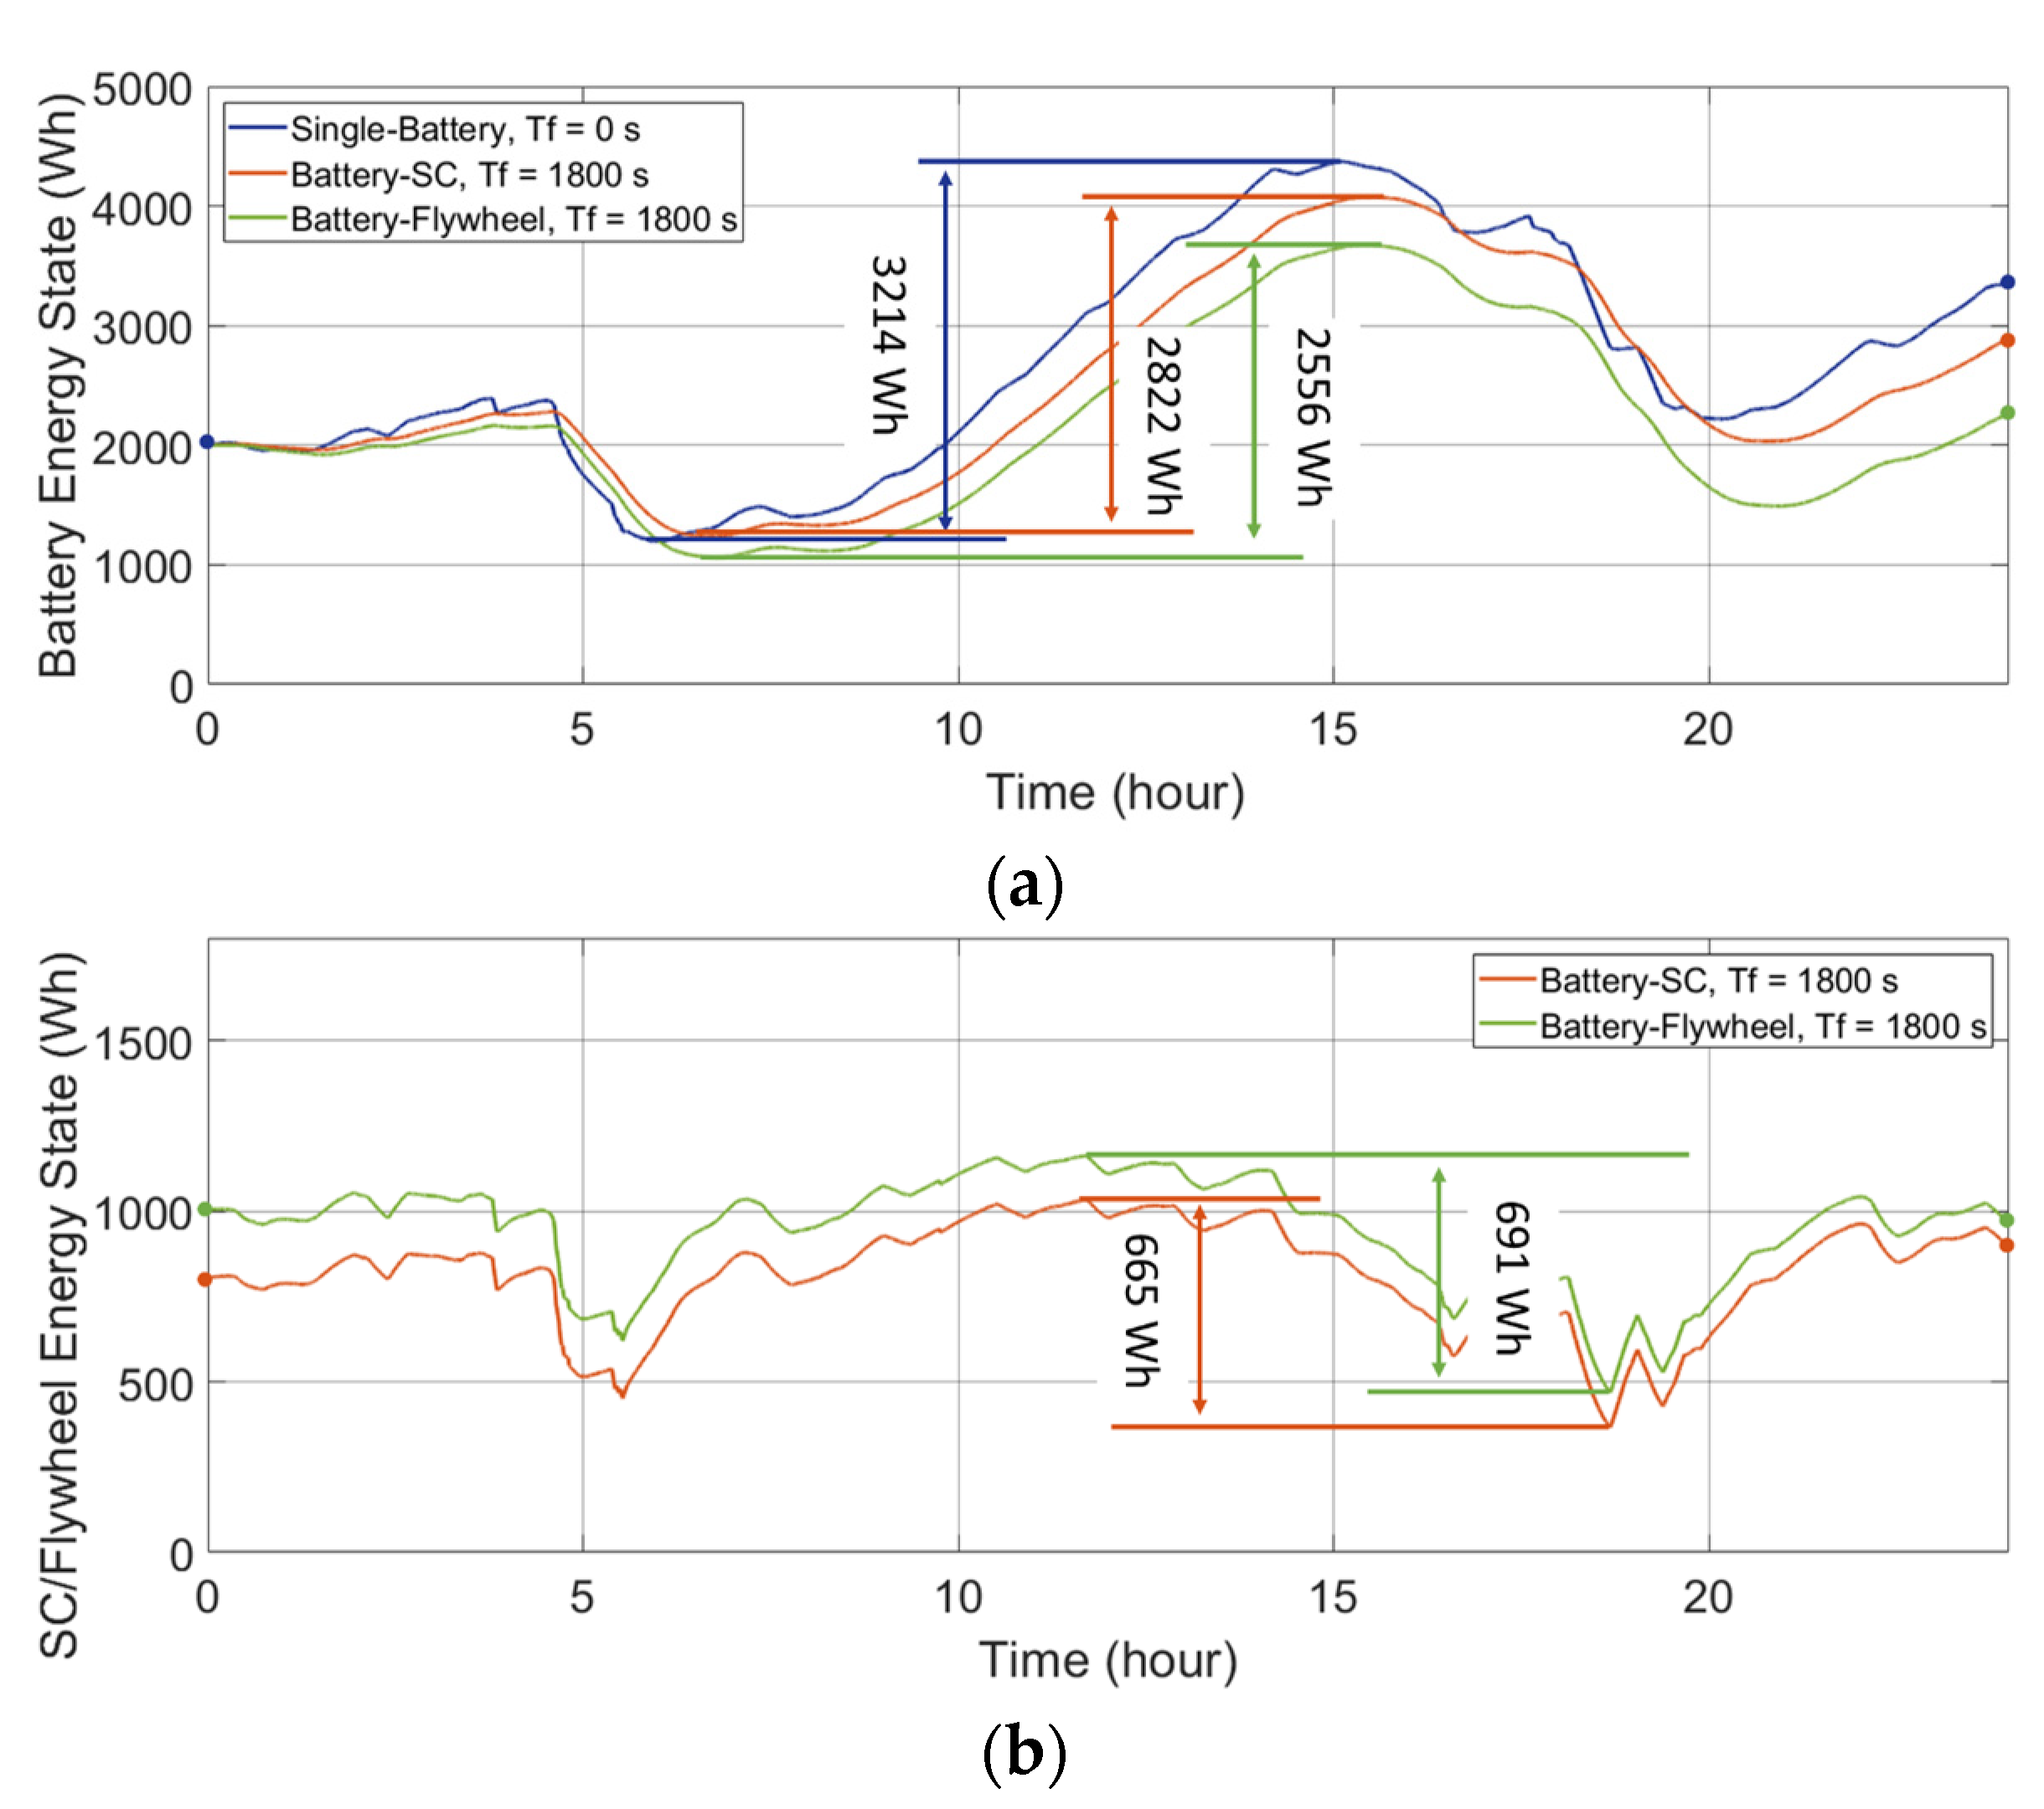
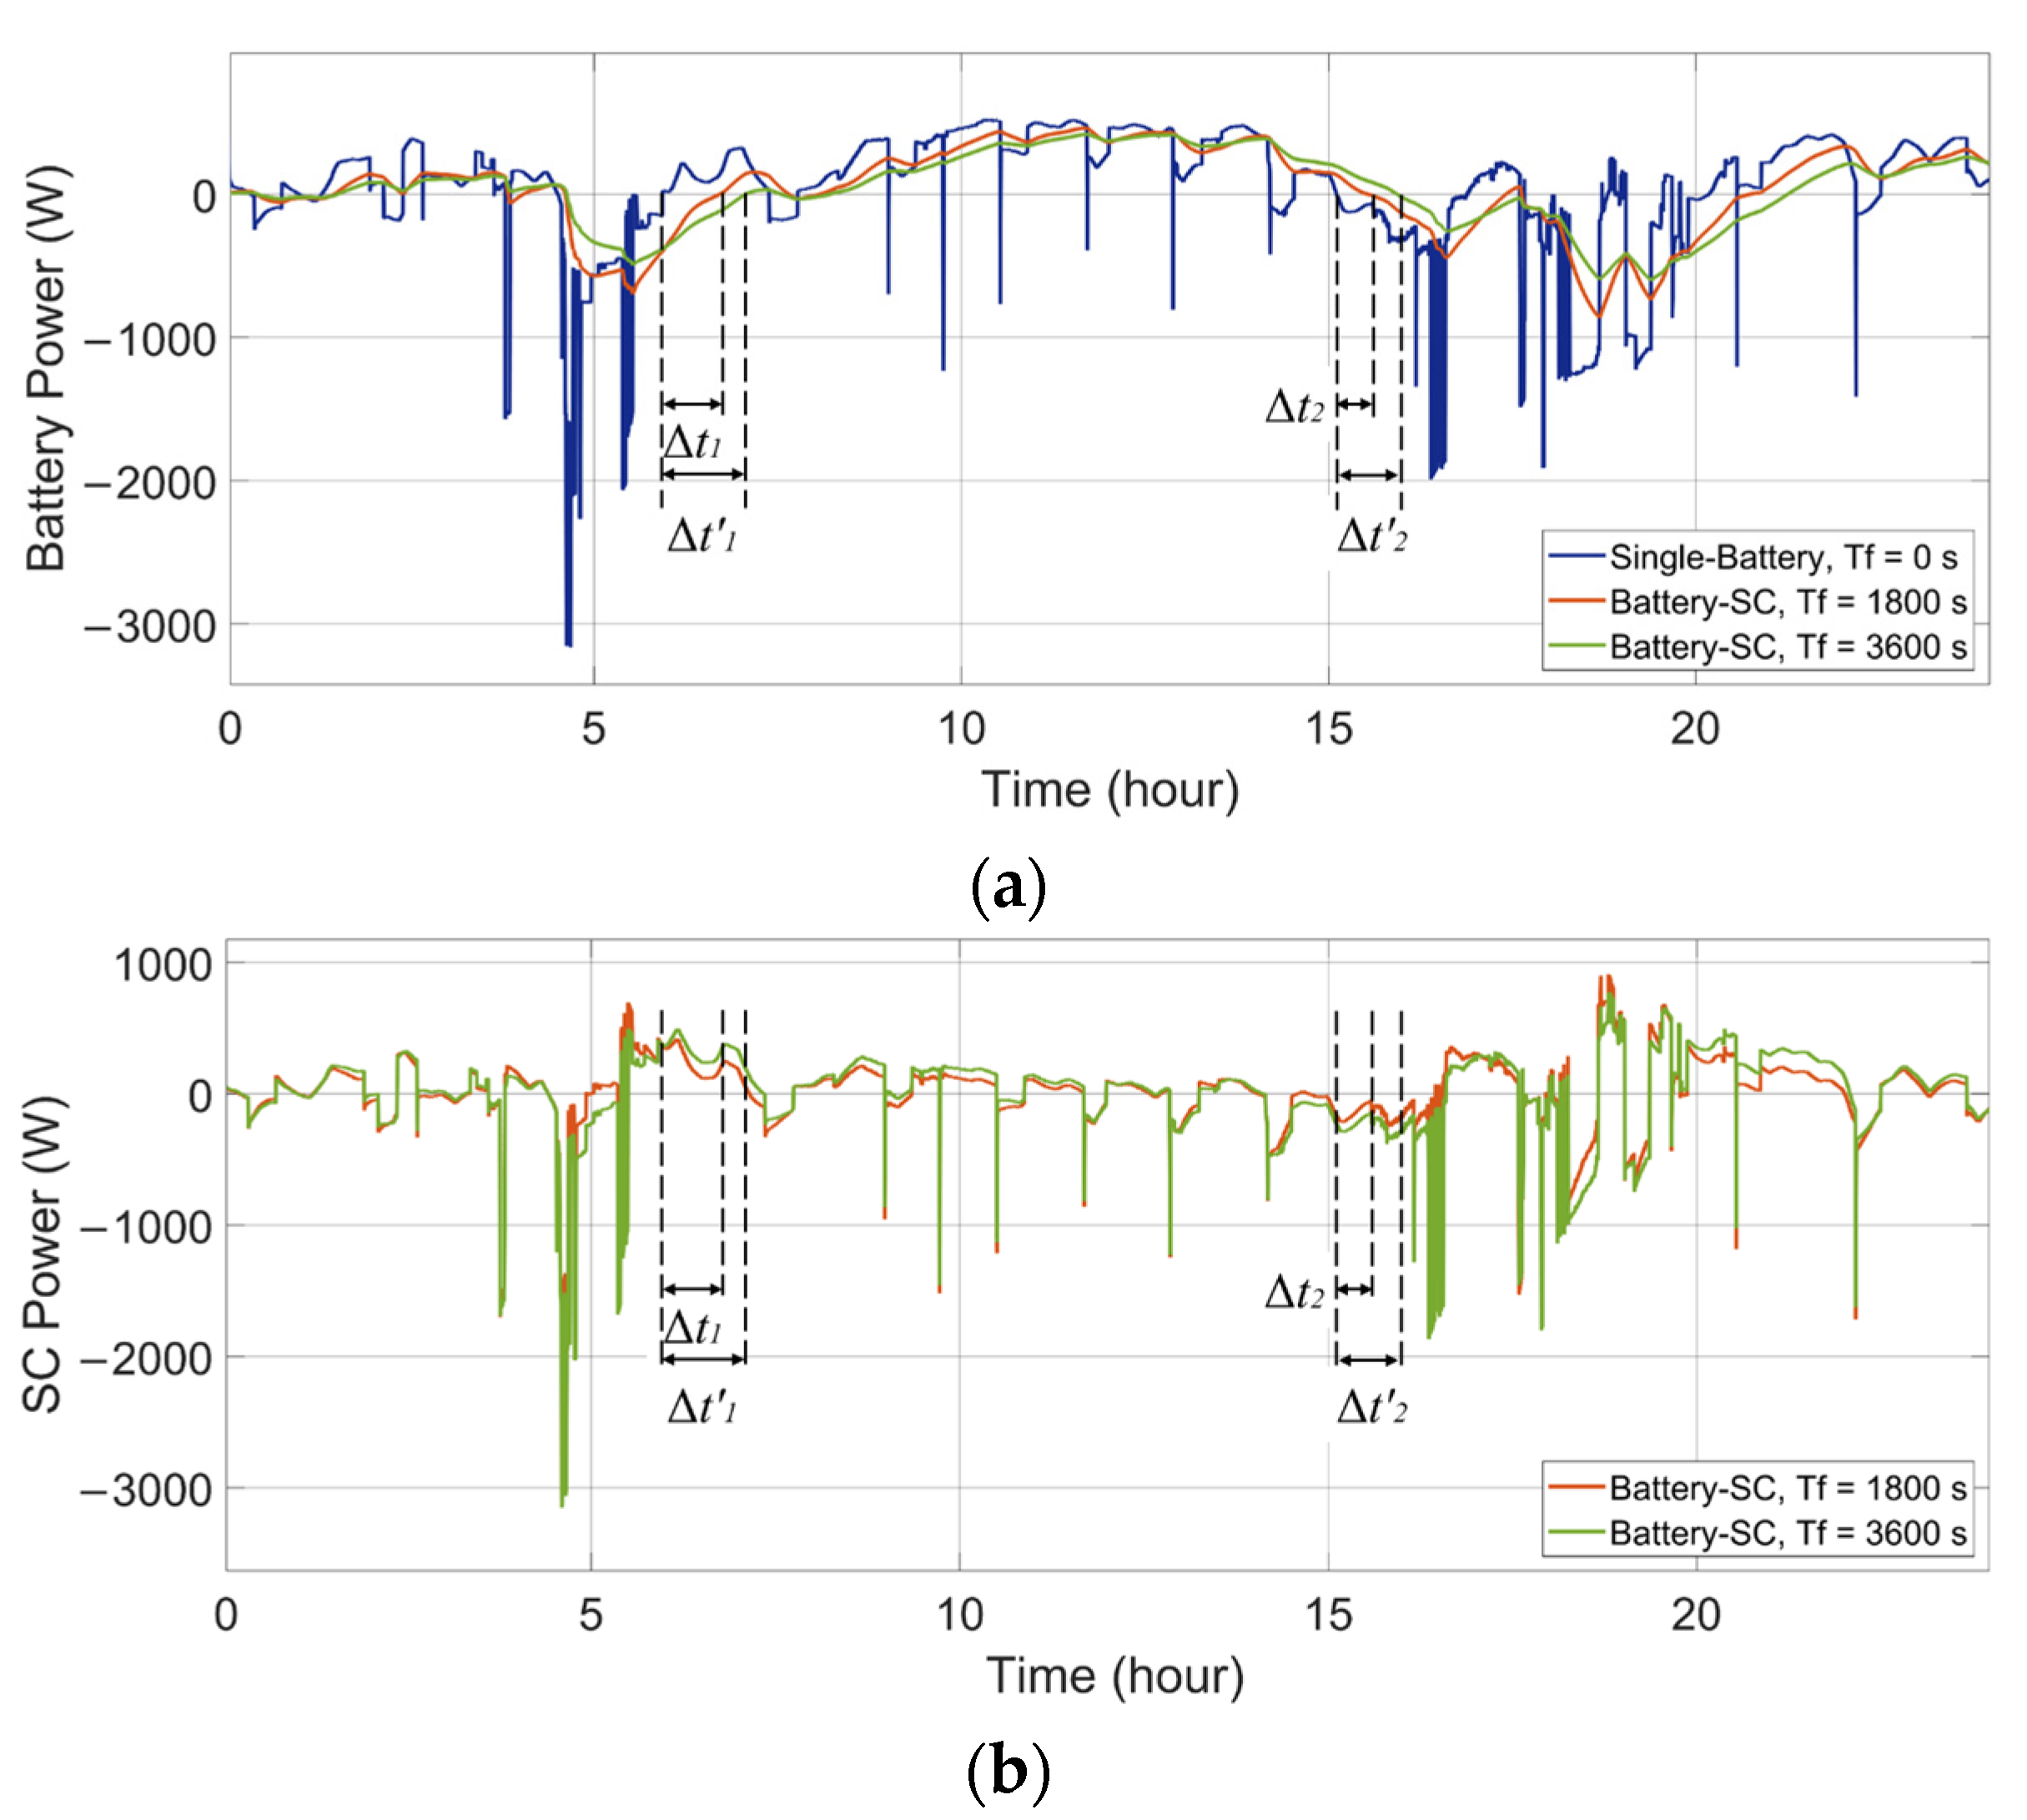
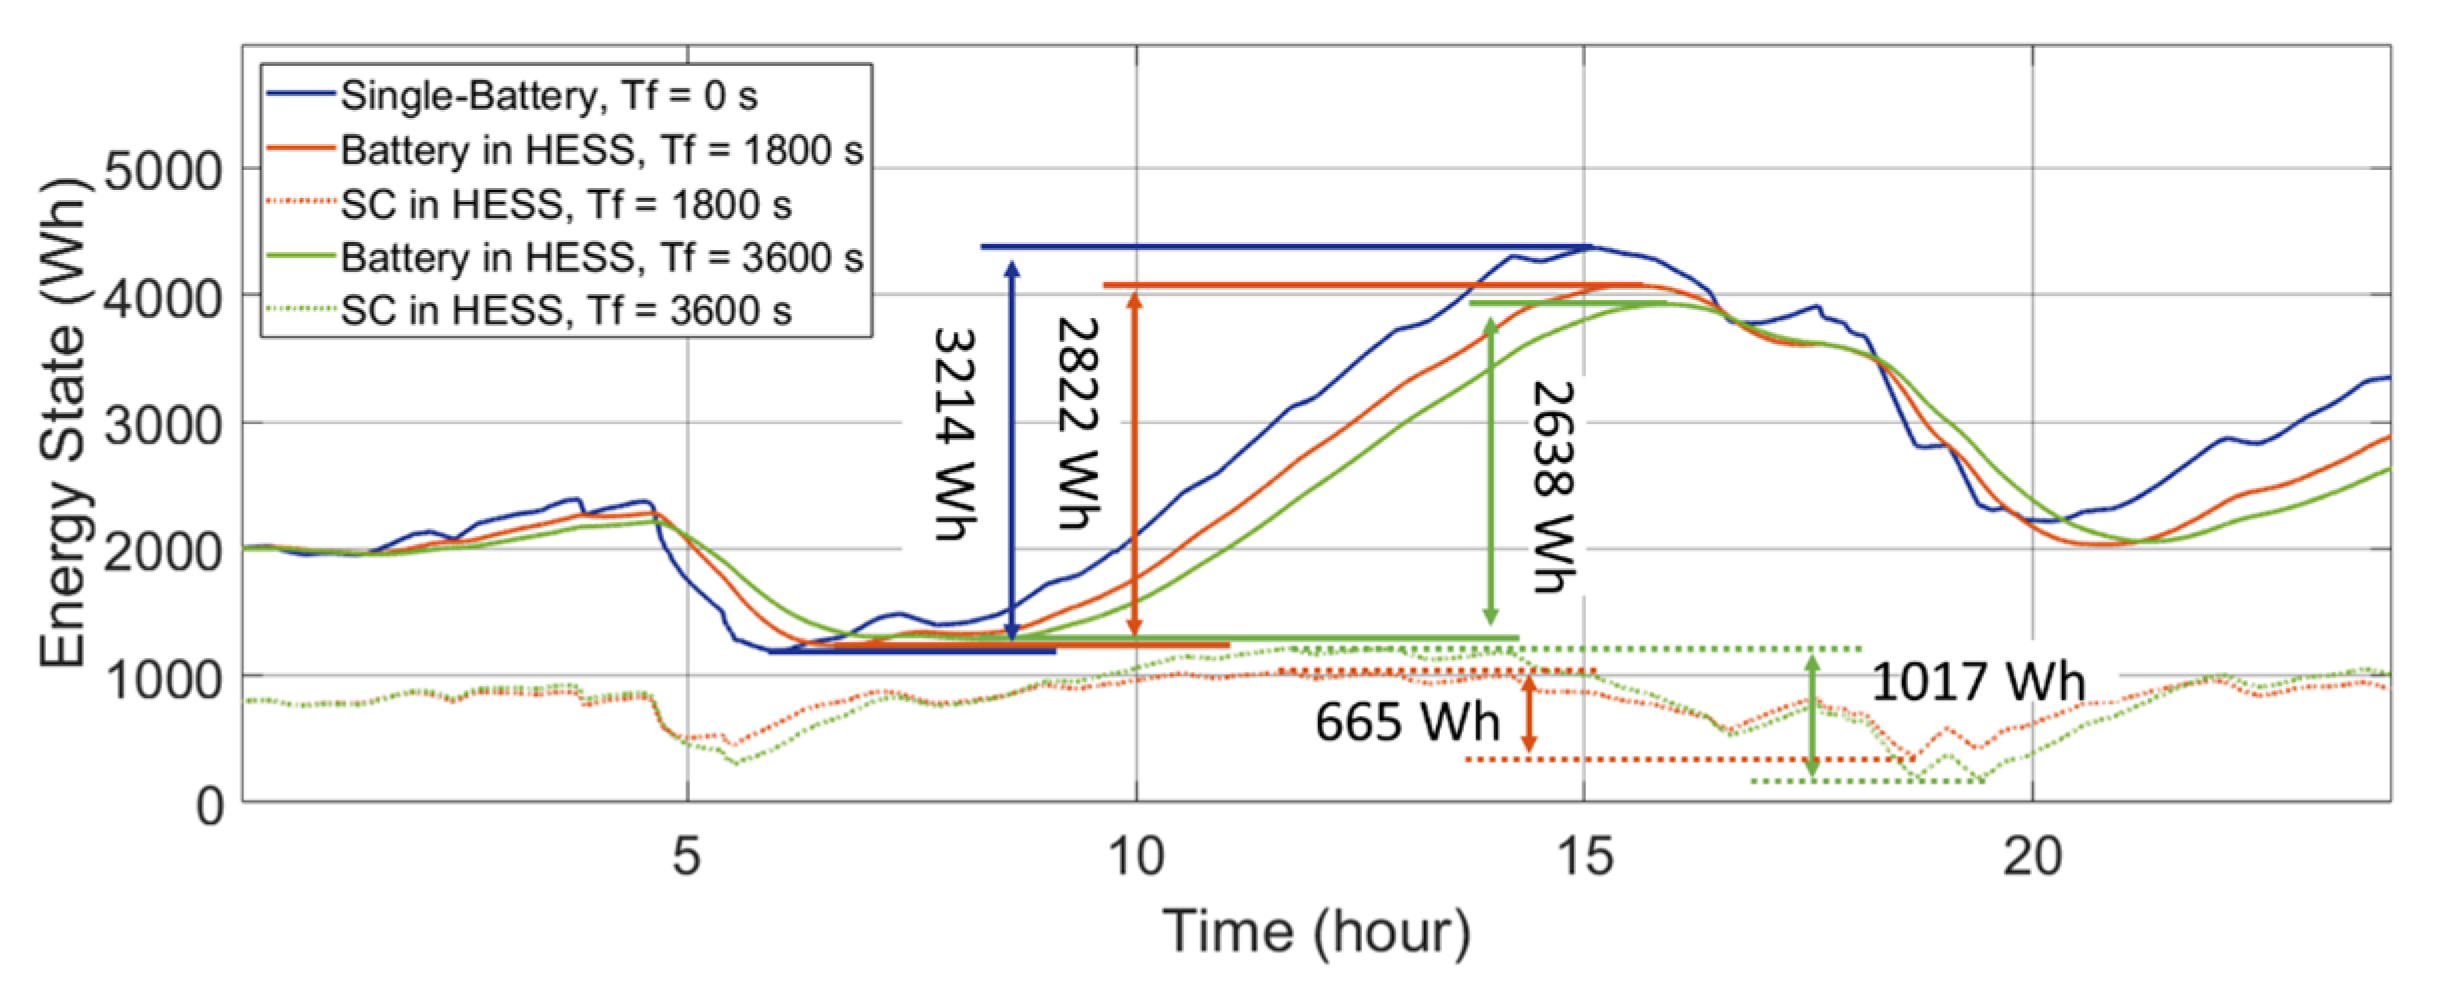
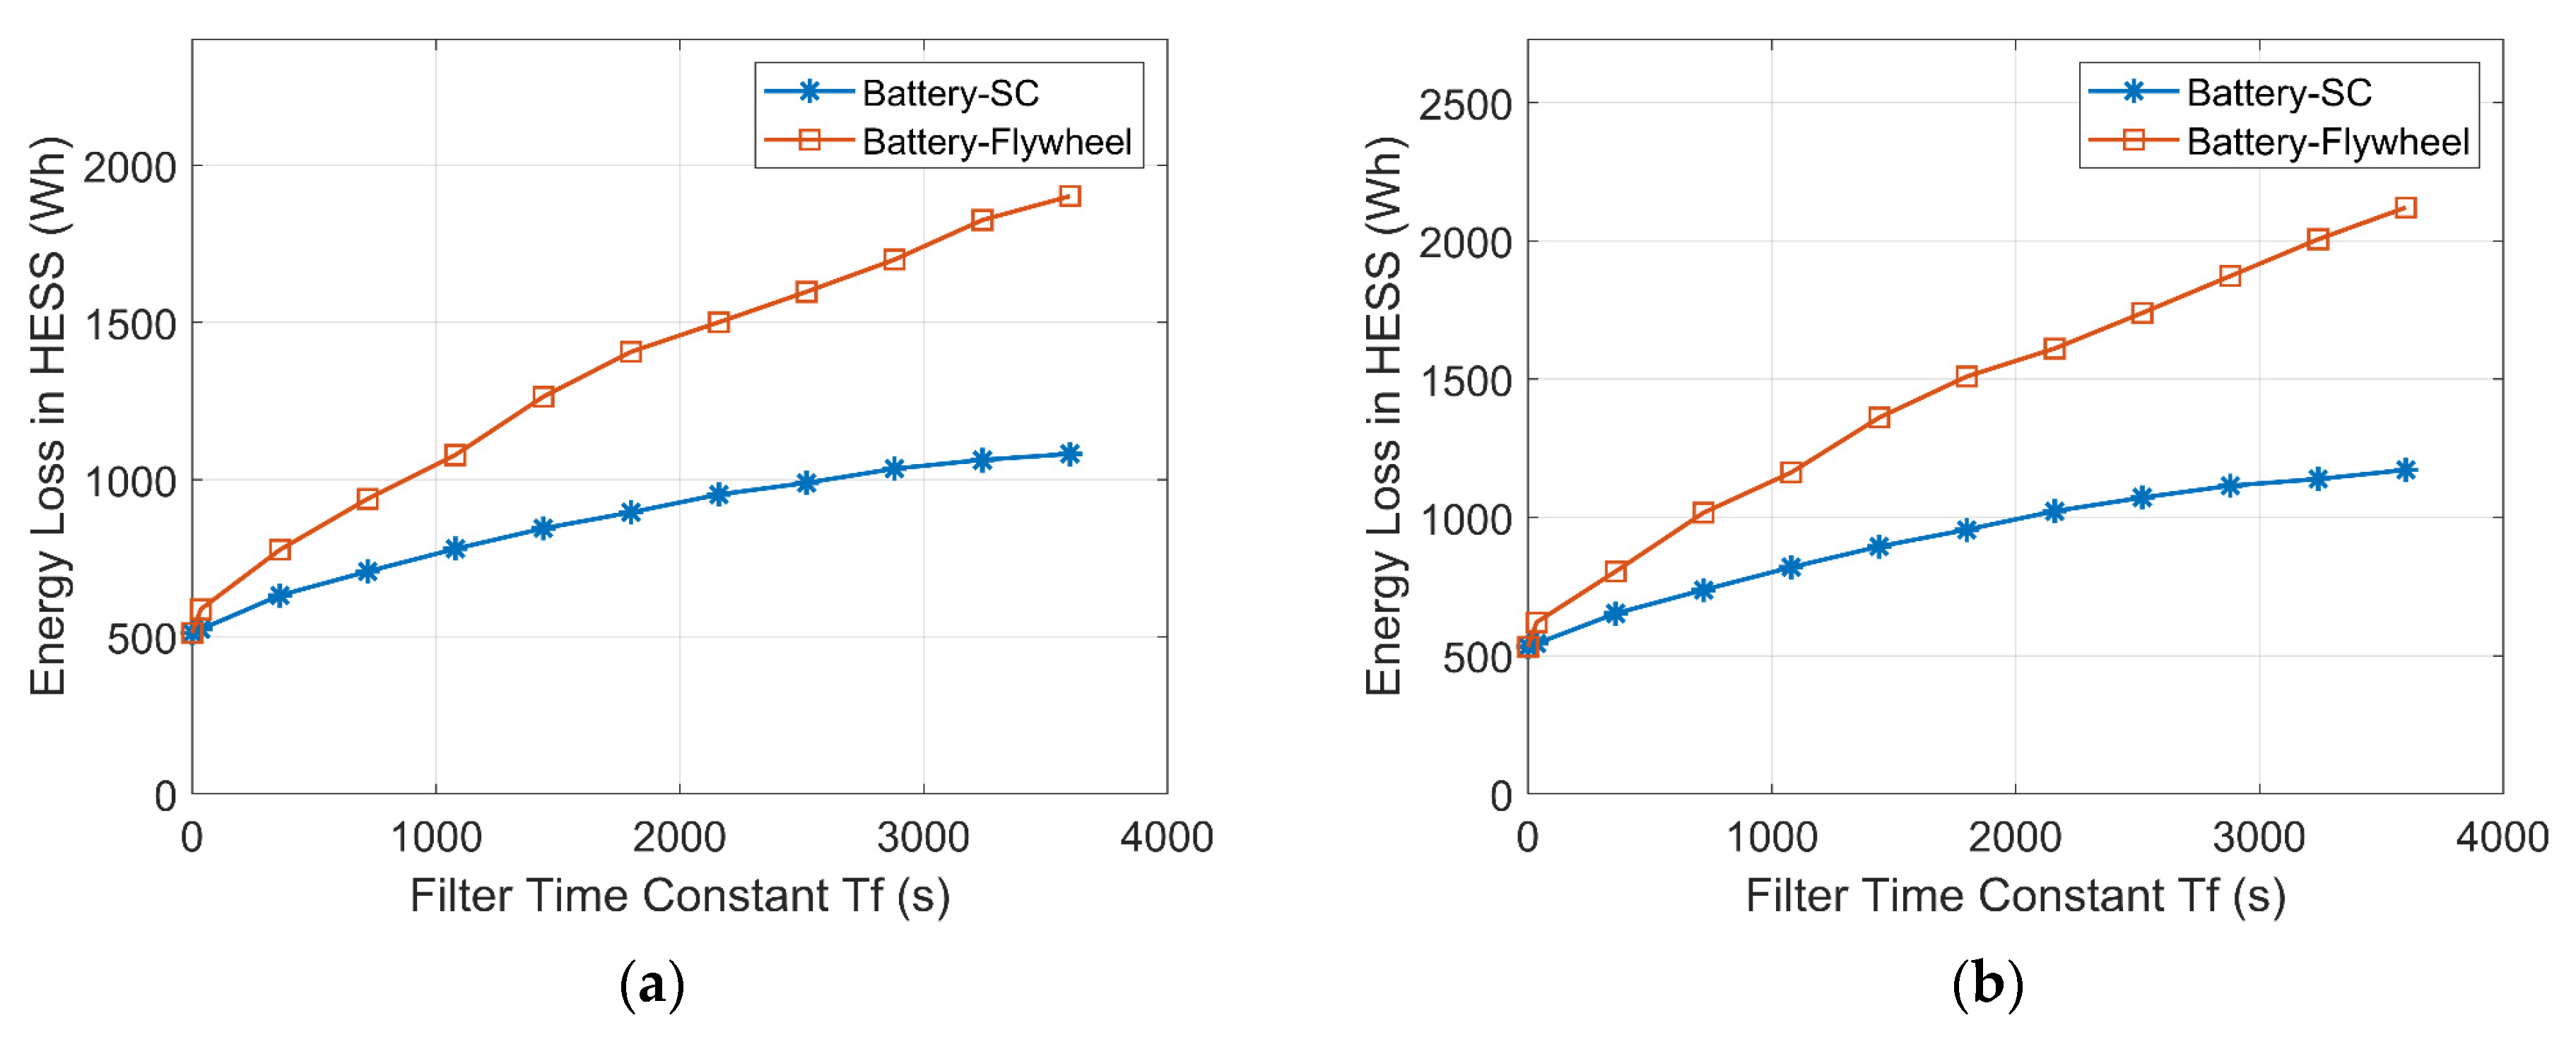
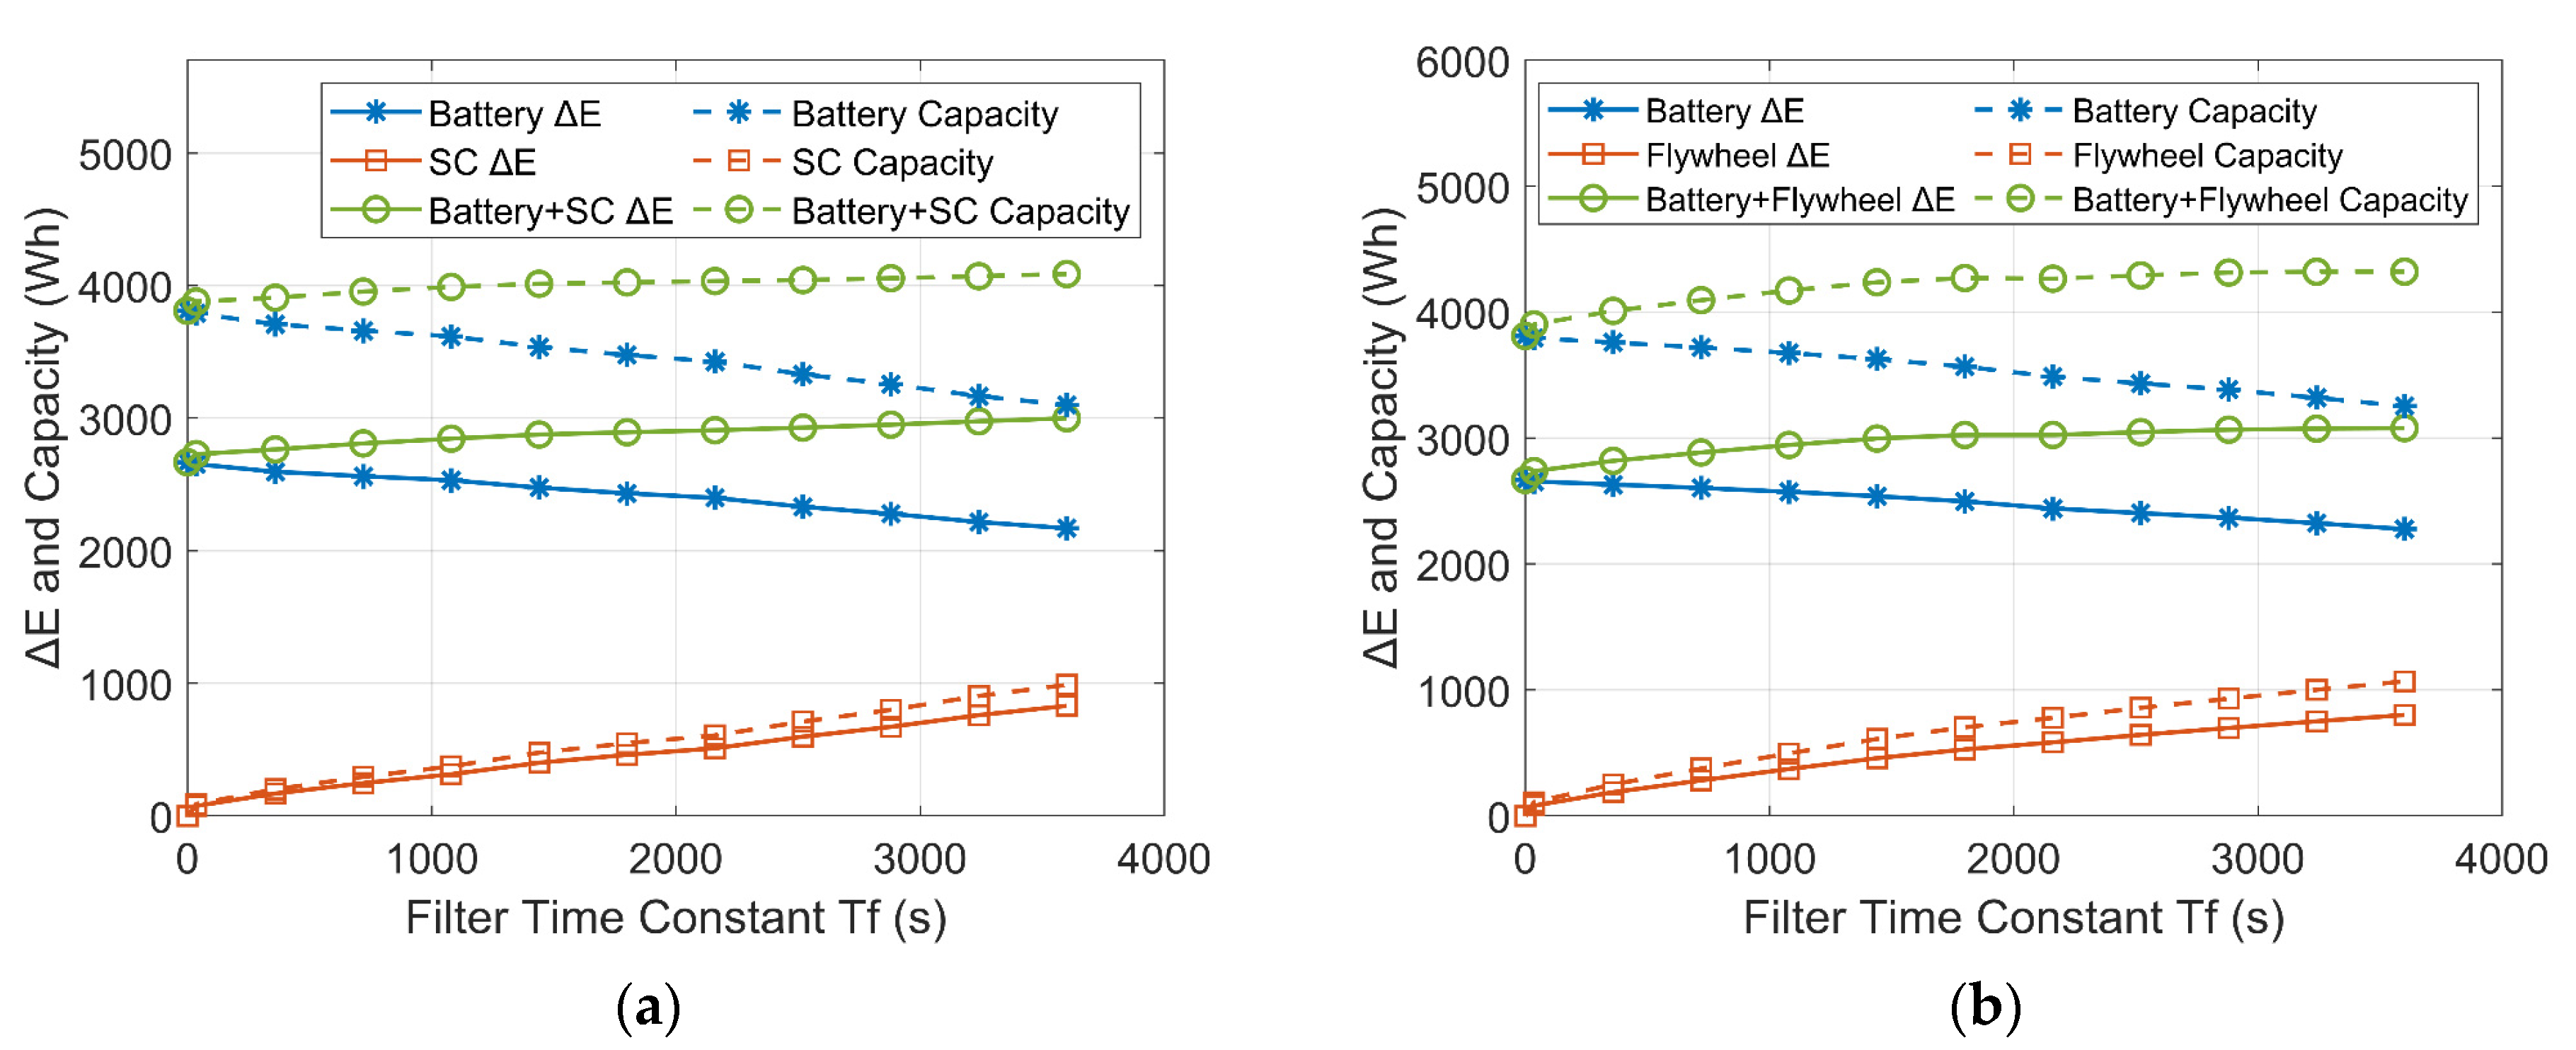
  • The required capacity of the HESS is increased. Some of the capacity is wasted on the energy exchange within the HESS, and thus the HESS needs to be oversized.
  • There is a larger energy loss due to the increased power flows in the HESS.
In this paper, a low-pass filter controller was applied to explore the impact of the energy exchange between the ESDs on HESSs. Nevertheless, the phase shift is unavoidable in other liner filters.
Another important factor that affects HESSs is the time constant of the low-pass filter controller. It determines the power distribution of the HESS and the time delay of the power flow. Here, the battery-SC HESS in the wind-powered household-prosumer system is shown as an example to analyze the impact of the time constant. Figure 9 shows the power flows of the ESDs corresponding to different Tf in the low-pass filter. It can be seen that the time delay increases when Tf. increases. The larger time intervals Δt1 and Δt2 indicate that the power handled by the primary ESD is lower and smoother. Meanwhile, the secondary ESD handles more of the power peaks. The corresponding energy states of the ESDs are shown in Figure 10.
Although the required ΔE of the battery decreases with a larger Tf, the total required ΔE of the HESS increases since the increased time delay increases the energy exchange between the ESDs. Here, in the single-battery ESS, a battery with 3214 Wh of available capacity meets the power demand. However, with Tf set to 1800 s and 3600 s in the battery-SC HESS, the required total ΔE increases to 3487 Wh and 3655 Wh, respectively. Thus, the required capacity of the HESS increases with the increasing Tf. In addition, due to the increased energy exchange within the HESS, the throughput powers of the ESDs increase. Thus, the energy loss of the HESS increases with increased Tf. The results are listed in Table 2.

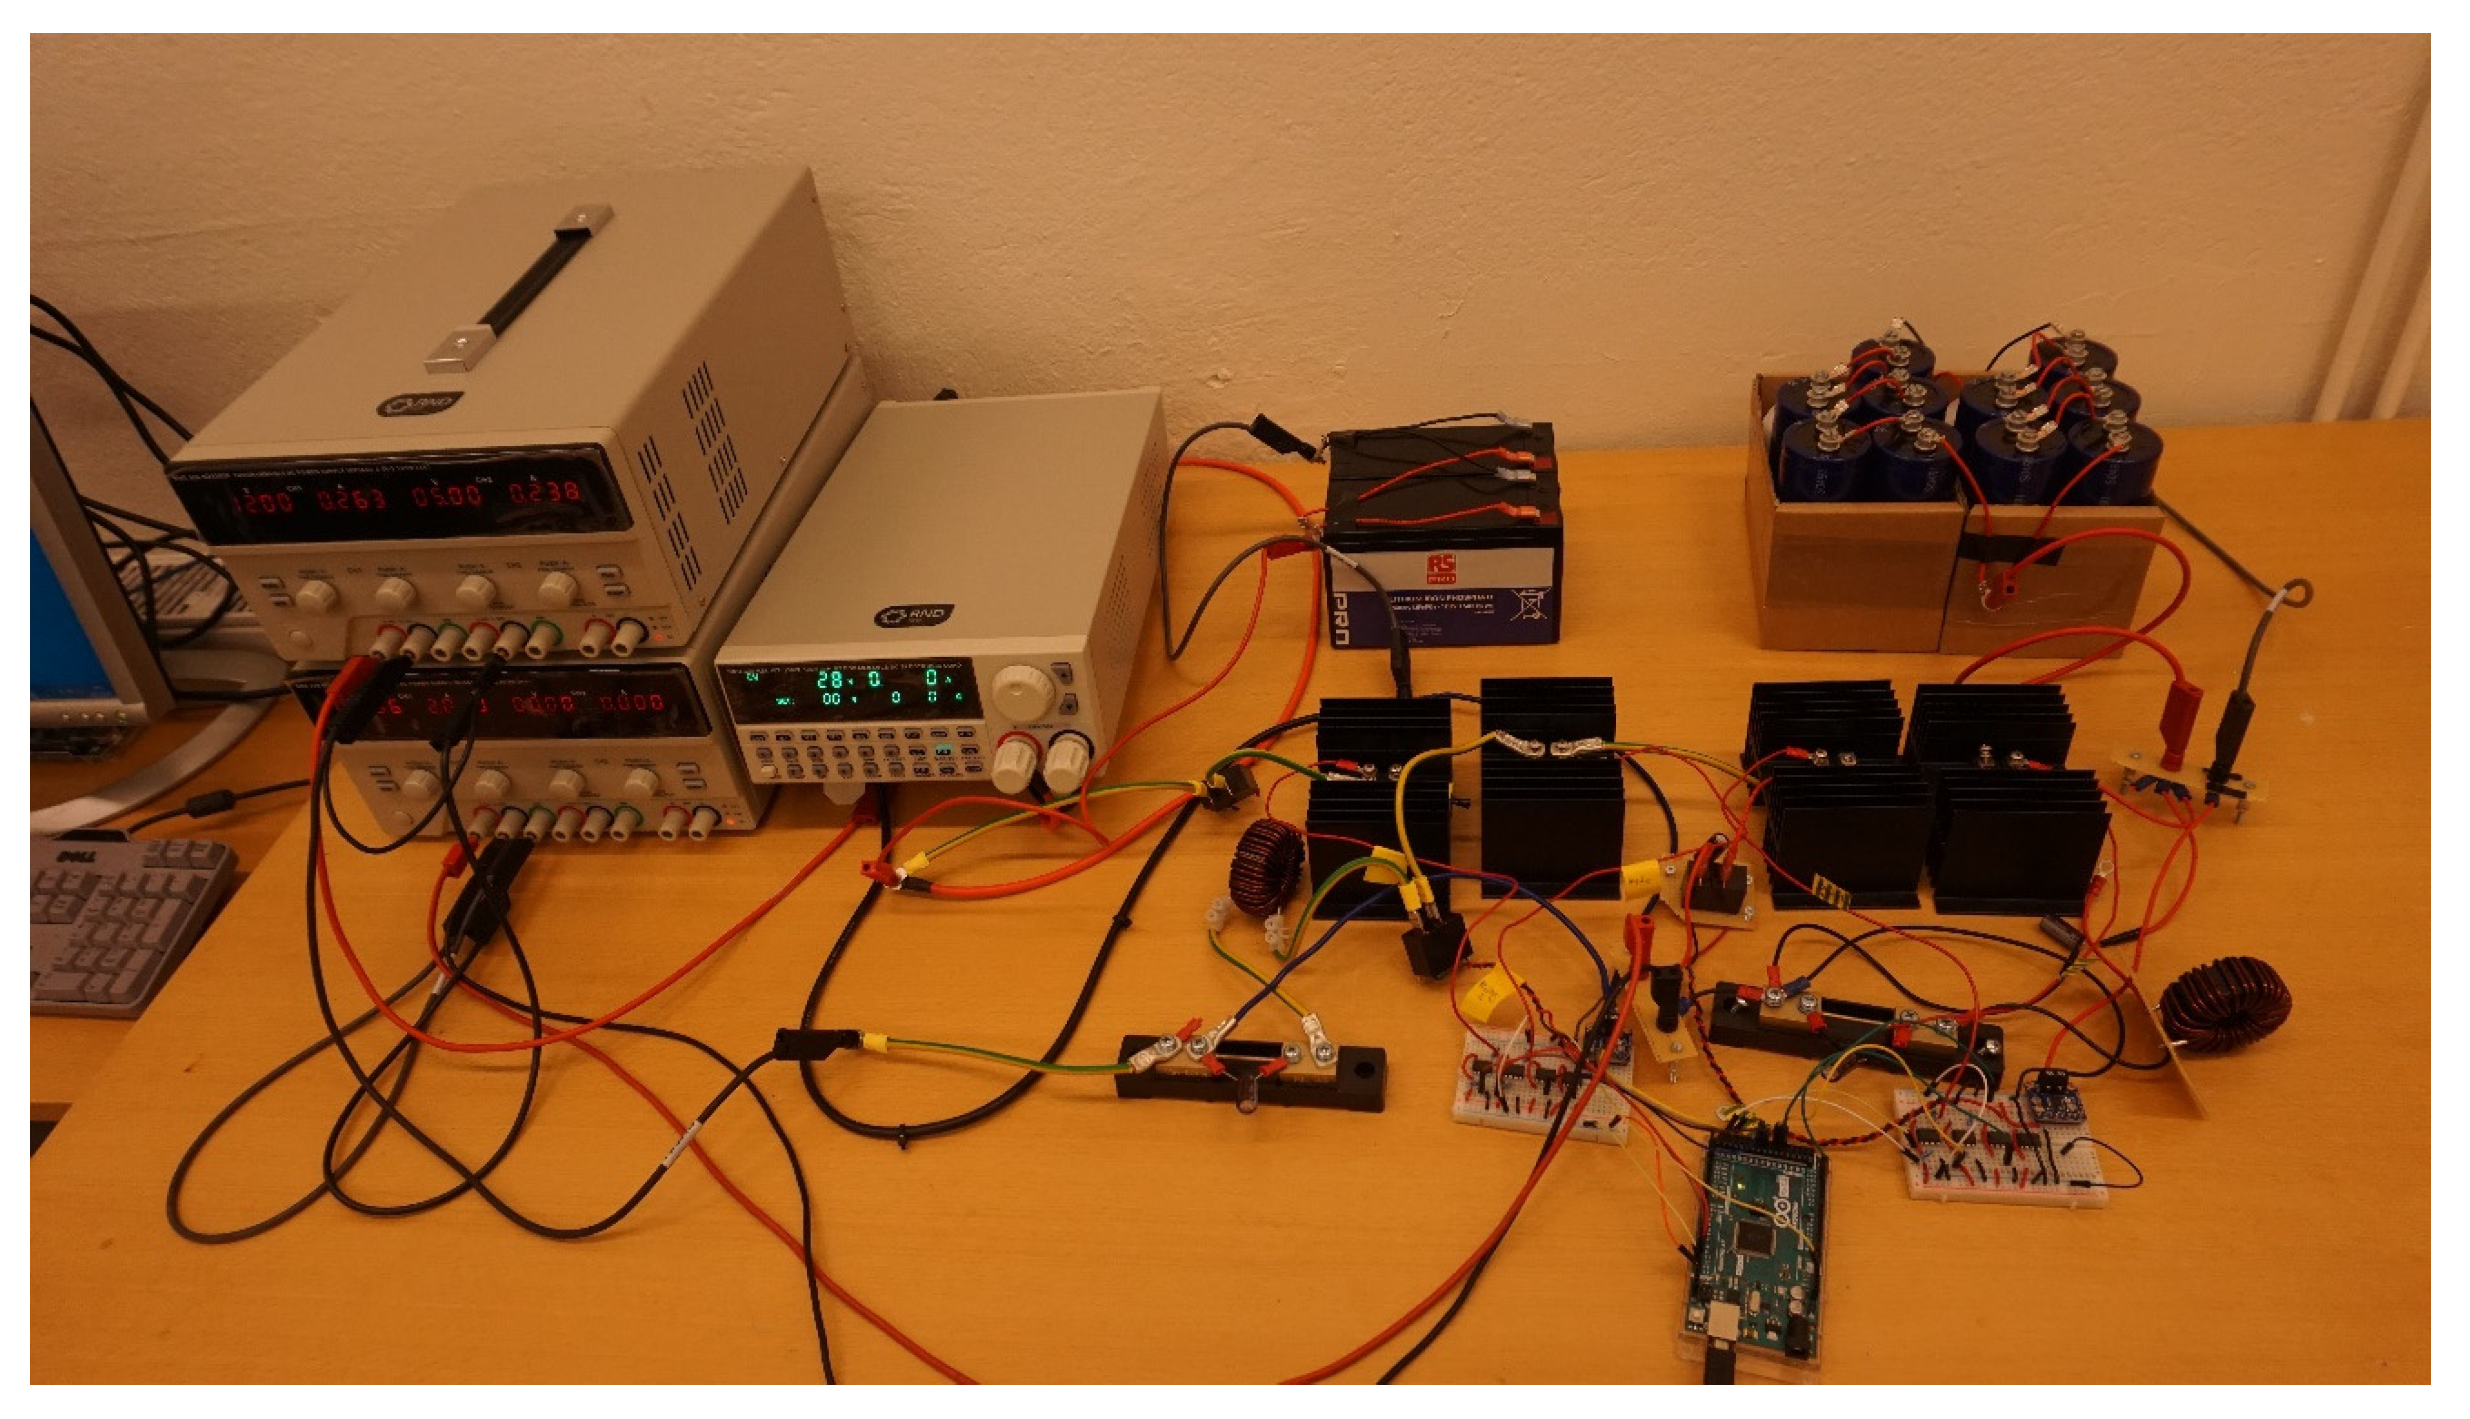
3.2. Experimental Setup

A battery-SC HESS experimental setup was utilized to verify the simulation results. The scaled-down prototype (see Figure 11) used a 20 volts DC bus. A power supply was used to emulate the RES power and a DC electronic load was implemented to emulate the load profiles of the user demand. The HESS consisted of a Li-ion battery pack and a SC pack with a total capacity of 216 Wh. The bi-directional DC/DC converter was made up of two MOSFETs, two capacitors, and an inductor. The nominal parameters of the experimental devices are given in Table 3.
The measured currents of the batteries and the SCs in the single-battery ESS and the battery-SC HESSs are shown in Figure 12 and Figure 13. The low-pass filter controller splits the demand current into low- and high-frequency parts. The SC responds to the high-frequency peaks in the demand and the battery is protected from large current fluctuations. There is a time delay between the battery current and the original demand current. In some time intervals, the battery charges and the SC discharges; this can be interpreted as the ESDs delivering energy to each other, which is unnecessary. In addition, when Tf increases from 1800 s to 3600 s, the battery current is smoother while the SC handles more power peaks. The time delay of the battery current is larger with the larger Tf.
Figure 14 shows the corresponding SOC of the batteries and SCs in the single-battery ESS and the battery-SC HESSs in the wind-powered household-prosumer system. For the battery in the single-battery ESS, the minimum SOC was 0.41 and the maximum SOC was 0.73. The required ΔE of the battery in the setup is 61.4 Wh. In the HESSs, the SOC of the batteries changed less compared with the single-battery ESS. When Tf is 1800 s, the required ΔE of the battery and the SC in the HESS are 53.5 Wh and 12.7 Wh, respectively. Thus, the total required ΔE of the HESS (66.2 Wh) is about 8% larger than that of the single-battery ESS (61.4 Wh). In addition, when Tf increases to 3600 s, the required capacities of the battery and the SC are 51.1 Wh and 18.3 Wh, respectively. Thus, the total ΔE of the HESS increased from about 66 Wh to 69 Wh, which demonstrated an additional 5% increase and was approximately 12% larger than that of the single-battery ESS. In addition, Figure 15 shows the SOC of the batteries and SCs in the single-battery ESS and the battery-SC HESSs in the PV-powered household-prosumer system. The required ΔE of the battery in the single-battery ESS is 87.6 Wh. In the HESSs, the SOC of the batteries changed less compared with the single-battery ESS. When Tf is 1800 s, the required ΔE of the battery and the SC in the HESS are 78.3 Wh and 15.2 Wh, respectively. Thus, the total required ΔE of the HESS (93.5 Wh) is about 7% larger than that of the single-battery ESS (87.6 Wh). In addition, when Tf increases to 3600 s, the required capacities of the battery and the SC are 75.4 Wh and 20.8 Wh, respectively. Thus, the total ΔE of the HESS increased to about 96 Wh, which was 10% larger than that of the single-battery ESS. The measured results agreed with the simulation results.

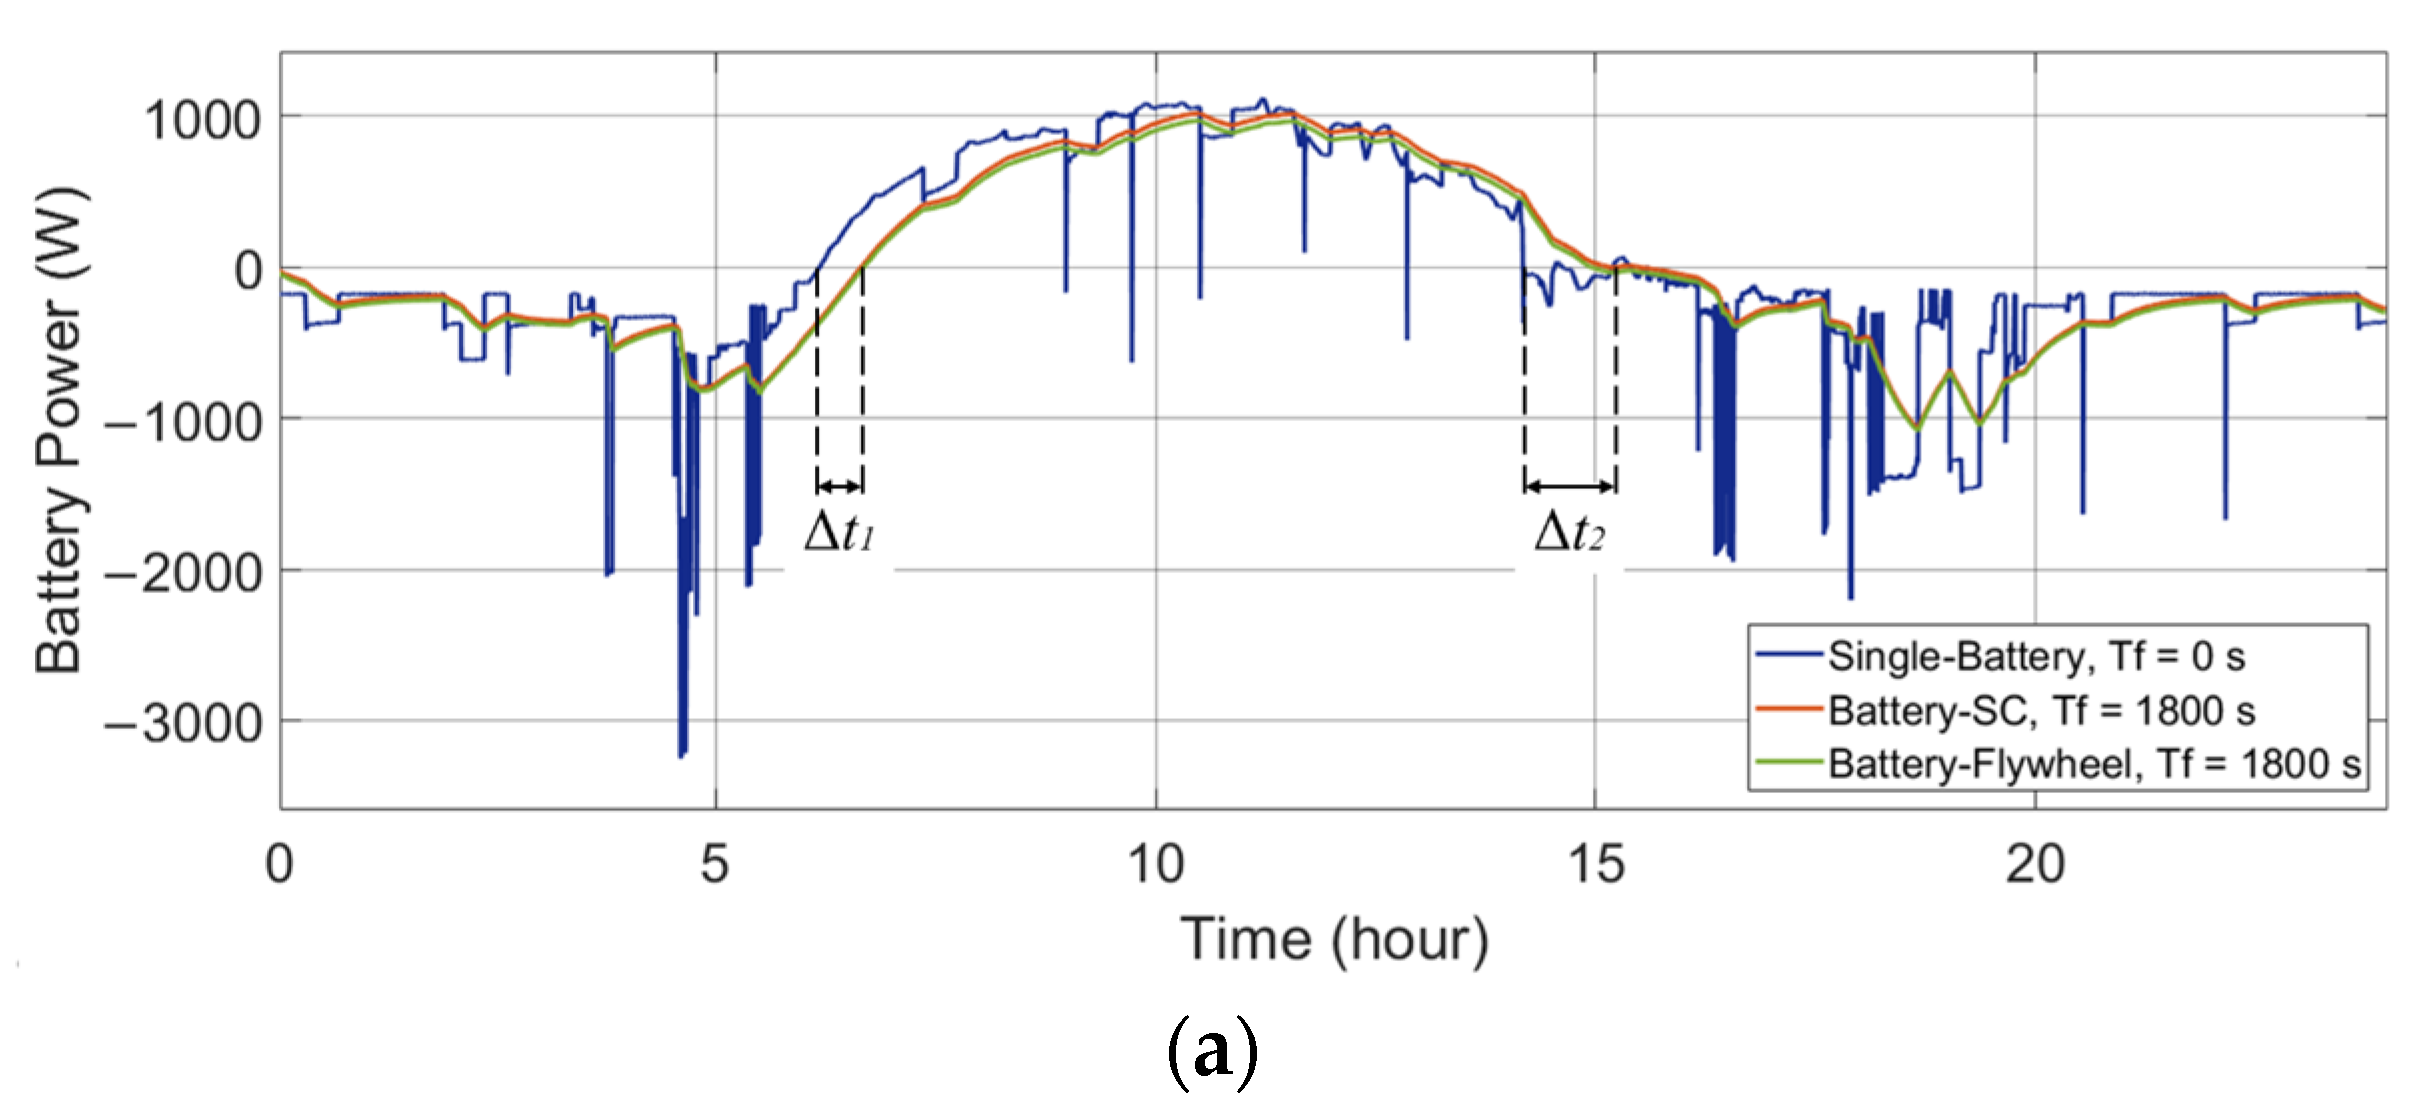
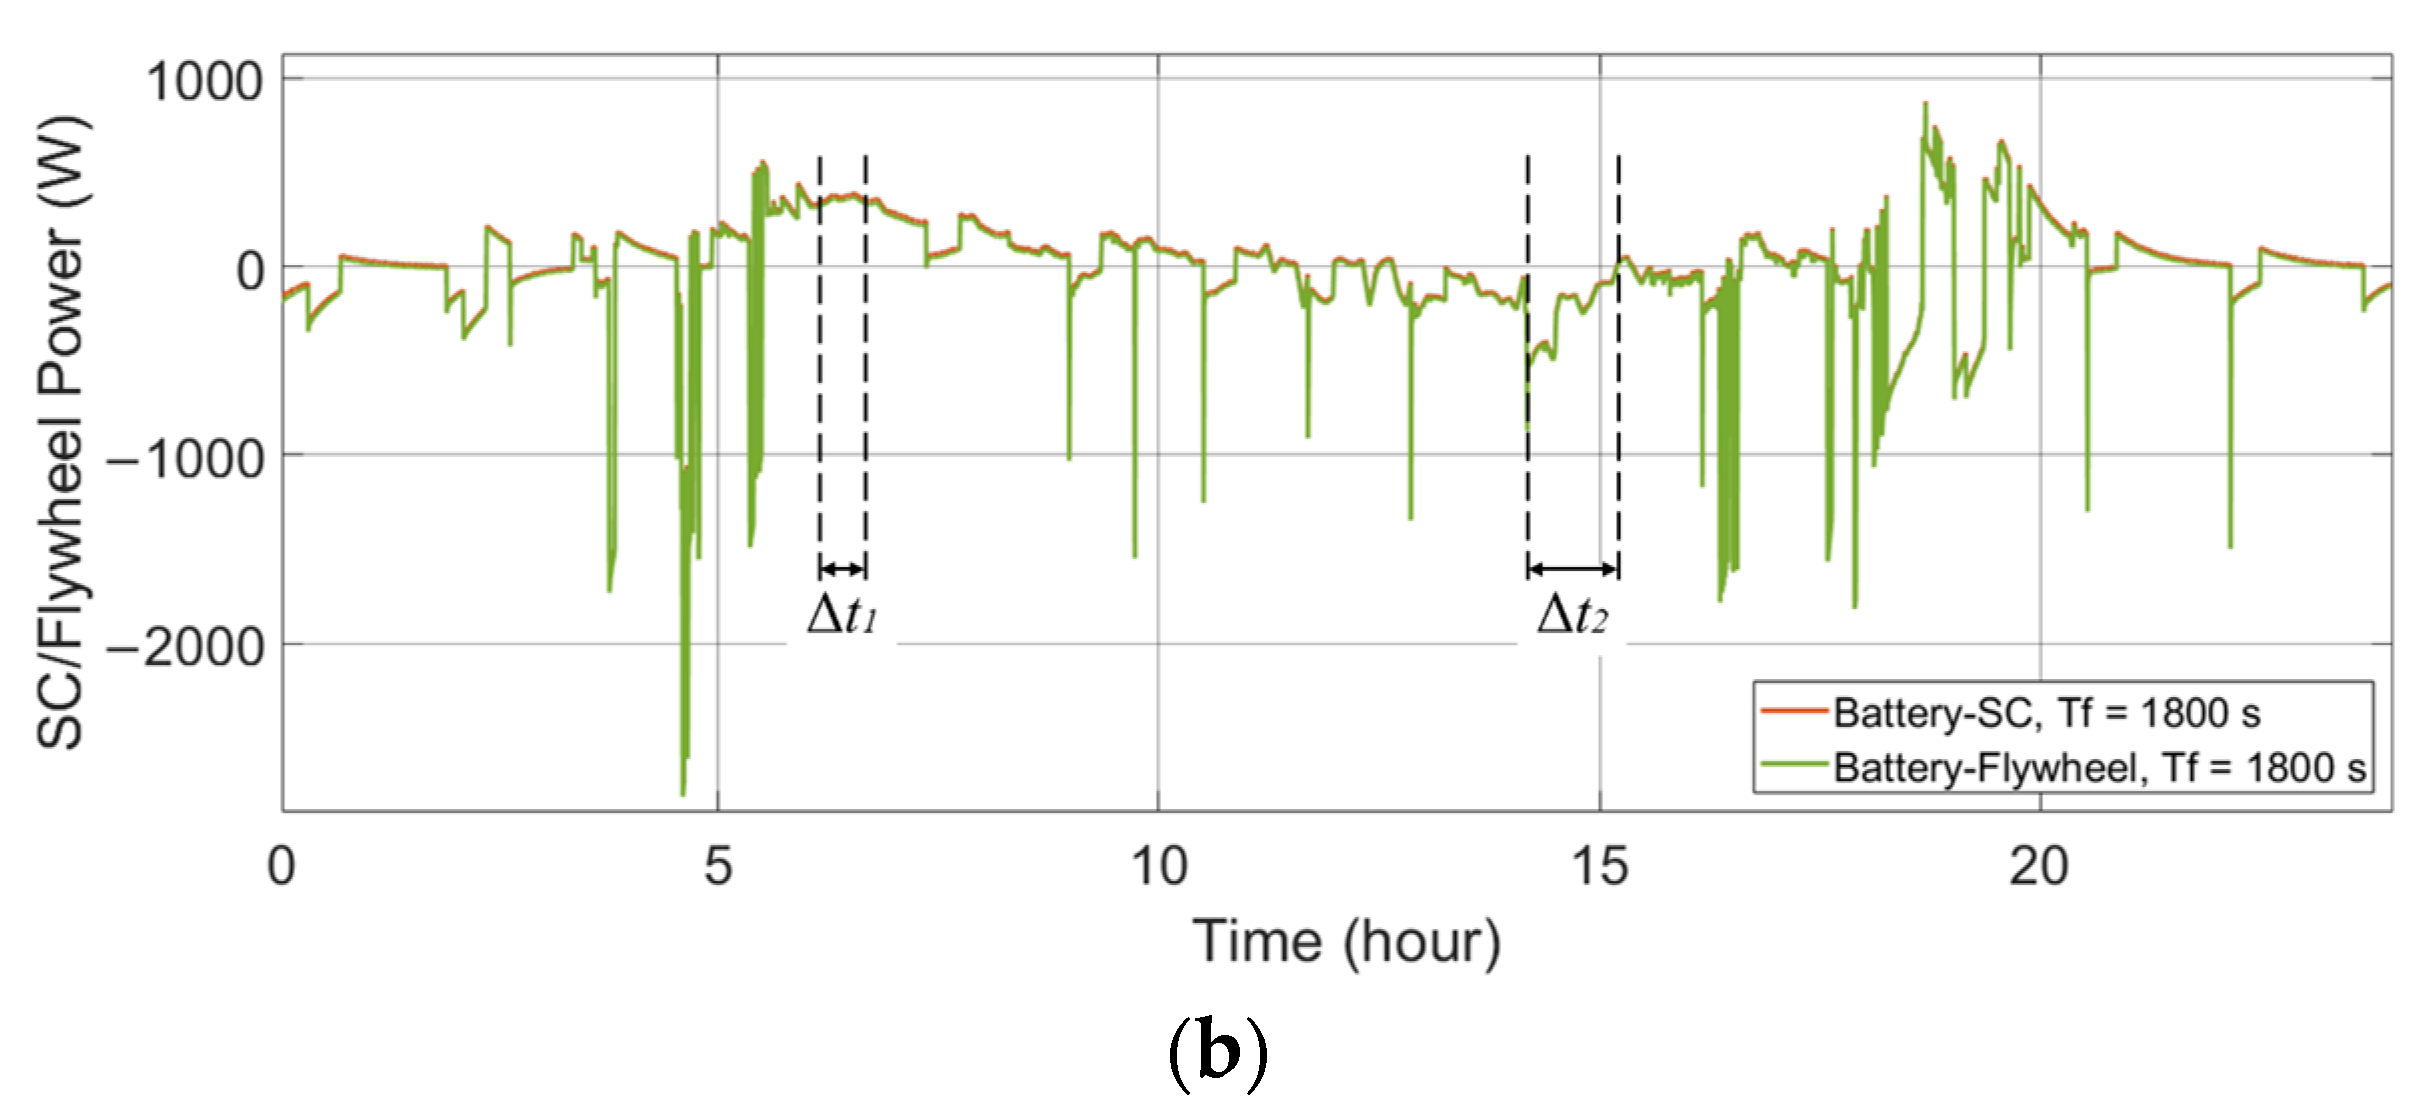
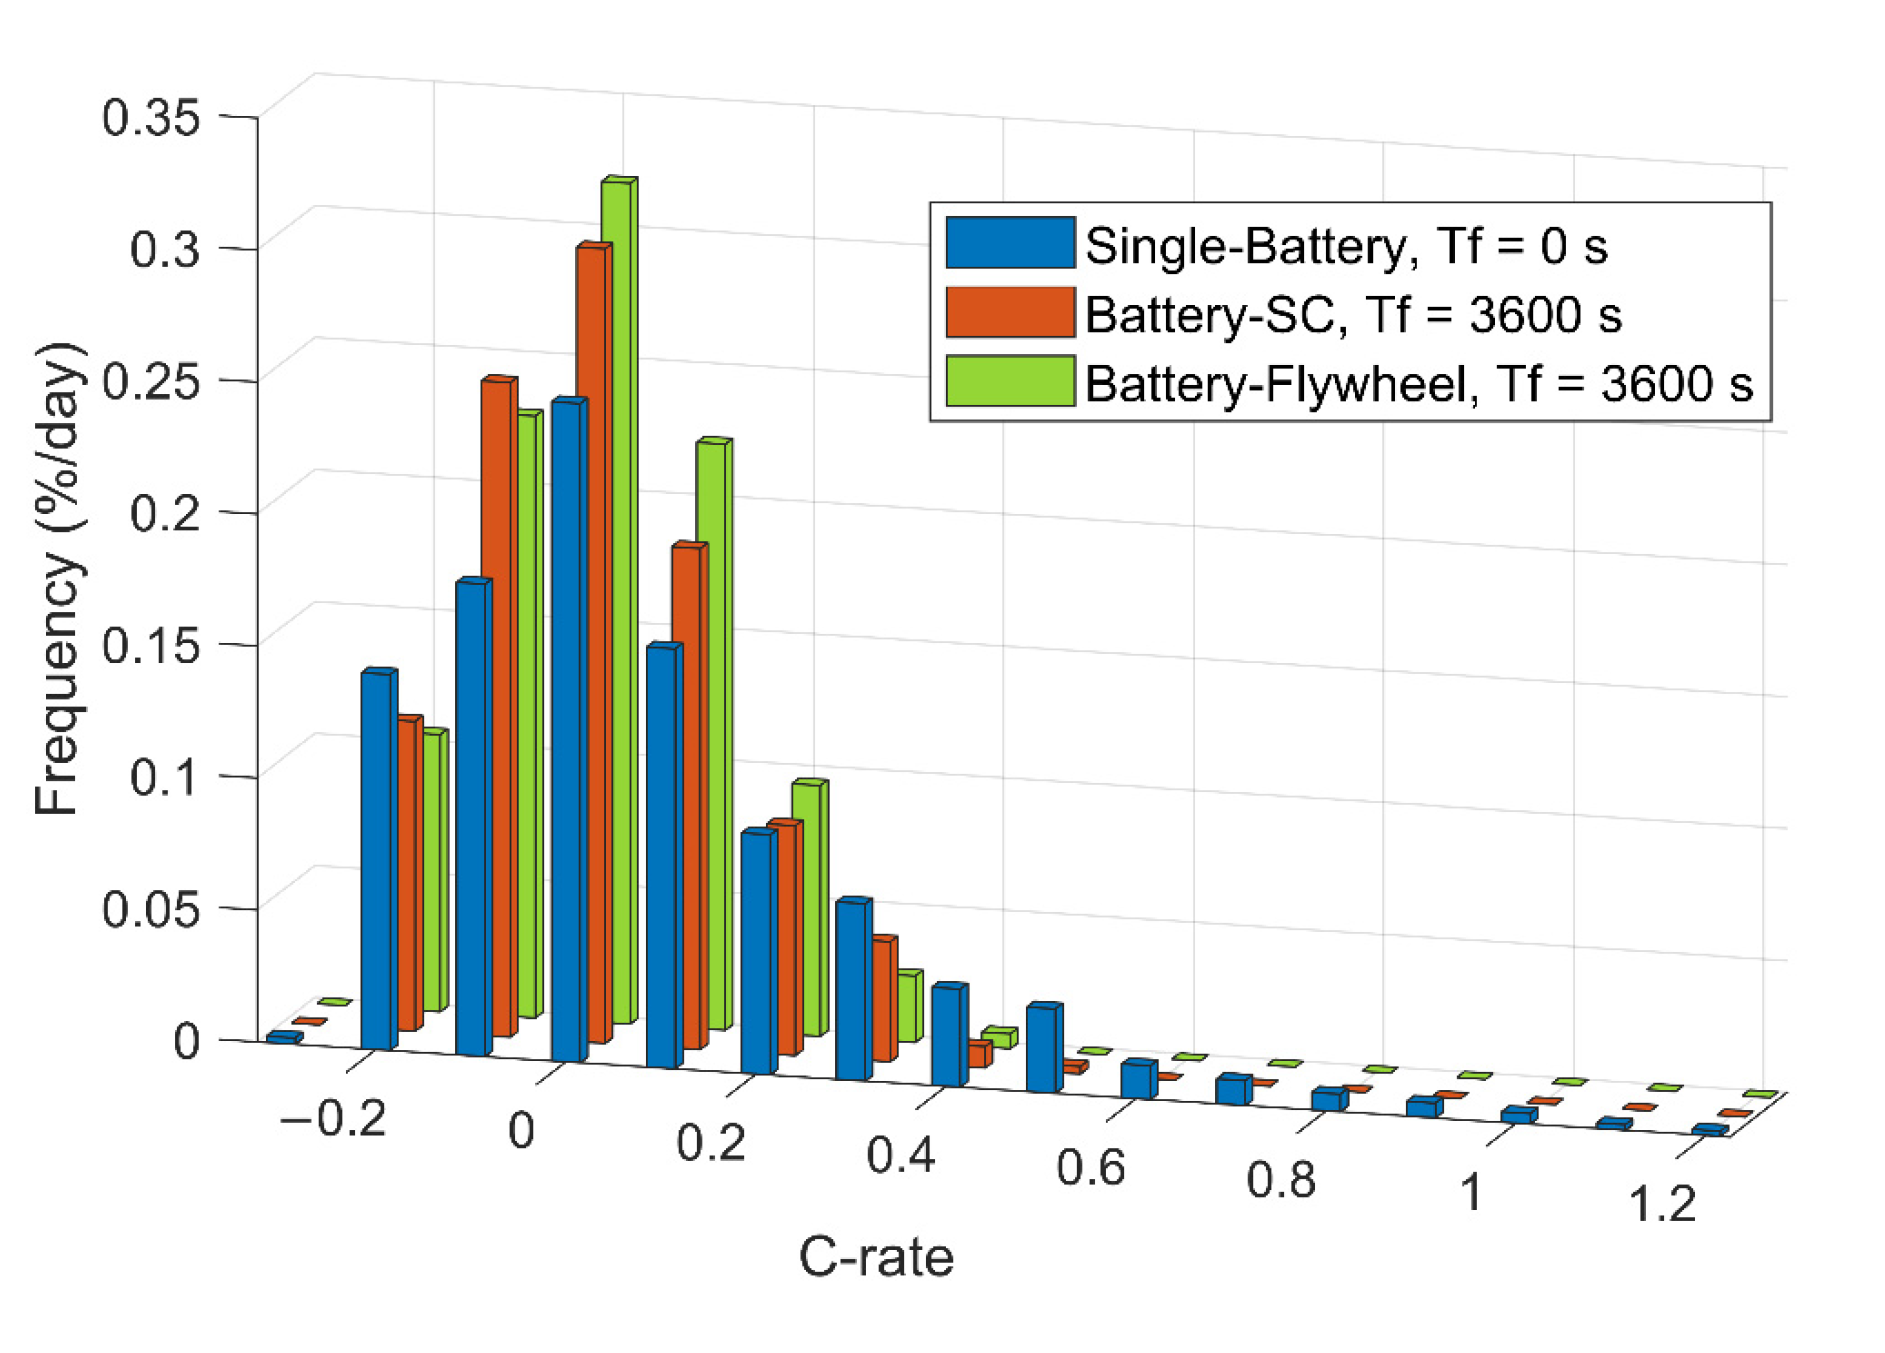
4. Comparison of Single-Battery ESS, Battery-SC HESS, and Battery-Flywheel HESS

The use of single-battery ESS, the battery-SC HESS, and the battery-flywheel HESS in RES prosumer systems are compared to discuss the impact of their respective energy exchange. For different individual households, the results are diverse due to different RESs and power consumption patterns. Thus, ten different power load profiles were chosen from the data set to give a range of different scenarios. The averages of the results are discussed in order to investigate the general trends.
In addition, there are several different chemistries in the Li-ion battery family, in which NMC batteries and LFP batteries account for a large share of the installed capacity of ESSs and electric vehicles. Although LFP batteries are inferior to NMC batteries in terms of energy density, LFP batteries offer advantages in terms of their lifetime and safety [32]. Therefore, the HESSs that respectively include the NMC battery and the LFP battery are investigated to estimate the battery lifetimes. Based on the required capacities of the ESDs and the lifetimes of the batteries, the project costs of different ESS combinations are then estimated.

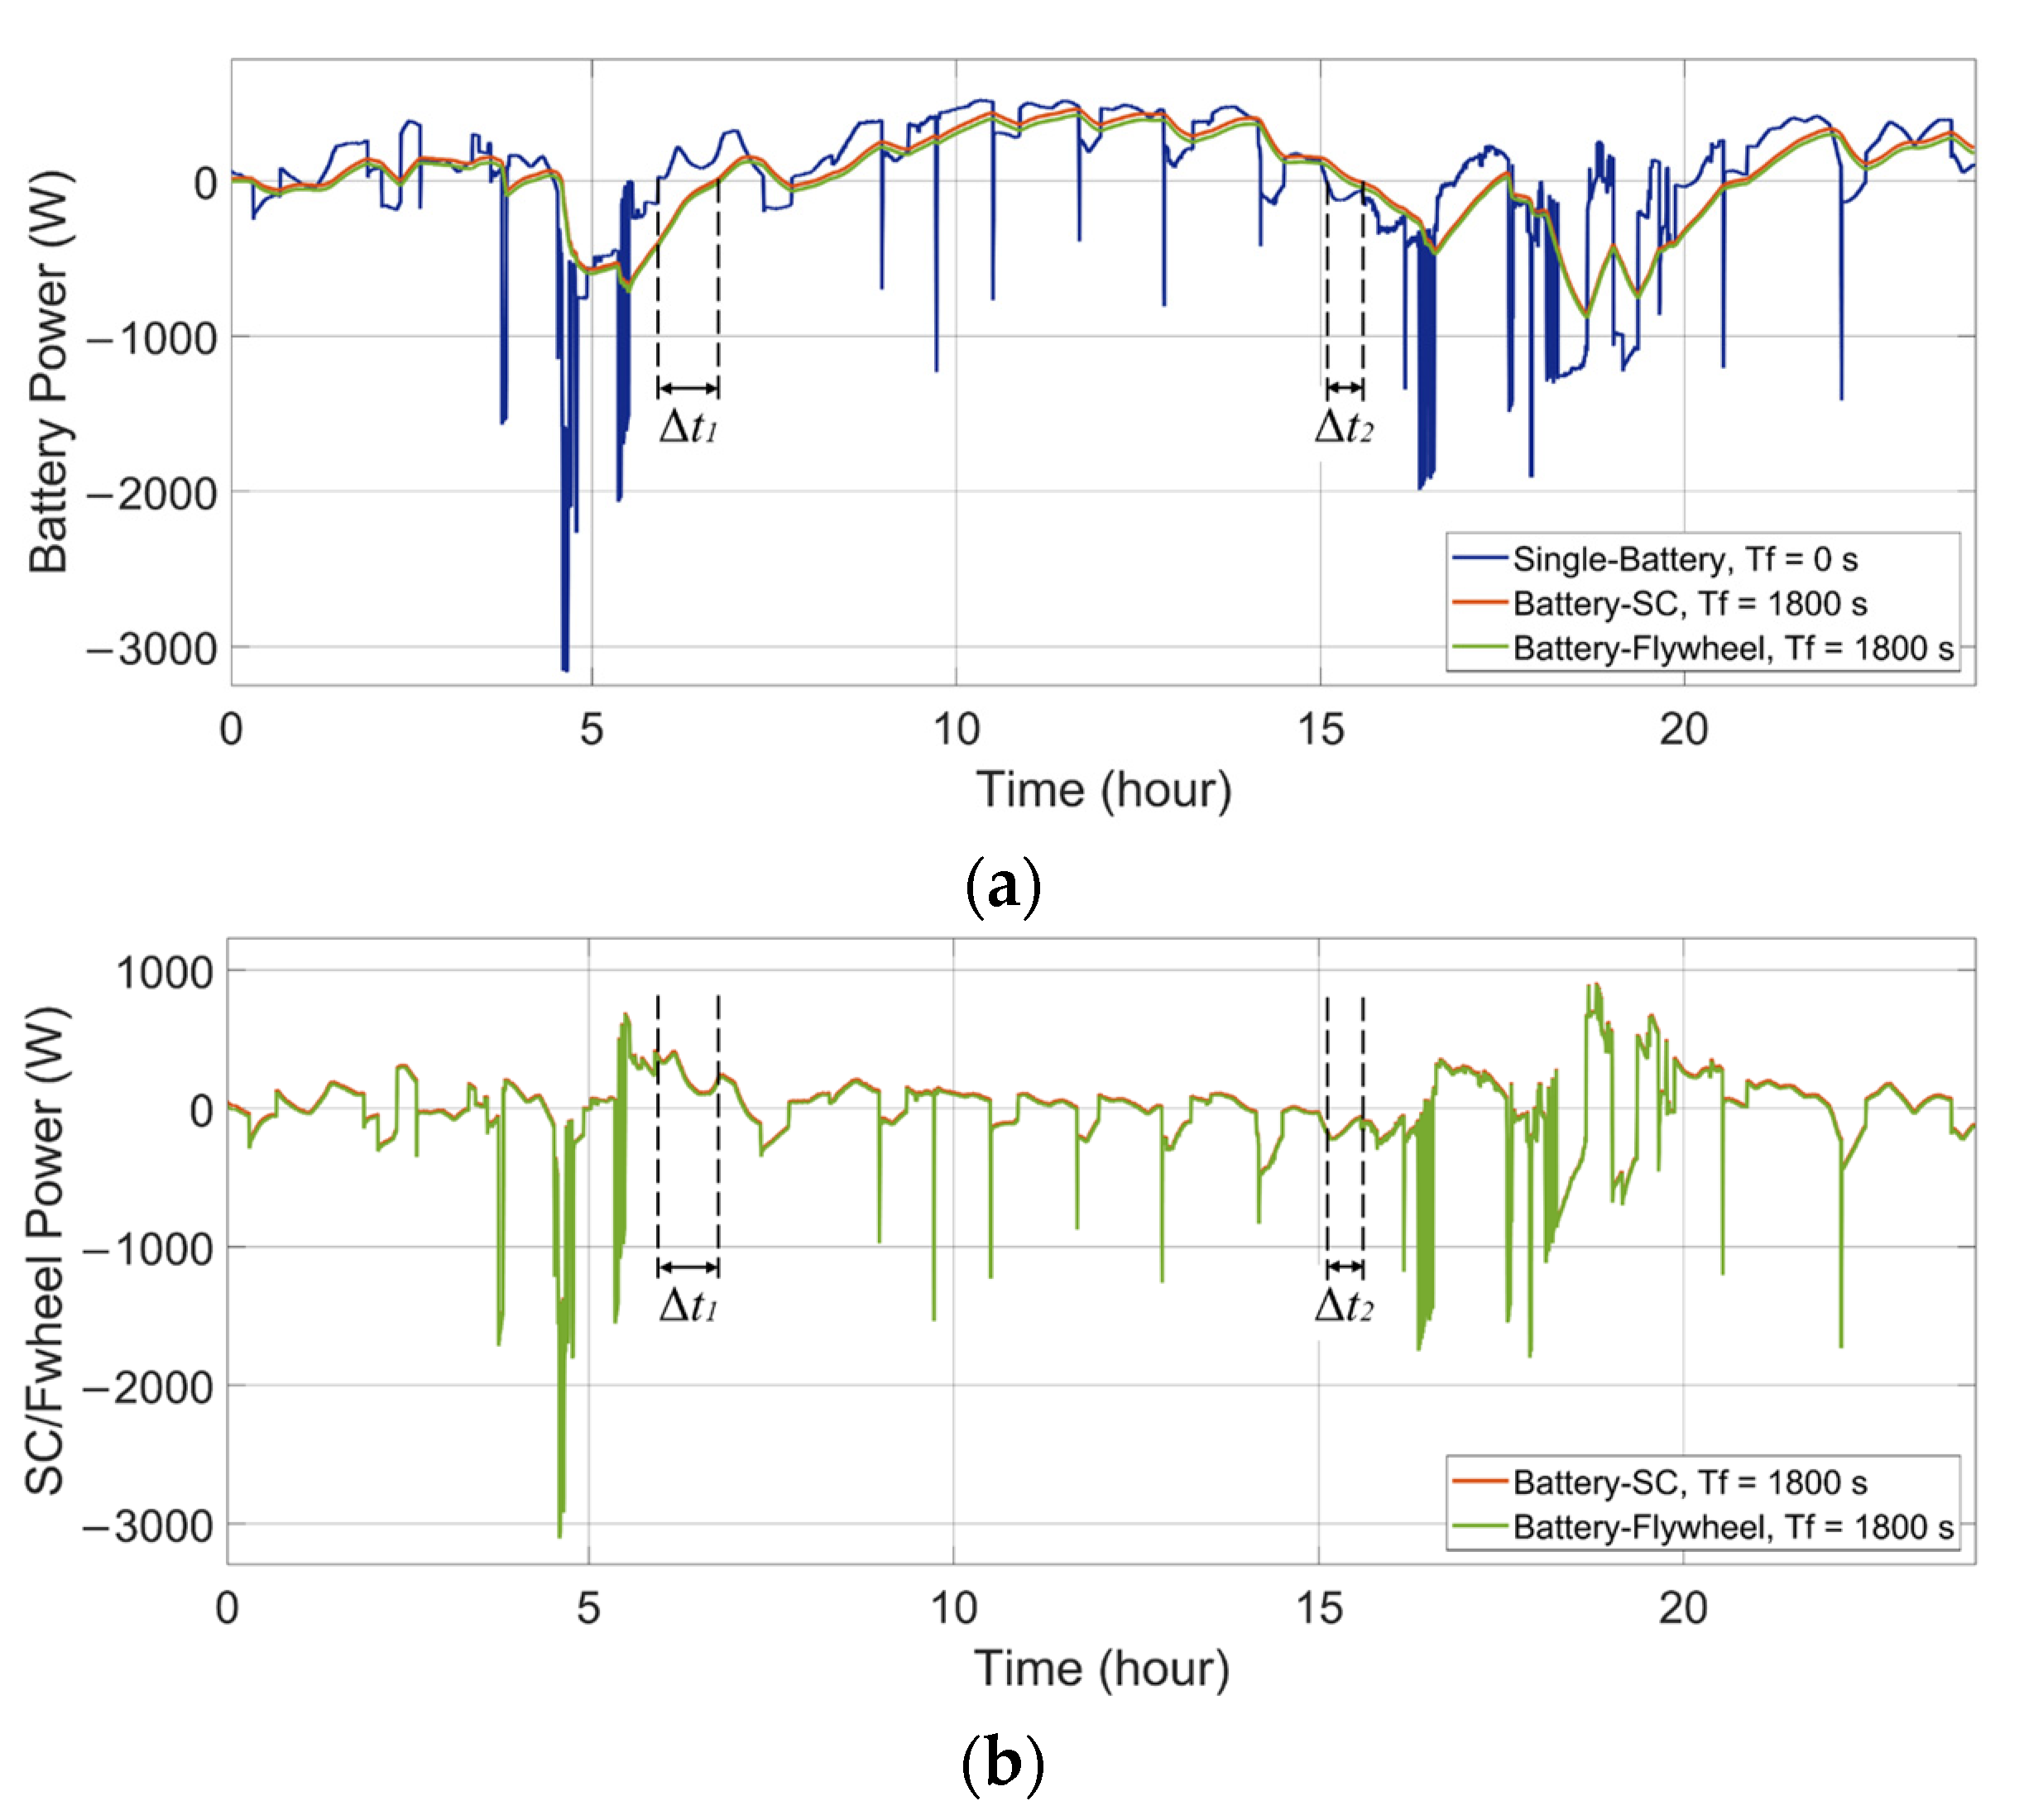
4.1. Comparison Analysis

The variations of the maximum charging and discharging powers of the batteries in the HESSs with increasing Tf are plotted in Figure 16. Tf = 0 s indicates that the battery has to handle the entire power demand alone. Both the maximum charging and discharging powers of the batteries in the HESSs decline with increasing Tf because the secondary ESD handles more of the power demand and reduces the stress on the battery.
Figure 17 demonstrates how the energy losses of the HESSs increase with increasing Tf as a result of the increased energy exchange between the ESDs. In addition, the energy loss of the battery-flywheel HESS is higher than that of the battery-SC HESS due to the higher self-discharge rate of the flywheel.
The comparison of the ΔE and the capacities of the ESDs are plotted in Figure 18 and Figure 19. As shown by the solid lines, with increasing Tf in the low-pass filter controller, the ΔE of the batteries (solid blue lines) decreases in both the battery-SC HESS and the battery-flywheel HESS. However, the energy exchange between the ESDs increases due to the increased time delay of the power flow. As a consequence, the ΔE of the SC/flywheel (solid red lines) and the sum of the ΔE of the ESDs (solid green lines) increase with increasing Tf.
In addition, the available SOC range limits the available capacities of the ESDs, where SOCmax and SOCmin are the upper and lower limits. To avoid a rapid capacity degradation during operations with a large depth of discharge (DOD), the available SOC range of the battery is set between 20% and 90% [33]. In addition, the available SOC of the SC is set between 16% and 100% (VSC_min = 0.4VSC_max) [34]. The flywheel operates between 25% and 100% SOC (the lowest rotation speed is half of the highest rotation speed) [35]. Therefore, the actual required installed capacity of the ESD QESD is written as:
Q E S D = Δ E S O C max S O C min
The dashed lines show that the actual capacities of the ESDs correspond to their ΔE and feature similar trends to ΔE. When Tf is 3600 s, both the total capacities of the battery-SC HESS and the battery-flywheel HESS are larger than that of the single-battery ESS. In addition, the installed capacity of the battery-SC HESS is slightly less than that of the battery-flywheel HESS due to the relatively low self-discharge rate of the SCs compared to the flywheels.
Furthermore, the installed capacity of the HESSs in the PV-powered household-prosumer system is larger than that in the wind-powered system. The PV-powered system only generates power during the day. This means that it needs a larger ESS to be able to shift energy compared with the wind-powered system.
Generally speaking, on one hand, the SC/flywheel distinctly reduces the charge/discharge current rate and the capacity of the battery, which predictably extends the battery’s lifetime and reduces the cost of the battery pack. On the other hand, because some parts of the capacities of the ESDs are used to deliver energy between each other within the HESS, the reduction of the battery’s capacity is less than the capacity of the secondary ESD that increases. Therefore, the total capacity of the HESS exceeds that of the single-battery ESS, which indicates a higher initial investment cost for the HESS. In addition, the increased energy loss of the HESS, which is caused by the increased power flow and the high self-discharge of the SC/flywheel, leads to decreased energy efficiency.

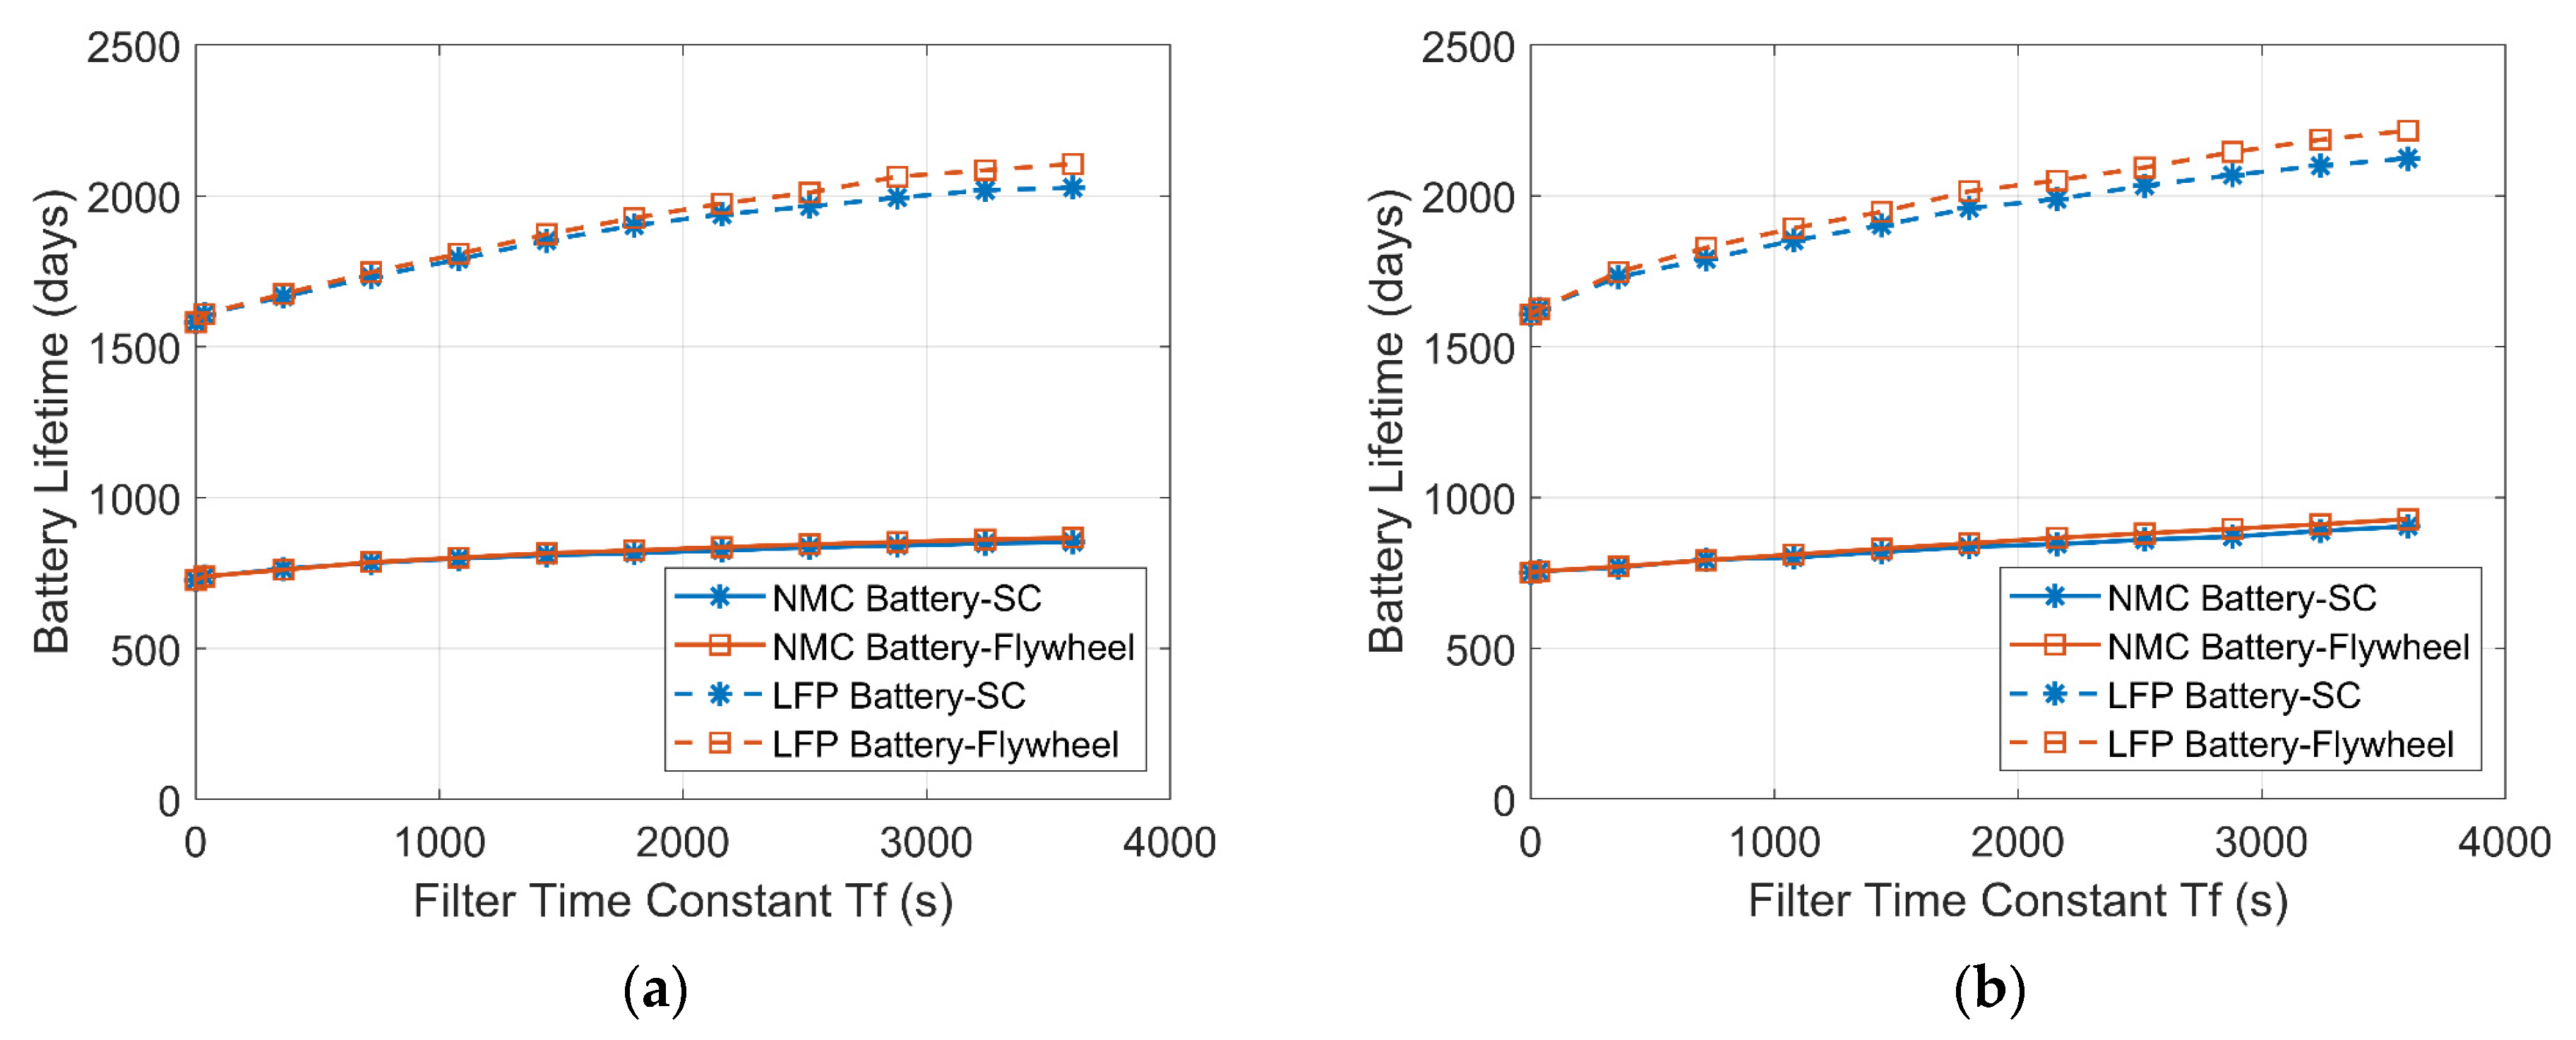
4.2. Battery Lifetime Estimation

The characteristics of capacity fading in batteries and estimations of battery lifetimes have been studied in many papers (e.g., [36,37]). When their capacity reaches 80% of the nominal capacity, batteries are usually determined to have the end-of-life stage and to require replacement.
For the NMC battery, an empirical model for capacity degradation is obtained by curve fitting from the reference [38]:
Q l o s s , % = 14876 ( t ) 0.5 exp ( 24.5 k J R T ) Calender   aging   model + ( 0.0008 exp ( 0.3903 C - r a t e ) ) A h t h r o u g h p u t Cycle   aging   model .
The empirical aging model used in this study to estimate the lifetime of the LFP battery is from [39]:
Q l o s s = 3.087 10 7 exp ( 0.05146 T ) ( t / 30 ) 0.5 Calender   aging   model + 6.87 10 5 exp ( 0.027 T ) ( A h t h r o u g h p u t 2 C a p a c i t y ) 0.5 Cycle   aging   model  
A h t h r o u g h p u t = 0 24 t | I b a t | d t
where the C-rate is the current rate of the battery being charged or discharged, t represents the operating time of the battery (in days), R is the gas constant (8.314 J/(mol∙K)), and T is the temperature in K. The ambient temperature for the estimation is considered as 25 °C (293.15 K). Ahthroughput is chosen as the parameter for the aging model because it represents the amount of energy delivered by the battery. The Ahthroughput is calculated by the current throughput from the battery for the whole operating time (in hours). The lifetimes of the NMC battery and the LFP battery that are estimated by these two models include both cycle aging and calendar aging.
Figure 20 shows the distribution of the battery current rates for one of the test cases in the wind-powered household-prosumer system. Compared with the single-battery ESS, the batteries in both the HESSs experience lower C-rates, which avoids the need for the high C-rates to charge and discharge. With the lower C-rates, the total Ah-throughput of the batteries is significantly lower than that of the single-battery ESS. Consequently, the HESSs reduce the equivalent full cycles (EFC) of the batteries, which slows down cycle aging. In addition, for the battery-flywheel HESS, since the self-discharge loss of the flywheel is larger than that of the SC, the battery discharges more often. Thus, the frequency of the discharge current is slightly higher than that of the battery-SC combination.
Utilizing the distribution of the C-rates and the total EFC, the battery lifetimes are estimated. As shown in Figure 21, the SC/flywheel reduces the stress on the battery and increases the battery lifetime. The extension of the battery lifetime in the battery-SC HESS is close to that of the battery-flywheel HESS. It can be seen that the lifetime of the LFP battery is much longer than that of the NMC battery. Compared with the single-LFP battery ESS, the lifetimes of the LFP batteries in the HESSs are extended by more than a quarter of the initial lifetime. In addition, although the capacity of the battery is larger in the PV-powered system compared with the wind-powered system, the lifetimes of the batteries in the two RES household-prosumer systems are comparable due to the similar total EFCs in these two systems.

4.3. Cost Analysis

Because the target of the analysis is to compare the HESSs, the cost analysis only concerns the costs of the ESDs along with the bi-directional DC/DC converters. The costs of the RESs and the other components in the system are not discussed. In addition, the cost analysis highly depends on the lifetimes and the capacity costs of the different energy storage technologies. Compared with the capital cost, the operating and maintenance costs of the ESDs are negligible and are, thus, neglected [40]. The simplified cost calculation includes the cost of the battery Cbat, the cost of the SC/flywheel CSC/fly, and the cost of the converter Ccon:
C t o t a l = C b a t + C S C / f l y + C c o n
{ C b a t = t t b a t ( Q b a t c _ b a t ) + c i n s _ b a t C S C = Q S C c _ S C + c i n s _ S C C f l y = Q f l y c _ f l y + c i n s _ f l y C c o n = n P c o n c _ c o n
where t is the project’s operating time in years (up to 30 years) and tbat is the lifetime of the battery in years. Using the ceiling value of the t/tbat represents the investment times of the battery (i.e., including the initial cost and replacement cost), Qbat is the capacity of the battery, c_bat is the Li-ion battery cost per kWh, and cins_bat is the installation cost of the battery. For the SC, QSC is the capacity of the SC, c_SC is the SC cost per kWh, and cins_SC is the installation cost. For the flywheel, Qfly represents the capacity of the flywheel, c_fly represents the flywheel cost per kWh, and cins_fly represents the installation cost. For the bi-directional DC/DC converter, n is the number of the converters (n = 1 in the single-battery ESS and n = 2 in the HESS), Pcon is the nominal power of the converter (5 kW is used here), and c_con is the cost (per kW) of the converter.
Taking into account the costs of NMC batteries and LFP batteries reported in published research [40,41,42], the parameters are summarized to analyze the project cost. In addition, the retail price in the C.A.R.M.E.N. market report is considered [43]. The parameters for the cost estimation are shown in Table 4.
The results of the estimated battery lifetimes and project costs of the HESSs are listed in Table 5. The results highlight that the initial cost of both the battery-SC HESS and the battery-flywheel HESS is clearly higher than that of the single-battery ESS due to the oversized capacity of the HESS, the high price of the SC/flywheel, and the cost of an additional DC/DC converter. With a 30 year project lifetime, the single-LFP battery ESS shows the lowest total cost as a result of the longer battery lifetime of the LFP battery compared with the NMC battery. For the battery-SC HESS with either the NMC battery or the LFP battery, although the lifetime of the battery is extended, the total project cost of the battery-SC combination is higher than that of the single-battery ESS with the same type of batteries. This is caused by the current high cost of SCs. Furthermore, the project cost of the battery-flywheel HESS is comparable to that of the single-battery ESS. The project cost of the NMC battery-flywheel HESS is less than that of the single-NMC battery ESS since the NMC battery needs to be replaced relatively often and the replacement cost of the battery part is relatively high. Conversely, when the HESS employs LFP batteries as the primary ESD, the project cost of the LFP battery-flywheel HESS is slightly larger than that of the single-LFP battery ESS. The variations in the costs of these HESSs over 30 years are shown in Figure 22.
The stepwise increasing lines indicate that the project costs increase when the batteries need to be replaced. The general conclusions from the cost analysis are as follows:
  • The project costs show similar trends in both the wind-powered system and PV-powered system, where the NMC battery-SC HESS has the highest project cost and the single-LFP battery ESS has the lowest project cost.
  • The costs for HESSs that include LFP batteries are visibly lower than those of the corresponding HESSs with NMC batteries.
  • Although HESSs are initially more costly, their cost increases relatively slowly compared to the single-battery ESSs due to the extended lifetime of the battery in HESSs.
With the development of the battery market caused by increasing RESs and electric vehicles, the cost of Li-ion batteries is continuously decreasing. Therefore, the selection of the appropriate ESS solution in the RES household-prosumer system should be performed carefully, using a techno-economic analysis for the different technologies involved and the planned project lifetime.

5. Conclusions

Through an analysis of the energy exchange caused by the phase shift of the low-pass filter controller, this study discussed the cause of the oversized capacity and increased energy loss of the HESS. The unnecessary energy exchange implies that some of the capacity is used to deliver energy within the HESS instead of serving the DC bus. Thus, the total capacity of the HESS that is required to meet the demand is distinctly larger than that of the single-battery ESS. Moreover, the energy loss of the HESS is larger than that of the single-battery ESS due to the larger throughput powers of the individual ESDs and the high self-discharge rate of the SC/flywheel. In addition, the increased time constant of the filter controller causes both the required capacity and the energy loss of the HESS to increase. Furthermore, although the battery lifetime is extended by the secondary ESD, the single-battery ESS demonstrates an initial cost advantage compared with the HESS, since its required capacity is lower. Due to the longer lifetime of LFP batteries, the single-LFP battery ESS features the lowest project cost. However, the cost over time of the battery-flywheel HESS is comparable to that of the single-battery ESS for a 30 year project lifetime. The cost advantage of the HESS will become clear over time if the project is designed for long-term usage. The techno-economic analysis for the different ESSs/HESSs depends on the specific project situation and lifetime.

Author Contributions

Conceptualization, Y.J. and D.M.; data curation, Y.J.; formal analysis, Y.J.; funding acquisition, D.M.; investigation, Y.J.; methodology, Y.J. and D.M.; project administration, D.M.; resources, D.M.; software, Y.J.; supervision, D.M.; validation, Y.J. and D.M.; visualization, Y.J.; writing—original draft, Y.J.; writing—review and editing, D.M. All authors have read and agreed to the published version of the manuscript.

Funding

This research was funded by the China Scholarship Council (CSC), and the StandUp for Energy Project via the Swedish Research Council.

Institutional Review Board Statement

Not applicable.

Informed Consent Statement

Not applicable.

Data Availability Statement

The data presented in this study are available on request from the corresponding author.

Conflicts of Interest

The authors declare no conflict of interest.

References

  1. Shahsavari, A.; Akbari, M. Potential of solar energy in developing countries for reducing energy-related emissions. Renew. Sustain. Energy Rev. 2018, 90, 275–291. [Google Scholar] [CrossRef]
  2. Sun, C.; Negro, E.; Vezzù, K.; Pagot, G.; Cavinato, G.; Nale, A.; Bang, Y.H.; Di Noto, V. Hybrid inorganic-organic proton-conducting membranes based on SPEEK doped with WO3 nanoparticles for application in vanadium redox flow batteries. Electrochim. Acta 2019, 309, 311–325. [Google Scholar] [CrossRef]
  3. Molina, M.G. Energy storage and power electronics technologies: A strong combination to empower the transformation to the smart grid. Proc. IEEE 2017, 105, 2191–2219. [Google Scholar] [CrossRef]
  4. Vazquez, S.; Lukic, S.M.; Galvan, E.; Franquelo, L.G.; Carrasco, J.M. Energy storage systems for transport and grid applications. IEEE Trans. Ind. Electron. 2010, 57, 3881–3895. [Google Scholar] [CrossRef] [Green Version]
  5. Hou, J.; Yang, M.; Wang, D.; Zhang, J. Fundamentals and challenges of lithium ion batteries at temperatures between −40 and 60 °C. Adv. Energy Mater. 2020, 18, 1904152. [Google Scholar] [CrossRef]
  6. Zhang, H.; Sun, C. Cost-effective iron-based aqueous redox flow batteries for large-scale energy storage application: A review. J. Power Sources 2021, 493, 229445. [Google Scholar] [CrossRef]
  7. Pugach, M.; Vyshinsky, V.; Bischi, A. Energy efficiency analysis for a kilo-watt class vanadium redox flow battery system. Appl. Energy 2019, 253, 113533. [Google Scholar] [CrossRef]
  8. Díaz-González, F.; Sumper, A.; Gomis-Bellmunt, O.; Villafáfila-Robles, R. A review of energy storage technologies for wind power applications. Renew. Sustain. Energy Rev. 2012, 16, 2154–2171. [Google Scholar] [CrossRef]
  9. Haruni, A.M.O.; Negnevitsky, M.; Haque, M.E.; Gargoom, A. A novel operation and control strategy for a standalone hybrid renewable power system. IEEE Trans. Sustain. Energy 2013, 2, 402–413. [Google Scholar] [CrossRef]
  10. Mohamad, F.; Teh, J.; Lai, C.M.; Chen, L.R. Development of energy storage systems for power network reliability: A review. Energies 2018, 11, 2278. [Google Scholar] [CrossRef] [Green Version]
  11. Kotra, S.; Mishra, M.K. Design and stability analysis of dc microgrid with hybrid energy storage system. IEEE Trans. Sustain. Energy 2019, 10, 1603–1612. [Google Scholar] [CrossRef]
  12. Lu, X.; Chen, Y.; Fu, M.; Wang, H. Multi-objective optimization-based real-time control strategy for battery/ultracapacitor hybrid energy management systems. IEEE Access 2019, 7, 11640–11650. [Google Scholar] [CrossRef]
  13. Gee, A.M.; Robinson, F.V.P.; Dunn, R.W. Analysis of battery lifetime extension in a small-scale wind-energy system using supercapacitors. IEEE Trans. Energy Convers. 2013, 28, 24–33. [Google Scholar] [CrossRef]
  14. Arani, A.A.K.; Gharehpetian, G.B.; Abedi, M. A novel control method based on droop for cooperation of flywheel and battery energy storage systems in islanded microgrids. IEEE Syst. J. 2020, 14, 1080–1087. [Google Scholar] [CrossRef]
  15. Zimmermann, T.; Keil, P.; Hofmann, M.; Horsche, M.F.; Pichlmaier, S.; Jossen, A. Review of system topologies for hybrid electrical energy storage systems. J. Energy Storage 2016, 8, 78–90. [Google Scholar] [CrossRef]
  16. Abbey, C.; Strunz, K.; Joos, G. A knowledge-based approach for control of two-level energy storage for wind energy systems. IEEE Trans. Energy Convers. 2009, 24, 539–547. [Google Scholar] [CrossRef]
  17. Nguyen, C.L.; Lee, H.H. Optimization of wind power dispatch to minimize energy storage system capacity. J. Elect. Eng. Technol. 2014, 9, 1080–1088. [Google Scholar] [CrossRef] [Green Version]
  18. Jing, W.; Lai, C.H.; Wong, S.; Wong, M. Battery-supercapacitor hybrid energy storage system in standalone DC microgrids: A review. IET Renew. Power Gener. 2017, 11, 461–469. [Google Scholar] [CrossRef]
  19. Li, W.; Joos, G.; Belanger, J. Real-time simulation of a wind turbine generator coupled with a battery supercapacitor energy storage system. IEEE Trans. Ind. Electron. 2010, 57, 1137–1145. [Google Scholar] [CrossRef]
  20. Chong, L.W.; Wong, Y.W.; Rajkumar, R.K.; Isa, D. Hybrid energy storage systems and control strategies for stand-alone renewable energy power systems. Renew. Sustain. Energy Rev. 2016, 66, 174–189. [Google Scholar] [CrossRef]
  21. MATLAB; Version 9.7.0 (R2019b); The MathWorks Inc.: Natick, MA, USA, 2019.
  22. Real Time Data, Sotavento. Available online: http://www.sotaventogalicia.com/en/real-time-data/historical (accessed on 5 September 2021).
  23. PV Ladder Statistics. 2020. Available online: https://pvoutput.org/list.jsp?id=14676&sid=19720 (accessed on 5 September 2021).
  24. Kolter, J.Z.; Johnson, M.J. Redd: A public data set for energy disaggregation research. In Proceedings of the SustKDD Workshop on Data Mining Applications in Sustainability, San Diego, CA, USA, 21–24 August 2011. [Google Scholar]
  25. Huber, J.E.; Kolar, J. Applicability of solid-state transformers in today’s and future distribution grids. IEEE Trans. Smart Grid 2019, 10, 317–326. [Google Scholar] [CrossRef]
  26. Blanes, J.M.; Gutierrez, R.; Garrigos, A.; Lizan, J.L.; Cuadrado, J.M. Electric vehicle battery life extension using ultracapacitors and an FPGA controlled interleaved buck-boost converter. IEEE Trans. Power Electron. 2013, 28, 5940–5948. [Google Scholar] [CrossRef]
  27. RND Programmable DC Power Supply, Datasheet RND 320-KD3305P. Available online: https://www.elfa.se/Web/Down-loads/_t/ds/RND%-20320-KD3305P_eng_tds.pdf (accessed on 5 September 2021).
  28. RND Programmable DC Electronic Load, Datasheet RND 320-KEL102. Available online: https://www.elfa.se/Web/Down-loads/_t/ds/RND%-20320-KEL102_eng_tds.pdf (accessed on 5 September 2021).
  29. RS PRO Lithium Iron Phosphate Battery, Datasheet. Available online: https://docs.rs-online.com/c8bb/0900766b8172be40.pdf (accessed on 5 September 2021).
  30. RND Radial Super Capacitor, Datasheet RND 150HP-2R7-J248UNJ50. Available online: https://www.elfa.se/Web/Down-loads/_t/ds/RND%-20150HP-2R7-J248UNJ50_eng_tds.pdf (accessed on 5 September 2021).
  31. IRL2505PBF—MOSFET N, ELFA. Available online: https://www.elfa.se/en/mosfet-60-104-200-to-220-ir-irl2505pbf/p/17137722?q=MOSFET+N&pos=32&origPos=31&origPageSize=50&track=true (accessed on 5 September 2021).
  32. Mulleriyawage, U.G.; Shen, W.; Hu, C. Battery system selection in dc microgrids for residential applications: An Australian case study. In Proceedings of the 14th IEEE Conference on Industrial Electronics and Applications (ICIEA), Xi’an, China, 19–21 June 2019. [Google Scholar]
  33. Xu, B.; Oudalov, A.; Ulbig, A.; Andersson, G.; Kirschen, D. Modeling of lithium-ion battery degradation for cell life assessment. IEEE Trans. Smart Grid 2018, 9, 1131–1140. [Google Scholar] [CrossRef]
  34. Petreus, D.; Moga, D.; Galatus, R.; Munteanu, R. Modeling and sizing of supercapacitors. Adv. Electr. Comput. Eng. 2018, 8, 15–22. [Google Scholar] [CrossRef]
  35. Amiryar, M.E.; Pullen, K.; Nankoo, D. Development of a high-fidelity model for an electrically driven energy storage flywheel suit-able for small scale residential applications. Appl. Sci. 2018, 8, 453. [Google Scholar] [CrossRef] [Green Version]
  36. Ecker, M.; Nieto, N.; Käbitz, S.; Schmalstieg, J.; Blanke, H.; Warnecke, A.; Sauer, D. Calendar and cycle life study of Li(NiMnCo)O2-based 18650 lithium-ion batteries. J. Power Sources 2014, 248, 839–851. [Google Scholar] [CrossRef]
  37. Stroe, D.I.; Knap, V.; Swierczynski, M.; Stroe, A.I.; Teodorescu, R. Operation of a grid-connected lithium-ion battery energy storage system for primary frequency regulation: A battery lifetime perspective. IEEE Trans. Ind. Appl. 2017, 53, 430–438. [Google Scholar] [CrossRef]
  38. Wang, J.; Purewal, J.; Liu, P.; Hicks-Garner, J.; Soukazian, S.; Sherman, E. Degradation of lithium ion batteries employing graphite negatives and nickel–cobalt–manganese oxide + spinel manganese oxide positives: Part 1, aging mechanisms and life estimation. J. Power Sources 2014, 269, 937–948. [Google Scholar] [CrossRef]
  39. Stroe, D.I.; Swierczynski, M.; Stan, A.I.; Teodorescu, R.; Andreasen, S.J. Accelerated lifetime testing methodology for lifetime estimation of lithium-ion batteries used in augmented wind power plants. IEEE Trans. Ind. Appl. 2014, 50, 4006–4017. [Google Scholar] [CrossRef]
  40. Zakeri, B.; Syri, S. Electrical energy storage systems: A comparative life cycle cost analysis. Renew. Sustain. Energy Rev. 2014, 42, 569–596. [Google Scholar] [CrossRef]
  41. Chemali, E.; Preindl, M.; Malysz, P.; Emadi, A. Electrochemical and electrostatic energy storage and management systems for electric drive vehicles: State-of-the-art review and future trends. IEEE J. Emerg. Sel. Top. Power Electron. 2016, 4, 1117–1134. [Google Scholar] [CrossRef]
  42. Ralon, P.; Taylor, M.; Ilas, A.; Diaz-Bone, H.; Kairies, K. Electricity Storage and Renewables: Costs and Markets to 2030; International Renewable Energy Agency: Abu Dhabi, United Arab Emirates, 2017. [Google Scholar]
  43. CARMEN, Marktübersicht Batteriespeicher. 2020. Available online: https://www.carmen-ev.de/service/marktueberblick/marktueber-sicht-batteriespeicher (accessed on 5 September 2021).
  44. Robyns, B.; Francois, B.; Delille, G.; Saudemont, C. Energy Storage in Electric Power Grids; ISTE-Wiley: London, UK, 2015; pp. 17–52. [Google Scholar]
  45. Herrera, V.I.; Gaztanaga, H.; Milo, A.; de Ibarra, A.S.; Etxeberria-Otadui, I.; Nieva, T. Optimal energy management and sizing of a battery-supercapacitor-based light rail vehicle with a multiobjective approach. IEEE Trans. Ind. Appl. 2016, 52, 3367–3377. [Google Scholar] [CrossRef]
Figure 1. Parallel active HESS configuration in a RES household-prosumer system.
Energies 14 07045 g001
Figure 2. Block diagram of the low-pass filter controller.
Energies 14 07045 g002
Figure 3. Simulation of the HESS in a household-prosumer system (battery-SC HESS with wind power).
Energies 14 07045 g003
Figure 4. Power flows between the RES, the load, and the HESS. (a) Wind-powered household-prosumer system. (b) PV-powered household-prosumer system.
Energies 14 07045 g004
Figure 5. Power flows of the ESDs in the single-battery ESS and the HESSs applied to a wind-powered household-prosumer system. (a) Battery power. (b) SC/flywheel power.
Energies 14 07045 g005
Figure 6. Power flows of the ESDs in the single-battery ESS and the HESSs applied to a PV-powered household-prosumer system. (a) Battery power. (b) SC/flywheel power.
Energies 14 07045 g006aEnergies 14 07045 g006b
Figure 7. Energy states of the ESDs in the single-battery ESS and the HESSs applied to a wind-powered household-prosumer system. (a) Battery energy state. (b) SC/flywheel energy state.
Energies 14 07045 g007
Figure 8. Energy states of the ESDs in the single-battery ESS and the HESSs applied to a PV-powered household-prosumer system. (a) Battery energy state. (b) SC/flywheel energy state.
Energies 14 07045 g008
Figure 9. Power flows of the ESDs in the battery-SC HESS with different time constants in a wind-powered household-prosumer system. (a) Battery power. (b) SC power.
Energies 14 07045 g009
Figure 10. Energy states of the ESDs in the battery-SC HESS with different time constants in a wind-powered household-prosumer system.
Energies 14 07045 g010
Figure 11. HESS experimental setup.
Energies 14 07045 g011
Figure 12. Measured currents through the ESDs in the experimental setup in the wind-powered system. (a) Single-battery ESS (b) Battery-SC HESS when Tf is 1800 s. (c) Battery-SC HESS when Tf is 3600 s.
Energies 14 07045 g012
Figure 13. Measured currents through the ESDs in the experimental setup in the PV-powered system. (a) Single-battery ESS. (b) Battery-SC HESS when Tf is 1800 s. (c) Battery-SC HESS when Tf is 3600 s.
Energies 14 07045 g013
Figure 14. SOC of ESDs in the experimental setup in the wind-powered system. (a) Single-battery ESS. (b) Battery-SC HESS when Tf is 1800 s. (c) Battery-SC HESS when Tf is 3600 s.
Energies 14 07045 g014
Figure 15. SOC of the ESDs in the experimental setup in the PV-powered system. (a) Single-battery ESS. (b) Battery-SC HESS when Tf is 1800 s. (c) Battery-SC HESS when Tf is 3600 s.
Energies 14 07045 g015
Figure 16. Variations of the maximum battery charging power and discharging power with increasing Tf. (a) Wind-powered household-prosumer system. (b) PV-powered household-prosumer system.
Energies 14 07045 g016
Figure 17. Variations of the energy losses of the HESSs with increasing Tf. (a) Wind-powered household-prosumer system. (b) PV-powered household-prosumer system.
Energies 14 07045 g017
Figure 18. Variations of ΔE and capacities of the ESDs with increasing Tf in a wind-powered household-prosumer system. (a) Battery-SC HESS. (b) Battery-flywheel HESS.
Energies 14 07045 g018
Figure 19. Variations of ΔE and capacities of the ESDs with increasing Tf in a PV-powered household-prosumer system. (a) Battery-SC HESS. (b) Battery-flywheel HESS.
Energies 14 07045 g019
Figure 20. Distribution of the battery current rates during one day in a wind-powered household-prosumer system (0 C is the interval between ±0.04 C).
Energies 14 07045 g020
Figure 21. Estimate lifetimes of batteries in the HESSs with increasing time constant. (a) Wind-powered household-prosumer system. (b) PV-powered household-prosumer system.
Energies 14 07045 g021
Figure 22. Costs of the single-battery ESS, the battery-SC HESS, and the battery-flywheel HESS over 30 years (Tf is 3600 s). (a) Wind-powered household-prosumer system. (b) PV-powered household-prosumer system.
Energies 14 07045 g022
Table 1. Losses in different ESS combinations.
ESS/HESS (Tf = 1800 s)Loss in ConvertersCycle Loss of ESDsSelf-Discharge Loss of ESDsTotal Loss in ESS/HESS
Wind-poweredSingle-battery ESS514 Wh68 Wh47Wh629 Wh
Battery-SC HESS671 Wh107 Wh116 Wh894 Wh
Battery-flywheel HESS717 Wh142 Wh727 Wh1586 Wh
PV-poweredSingle-battery ESS538 Wh72 Wh49 Wh659 Wh
Battery-SC HESS793 Wh158 Wh97 Wh1048 Wh
Battery-flywheel HESS765 Wh152 Wh823 Wh1740 Wh
Table 2. Comparison of the ΔE and the losses of the ESDs with different time constants.
ESS/HESSBattery ΔESC ΔETotal ΔEIncreaseLoss in ConvertersESD Cycle LossESD Self-Discharge LossTotal Loss
Single-battery3214 Wh-3214 Wh-514 Wh68 Wh47 Wh629 Wh
HESS (Tf = 1800 s)2822 Wh665 Wh3487 Wh9%671 Wh107 Wh116 Wh894 Wh
HESS (Tf = 3600 s)2638 Wh1017 Wh3655 Wh14%783 Wh139 Wh125 Wh1047 Wh
Table 3. Nominal parameters of the experimental devices.
DevicesSpecifications
RES power emulatorProgrammable power supply:
RND 320-KD3305P [27]
Load power emulatorProgrammable DC electronic load:
RND 320-KEL102 [28]
Battery cell12.8 V/7.5 Ah ×2 cells, 192 Wh,
RS PRO Lithium Iron Phosphate Battery [29]
Supercapacitor cell2400 F/2.7 V ×12 cells, 24 Wh,
RND Radial Super Capacitor [30]
DC/DC converterSwitching frequency: 62.5 kHz,
C = 1000 µF, L = 174 µH,
MOSFET: IRL2505PBF-MOSFET N [31]
Table 4. Nominal parameters of the experimental devices.
ParametersValueUnitSource
c_bat_NMC495€/kWh[40,41,42,43]
c_bat_LFP420€/kWh[40,41,42,43]
cins_bat200Assumption
c_SC10,000€/kWh[44]
cins_SC200Assumption
c_fly2815€/kWh[40]
cins_fly1000Assumption
c_con150€/kW[45]
The exchange rate between the euro and US dollar is used as 0.86 when parameters are converted from the references.
Table 5. Battery lifetime estimation and cost of the energy storage system (30 years project lifetime).
ESS CombinationBattery LifetimeLifetime ExtensionInitial CostTotal CostCost Increase
Wind-poweredSingle-NMC battery725 days/2.0 years-2836 €31,072 €-
NMC battery-SC HESS853 days/2.3 years18%13,317 €31,746 €674 €
NMC battery-flywheel HESS868 days/2.4 years20%7318 €26,681 €−4391 €
Single-LFP battery1581 days/4.3 years-2550 €12,157 €-
LFP battery-SC HESS2027 days/5.6 years28%13,084 €19,582 €7425 €
LFP battery-flywheel HESS2092 days/5.7 years32%7073 €13,905 €1748 €
PV-poweredSingle-NMC battery751 days/2.1 years-3605 €40,763 €-
NMC battery-SC HESS904 days/2.5 years20%18,019 €44,037 €3274 €
NMC battery-flywheel HESS928 days/2.5 years24%9257 €35,028 €−5735 €
Single-LFP battery1628 days/4.5 years-3205 €16,419 €-
LFP battery-SC HESS2124 days/5.8 years30%17,690 €26,891 €10,472 €
LFP battery-flywheel HESS2215 days/6.1 years36%8843 €16,573 €154 €
Publisher’s Note: MDPI stays neutral with regard to jurisdictional claims in published maps and institutional affiliations.

