Article

Electrification of Inland Waterway Ships Considering Power System Lifetime Emissions and Costs

Faculty of Mechanical Engineering and Naval Architecture, University of Zagreb, 10002 Zagreb, Croatia
*
Author to whom correspondence should be addressed.
Energies 2021, 14(21), 7046; https://doi.org/10.3390/en14217046
Submission received: 4 September 2021 / Revised: 7 October 2021 / Accepted: 21 October 2021 / Published: 28 October 2021

Abstract

:
This paper deals with the applicability of alternative power system configurations to reduce the environmental footprint of inland waterway ships. Its original contribution includes: models for assessment of the lifetime emissions and associated lifetime costs of alternative power system configurations for different types of inland waterway vessels, identification of the most cost-effective options for these vessels, and an estimation of the impact of emission policies on the profitability of each option. The case study considers the Croatian inland waterway sector, where three types of vessel with significantly different purposes, designs, and operative profiles are considered (cargo ship, passenger ship, and dredger). The technical and operational features of these ships are analyzed with an emphasis on their energy needs. Then, life-cycle assessments (LCAs) of a diesel engine-powered ship configuration and two battery-powered ship configurations (with and without a photovoltaic system) are performed by means of GREET 2020 software. These configurations are compared from the economical viewpoint, by the life-cycle cost assessment (LCCA), where potential carbon credit scenarios are investigated, while relevant quantities are converted into monetary units. Although the LCA identified the photovoltaic cells’ battery-powered ship configuration as the most environmentally friendly, according to the LCCA, its life-cycle costs are rather high, except for passenger ships, for which the battery-powered ship configuration is a feasible option. If a set of required specific input data is known, the presented procedure is applicable to reduce the environmental footprint of any other inland waterway fleet.

1. Introduction

Inland navigation is, together with road and rail transport, one of the three mainland transport modes and can be considered as the most cost-effective and safest mode of transport [1]. Freight and passengers are transported by vessels via inland waterways, such as canals, rivers, and lakes, between inland ports and wharfs [2]. Design requirements for inland waterway vessels and seagoing vessels are fundamentally different, and therefore inland waterway vessels are generally not allowed to navigate at sea [3]. Xing et al. [4] compared the operational energy efficiency of inland waterway vessels with seagoing vessels and concluded that the presence of a river current leads to a reduction of energy efficiency for vessels engaged in inland waterway transportation.
Research into emissions from shipping and their impact on air quality has mainly been directed to seagoing vessels, such as in the studies by Ančić et al. [5], Lindstad et al. [6], Miola and Ciuffo [7], Ammar and Seddiek [8], and Chen et al. [9], and has focused less on inland waterway vessels. However, it is important to mention that inland navigation regularly takes place within highly populated areas, and its effect is therefore even more pronounced [10,11]. This particularly refers to emissions that have a strongly local character, although carbon dioxide (CO2) emissions should not be ignored either.
The exhaust gases produced by the combustion of fuel oil in marine engines contain different harmful substances, such as sulphur oxides (SOX), nitrogen oxides (NOX), carbon monoxide (CO), particulate matter (PM), and greenhouse gas (GHG) emissions, which particularly refer to the emissions of CO2, methane (CH4), and nitrous oxide (N2O). In order to control these emissions, the International Maritime Organization (IMO) has set different standards related to the Energy Efficiency Design Index (EEDI) and Ship Energy Efficiency Management Plan (SEEMP) [12]. Furthermore, by establishing several Emission Control Areas (ECAs), IMO has ensured emission control in specific areas where emission requirements are stricter than outside these areas [13]. SOX emission control is performed by limiting the sulphur content in fuel, while NOX emissions are limited depending on the engine maximum operating speed. Both the SOX and NOX regulation standards differ depending on the navigation area (global or ECA) [14]. Besides their environmental impact, exhaust gases negatively affect human health [15]. This is more pronounced when ships spend more time in ports and near inhabited areas [16], which is typical for ships engaged in short-sea shipping and inland navigation.
The most attractive research topic in the field of shipping emissions is decarbonization, i.e., reduction of GHG emissions. Generally, decarbonization of the shipping industry can be achieved by increasing ship energy efficiency, leading to a reduction in fuel oil consumption and ultimately to a reduction in GHG emissions [17]. Bouman et al. [18] discussed technical and operational decarbonization measures that can be implemented in the shipping sector. Since most of the measures are based on the reduction of fuel consumption, besides GHGs, other emissions (NOX, SOX, PM, etc.) are reduced as well. Among different operational measures, voluntary speed reduction represents the most effective operational measure for CO2 reduction, as investigated by Corbett et al. [19] and Lindstad et al. [20]. Furthermore, the most promising technical measure to reduce the negative effects of shipping emissions includes replacing conventional marine fuel oil with alternative fuels (such as biodiesel, hydrogen, electricity, natural gas, methanol, dimethyl ether, ammonia, etc.) as indicated in the study of Perčić et al. [21] and replacing the conventional propulsion system (a diesel-engine-powered ship) with a hybrid propulsion system (HPS) or an integrated propulsion system (IPS) [22]. Psaraftis et al. [23] investigated the inclusion of carbon allowance policy in the shipping sector as a market-based measure that could lead to decarbonization, where the CO2 cost impact represents an incentive to implement technical or operational measures that result in lower CO2, preferably a zero-carbon emission solution, such as full electrification of ships. Such a ferry was presented by Gagatsi et al. [24]. The great advantage of such vessels is that they do not release exhaust gases during navigation, although they do have some limitations regarding battery capacity, power source degradation, price, weight, and charging, as well as sailing distance [25]. A comprehensive review of promising technologies and practices that are applicable to onboard energy systems of all-electric ships, including sensitivity analysis of the energy efficiency of all-electric ships with respect to different applications, was recently done by Nuchturee et al. [26].
The implementation of renewable power sources onboard leads to a reduction of emitted GHGs, as indicated in many studies. Geertsma et al. [27] presented a review of developments in the field of design and control of HPSs for smart ships analyzing their trends, challenges, and opportunities and finally claiming that a combination of torque, angle of attack, and relevant control strategy could improve their fuel consumption and consequently environmental footprint. In the design and operation of ships with HPS, optimal sizing of power generation units plays a key role, where regularly minimum investment and operating costs are set as objectives [28]. However, most often, expenses related to emission allowance are not taken into account. Ghenai et al. [29] presented an HPS for a cruise ship, where the total power is generated by photovoltaic (PV) cells, fuel cells, and a diesel generator, which also resulted in reduced emissions. The inclusion of a battery system for a diesel mechanical short sea ship was investigated by Ritari et al. [30], who claimed that the battery system can result in significant fuel savings, which become more important with the increase in fuel price. By investigating a PV cell diesel. engine-powered ship, Yuan et al. [31] showed that its operation leads to a reduction in both diesel consumption and GHG emissions. Wu et al. studied cost-effective energy management strategies considering hybrid fuel cell and battery propulsion systems for coastal ships, providing a novel so-called reinforcement learning approach for their optimal use [32]. Energy management itself represents an important research topic for both hybrid and all-electric vessels, as can be seen in [32,33]. HPSs are presented for different ship types differing in their purposes and operative performances, as for instance tankers [28], cruise ships [29], passenger ferries [32], offshore platform supply vessels [34], etc., but in most cases, investment costs represent a key issue in their wider application. However, life-cycle assessment (LCA) of a new-build HPS for a ro-ro cargo ship performed by Ling-Chin and Roskilly, ref. [35], by means of GaBi software, resulted in a rather high impact on the environment, human beings, and natural reserves. Furthermore, as reported by Lindstad et al. [36], a combination of battery and internal combustion engines on an existing ship resulted in reduced emissions, but the main obstacle for this retrofit was the price of the battery. One way to evaluate the profitability of a retrofit is to consider the total life-cycle costs (LCCs) by performing a life-cycle cost assessment (LCCA). Wang et al. [37] investigated the implementation of a solar panel array onboard a ferry where the LCCA results showed that the investment payback period is only three years, which makes a solar panel array not only an environmentally friendly technology but also an economical one. It is necessary to mention that these findings are generally applicable but strongly dependent on a set of assumptions and considered operative conditions.
Based on the above extensive literature review, an evident literature gap can be seen. Even though the utilization of renewable energy sources onboard shows a reduction in shipping emissions, none of these studies was oriented towards inland waterway vessels. Due to the many special features inherent in inland waterway transport, the results of the above-mentioned studies cannot be directly used, especially regarding cost assessments. So, it is not clear which option would have the lowest environmental impact and would be the most profitable for inland waterway vessels. Moreover, the operation of inland waterway vessels is highly dependent on the location, since waterway conditions regularly differ greatly from one area to another, and the application of relevant measures to improve ship energy efficiency should be assessed on a case-by-case basis. Therefore, the aim of this paper is to set a model for investigation of the applicability of different power system configurations both from the environmental and economic point of view for the retrofit of three different vessel types. The procedure is illustrated for the Croatian inland waterway fleet, which is rather aged and requires a significant increase in its energy efficiency and reductions in fuel oil consumption to meet emerging environmental requirements. However, it is applicable to any other inland waterway sector, if a set of input data is known. It should be mentioned that the bounds of the analysis are set at the single ship level, while this paper did not address the cooperation and optimal operation of onboard energy systems and on-land shore power. This should be considered further in order to obtain cost savings from the perspective of a shipping company, where approaches from [38,39] could be adopted.
The original contribution of this study is summarized as follows: (a) the development of models to assess the GHG, NOX, SOX, and PM10 emissions of different power system configurations for three inland waterway vessels; (b) the identification of the most cost-effective powering option for the observed ships; and (c) an estimation of the policy impact on the profitability of each option. In order to achieve a fair comparison between different power system configurations, an approach by Jeong et al. [40] is adopted, where all incomparable values are converted into monetary values, and the proper solution is selected in a straightforward manner.
This paper is structured into six sections. In the next section, the methodology is described. A model for alternative power configuration selection that takes into account lifetime emissions and costs is elaborated. The LCA and LCCA procedures are described in detail. The third section is dedicated to the analysis of the Croatian inland waterway fleet, with the aim of identifying typical vessels according to their purpose and operative profile and to calculate their energy needs as a prerogative for LCA and LCCA. The results are listed in the fourth section, while a discussion of the procedure and the obtained results are presented in the fifth section. Finally, concluding remarks are drawn in the sixth section.

2. Methodology

In order to evaluate the environmental impact and identify which power system is the most suitable for implementation, LCAs of different power system configurations oriented to ship electrification are performed.
The flowchart of the procedure is presented in Figure 1. The first step is fleet analysis, which includes gathering information about ship types, their purposes, operative profiles, their power systems, etc. Based on the ship purposes and their operative profiles, representatives are selected. Then, the ship power needs are calculated, enabling the definition of alternative power system configurations. In the next step, the emissions of an existing power system configuration as the referent one, as well as of the alternative ones, is evaluated through a set of LCAs [41]. Additionally, the lifetime economic performance of different power system configurations is evaluated by LCCAs.
After performing LCAs and LCCAs, the comparative analysis between different power system configurations can be done and viable environmentally friendly options can be selected.

2.1. Calculation of Ship Energy Needs

The inland waterway fleet is affected by the unidirectional currents and the geographical characteristics of the inland waterways [4]. Depending on the type of waterway, the fleet usually consists of river vessels, vessels that operate on lakes, and stationary vessels. All these types of vessels require a specific approach in defining their energy needs. To calculate the average ship power, Pave (kW), the main engine power, PME,ave (kW), and the auxiliary engine power, PAE,ave (kW), are summed:
P a v e = P M E , a v e + P A E , a v e .
By dividing Pave with the average ship speed, v (km/h), the ship energy consumption per distance travelled, EC (kWh/km), can be calculated:
E C = P a v e v .
From the calculated energy consumption, the annual energy consumption can be determined. The calculation is influenced by the exploitation characteristics of the fleet, i.e., the type of the representative ship. The exact equations are given in the next subsections.
The fuel oil consumption, FOC, is calculated by multiplying the energy consumption with the specific fuel oil consumption, SFOC, which is determined depending on the engine speed. As proposed by Ančić et al. [42], for high-speed engines, the SFOC is assumed to be 215 g/kWh. The FOC per distance travelled can be calculated as follows:
F O C = E C S F O C   .

2.1.1. Energy Needs of River Vessels

The ship speed depends on several factors, such as the draught, environmental conditions, river speed, and the direction of navigation (upstream and downstream). Taking into account the exploitation characteristics of a river ship, the energy consumption Equation (2) can be modified:
E C u p = P a v e v u p , E C d o w n = P a v e v d o w n ,
where ECup (kWh/km) denotes the energy consumption for the ship sailing upstream and ECdown (kWh/km) for the ship sailing downstream. The annual energy consumption ECA,river in kWh can be calculated according to:
E C A , r i v e r = E C u p + E C d o w n L O T N R T ,
where LOT (km) denotes the length of a one-way trip, and NRT denotes the annual number of return trips.
The fuel oil consumption both for the upstream, FOCup, (kg/km), and for the downstream, FOCdown (kg/km), journey of the ship is calculated with the following equations:
F O C u p = E C u p S F O C , F O C d o w n = E C d o w n S F O C   .
If the ship operates on lakes, or the river current is negligible, the power for both upstream and downstream sailing is considered to be equal, and the annual energy consumption in kWh equals:
E C A , l a k e = E C L R T N R T ,
where LRT (km) denotes the length of the return trip.

2.1.2. Energy Demands of Stationary Units

The stationary unit performs a particular task, so it does not have a specific navigation route since most of the time it is located at the same position. Consequently, it is not possible to calculate the energy consumption in kWh/km for this ship according to Equation (2). Hence, a modified approach is required. By assuming the average load of the ship power, it is possible to approximately determine the time that the vessel spends in operation annually, tA,stat (h), by the following equation:
t A , s t a t = F O C A , s t a t ρ P a v e , s t a t S F O C ,
where FOCA,stat denotes the annual fuel oil consumption of the vessel in L, ρ denotes the fuel oil density in kg/L, and Pave,stat denotes the average power onboard the vessel in kW. The annual energy consumption of the vessel, ECA,stat, in kWh can then be calculated as follows:
E C A , s t a t = P a v e , s t a t t A , s t a t .

2.2. LCA

2.2.1. General

Increased awareness of the importance of environmental protection and the greenhouse effect has led to the development of a method for the assessment of the environmental impact of a product through the emissions that are associated with it. This method is known as LCA. According to the International Organization for Standardization [43], LCA investigates the product’s influence on the environment throughout its life-cycle, which includes:
  • Raw material recovery;
  • Production or manufacturing;
  • Use of the product;
  • End of life treatment; and
  • Recycling and final disposal.
In this paper, LCAs are performed by means of GREET 2020 software [44]. The used tool offers two options in setting the analysis boundaries: observing the processes of raw material recovery, the production of the power source, and its supply to the ship, i.e., “well-to-pump” (WTP), or observing the processes of WTP plus the use of power sources in the ship operation (“pump-to-wake” (PTW)), i.e., “well-to-wake” (WTW). The WTW emissions and emissions released during the manufacturing process of the power system configuration represent the total environmental footprint of that configuration. In addition to WTP and PTW emissions, emissions released from the manufacturing processes of a major element in the power system configuration are also considered, i.e., the manufacturing process of battery/diesel engine/PV cell materials. The GREET 2020 software is used to calculate emissions released during these processes based on its database, while the inputs are the weights of different materials that constitute a major element of the power system configuration. Since the LCA considers emissions during the life-cycle, all materials that are taken into account are analyzed according to the ship lifetime mileage, which is other input data for an analysis of the manufacturing processes. It should be noted that there are different life-cycle tools with their own sets of databases, but at this level of analysis, the GREET software can be reliably used for relatively simple pathways, as indicated in the recent [45,46,47,48].
As mentioned above, this paper considers electrification of inland waterway ship power systems as an alternative to widespread diesel engine-powered options, with the aim to reduce lifetime emissions and costs. Therefore, in the next subchapters, LCAs and LCCAs of such power system configurations are explained.

2.2.2. LCA of Diesel Engine-Powered Ships

In order to assess the lifetime emissions of diesel engine-powered ships (as the referent case), the processes of diesel engine manufacturing, crude oil recovery and its transportation to the refinery, diesel refining, distribution, and the combustion of diesel in the engine need to be considered, as shown in Figure 2. The environmental impact of diesel engines was assessed by observing the manufacturing process and calculating the weights of the engine materials.
WTP emissions in this case refer to fuel oil production and distribution. By knowing the type of fuel the fleet uses, the parameters are obtained and the process of diesel refining and the process of crude oil recovery can be described.
Tailpipe emissions (TE), i.e., PTW emissions, refer to emissions released due to the combustion of diesel in the ship’s engines. These emissions are calculated by multiplying the ship’s fuel oil consumption with the emission factor, by the following equation:
T E = F O C E F ,
where EF denotes the emission factor in kg gas/kg fuel and they are obtained from [49]. To evaluate the contribution to the greenhouse effect from different GHGs, the global warming potential (GWP) has been developed. It represents a measure of how much energy the emission of one ton of a gas will absorb over a given period, relative to the emission of one ton of CO2. The time range usually used is 100 years and, typically, GHGs are reported in CO2-eq [50].

2.2.3. LCA of Battery-Powered Ships

The power system configuration that was considered as an option for retrofitting the diesel engine-powered ships is the battery-powered ship configuration. Essentially, instead of a diesel engine, a lithium-ion (Li-ion) battery is installed onboard and used to supply the power required for ship operation. Even though a Li-ion battery is quite expensive, it has by far the highest energy density compared to other types of batteries [51], and it is most prominent in shipping applications. When observing the life-cycle of a battery-powered ship, with the WTP of electricity, the process of battery manufacturing is also considered as a source of lifetime emissions, as shown in Figure 3.
A battery-powered ship is supplied with power by the battery only, and during its operation, it does not release exhaust gases. Hence, it has zero PTW emissions. It is assumed that the ship is powered by an electric motor and that the power needs (of the existing diesel engine-powered ship) remain unchanged. Due to losses in the energy conversion of the battery-powered ship configuration, the required power supplied by the battery should be divided by the coefficient of efficiency, ηBAT, which equals 0.91. Therefore, the average power output of the battery PBAT,ave yields:
P B A T , a v e = P a v e η B A T   .
The annual energy consumption calculated for the diesel-powered ship according to Equations (2), (4), and (9) should also be divided by the coefficient of efficiency in order to determine the energy consumption for battery-powered ships ECBAT:
E C B A T , A = E C A η B A T .
The battery capacity, BC (kWh), depends on the route the ship is sailing, i.e., the possibilities to plug in to charge the battery. For safety reasons, the required capacities are increased, and the increase is set at 25%. Depending on the type of the ship, the following set of equations can be derived:
B C = 1.25 E C B A T L , B C = 1.25 E C B A T t D A Y ,
where L denotes the length of a one-way or the length of the return trip in km, and tDAY denotes the number of operating hours in a day. Commercial Li-ion battery technology has limits regarding maximum power density [52]. With an assumed power density, the weights of batteries were calculated. The battery manufacturing process parameters are obtained from the GREET 2020 database.
The WTP of electricity refers to the process of electricity generation. The process is significantly affected by the price of electricity, which is directly related to the shares of electricity generation sources.

2.2.4. LCA of PV Cells Battery-Powered Ships

The second power system configuration considered for retrofitting the diesel-engine-powered vessels is the PV system implemented on board with a battery power system configuration (PV cell battery-powered ship). A PV system is made of PV modules, which consist of many individual interconnected PV cells. Their main advantage is the direct transformation of solar power into electric power, but their efficiency is low. Another limitation is the installation area on board. Usually, the PV cells are placed on the top deck in order not to disturb the passengers, the crew, and the ship operations. Therefore, the ship’s dimensions limit the installation area. Since the PV system is implemented onboard, the off-grid system needs a rechargeable battery, which can be used when there is little or no output from the PV system, for example, on a cloudy day or at night [53]. The LCA of a PV cell battery-powered ship considers the WTP emissions of electricity and emissions released from the processes of Li-ion battery and PV module manufacturing. Like the previous option, this one also has zero PTW emissions, as shown in Figure 4.
The utilization of solar energy depends on the area of navigation and its average annual solar irradiance. Since the ship sails in different directions, it is not possible to align the PV cells directly to the sun. Therefore, they are placed horizontally. It is fair to say that there are more advanced models to consider PV source output in a marine environment like the one in [54] that takes into account the effect of a ship moving and rocking, but for inland waterway applications, such considerations are not necessary. Therefore, the total annual electric energy produced, EPV,A, by the PV system can be calculated according to the equation:
E P V , A = η P V E r a d A P V ,
where ηPV denotes the PV system efficiency, Erad denotes the average annual solar irradiance in kJ/m2, while APV refers to the available installation area for PV cells on board in m2. Since PV cells in a PV cell battery-powered ship generate part of the electric power required for ship propulsion, its WTP emissions are lower than for the battery-powered ship. The energy consumption of this option ECPV-BAT is reduced and equals:
E C P V B A T , A = 1.1 E C A E P V , A .

2.3. LCCA

2.3.1. General

The total costs of a ship power system configuration include investment costs and exploitation costs, as shown in Figure 5. The investment costs refer to the cost of retrofitting a ship. The maintenance cost, power source cost, and carbon credit cost are incorporated in the exploitation costs. The costs of replacements during the ship lifetime (particularly battery replacement) are considered as part of the maintenance costs.
Carbon credit, i.e., carbon pricing, can play an important role in providing an economically efficient incentive to reduce GHGs [55,56]. Even though it is not implemented yet in the shipping industry, some sectors have already done so (industry, aviation, the electric power sector). Carbon credit refers to emission allowances, which can be received or bought and even traded. Each allowance gives the right to emit 1 ton of CO2, the main GHG, or the equivalent amount of two more powerful GHGs, N2O and perfluorocarbons (PFCs) [57]. It is necessary to observe different carbon credit scenarios that could potentially be implemented in the shipping sector. A study on this was conducted by Trivyza et al. [58] for a cruise ship power system. Four scenarios were considered, which included the non-taxation scenario (NT) and three carbon credit scenarios. Three scenarios, CP (current policies), NP (new policies), and SD (sustainable development), were obtained from the World Energy Outlook 2018 [59], in which forecasted carbon allowance (CA) values for the years 2025 and 2040 are presented. These values refer to industry, aviation, and the electric power sectors in the European Union, and they are presented in Figure 6. For 2020, the CA value is zero, since carbon credit was not yet implemented in the shipping industry. The scenarios considered in this paper are:
  • NT scenario: carbon credit is not implemented;
  • CP scenario: which considers the current policies that are implemented in the energy sector;
  • NP scenario: which includes the current policies and incorporates the ambitions of the policy makers in the energy sector; and
  • SD scenario: which follows the 2030 agenda of the United Nations for Sustainable Development.
Figure 6. Carbon allowance scenarios.
Energies 14 07046 g006
Since carbon credit refers to permission to emit GHGs during ship operation, these scenarios are illustrated only on diesel engine-powered inland waterway vessels. In this paper, carbon credit refers to emissions expressed in CO2-eq.

2.3.2. LCCA of Diesel Engine-Powered Ships

As described in the previous section, the total costs of different power system configurations consist of the investment and exploitation costs. A major part of the investment cost in retrofitting a ship with a new diesel engine is the procurement and installation of the engine. Another part of the total cost is the annual maintenance cost.
Considering the operational characteristics of each ship, the annual fuel oil consumption cost (FOCCA) in € can be calculated. For the river and lake vessels, the following relation can be established:
F O C C A = F O C L R T N R T , A D P ρ ,
where DP refers to the price of diesel. To calculate the annual fuel oil consumption cost of a stationary vessel, Equation (16) should be modified into:
F O C C A , s t a t = F O C A , s t a t D P ρ .
Carbon credit cost (CCC) values in € are calculated taking into account different carbon pricing scenarios according to:
C C C = i = 1 t T E A , i C A i
where CAi denotes the carbon allowance in €/kg for a year i (Figure 6), TEA,i denotes the annual tailpipe emissions in kg for a year i obtained from the LCA results, and t refers to the years of ship lifetime.

2.3.3. LCCA of Battery-Powered Ships

The investment costs of the battery-powered ship configurations (ICB) are estimated according to the study conducted by Christos [60], in which the investment cost to retrofit a diesel engine-powered ferry into a battery-powered ferry is estimated. Roughly 45% of this cost is associated with the battery cost, while the remainder refers to the costs of the procurement and installation of the electric motors, converters, and regulators. Based on this relation, the investment cost is calculated according to the following equation:
I C B = B P B C 0.45 ,
where BP denotes the battery price and BC is calculated with Equation (13). The annual electric power cost EPCA for different vessels can be calculated according to:
E P C A = E C B A T , A E P P ,
where ECBAT,A is calculated with Equation (12), while EPP denotes the electric power price and it differs for different countries. Even though the configuration is considered to be virtually maintenance free, a battery replacement should be considered in the overall maintenance cost. Based on the forecast from the study by Tsiropoulos et al. [61], for 2030, the battery price (BP2030) should be reduced to around €169/kWh, which is then multiplied by the BC in order to obtain the maintenance cost (MCBAT):
M C B A T = B P 2030 B C .

2.3.4. LCCA of PV Cell Battery-Powered Ships

Life-cycle costs of a PV cell battery-powered ship are similar to those of a battery-powered ship, but additionally, the investment cost in the PV system, the maintenance costs related to the PV systems, as well as the reduced energy consumption should be accounted for. The annual electric power cost EPCPV-BAT,A for this option is also lower and is then calculated according to:
E P C P V B A T , A = E C P V B A T , A E P P ,
where ECPV-BAT,A is calculated with Equation (15). The investment cost of a PV cell battery-powered ship is obtained by summing up the investment cost of a battery-powered retrofit and the investment cost of a PV system (ICPV), which is calculated according to:
I C P V = A P V P V P ,
where APV denotes the area covered by the PV cells in m2 and PVP denotes the PV system price in €/m2. The annual maintenance cost represents a smaller percentage of investment costs. Manufacturers of PV cells provide a 20-year warranty for PV systems, and accordingly, the replacement cost for PV cells is calculated. In order to determine the maintenance cost for the entire PV cell battery-powered ship, both the maintenance cost of the PV cells and the replacement of the battery cost should be considered.

3. Case Study—The Croatian Inland Waterway Vessels

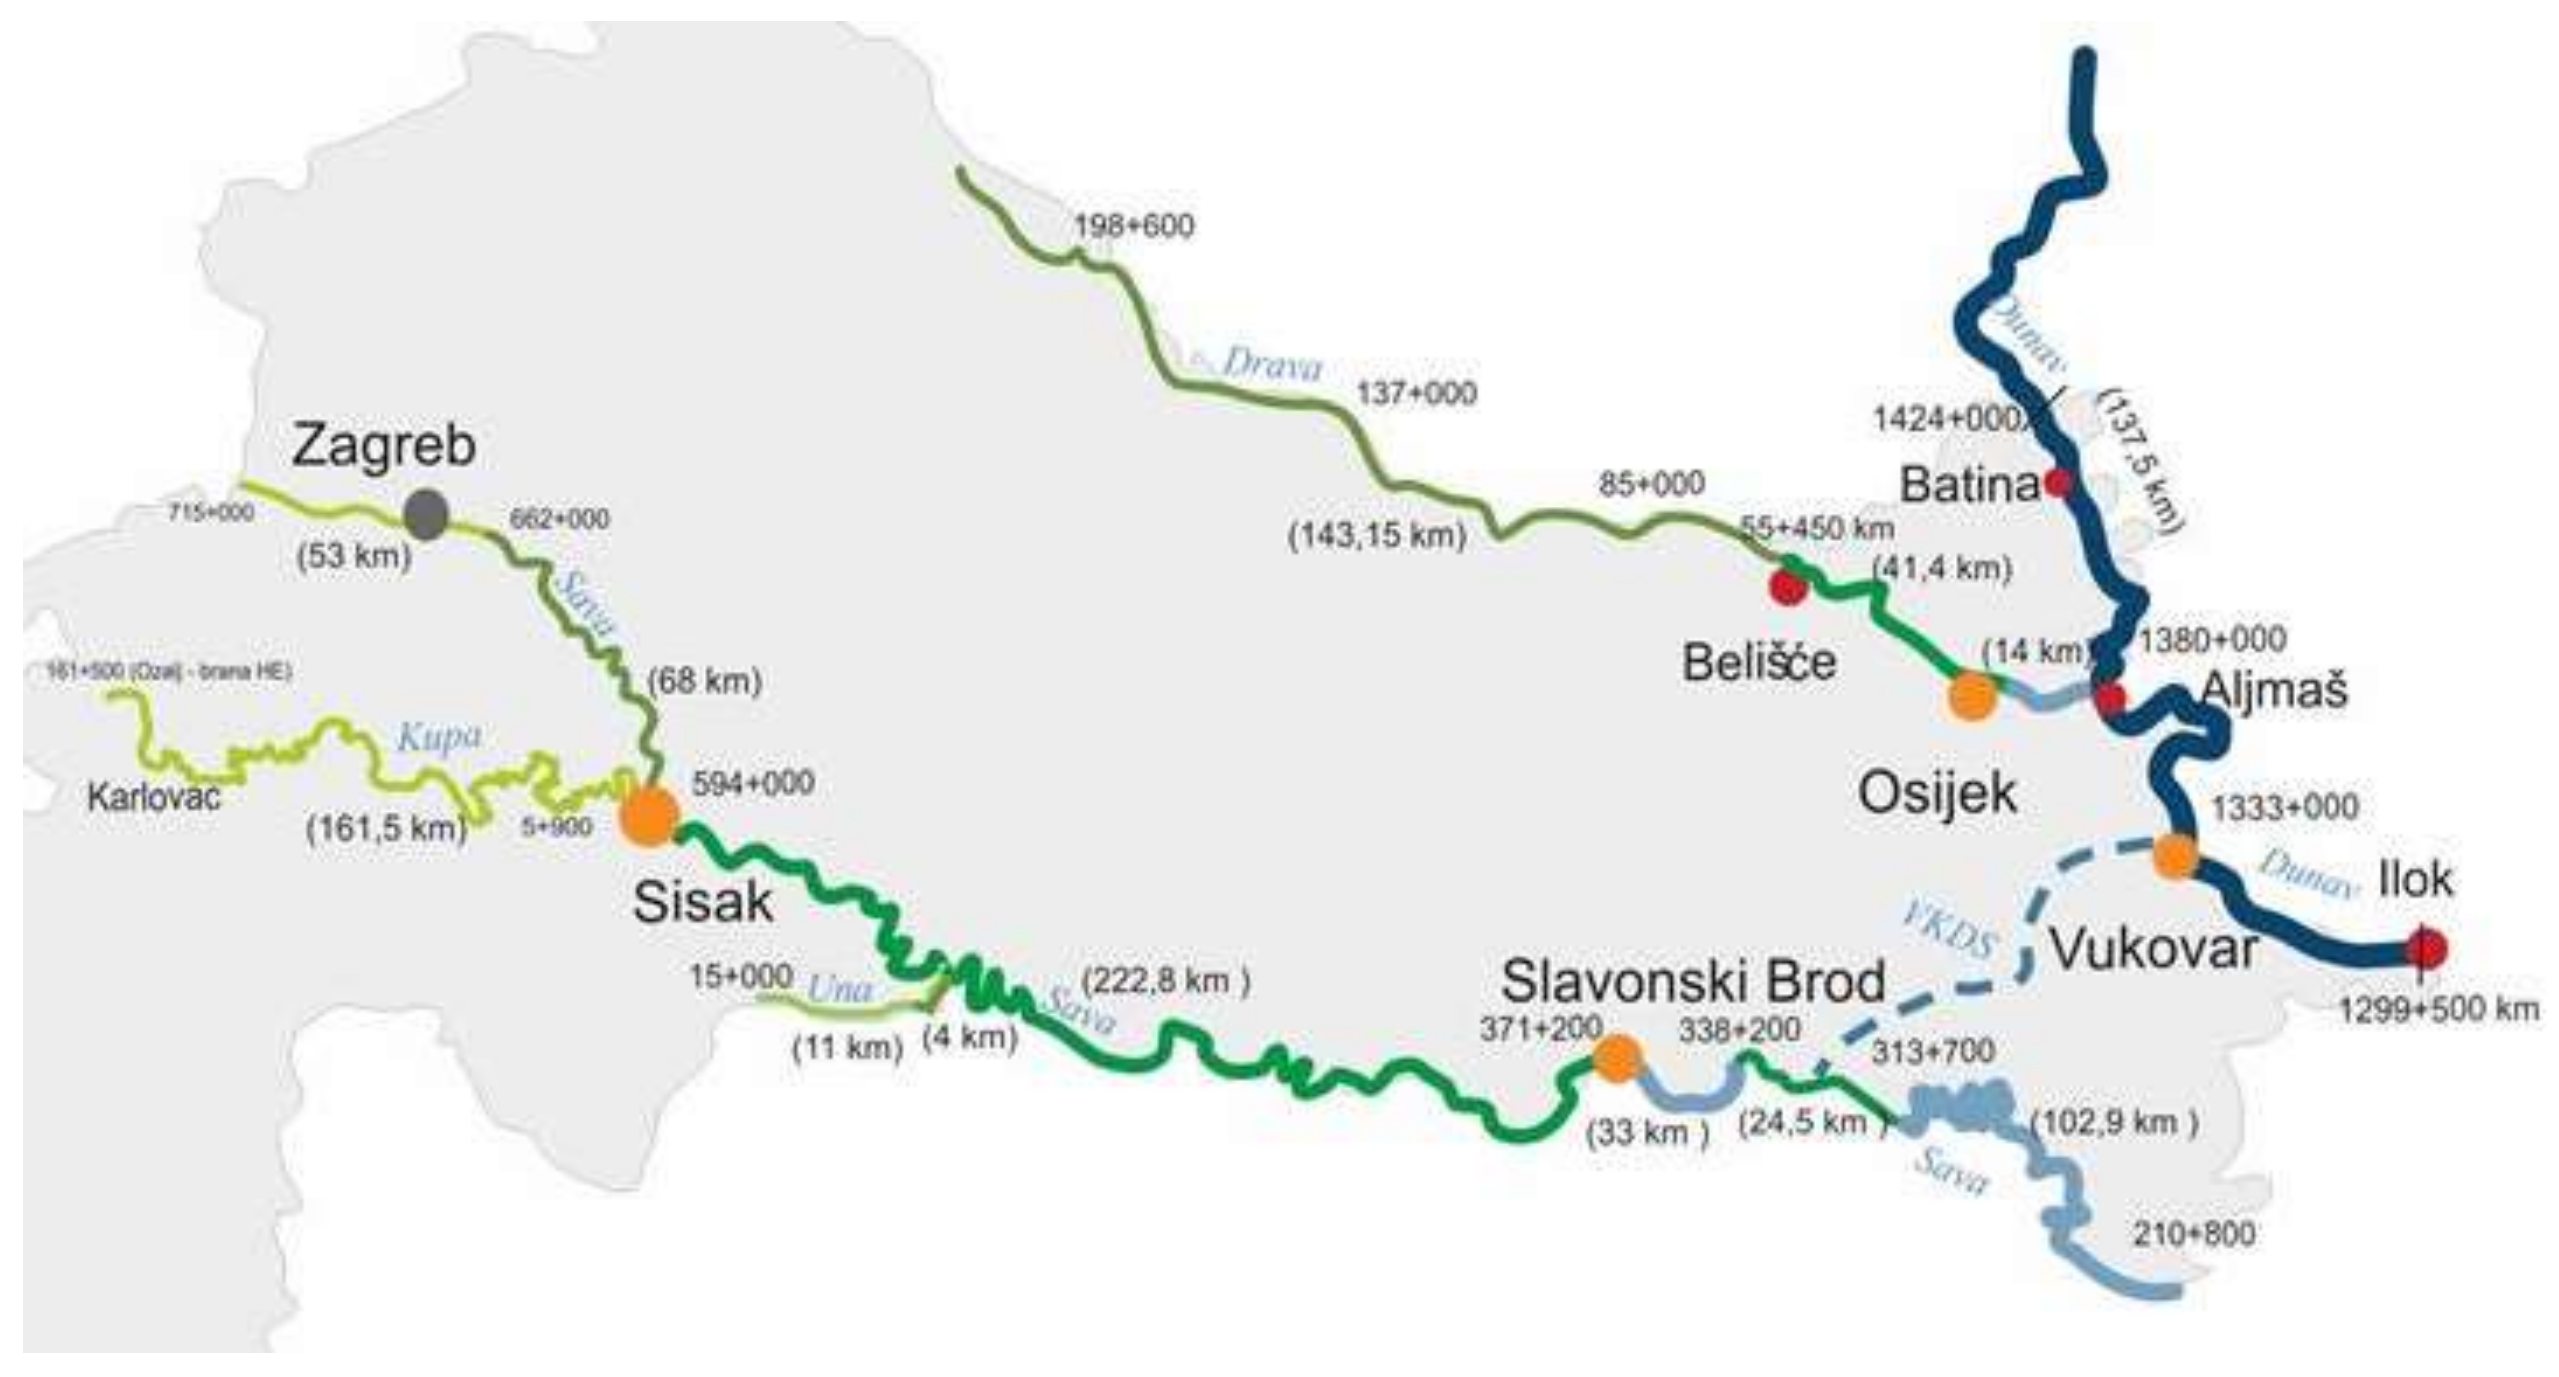
The Croatian inland waterway network consists of the natural streams of the Danube River (137.5 km), Sava River (446 km), Drava River (198.6 km), and Kupa River (5 km), Figure 7. This network’s geographical position in the center of Europe represents a significant potential. However, due to different navigation conditions, technical obsolescence, and low capacity, the Croatian inland navigation is underutilized [62]. In 2017, inland navigation accounted for 24% of the total Croatian shipping sector according to the data on goods carried [63]. Apart from rivers, some Croatian inland waterway vessels operate on lakes, which are located in protected areas of nature and serve primarily touristic purposes.
The Croatian inland waterway fleet is comprised of several types of ships: dredgers, tugboats (tugs and pushers), passenger ships, and cargo ships, so the general model presented in Figure 1 is adapted and shown in Figure 8.
The exploitation characteristics of a ship determine the ship’s economic output and depend primarily on the ship type, as shown in Table 1. A dredger’s primary task is to reshape the riverbed, while tugboats are ships tasked with pushing and/or tugging ships, barges, or other vessels. Passenger ships are used to transport passengers and most of them sail in protected areas of nature, while cargo ships are used to transport different types of cargo. All vessels use high-speed four-stroke diesel engines connected via a gearbox to the propeller (diesel-mechanical propulsion) [64]. The average age of ships in the fleet is around 40 years, implying that they will soon need to be replaced by new ships, or at least retrofitted with new power systems. Since the profitability of this sector is relatively low, the latter option seems to be more realistic. This represents an opportunity to introduce new energy-efficient and greener technologies, which is very important bearing in mind the overall European goals to shift a significant portion of road transportation to inland waterways where possible.
The economic output of dredgers and tugboats is expressed in the specific task they should accomplish during their operation. The economic output of passenger ships is expressed in the number of passengers transported over a certain distance, while for cargo ships, it is similarly expressed in the cargo carried over a certain distance. The selected representatives are shown in Figure 9.
Considering the exploitation characteristics of each representative, the average and annual energy consumption is calculated. The representatives’ particulars are presented in Table 2, as obtained from [64]. Additional data on their exploitation were gathered from the shipowners.
The representative of cargo ships is the tanker named “Opatovac”. It is mostly used to transport oil between two Croatian refineries, covering a distance of about 223 km. On average, it performs 20 round trips annually. The ship speed depends on the river environment. The average speed of a cargo ship of this size is 14.4 km/h, with an average main engine load of 75% of the maximum continuous rating [68]. With an average speed of the Sava River of 1 m/s [69], the estimated average duration of the trip is 20.5 h for upstream and 12.5 h for downstream navigation. The average load of the auxiliary engines is estimated at 50% of the maximum continuous rating. The average ship power is determined by Equation (1). After calculating Pave, the ship energy consumption per distance travelled is calculated according to Equation (4). Since the observed tanker sails on rivers, its annual energy consumption is calculated according to Equatipn (5), while its FOC for both for the upstream and for the downstream journey is calculated according to Equation (6).
The representative of passenger ships is the ship named “Trošenj”, which operates in Krka National Park. The river speed is very low on this 5-km route, so it is not taken into account, i.e., the power for both upstream and downstream sailing is considered to be equal. It takes around 20 min for a one-way trip, with an average speed of 15 km/h. On an annual basis, the ship sails around 2190 round trips, depending on the weather [58]. It is assumed that the ship operates at 70% of the total installed power. In a similar way as for the cargo ship, the annual energy consumption of the passenger ship is calculated according to Equation (7).
The representative of working ships is the dredger named “Papuk”. Since this kind of vessel belongs to stationary units, a modified approach, explained in the previous section, is applied. The annual fuel oil consumption of this ship equals 63,023 L as reported by the shipowner. With the assumption that the average load of the ship power system is 50% of the rated load, the time that the dredger spends in operation is approximately determined according to Equation (8). Therefore, the annual energy consumption of the dredger is calculated according to Equation (9).
After estimating the energy consumption of each representative, it is possible to define different power configurations. In this paper, three power configurations are analyzed and compared. As a conventional power configuration, a diesel-powered ship is selected. Furthermore, the diesel-powered configuration is compared to two alternatives, a battery-powered ship and a PV cell battery-powered ship. The environmental impact of each power configuration is assessed by the LCA method and the LCCA method is applied for estimating all relevant costs during the operation time.

3.1. LCA of the Croatian Waterway Fleet

As shown in the previous section, the current Croatian fleet should be retrofitted, so the applicability of different power system configurations for retrofitting three different ships is investigated. Since the emphasis is on a comparison of different retrofitting options, only emissions related to power system configurations are taken into account.

3.1.1. LCA of Diesel Engine-Powered Ships

The first option considered in this paper is to retrofit the selected ships with new diesel engines. MAN high-speed four-stroke heavy-duty diesel engines are considered with the corresponding power outputs based on the manufacturer’s data [70], as shown in Table 3.
The environmental impact of diesel engines was assessed by observing the manufacturing process and considering the weight ratios of material contents in the engine as proposed by Jeong et al. [71]. In order to calculate the weights of the engine materials, these ratios were multiplied by the weight of the engine. The materials’ manufacturing process parameters were obtained from the GREET 2020 database.
The Croatian inland waterway fleet uses “Eurodiesel Blue” as fuel oil. This fuel oil is diesel colored with blue dye according to the Regulation on the Implementation of Excise Duty Act [72]. According to viscosity, it corresponds to Conventional Diesel from the GREET 2020 database, from which the parameters are obtained to describe the process of diesel refining and the process of crude oil recovery. Crude oil used for the production of “Eurodiesel Blue” in Croatia is primarily imported from the Middle East since domestic crude oil production is not sufficient for the Croatian needs. It is considered that crude oil is transported via tankers and pipelines from the Middle East to Croatia. For reasons of simplicity, it is assumed that the diesel is produced only in the Rijeka refinery [73]. After the diesel is produced, tank trucks transport it to the gas stations. This distance is different for each considered ship because it depends on where the ship is refueling. Therefore, the distance for the cargo ship is 200 km (from Rijeka to Sisak); for the passenger ship, it is 300 km (from Rijeka to Šibenik); and for the dredger, it is 450 km (from Rijeka to Osijek). Tailpipe emissions released during the vessel operation are calculated according to Equation (10).

3.1.2. LCA of Battery-Powered Ships

The battery-powered ship configuration has a simpler life-cycle. As explained in the previous sections, a fully electric ship has zero PTW emissions and the manufacturing emissions depend on the type of battery that is being implemented.
As one of the issues, the battery capacity was mentioned. In this case study, three different types of ships are studied. It is assumed that the capacity of the battery should be sufficient for the cargo ship to sail one-way upstream without recharging, with an average speed over ground of 10.9 km/h, i.e., an average speed over water of 14.4 km/h. As for the passenger ship, it is assumed that the battery is charged after a round trip, while for the dredger, the battery should have enough capacity to allow it to operate for 8 h without recharging. The calculations are carried out according to Equation (13). The next step is to calculate the weight of the batteries with the assumed power density of 0.25 kWh/kg. The battery manufacturing process parameters are obtained from the GREET 2020 database.
The WTP of electricity is the main emission contributor in a battery-powered configuration. As said in the previous section, it depends on the electricity generation process in the country where it is being implemented. The main energy sources for the Croatian electricity generation are shown in Figure 10, except for nuclear energy, which is not produced in Croatia [74]. In order to describe the electricity generation process in GREET 2020, data on the Non-distributed U.S. Mix are used, where the shares of electricity generation sources are replaced with the shares characteristic of Croatia.

3.1.3. LCA of PV Cell Battery-Powered Ships

As described in previous sections, besides the battery, the manufacturing process of PV cells has a large role in the total lifetime emissions. In this assessment, crystalline silicon (c-Si) cells are used due to their low cost, high density, efficiency, and suitability for use on horizontal surfaces [75]. Their efficiency ranges from 12% to 19% [76]. They consist of glass for the panel surface (76%), polymer (10%), aluminum for the frame (8%), silicon for the PV cells (5%), and copper for the interconnectors (1%) [77]. According to some commercial c-Si PV panels, the module of 1.64 m2 weighs 19.5 kg, which is used to calculate the weight of PV module materials (glass, aluminum, silicon, and copper) [78]. Their manufacturing process parameters are obtained from the GREET 2020 database.
Another factor that affects the efficiency of the system is the average annual solar irradiance. Data for the case of Croatia are obtained from the Climate Atlas of Croatia [79].

3.2. LCCA of the Croatian Waterway Fleet

LCCAs of different power system configurations implemented on the Croatian inland waterway vessels are performed. It is assumed that the lifetime of each retrofitted vessel is 20 years. Therefore, the results of the LCCA refer to the total costs during that time.

3.2.1. LCCA of Diesel Engine-Powered Ships

A major part of the investment cost is the engine procurement and installation, but in this case study, the purchasing costs that will be presented consider only the engine purchase. Due to this, they are increased by 40% to take into account additional equipment connected to the engine, the installation cost, and the gearbox cost. The annual maintenance cost is assumed to be 7.5% of the total installation cost.
In terms of operational characteristics, the Croatian fleet uses the “Eurodiesel Blue” with the price of €0.66/l, taking into account the reduction in the excise duty [80]. Considering the operational characteristics of each ship, the annual fuel oil consumption cost in € can be calculated. For the cargo and passenger ship, Equation (14) considers the characteristics of the routes, while the calculation of the dredger, Equation (15), is determined with the annual operating time.

3.2.2. LCCA of Battery-Powered Ships

The investment costs include all costs connected to the replacement of a diesel-powered system with a battery-powered system. This includes the battery procurement and, in this case, the battery price is assumed to be €200/kWh [61]. Another major factor in the cost assessment is the electric power price. For the Croatian industrial sector, the electric power price equals €78/MWh [80] and, according to Equation (18), the annual electric power cost for different vessels can be calculated. Considering that the assumed lifetime of a vessel is 20 years and a lifetime of a Li-ion battery is assumed to be 10 years [81], the battery replacement is also included in the LCCA as a significant maintenance cost.

3.2.3. LCCA of PV Cell Battery-Powered Ships

Similar to the calculations of a battery-powered ship, the total costs of a PV cell battery-powered ship include the investment and maintenance cost of a battery-powered configuration and the addition in costs of a PV system. The annual electric power cost is calculated according to Equation (22) and it includes the electric power price as indicated in the previous section.
In this paper, it is assumed that the PV system price equals €165/m2. This price is obtained according to the World Energy Outlook 2018 for the European Union [59], taking into account the average electric power which c-Si PV cells can convert from solar energy per 1 m2 [76]. The annual maintenance cost is assumed to be 5% of investment costs, which is calculated according to Equation (23). Manufacturers of PV cells provide a 20-year warranty for PV systems, which is the expected lifetime of the considered ships. Hence, the replacement cost for PV cells is not taken into account. In order to determine the maintenance cost for the entire PV cell battery-powered ship, both the maintenance cost of the PV cells and the replacement of the battery cost should be considered.

4. Results

4.1. LCA Comparison

In order to evaluate the environmental impact of different power system configurations to retrofit the three selected ships, LCAs were performed. The input parameters for LCAs are presented in Table 4, in which C denotes the observed cargo ship, P denotes the passenger ship, and D denotes the dredger. For the passenger ship, it is not possible to calculate the energy consumption upstream or downstream since it sails on a lake. Any input data that refers to sailing is not applicable (N/A) for the dredger since it mainly operates while stationary.
First, the diesel engine-powered ship configuration is considered, as the reference one. Based on the weight of diesel engines, the weights of different components are calculated. Emissions released during the manufacturing processes of these materials represent the environmental impact of diesel engines. During navigation, ships emit a high amount of tailpipe emissions, which are calculated by using Equation (10) and are presented in Table 5.
The first alternative for the retrofit is the battery-powered ship configuration. The battery power output and the energy consumption are calculated for each ship according to the methodology described in Section 2 and are presented in Table 6, together with the weight and capacities of the batteries.
The application of solar energy for power generation onboard and the Li-ion battery was considered as the second alternative for the retrofit. The required power needs and battery capacities for the PV cell battery-powered ship are the same as for the battery-powered ship, as shown in Table 6. The average annual solar irradiances, available areas for PV system installation, and PV system efficiency, presented in Table 7, are used to calculate the average electric energy produced from the PV system according to Equation (14). In addition, the PV system power outputs, battery power outputs, energy consumption, and PV system weight are all calculated according to the methodology described in Section 2 and are presented in Table 7.
The results of the LCAs represent the lifetime emissions of each option released during different stages of the life-cycle of the considered ship. All these results are summarized in Figure 11, where DE denotes the diesel engine-powered ship, BAT refers to the battery-powered ship, while PV-BAT denotes the PV-cell battery-powered ship.
A complete insight into the feasibility of the proposed solutions is achieved by comparing them from the economic viewpoint, which is presented in the following section.

4.2. LCCA Comparison

LCCA comparisons of different power system configurations that can be implemented onboard the three observed ships are performed. As indicated in the previous section, LCCA involves the investment cost and the exploitation costs, which consist of the power source cost, maintenance cost, and carbon credit cost. In this paper, four carbon credit scenarios for diesel engine-powered ships are investigated, as shown in Table 8. Since the SD scenario is very rigorous and has the highest costs of carbon credit, only this scenario is incorporated in the LCCs of the diesel engine-powered ship.
Annual costs are calculated according to Section 2 and are summed up throughout the ship’s lifetime in order to obtain the LCCs. The LCCA comparison of the power system configuration implemented on the considered ships is presented in Figure 12.

5. Discussion

Based on the LCA results presented in the previous section, it can be observed that diesel engine-powered ships make the highest contribution to GHGs, PM10, and NOX emissions. With the application of alternative power system configurations, the environmental impact can be significantly reduced. However, the alternatives implemented on the cargo ships and the dredger result in higher SOX emissions than the existing diesel engine-powered ship. The main reason for this is the required large capacity of the battery, whose manufacturing process releases a great amount of SOX emissions into the atmosphere. Since the passenger ship requires a battery of small capacity, among the considered different power systems onboard, the main contributor to SOX emissions is the diesel engine power system configuration. Regarding all considered emissions, the PV-BAT configuration results in the lowest lifetime emissions among the different considered power system configurations. It can be noticed in Figure 11 that the impact of the installation of PV cells is less pronounced for the passenger ship due to the relatively small area that can be covered by PV cells. In addition, due to the high battery capacity required for a cargo ship and dredger, the impact of the battery manufacturing process is also relatively high, especially when compared with the diesel engine.
According to the LCCA, it is evident that the diesel engine options for both the cargo ship and the dredger have the lowest LCCs compared to the alternative power system configurations. The greatest difference in the LCCs between the different configurations is shown for the cargo ship, where the LCCs of the PV cell battery-powered ship is equal to €12.9 million, while for the diesel engine-powered ship, the LCCs is €2.1 million (in the NT scenario). The primary reason for this discrepancy is the high cost of the battery. A reduction in the battery capacity would lead to a reduction in the investment cost. This could be achieved by reducing the required sailing distance (which is defined by market needs and is unlikely to be reduced) or by reducing the speed. The upstream speed over water for which energy consumption is the lowest can be calculated by minimizing the ratio of the required power output and the sailing time, and equals 150% of the river speed, i.e., 1.5 m/s. This would significantly reduce the power output to around 40 kW but also extend the trip duration six times to roughly five days. In this extreme scenario, the battery capacity could be reduced by almost 70%, resulting in an LCC of a battery-powered cargo ship of around €4 million. This is still higher than the diesel engine option, but at least it opens the possibility for the use of the battery in the future, providing the battery price decreases or some environmentally oriented policies are introduced. An example of such a policy is shown in the analysis of carbon credit, as shown in Figure 6. Even though its impact is not crucial, it still makes alternative options a little more appealing.
On the other hand, the most cost-effective option for the passenger ship is the PV cell battery-powered ship. Due to its smaller size and relatively low requirements regarding autonomy, the battery capacity is quite low and the installation area for PV cells is smaller. Hence, both the investment and maintenance costs are low. It should also be mentioned that currently, there are several passenger ships in operation in Krka national park. They are used depending on the number of tourists (varying both during the season and during the week) as well as the maintenance schedule. Since the PV cell battery-powered ship seems to be more cost-effective if used more often, it can be aimed at the transportation of tourists. If, occasionally, additional vessels are required, the currently used vessels with diesel engines could be employed. It is also worth mentioning that the noise and vibrations emitted from PV cell battery-powered ships are significantly lower, thus increasing the level of comfort for both passengers and crew on board.
Another reason why the PV cell battery option seems feasible only for passenger ships is battery utilization. The observed passenger ship sails around 1500 h annually, while the dredger is used for less than 400 h annually. Additionally, the passenger ship needs autonomy for a round trip (roughly 1 h), while the dredger requires autonomy of at least 8 h. Hence, the battery capacity for the dredger is around 50 times higher, while the total annual energy consumption is in fact even higher for the passenger ship, as can be observed in Table 7. This increase in capacity leads both to an increase in weight (which is not crucial for marine application) and to an increase in the investment cost, which makes the battery option unfeasible both for the cargo ship and the dredger.
A possible option to reduce the lifetime emissions and the LCCs of the dredger is to use shore-side electricity to satisfy its power needs. This requires an appropriate power grid, which can sustain such power surges and obviously limits the area of dredging operations. Therefore, a solution can be found in the implementation of an HPS. Such an HPS should be designed by applying proper bi-objective optimization procedures, considering not only fuel consumption but also lifetime emissions [82]. When the ship operates in populated areas (where electricity is available), it could use shore power, while to operate in other areas, it can be powered by a diesel engine. Such a solution would increase the investment costs compared to the diesel engine-powered option since the ship would have both diesel engines and a battery (although of lower capacity) with the appropriate electrical equipment. The advantage can be seen from the environmental point of view since this option would not pollute the environment in highly populated areas. Such advantages should be recognized by national authorities in adopting appropriate policies leading to sustainable development.
However, Croatia, like many other EU states, currently implements policies that encourage the application of diesel in the shipping sector. The last available data for 2016 [80] estimated fossil fuel subsidies in the EU at around €55 billion (an amount that is not declining). The EU has called for these subsidies to be removed as they hamper the implementation of innovative energy-efficient technologies. As described before, the inland fleet in Croatia uses the same fuel as road vehicles. However, the price of this fuel for road vehicles is almost twice as high when compared with marine applications. Additionally, Croatia has offered state aid to cover up to 40% of the purchase price of electric vehicles on several occasions. Such opportunities have never been presented to shipowners. In short, the current Croatian policy stimulates electric vehicles and diesel-powered vessels.
If the policy were changed, i.e., if the fuel oil price for marine application was the same as for road vehicles (€1.18) [80], and if the subsidies covering 40% of the investment costs for battery and PV systems were introduced, the LCCs would change significantly. The estimates are presented in Table 9.
As can be observed, with the application of state aid, the electrification of the passenger ship becomes more attractive, since now the LCCs of the electrification options are around four times lower than the LCCs of the diesel engine-powered passenger ship. The differences between the LCCs of a diesel engine power system configuration and the LCCs of alternative power configurations implemented on the cargo ship and dredger are lower, especially for the dredger whose LCCs of alternative power system configurations are around 30% higher than the LCCs of the diesel engine-powered dredger. As for the cargo ship, the LCCs are not low enough for shipowners to willingly implement these solutions to reduce the lifetime emissions.

6. Conclusions

This paper assessed the applicability of different power system configurations for the electrification of three different ships engaged in the Croatian inland waterway sector. Consideration was given to retrofitting three ship types: a cargo ship, a passenger ship, and a dredger, based on three different power system configurations, namely diesel engines, a battery, and a PV system. While the most ecological solution was established by LCA, through LCCA, the most economical solution for retrofitting these ships was highlighted. The main findings of this study can be summarized as follows:
  • The most environmentally friendly solution is the PV cell battery-powered ship for each considered ship;
  • Electrification of inland vessels results in a GHG reduction of up to 64% and NOX emission reduction of up to 99%;
  • The diesel engine option is still by far the most economical solution both for the cargo ship and the dredger;
  • For the passenger ship, the PV cell battery option seems to be the most cost-effective solution;
  • Currently, in Croatia, given that diesel fuel for inland waterways shipping is free of excise duty and there are no incentives to introduce green technologies, the national policy actually encourages shipowners to use diesel engines.
The main difference between the passenger ship on the one hand and the cargo ship and the dredger on the other lies in the required autonomy. The passenger ship sails on shorter routes and has the option of recharging more often, resulting in a required autonomy of around one hour. Hence, its battery capacity is lower, resulting in lower capital, as well as lower maintenance costs. Additionally, greater use is made of the passenger ship, confirming that high investments are justified only if high savings can be achieved. For the dredger, which operates less than 400 h annually and would require a battery of very high capacity, this is simply not a feasible option. It would perhaps be more appropriate to retrofit it with an HPS, although this option should be further analyzed. It might also be beneficial to adapt national policies in order to promote green technologies, instead of encouraging the use of fossil fuels, as is currently the case in Croatia. Finally, the presented model can be applied to analyze the viability of electrification of any other inland waterway fleet, if a relevant set of input parameters is known.

Author Contributions

Conceptualization, M.P. and N.V.; methodology, M.P. and N.V.; software, M.P.; validation, M.P., N.V. and M.K.; formal analysis, M.P. and N.V.; investigation, M.P.; resources, M.P.; data curation, M.P. and N.V.; writing—original draft preparation, M.P.; writing—review and editing, M.P., N.V. and M.K.; visualization, M.P. and N.V.; supervision, N.V.; project administration, N.V.; funding acquisition, N.V. All authors have read and agreed to the published version of the manuscript.

Funding

This research was funded by the Croatian Science Foundation under the project Green Modular Passenger Vessel for Medi-terranean (GRiMM), (Project No. UIP-2017-05-1253). Maja Perčić, a Ph.D. student, is supported through the “Young researchers’ career development project—training of doctoral students” of the Croatian Science Foundation, funded by the European Union from the European Social Fund. The research was also funded through the Croatian-Chinese bilateral project “Energy efficient and environmentally friendly power system options for inland green ships” conducted by the University of Zagreb, Faculty of Mechanical Engineering and Naval Architecture (Croatia), and Wuhan University of Technology (China).

Acknowledgments

This research was supported by the Croatian Science Foundation under the project Green Modular Passenger Vessel for Mediterranean (GRiMM), (Project No. UIP-2017-05-1253) as well as within the Croatian-Chinese bilateral project “Energy efficient and environmentally friendly power system options for inland green ships” conducted by the University of Zagreb, Faculty of Mechanical Engineering and Naval Architecture (Croatia), and Wuhan University of Technology (China). In this paper: LCAs were performed by GREET 2020 software produced by UChicago Argonne, LLC under Contract No. DE-AC02-06CH11357 with the Department of Energy.

Conflicts of Interest

The authors declare no conflict of interest.

References

  1. European Court of Auditors (ECA). Inland Waterway-Transport in Europe: No Significant Improvements in Modal Share and Navigability Conditions Since 2001. Available online: https://www.eca.europa.eu/Lists/ECADocuments/SR15_01/SR15_01_EN.pdf (accessed on 15 July 2021).
  2. Wiegmans, B.; Witte, P.; Spit, T. Inland port performance: A statistical analysis of Dutch inland ports. Transp. Res. Procedia 2015, 8, 145–154. [Google Scholar] [CrossRef] [Green Version]
  3. Christodoulou, A.; Christidis, P.; Bisselink, B. Forecasting the impacts of climate change on inland waterways. Transp. Res. Part D Transp. Environ. 2020, 82, 102159. [Google Scholar] [CrossRef]
  4. Xing, S.; Xinping, Y.; Bing, W.; Xin, S. Analysis of the operational energy efficiency for inland river ships. Transp. Res. Part D Transp. Environ. 2013, 22, 34–39. [Google Scholar]
  5. Ančić, I.; Perčić, M.; Vladimir, N. Alternative power options to reduce carbon footprint of ro-ro passenger fleet: A case study of Croatia. J. Clean. Prod. 2020, 271, 122638. [Google Scholar] [CrossRef]
  6. Lindstad, H.; Jullumstrø, E.; Sandaas, I. Reductions in cost and greenhouse gas emissions with new bulk ship designs enabled by the Panama Canal expansion. Energy Policy 2013, 59, 341–349. [Google Scholar] [CrossRef] [Green Version]
  7. Miola, A.; Ciuffo, B. Estimating air emissions from ships: Meta-analysis of modelling approaches and available data sources. Atmos. Environ. 2011, 45, 2242–2251. [Google Scholar] [CrossRef]
  8. Ammar, N.R.; Seddiek, I.S. Eco-environmental analysis of ship emission control methods: Case study RO-RO cargo vessel. Ocean. Eng. 2017, 137, 166–1673. [Google Scholar] [CrossRef]
  9. Chen, J.; Fei, Y.; Wan, Z. The relationship between the development of global maritime fleets and GHG emission from shipping. J. Environ. Manag. 2019, 242, 31–39. [Google Scholar] [CrossRef]
  10. Keuken, M.P.; Moerman, M.; Jonkers, J.; Hulskotte, J.; Denier van der Gon, H.A.C.; Hoek, G.; Sokhi, R.S. Impact of inland shipping emissions on elemental carbon concentrations near waterways in The Netherlands. Atmos. Environ. 2014, 95, 1–9. [Google Scholar] [CrossRef]
  11. Ya-li, C.; Xia, W.; Cheng-qi, Y.; Wen-wen, X.; Wen, S.; Guang-ren, Q.; Zhi-meng, X. Inland Vessels Emission Inventory and the emission characteristics of the Beijing-Hangzhou Grand Canal in Jiangsu province. Process. Saf. Environ. Prot. 2018, 113, 498–506. [Google Scholar]
  12. International Maritime Organization. Resolution MEPC.176(58), London, UK. 2008. Available online: https://wwwcdn.imo.org/localresources/en/KnowledgeCentre/IndexofIMOResolutions/MEPCDocuments/MEPC.176(58).pdf (accessed on 17 September 2021).
  13. Chen, L.; Yip, T.L.; Mou, J. Provision of Emission Control Area and the impact on shipping route choice and ship emissions. Transp. Res. Part D Transp. Environ. 2018, 58, 280–291. [Google Scholar] [CrossRef]
  14. Emission Standards: IMO Marine Engine Regulations. Available online: https://dieselnet.com/standards/inter/imo.php#s (accessed on 5 October 2021).
  15. Sofiev, M.; Winebrake, J.J.; Johansson, L.; Carr, E.W.; Prank, M.; Soares, J.; Vira, J.; Kouznetsov, R.; Jalkanen, J.-P.; Corbett, J.J. Cleaner fuels for ships provide public health benefits with climate tradeoffs. Nat. Commun. 2018, 9, 406. [Google Scholar] [CrossRef] [PubMed] [Green Version]
  16. Gobbi, G.P.; Di Liberto, L.; Barnaba, F. Impact of port emissions on EU-regulated and non-regulated air quality indicators: The case of Civitavecchia (Italy). Sci. Total Environ. 2020, 719, 134984. [Google Scholar] [CrossRef]
  17. Rehmatulla, N.; Calleya, J.; Smith, T. The implementation of technical energy efficiency and CO2 emission reduction measures in shipping. Ocean. Eng. 2017, 139, 184–197. [Google Scholar] [CrossRef]
  18. Bouman, E.A.; Lindstad, E.; Rialland, A.I.; Strømman, A.H. State-of-the-art technologies, measures, and potential for reducing GHG emissions from shipping—A review. Transp. Res. Part D Transp. Environ. 2017, 52, 408–421. [Google Scholar] [CrossRef]
  19. Corbett, J.J.; Wang, H.; Winebrake, J.J. The effectiveness and costs of speed reductions on emissions from international shipping. Transp. Res. Part D Transp. Environ. 2009, 14, 593–598. [Google Scholar] [CrossRef]
  20. Lindstad, H.; Asbjørnslett, B.E.; Strømman, A.H. Reductions in greenhouse gas emissions and cost by shipping at lower speeds. Energy Policy 2011, 39, 3456–3464. [Google Scholar] [CrossRef]
  21. Perčić, M.; Vladimir, N.; Fan, A. Life-cycle cost assessment of alternative marine fuels to reduce the carbon footprint in short-sea shipping: A case study of Croatia. Appl. Energy 2020, 279, 115848. [Google Scholar] [CrossRef]
  22. Ančić, I.; Vladimir, N.; Runko Luttenberger, L. Energy efficiency of ro-ro passenger ships with integrated power system. Ocean Eng. 2018, 16, 350–357. [Google Scholar] [CrossRef]
  23. Psaraftis, H.N.; Zis, T.; Lagouvardou, S. A comparative evaluation of market based measures for shipping decarbonization. Marit. Transp. Res. 2021, 2, 100019. [Google Scholar]
  24. Gagatsi, E.; Estrup, T.; Halatsis, A. Exploring the potentials of electrical waterborne transport in Europe: The E-ferry concept. Transp. Res. Procedia 2016, 14, 1571–1580. [Google Scholar] [CrossRef] [Green Version]
  25. Perčić, M.; Ančić, I.; Vladimir, N. Life-cycle cost assessments of different power system configurations to reduce the carbon footprint in the Croatian short-sea shipping sector. Renew. Sustain. Energy Rev. 2020, 131, 110028. [Google Scholar] [CrossRef]
  26. Nuchturee, C.; Li, T.; Xia, H. Energy efficiency of integrated electric propulsion for ships—A review. Renew. Sustain. Energy Rev. 2020, 134, 110145. [Google Scholar] [CrossRef]
  27. Geertsma, R.D.; Negenborn, R.R.; Visser, K.; Hopman, J.J. Design and control of hybrid power and propulsion systems for smart ships: A review of developments. Appl. Energy 2017, 194, 30–54. [Google Scholar] [CrossRef]
  28. Lan, H.; Wen, S.; Hong, Y.Y.; Yu, D.C.; Zhang, L. Optimal sizing of hybrid PV/diesel/battery in ship power system. Appl. Energy 2015, 158, 26–34. [Google Scholar] [CrossRef] [Green Version]
  29. Ghenai, C.; Bettayeb, M.; Brdjanin, B.; Hamid, A.K. Hybrid solar PV/PEM fuel Cell/Diesel Generator power system for cruise ship: A case study in Stockholm, Sweden. Case Stud. Therm. Eng. 2019, 14, 100497. [Google Scholar] [CrossRef]
  30. Ritari, A.; Huotari, J.; Halme, J.; Tammi, K. Hybrid electric topology for short sea ships with high auxiliary power availability requirement. Energy 2020, 190, 116359. [Google Scholar] [CrossRef]
  31. Yuan, Y.; Wang, J.; Yan, X.; Li, Q.; Long, T. A design and experimental investigation of a large-scale solar energy/diesel generator powered hybrid ship. Energy 2018, 165, 965–978. [Google Scholar] [CrossRef]
  32. Wu, P.; Partridge, J.; Bucknall, R. Cost-effective reinforcement learning energy management for plug-in hybrid fuel cell and battery ships. Appl. Energy 2020, 275, 115258. [Google Scholar] [CrossRef]
  33. Haseltalab, A.; Negenborn, R.R. Model predictive maneuvering control and energy management for all-electric autonomous ships. Appl. Energy 2019, 251, 113308. [Google Scholar] [CrossRef]
  34. Diaz-de-Baldasano, M.C.; Mateos, F.J.; Núñez-Rivas, L.R.; Leo, T.J. Conceptual design of offshore platform supply vessel based on hybrid diesel generator-fuel cell power plant. Appl. Energy 2014, 116, 91–100. [Google Scholar] [CrossRef] [Green Version]
  35. Ling-Chin, J.; Roskilly, A.P. Investigating the implications of a new-build hybrid power system forRoll-on/Roll-off cargo ships from a sustainability perspective—A lifecycle assessment case study. Appl. Energy 2016, 181, 416–434. [Google Scholar] [CrossRef] [Green Version]
  36. Lindstad, H.E.; Eskeland, G.S.; Rialland, A. Batteries in offshore support vessels—Pollution, climate impact and economics. Transp. Res. Part D Transp. Environ. 2017, 50, 409–417. [Google Scholar] [CrossRef]
  37. Wang, H.; Oguz, E.; Jeong, B.; Zhou, P. Life cycle and economic assessment of a solar panel array applied to a short route ferry. J. Clean. Prod. 2019, 219, 471–484. [Google Scholar] [CrossRef] [Green Version]
  38. Tang, R.; An, Q.; Xu, F.; Zhang, X.; Li, X.; Lai, J.; Dong, Z. Optimal operation of hybrid energy system for intelligent ship: An ultrahigh-dimensional model and control method. Energy 2020, 211, 119077. [Google Scholar] [CrossRef]
  39. Lee, K.H.; Shin, D.; Yoo, D.W.; Choi, H.K.; Kim, H.J. Hybrid photovoltaic/diesel green ship operating in standalone and grid-connected mode—Experimental investigation. Energy 2013, 49, 475–483. [Google Scholar] [CrossRef]
  40. Jeong, B.; Oguz, E.; Wang, H.; Zhou, P. Multi-criteria decision-making for marine propulsion: Hybrid, diesel electric and diesel mechanical systems from cost-environment-risk perspectives. Appl. Energy 2018, 230, 1065–1081. [Google Scholar] [CrossRef] [Green Version]
  41. Ling-Chin, J.; Heindrich, O.; Roskilly, A.P. Life cycle assessment (LCA)-from analysing methodology development to introducing an LCA framework for marine photovoltaic (PV) systems. Renew. Sustain. Energy Rev. 2016, 59, 352–378. [Google Scholar] [CrossRef] [Green Version]
  42. Ančić, I.; Vladimir, N.; Cho, D.S. Determining environmental pollution from ships using Index of Energy Efficiency and Environmental Eligibility (I4E). Mar. Policy 2018, 95, 1–7. [Google Scholar] [CrossRef]
  43. International Organization for Standardization. (ISO 14040). Life Cycle Assessment. Available online: https://web.stanford.edu/class/cee214/Readings/ISOLCA.pdf (accessed on 16 August 2020).
  44. GREET 2020. LCA software. Available online: https://greet.es.anl.gov (accessed on 15 October 2020).
  45. Anderson, R.; Keshwani, D.; Guru, A.; Yang, H.; Irmak, S.; Subbiah, J. An integrated modeling framework for crop and biofuel systems using the DSSAT and GREET models. Environ. Model. Softw. 2018, 108, 40–50. [Google Scholar] [CrossRef]
  46. Obnamia, J.A.; Dias, G.M.; MacLean, H.L.; Saville, B.A. Comparison of U.S. Midwest corn stover ethanol greenhouse gas emissions from GREET and GHGenius. Appl. Energy 2019, 235, 591–601. [Google Scholar] [CrossRef]
  47. Pereira, L.G.; Cavalett, O.; Bonomi, A.; Zhang, Y.; Warner, E.; Chum, H.L. Comparison of biofuel life-cycle GHG emissions assessment tools: The case studies of ethanol produced from sugarcane, corn, and wheat. Renew. Sustain. Energy Rev. 2019, 110, 1–12. [Google Scholar] [CrossRef]
  48. Khan, M.I.; Shahrestani, M.; Hayat, T.; Shakoor, A.; Vahdati, M. Life cycle (well-to-wheel) energy and environmental assessment of natural gas as transportation fuel in Pakistan. Appl. Energy 2019, 242, 1738–1752. [Google Scholar] [CrossRef]
  49. International Maritime Organization (IMO). Third IMO Greenhouse Gas Study; London, UK, 2014. Available online: https://www.imo.org/en/OurWork/Environment/Pages/Greenhouse-Gas-Studies-2014.aspx (accessed on 17 September 2020).
  50. Environmental Protection Agency. Understanding the Global Warming Potentials. Available online: https://www.epa.gov/ghgemissions/understanding-global-warming-potentials (accessed on 14 September 2020).
  51. Zubi, G.; Dufo-López, R.; Carvalho, M.; Pasaoglu, G. The lithium-ion battery: State of the art and future perspectives. Renew. Sustain. Energy Rev. 2018, 89, 292–308. [Google Scholar] [CrossRef]
  52. Manthiram, A. An Outlook of Lithium Ion Battery Technology. ACS Cent. Sci. 2017, 3, 1063–1069. [Google Scholar] [CrossRef] [Green Version]
  53. Energy Market Authority and Building and Construction Authority. Handbook for Solar Photovoltaic (PV) Systems. Available online: http://www.bca.gov.sg/publications/others/handbook_for_solar_pv_systems.pdf (accessed on 1 September 2021).
  54. Liu, H.; Zhang, Q.; Qi, X.; Han, Y.; Lu, F. Estimation of PV output power in moving and rocking hybrid energy marine ships. Appl. Energy 2017, 204, 362–372. [Google Scholar] [CrossRef]
  55. Stiglitz, J.E.; Stern, N.; Duan, M.; Edenhofer, O.; Giraud, G.; Heal, G.; Lèbre la Rovere, E.; Morris, A.; Moyer, E.; Pangestu, M.; et al. Report of the High-Level Commission on Carbon Prices; World Bank: Washington, DC, USA, 2017. [Google Scholar]
  56. Tvinnereim, E.; Mehling, M. Carbon pricing and deep decarbonisation. Energy Policy 2018, 121, 185–189. [Google Scholar] [CrossRef]
  57. EU Emissions Trading System. Available online: https://ec.europa.eu/clima/policies/ets_en (accessed on 1 September 2021).
  58. Trivyza, N.L.; Rentizelas, A.; Theotokatos, G. Impact of carbon pricing on the cruise ship energy systems optimal configuration. Energy 2019, 175, 952–966. [Google Scholar] [CrossRef] [Green Version]
  59. International Energy Agency. World Energy Outlook. 2018. Available online: https://www.oecd-ilibrary.org/energy/world-energy-outlook_20725302 (accessed on 1 September 2021).
  60. Christos, B. Techno-Economical Feasibility Study on the Retrofit of Double-Ended Ro/Pax Ferries Into Battery-Powered Ones. Master’s Thesis, National Technical University of Athens, Athens, Greece, 2017. [Google Scholar]
  61. Tsiropoulos, I.; Tarvydas, D.; Lebedeva, N. Li-ion Batteries for Mobility and Stationary Storage Applications, JCR Science for Policy Report, European Commissio. Available online: http://publications.jrc.ec.europa.eu/repository/bitstream/JRC113360/kjna29440enn.pdf (accessed on 19 May 2021).
  62. Ministry of the Sea, Transport and Infrastructure of the Republic of Croatia. Inland Navigation. Available online: https://mmpi.gov.hr/more-86/unutarnja-plovidba-110/110 (accessed on 17 February 2020).
  63. Statistical Yearbook of the Republic of Croatia. Available online: https://www.dzs.hr/Hrv_Eng/ljetopis/2018/sljh2018.pdf (accessed on 11 April 2020).
  64. Croatian Register of Shipping. Register of Inland Waterway Vessels. Available online: http://www.crs.hr/Portals/0/CRS%20Knjiga%20Registra%202017.pdf?ver=2018-07-04-155704-933 (accessed on 7 May 2020).
  65. Cargo Vessel “Opatovac”. Available online: https://www.marinetraffic.com/en/ais/details/ships/shipid:209454/mmsi:238401840/imo:0/vessel:OPATOVAC (accessed on 7 May 2020).
  66. National Park Krka (NP Krka). Passenger ship “Trošenj”. Available online: http://www.npkrka.hr/stranice/izleti-brodom/33.html (accessed on 14 May 2020).
  67. Dredger “Papuk”. Available online: http://www.hidrogradnja.hr/gallery/papuk/ (accessed on 14 May 2020).
  68. van Essen, H.P.; Faber, J.; Wit, R.C.N. Charges for Barges? Preliminary Study of Economic Incentives to Reduce Engine Emissions from Inland Shipping in Europe; CE Transform: Delft, The Netherlands, 2004. [Google Scholar]
  69. Croatian Meteorological and Hydrological Service. Hydrology Sector. Available online: https://hidro.dhz.hr/ (accessed on 17 January 2021).
  70. MAN. Marine High Speed Propulsion Engines. Available online: https://www.engines.man.eu/man/media/content_medien/doc/global_engines/marine/Marine_Commercial_180613_web.pdf (accessed on 20 September 2020).
  71. Jeong, B.; Wang, H.; Oguz, E.; Zhou, P. An effective framework for life cycle and cost assessment for marine vessels aiming to select optimal propulsion systems. J. Clean. Prod. 2018, 187, 111–130. [Google Scholar] [CrossRef] [Green Version]
  72. INA. Motor Fuels. Available online: https://www.ina.hr/customers/products-and-services/motor-fuels-9883/9883 (accessed on 21 September 2020).
  73. Croatian Energy Regulatory Agency. Annual Report. Available online: https://www.hera.hr/en/docs/HERA_Annual_Report_2016.pdf (accessed on 15 March 2020).
  74. HEP. Resources for Croatian Electricity Generation. Available online: http://www.hep.hr/elektra/trziste-elektricne-energije/izvori-elektricne-energije/1553# (accessed on 14 September 2020).
  75. Kobougias, I.; Tatakis, E.; Prousalidis, J. PV Systems Installed in Marine Vessels: Technologies and Specifications. Adv. Power Electron. Available online: https://www.hindawi.com/journals/ape/2013/831560/ (accessed on 14 July 2020).
  76. Istrian Regional Energy Agency. Photovoltaic Systems. Available online: http://www.irena-istra.hr/uploads/media/Photovoltaic_systems.pdf (accessed on 17 September 2020).
  77. International Renewable Energy Agency. End-of-Life Management: Solar Photovoltaic Panels. Available online: https://www.irena.org/documentdownloads/publications/irena_ieapvps_end-of-life_solar_pv_panels_2016.pdf (accessed on 14 July 2020).
  78. Prefersolar. Crystalline PV Panel. Available online: http://www.llslight.com/images/Alpsx_SolarPanels_240_255.pdf (accessed on 21 September 2020).
  79. Zaninović, K.; Gajić-Čapka, M.; Perčec Tadić, M. Climate Atlas of Croatia 1961–1990, 1971–2000; Croatian Meteorological and Hydrological Service: Zagreb, Croatia, 2008. [Google Scholar]
  80. European Commission. Energy Prices and Costs in Europe, Annex 3. Available online: https://ec.europa.eu/energy/sites/ener/files/documents/annex_3_-_country_sheets_-part_4_of_4_post_isc-v2.pdf (accessed on 7 November 2019).
  81. Astaneh, M.; Dufo-López, R.; Roshandel, R.; Bernal-Agustin, J.L. A novel lifetime prediction method for lithium-ion batteries in the case of stand-alone renewable energy systems. Electr. Power Energy Syst. 2018, 103, 115–126. [Google Scholar] [CrossRef]
  82. Jianyun, Z.; Li, C.; Lijuan, X.; Bin, W. Bi-objective optimal design of plug-in hybrid electric propulsion system for ships. Energy 2019, 177, 247–261. [Google Scholar] [CrossRef]
Figure 1. Procedure for the selection of alternative power systems configuration for inland waterway vessels.
Energies 14 07046 g001
Figure 2. The life-cycle of the diesel engine-powered ship configuration.
Energies 14 07046 g002
Figure 3. The life-cycle of the battery-powered ship configuration.
Energies 14 07046 g003
Figure 4. The life-cycle of the PV cell battery-powered ship configuration.
Energies 14 07046 g004
Figure 5. Total costs of a ship power system configuration.
Energies 14 07046 g005
Figure 7. Inland waterway network of Croatia [62].
Energies 14 07046 g007
Figure 8. Procedure for the definition of the ship power system of the Croatian inland waterway fleet.
Energies 14 07046 g008
Figure 9. Selected ships in operation: (a) cargo ship “Opatovac” [65], (b) passenger ship “Trošenj” [66], and (c) dredger “Papuk” [67].
Energies 14 07046 g009
Figure 10. The Croatian electricity mix.
Energies 14 07046 g010
Figure 11. Lifetime emissions of the considered ships with different power system configurations.
Energies 14 07046 g011
Figure 12. LCCA comparison of different power system configurations for the retrofit of the selected ships.
Energies 14 07046 g012
Table 1. The Croatian inland waterway fleet by ship type and their exploitation characteristics.
Ship TypeNumber of ShipsExploitation Characteristics
Dredger19Power, operating time
Tugboat8Power, operating time
Passenger ship8Speed, number of passengers, route
Cargo ship3Speed, capacity, route
Table 2. Particulars of the selected ships.
Cargo ShipPassenger ShipDredger
Length overall (m)75.913.268.94
Breadth (m)9.04.129.30
Deadweight (t)96715.72484.6
Main engine(s) maximum continuous rating (kW)855236804
Auxiliary engine(s) maximum continuous rating (kW)100-476
Total power installed (kW)9552361280
Table 3. Engines selected for retrofit.
ShipOpatovacTrošenjPapuk
Ship typeTankerPassengerDredger
Selected engine modelMAN D2862 LE444MAN D2676 LE461MAN D2676 LE421
Engine power, kW735147382
Engine weight, kg227012151215
Engine cost, €159,00069,00077,000
Number of engines123
Table 4. Diesel engine-powered ship input data for LCA.
CPD
Length of a round trip, LRT (km)44610N/A
Annual number of round trips, NRT202190N/A
Average ship speed, v (km/h)14.415N/A
Average total power, Pave (kW)691165640
Annual operating time, tA (h)6601460387
Energy consumption, ECUpstream (kWh/km)63.4N/AN/A
Downstream (kWh/km)38.8N/AN/A
Average (kWh/km)51.111N/A
Annual (kWh)455,812240,900247,680
Density of diesel, ρ (kg/L)0.845
Fuel oil consumption, FOCUpstream (kg/km)13.6N/AN/A
Downstream (kg/km)8.3N/AN/A
Average (kg/km)11.02.4N/A
Annual (L)116,11862,20163,023
Table 5. Calculated tailpipe emissions from the considered diesel engine-powered ships.
EmissionGWPEmission Factor (g Emission/kg Diesel)Tailpipe Emissions
Cargo Ship (g/km)Passenger Ship (g/km)Dredger (g/h)
UpstreamDownstream
CO21320643,60226,6107694441,172
CH4250.060.8160.4980.148.26
N2O2980.152.041.2450.3620.64
NOXN/A61.21832.46508.04146.908423.01
SOXN/A2.6435.9021.916.34363.29
PM10N/A1.0213.878.452.45140.36
Table 6. Battery-powered ship input data for LCA.
CPD
Average battery power output, PBAT,ave (kW)760182704
Energy consumption, ECBAT (kWh/km)69.712.1N/A
Annual energy consumption, ECBAT,A (kWh)621,724264,990272,448
Battery capacity, BC (MWh)19.420.157.04
Battery weight (t)77.70.628.2
Table 7. PV cell battery-powered ship input data for LCA.
CPD
Average annual solar irradiance, Erad (kJ/m2)4,499,0005,190,0004,544,000
Installation area for PV cells, APV (m2)36012330
PV cells efficiency, ηPV0.155
Annual electric energy produced by PV cells, EPV,A (GJ)251.09.6232.4
Energy consumption of PV cells battery-powered ships, ECPV-BAT (kWh/year)551,989262,309207,885
PV system weight (t)4.30.163.9
Table 8. Carbon credit cost for diesel engine-powered ships, (€).
NTCPNPSD
C0163,312 185,210 422,754
P087,45599,182226,389
D088,609100,4910229,377
Table 9. Policy impact on LCCs of the considered options.
Power System ConfigurationInvestment Cost (€)Power Source Cost, (€)Maintenance Cost (€)Carbon Credit Cost (SD) (€)Total Costs, (€)
CDE222,6002,727,900333,900422,7003,707,100
BAT5,181,000969,9003,283,50009,434,400
PV-BAT5,216,700861,1003,342,90009,420,700
PDE193,2001,467,900289,800226,4002,177,370
BAT40,300413,40025,5000479,200
PV-BAT41,500409,20027,5000478,200
DDE323,4001,487,300485,100229,4002,525,200
BAT1,877,300425,0001,189,80003,492,100
PV-BAT1,910,000324,3001,244,20003,478,500
Publisher’s Note: MDPI stays neutral with regard to jurisdictional claims in published maps and institutional affiliations.

