Article

An Experimental Performance Evaluation for a Swirl-Vane Separator Using an Air-Water Test Facility

Korea Atomic Energy Research Institute, Daejeon 34057, Korea
*
Author to whom correspondence should be addressed.
Energies 2021, 14(21), 7072; https://doi.org/10.3390/en14217072
Submission received: 10 September 2021 / Revised: 18 October 2021 / Accepted: 22 October 2021 / Published: 28 October 2021
(This article belongs to the Special Issue Two-Phase Flow with Boiling Heat Transfer)

Abstract

:
The most important design parameters of a moisture separator to optimize the efficiency of a nuclear power plant are the moisture carry over and pressure drop. An air-water test facility was constructed to evaluate the design parameters for various types of conventional moisture separators in Korea. In this study, a half scale of swirl-vane separator was designed, and test conditions were defined based on the scaling law to cover a wide range of operating conditions. The moisture carry over was measured using an isokinetic sampling system for 34 different flow conditions. The MCO was in range of 0.30–7.05% according to the test conditions. Single and two-phase flow experiments were also carried out to identify the two-phase pressure drop characteristics. Based on the obtained results, the proposed empirical correlation model was extended to a submerged separator and applying these results to a full scale system is discussed in this paper.

1. Introduction

The moisture separators in a steam generator play an important role in ensuring the integrity of the power conversion system and the high efficiency of a nuclear power plant. The performance of the moisture separator is characterized by the moisture carry over (MCO) and the pressure drop, and the parameters are used to design the whole separation system of a steam generator. Meanwhile, a comprehensive database is essential to improve the performance curve in the design process; however, there is not sufficient experimental data because of the high cost of experiments in plant conditions. Therefore, a scaled-down model or scaling method has been developed and used by many researchers as an alternative method. Paik et al. [1] examined the air-water experiments for three types of moisture separators to identify the complex two-phase flow separation mechanism such as the flow visualization and the principal parameters. Green and Hestroni [2] also summarized the experimental research programs since 1977 using a scaled model. However, the similarity was not considered in their research work, and the hydraulic phenomena strongly depends on the type of separators. The hydraulic conditions such as the distribution of the small droplets, flow pattern [3], film thickness [4], phase concentration and swirl intensity [5] generally affect he performance of moisture separator. Recently, there were several representative research works on the scaling method. The basic principles of scaling law for the moisture separator were well described and suggested by Hoffmann and Stein [6]. Sun et al. [7] carried out air-water experiments for a scaled-down model of swirl-vane separator. They proposed an empirical correlation using only a Re number for the two-phase pressure drop. Liu [8] revised the empirical correlation by adding the density ratio considering the effect of operating pressure. Liu also carefully analyzed the hydraulic phenomena and proposed the scaling criteria for the scaled-down model by theoretical and mathematical modelling. Maruo et al. [9] suggested that the superficial velocities of the model should be the same with that of the prototype, and confirmed this experimentally by the comparison of MCO using the full scale air-water and steam-water test facilities. Katono et al. [10] performed air-water experiments to improve the BWR separator design using a half scale model and verified using the two-phase flow simulations. They suggested the scaling law by adjusting the quality and two-phase centrifugal force, and showed good agreement with the prototype conditions.
There are various types of moisture separators according to the reactor coolant system, manufacturer and thermal power. In Korea, there are two representative types of moisture separators: a Combustion Engineering (CE) stationary-vane type and a Westinghouse (WH) swirl-vane type. In previous research, we evaluated the performance of a moisture separator (PEMS) test facility constructed to evaluate the performance of Korea conventional moisture separators. However, the PEMS test facility used air and water as working fluids; thus, the similarity should be verified and validated between the prototype and the scaled model. The scaling law preserving the quality and two-phase centrifugal force was applied to the CE stationary-vane type for the measurement of MCO [10,11]. A full and a half scale of the CE type were tested under the same test conditions, and the results were compared with that of the plant condition. We concluded that the MCO showed reliable results, regardless of the scaling method and the scaling ratio [11]. In the case of a two-phase pressure drop, a new empirical correlation based on the two-phase separated model was proposed in terms of quality, non-dimensional superficial velocity, density ratio, and geometrical parameter. We carried out a series of two-phase air-water experiments for the full and half scale of the CE type separator in the PEMS test facility, and the applicability was verified by the experimental data of plant conditions [12].
In the present study, the WH type separator was focused on evaluating performance. The half-scale of the WH type separator was designed conserving the hydraulic characteristics and simulated the fluid flow from the separator inlet to the dryer inlet. The MCO and the pressure drop were measured with previous proven experimental methods and scaling laws [11,12]. The MCO was measured by using an isokinetic system at the dryer inlet for 34 different two-phase mass flux conditions at the separator inlet. For the two-phase pressure drop, the empirical correlation of the CE type separator should be extended to apply the WH type separator; thus, single and two-phase experiments were performed to improve the empirical correlation. The improved empirical correlation was scrutinized by comparing the experimental data [13] and the other scaling model [9].

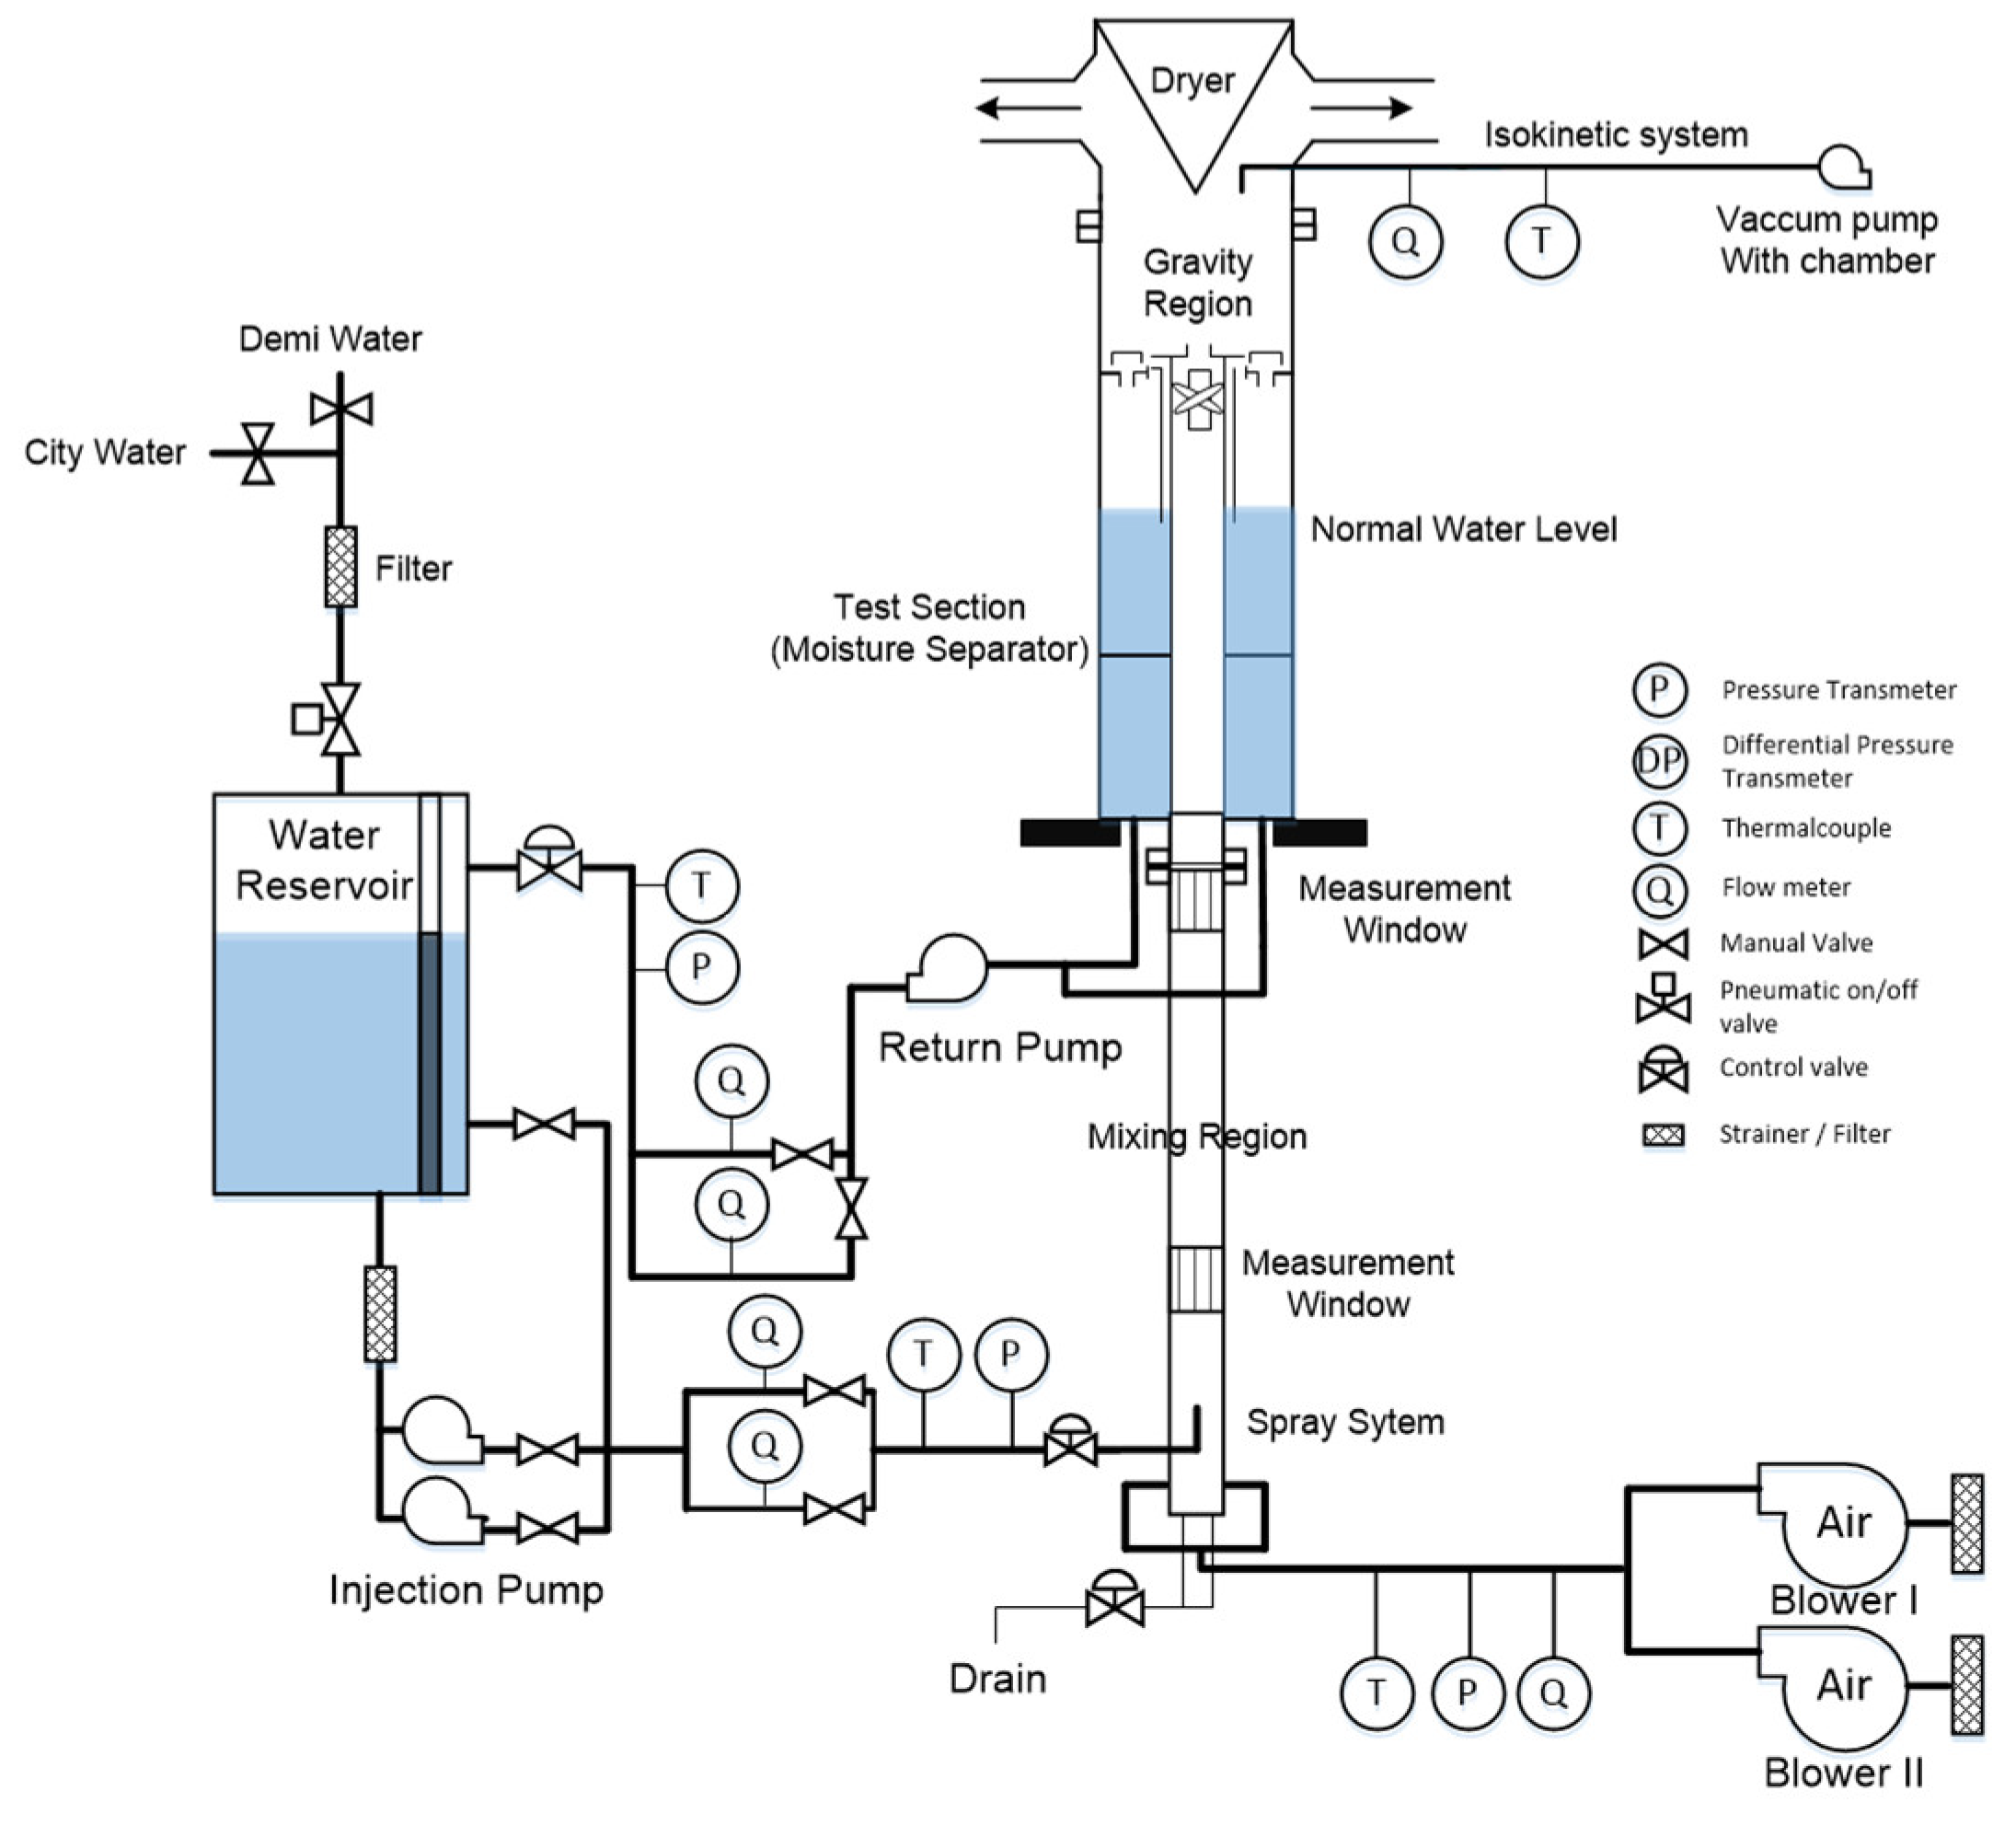
2. Experimental Test Facility and Methods

The schematic diagram of the PEMS facility layout and instrumentation is shown in Figure 1 and Figure 2, respectively. The test section, including the mixing region piping, can be changed in a module, making it possible to test various type of separators without changing the main loop system and instrumentation. The design specification is summarized in Table 1. The air was supplied to the test section by 1.2 kgf/cm2 rotary blowers with flow capacities of 55 m3/min for each blower, and the water was injected using four spray nozzles with a supply pressure of 0.5 MPa. The two-phase mixture was generated and developed in the mixing region. The outside of the swirl-vane separator was submerged in water, therefore the water level should be maintained at the specified constant level. The normal water level was adjusted by using the flow control valve and a return pump. All experiments were carried out under a steady-state condition, and the pressure, differential pressure, flow rate, and temperature were measured to operate or monitor the hydraulic parameters.

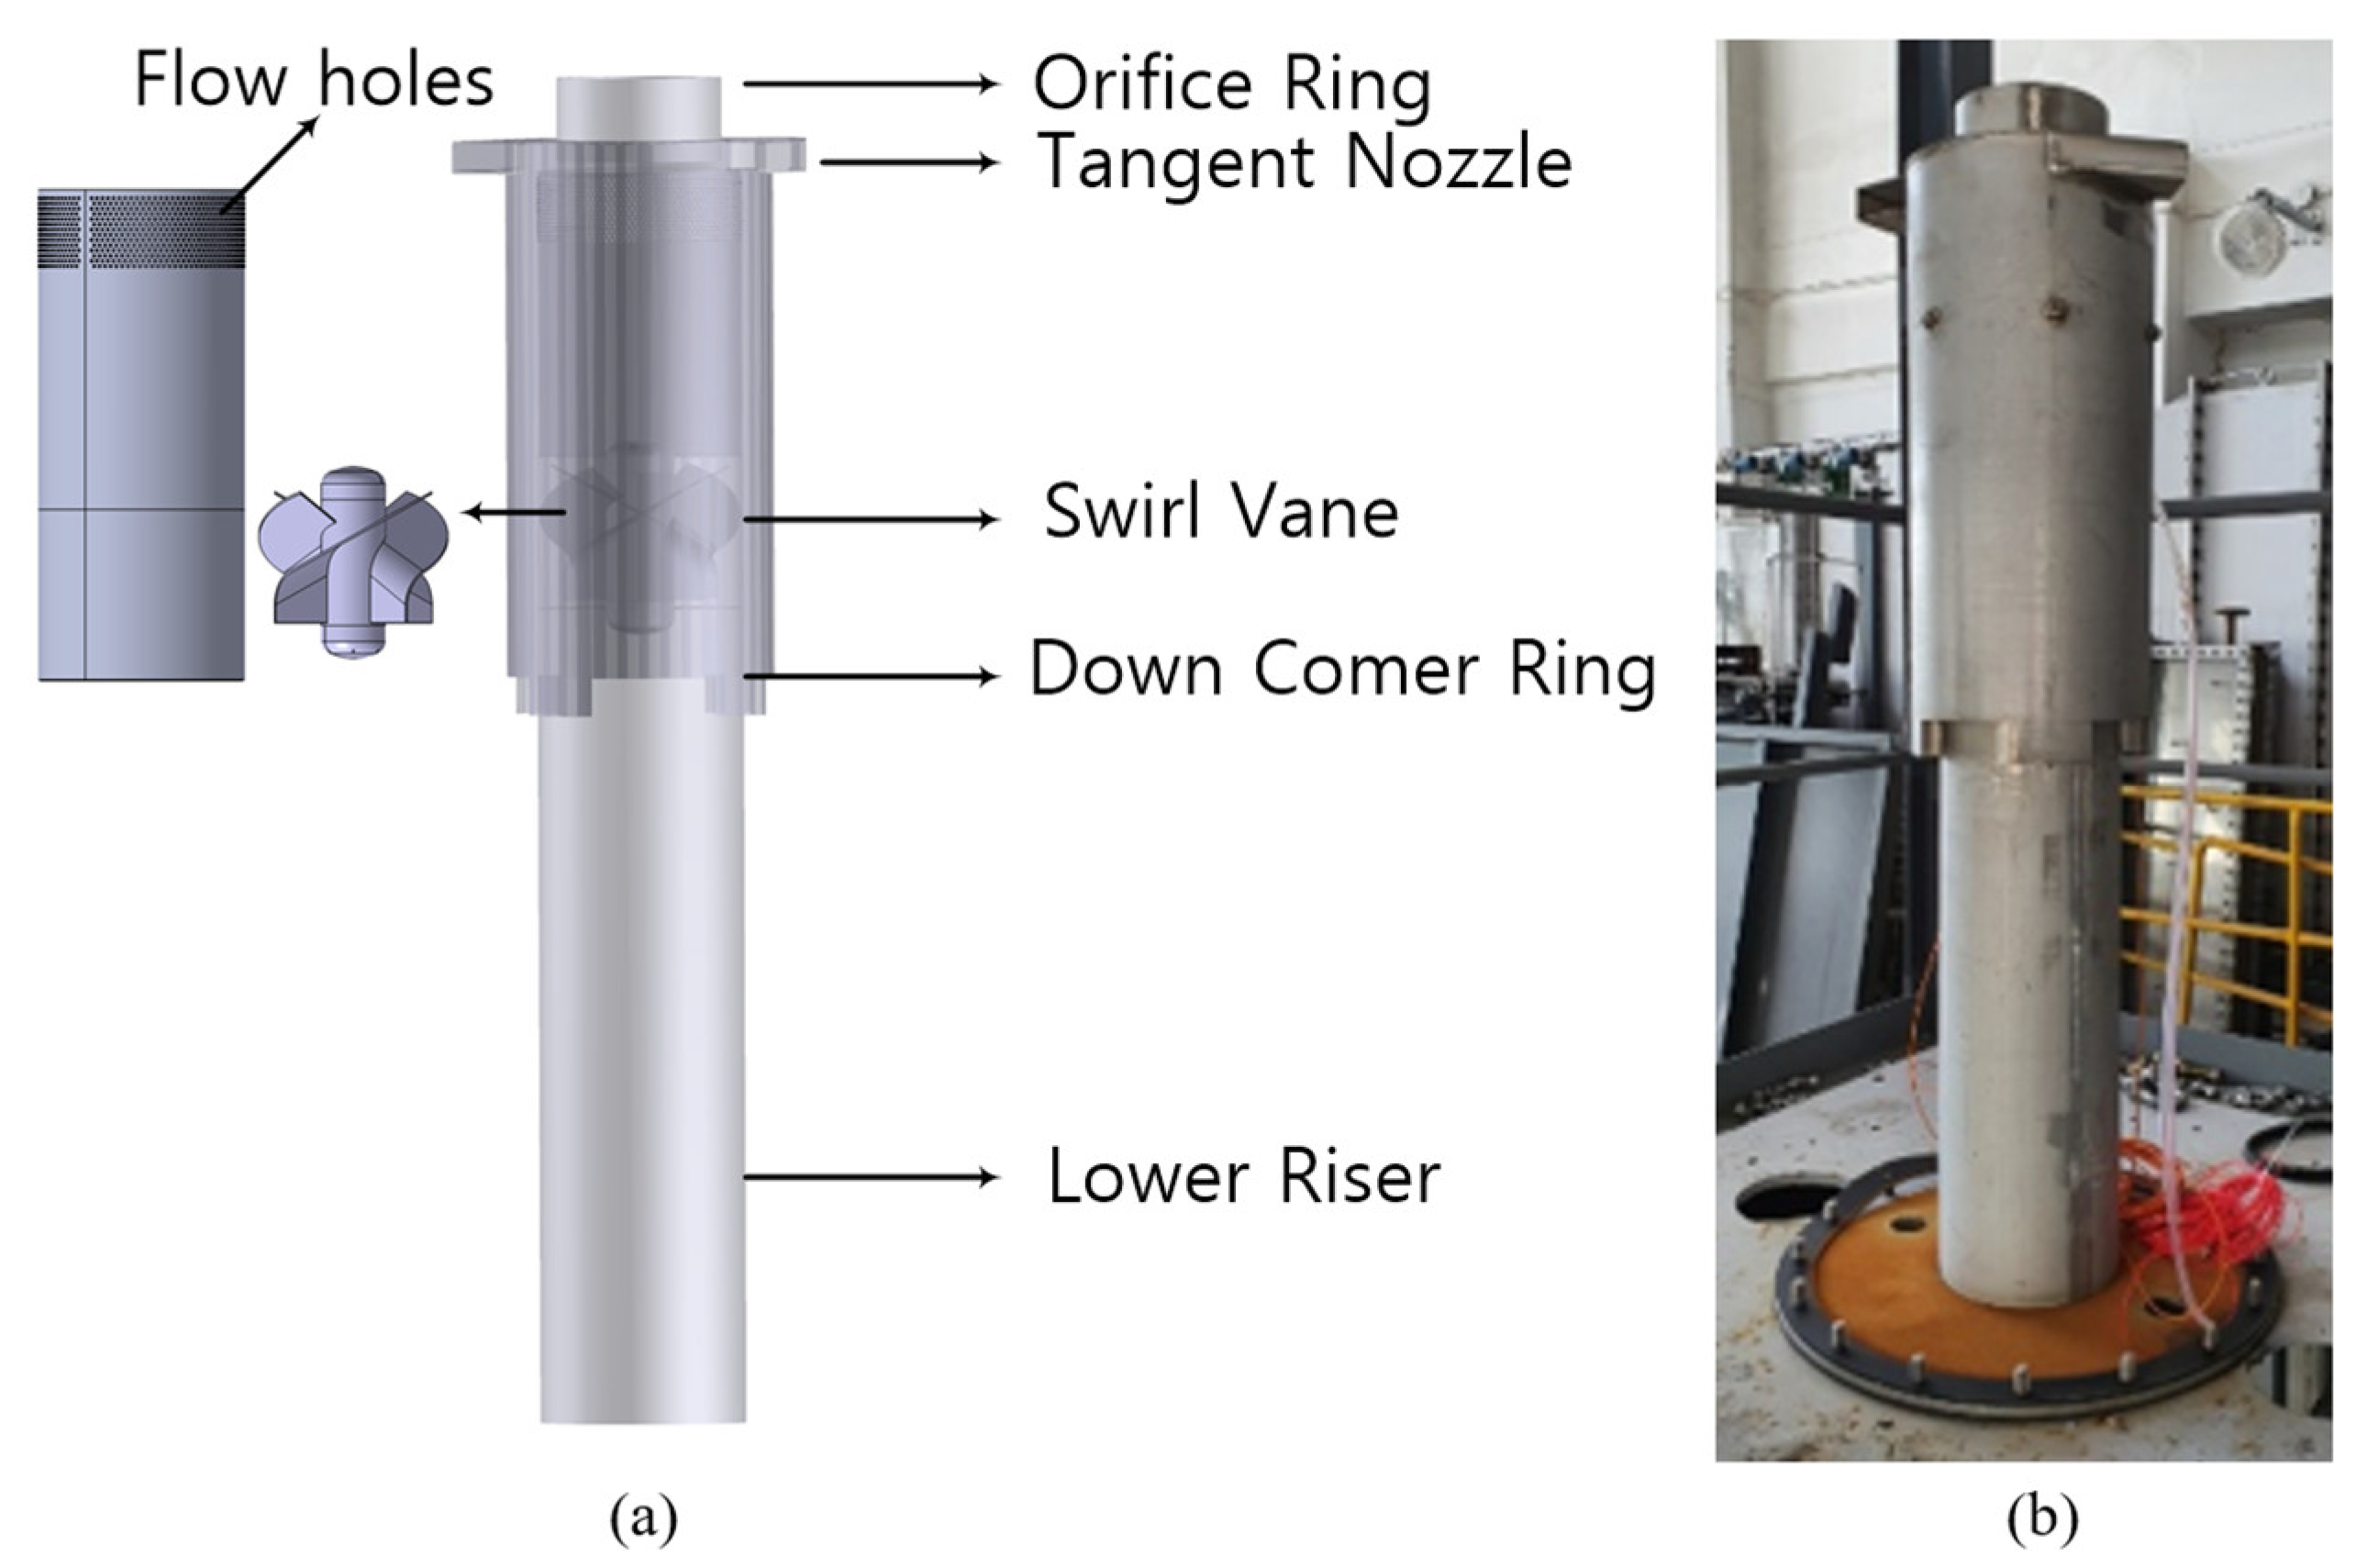
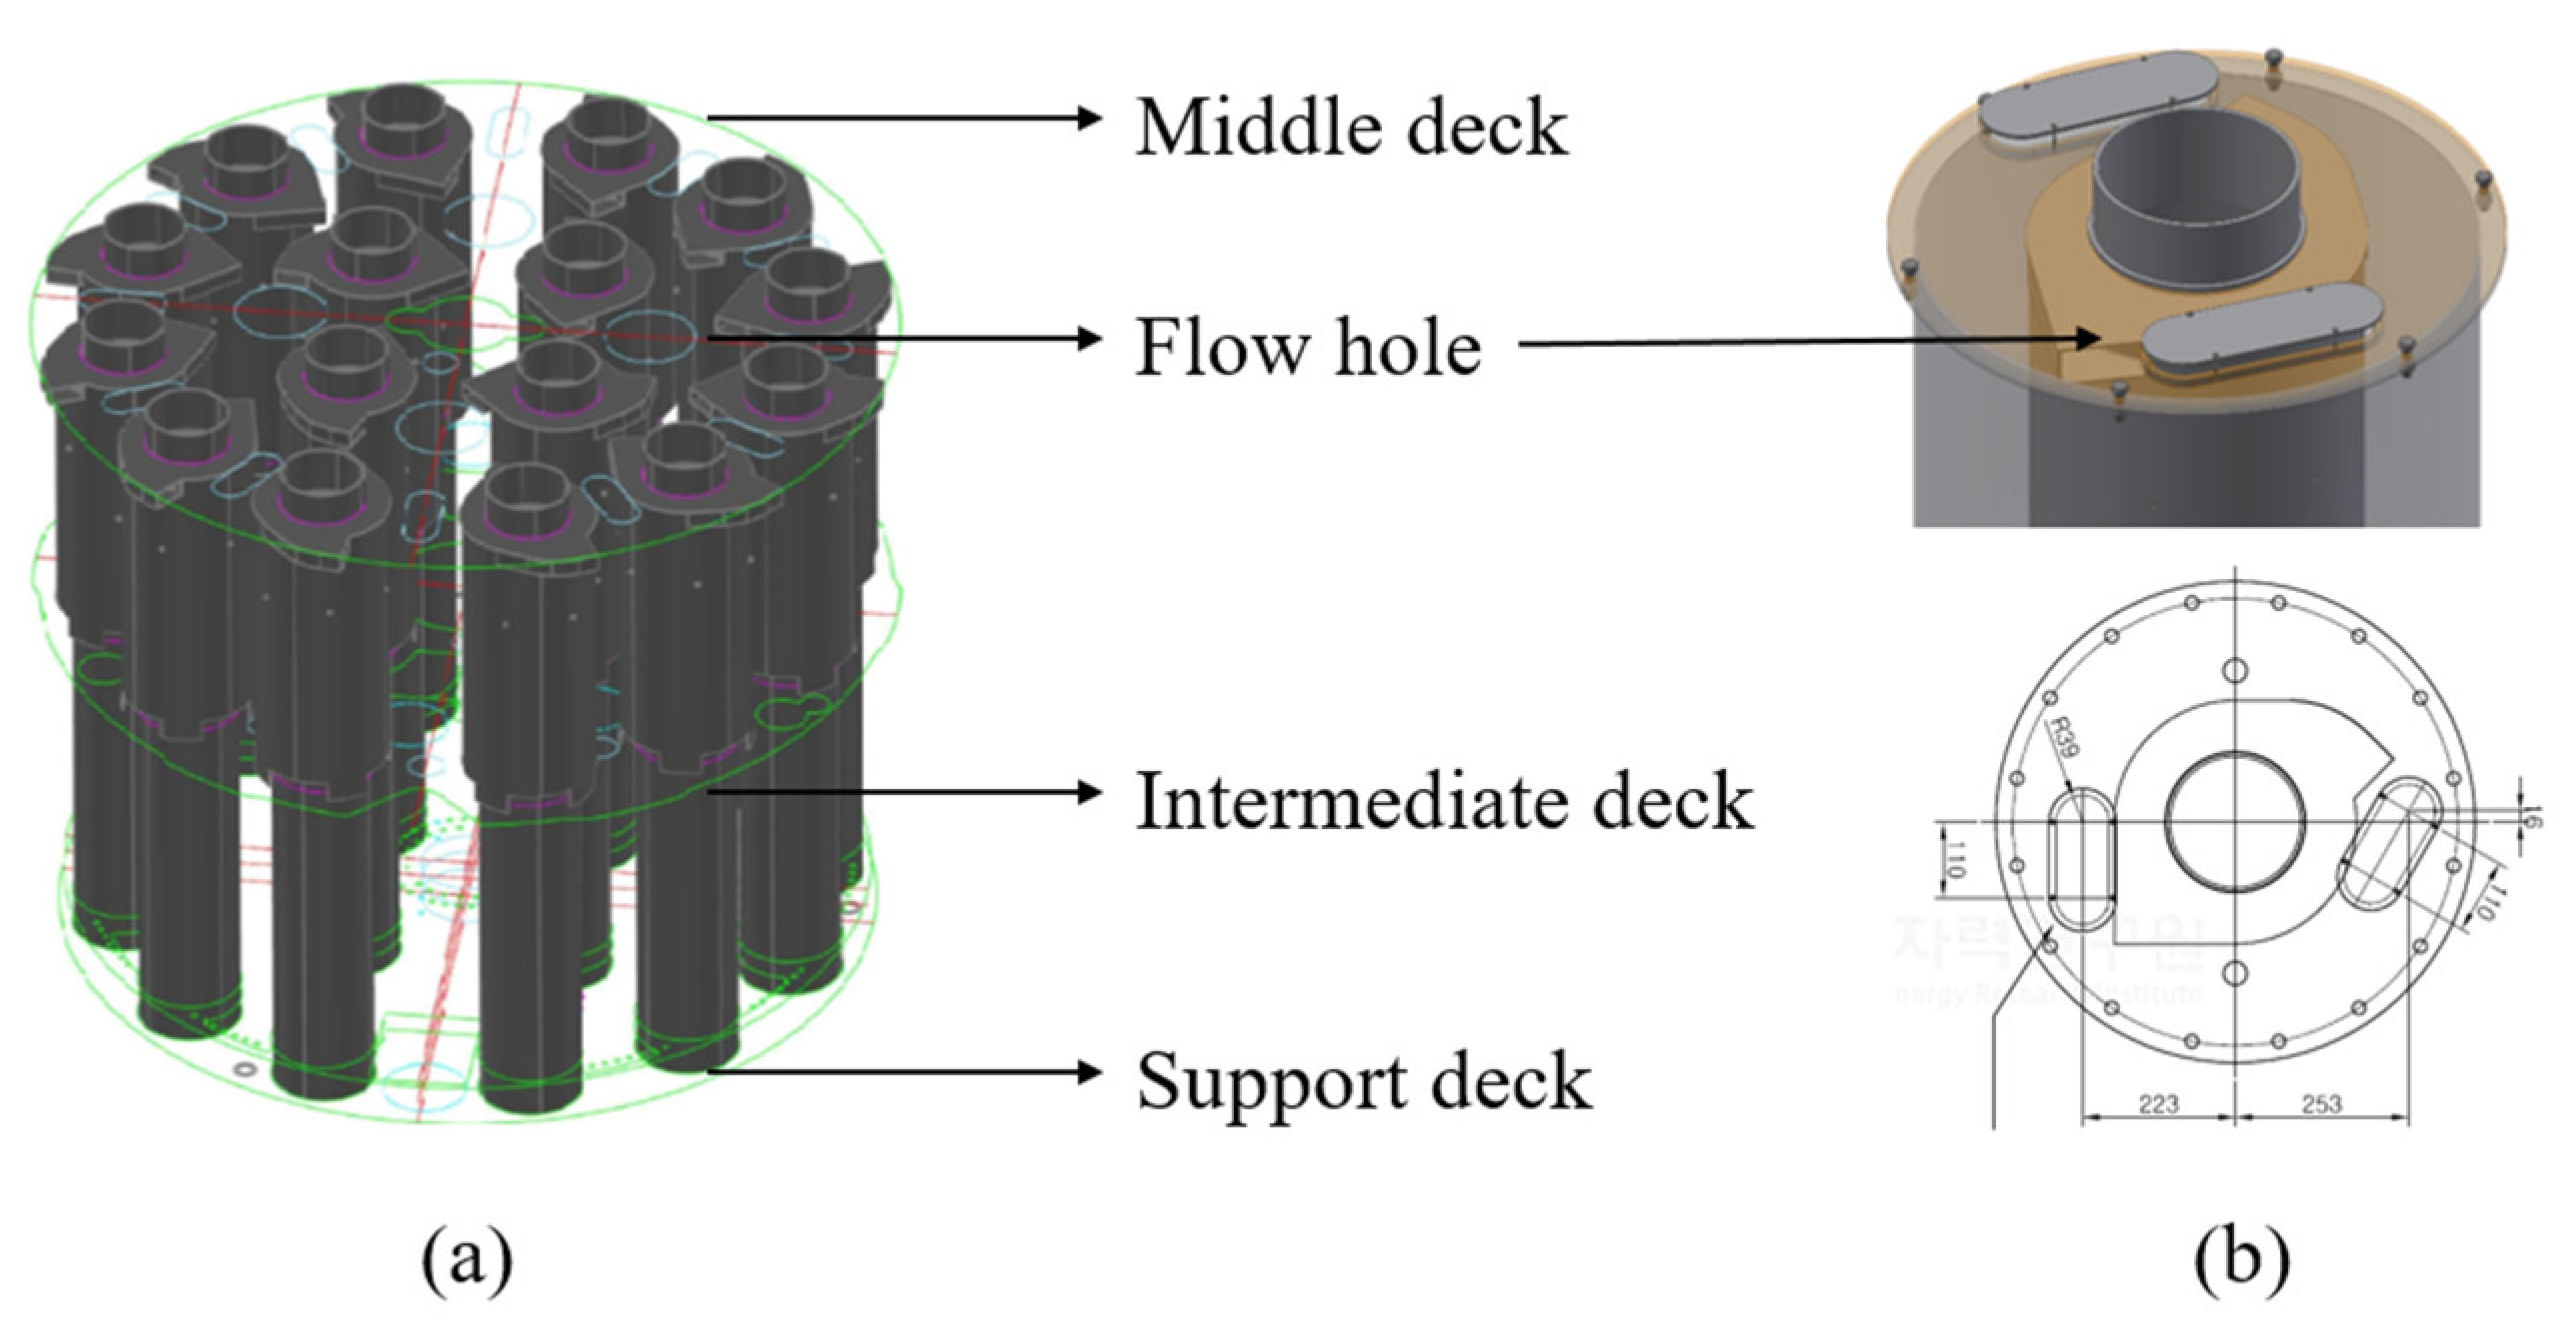
2.1. Half-Sclae Swirl-Vane Separator

The schematic of the swirl-vane separator and picture are shown in Figure 3. The test section was linearly reduced at a scaling ratio of 1/2 by referring to the prototype. There were flow holes on the top of the riser to separate the droplets driven by a centrifugal force. The diameter of the flow holes and thickness were maintained, which may have affected the pressure drop; thus, the porosity was preserved by adjusting the number of flow holes. The swirl-vane separator was set up by several decks in a steam generator, as shown in Figure 4. The support deck and middle deck were simulated in the PEMS test facility; however, the intermediate deck was submerged below the normal water level and was assumed to not have an effect on the flow field. There were flow holes on the middle deck for balancing the pressure and the maintenance, and the hole area was simulated with the same design philosophy of the riser holes to preserve flow characteristics. Figure 5 shows the instrumentation of the test section. The total pressure at the inlet and dryer inlet were measured, and the temperature was measured along the main flow path to calculate the density.

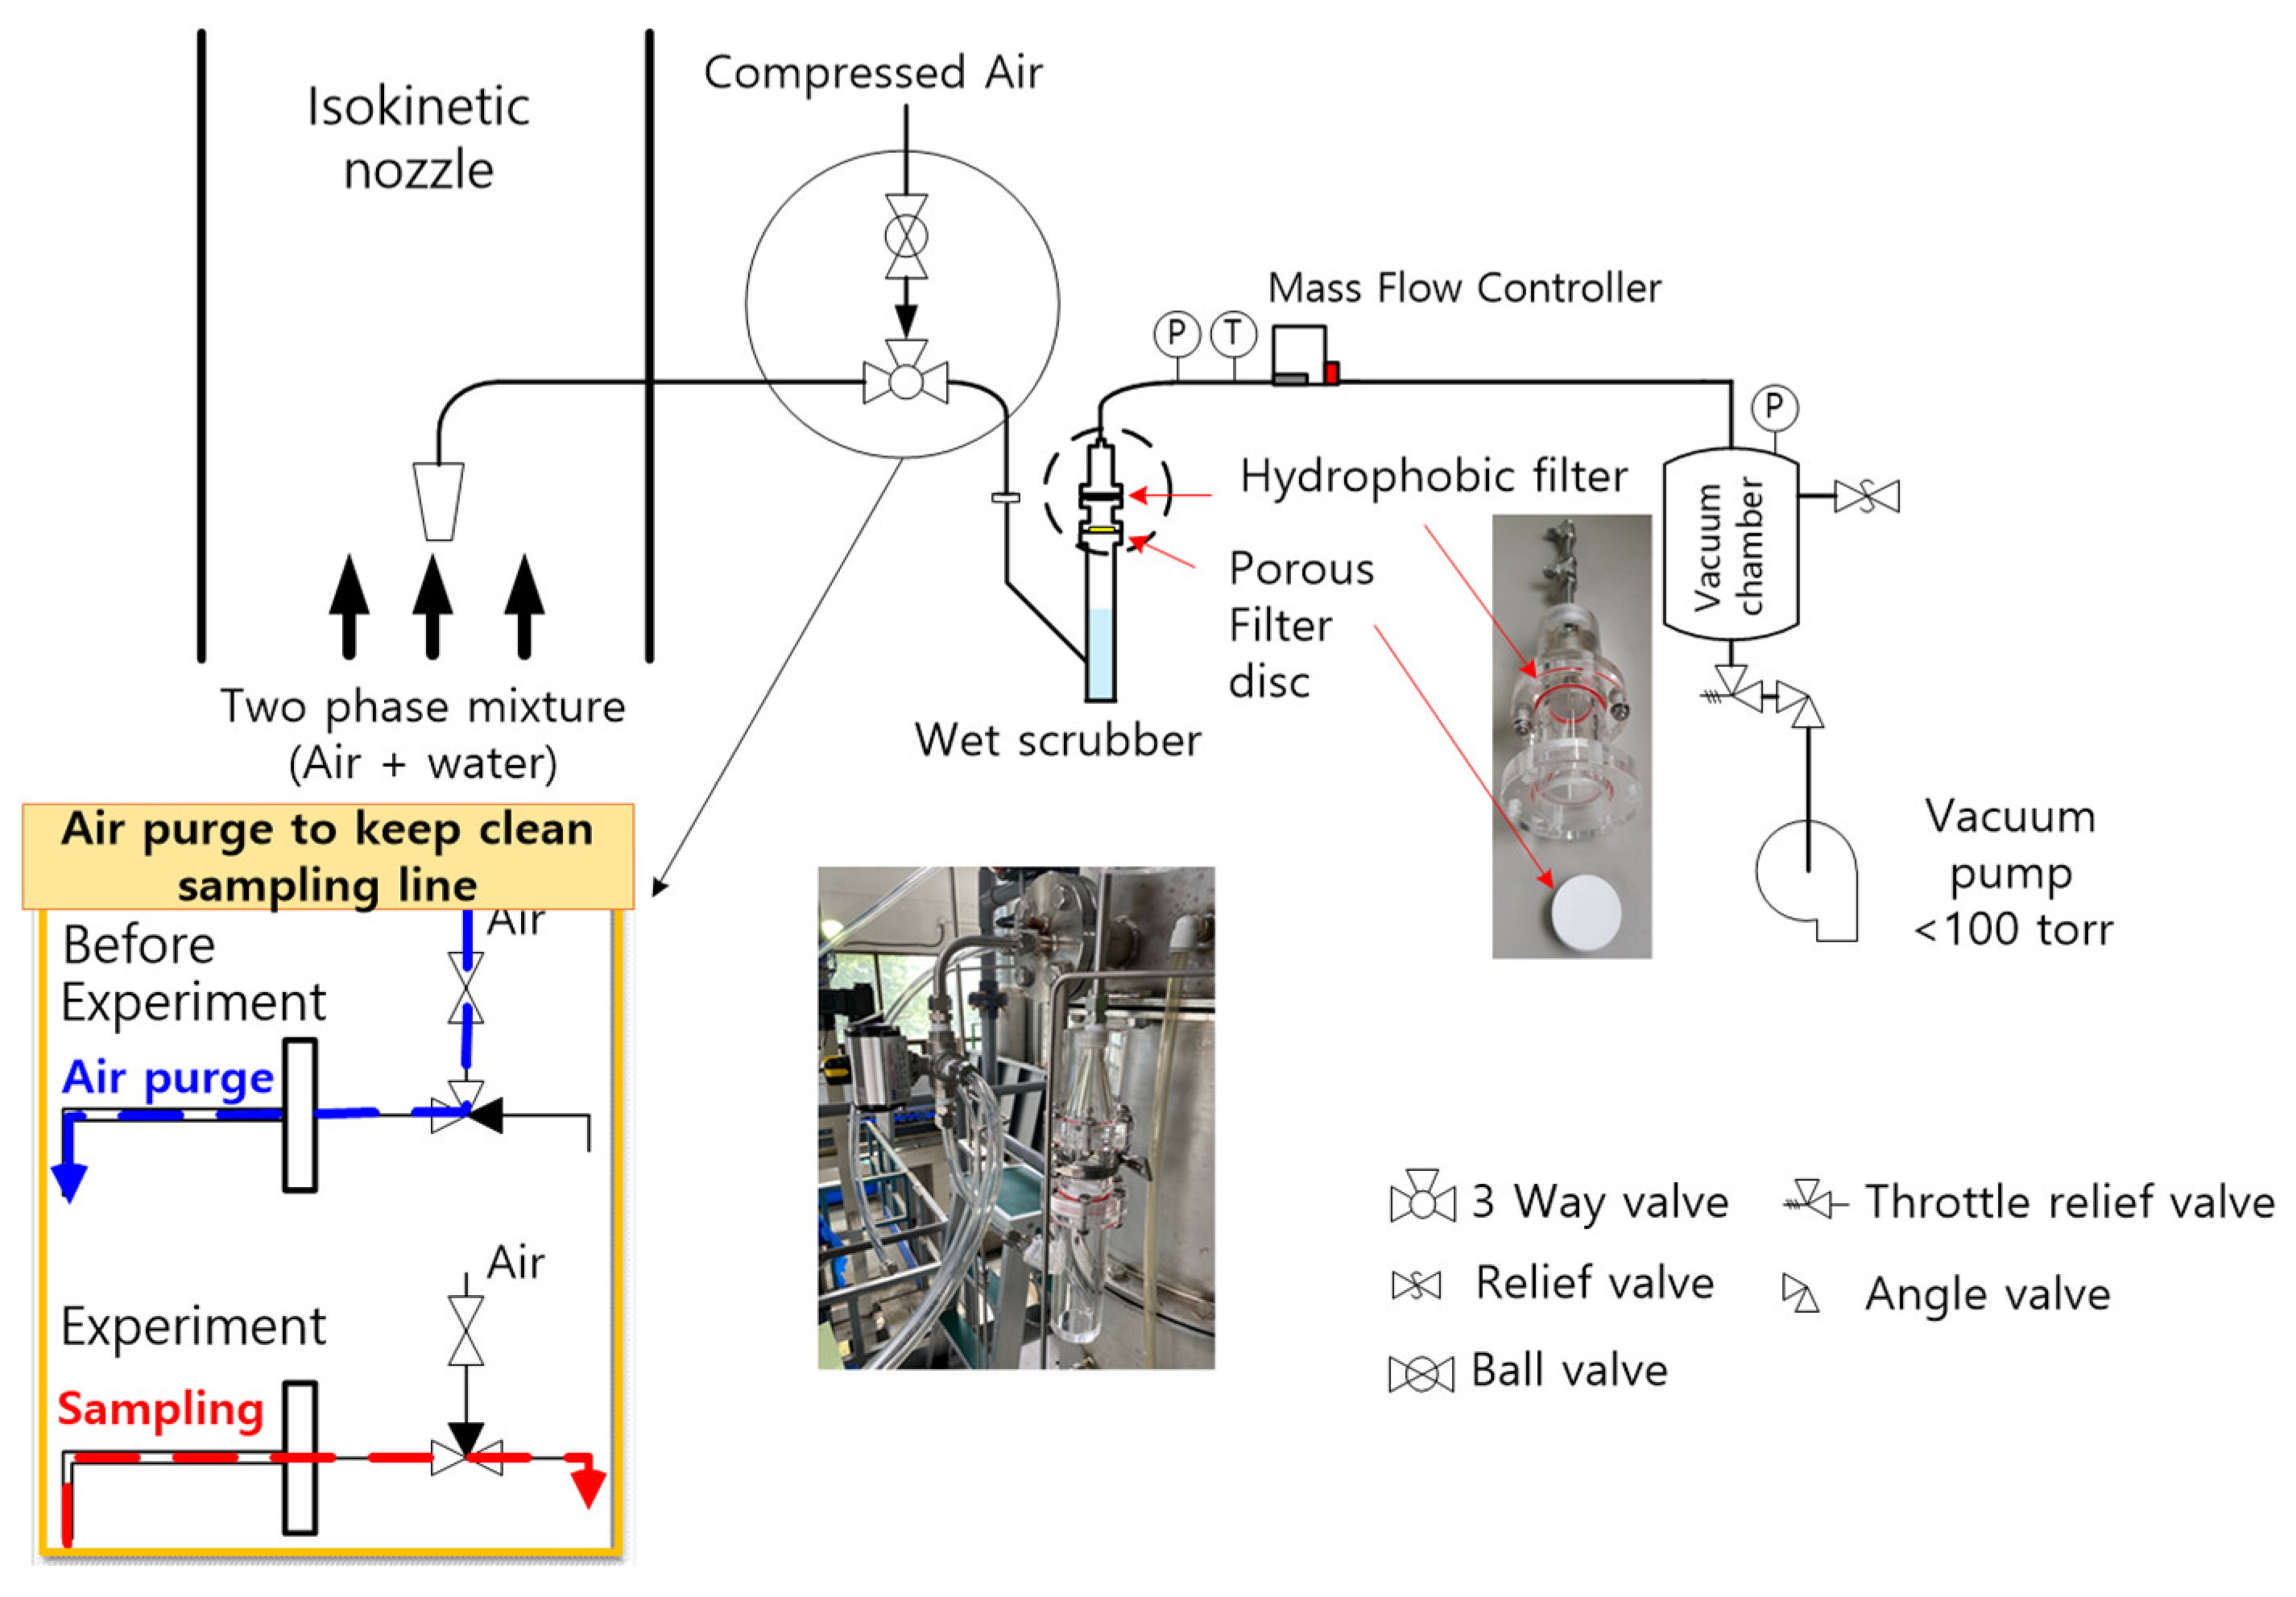
2.2. Experimental Method for MCO

The MCO is the ratio of water mass fraction as follows:
MCO ( % ) = m ˙ w ¯ m ˙ a ¯ + m ˙ w ¯ × 100
m ˙ w ¯ = m ˙ w , T ¯ m ˙ w , 0 ¯
m ˙ a ¯ = i = 0 T Δ t i × m ˙ M F C ¯
where m ˙ w ¯ and m ˙ a ¯ are the averaged mass flow rate of water and air, respectively. The Δ t i is the sampling time of the measurement. The MCO is strongly dependent on the measurement location and the accurate flow rate measurement of each phase is indispensable to ensure the MCO calculation; therefore, it is impossible to measure each flow rate simultaneously at the measurement point. Therefore, the isokinetic sampling system was adopted and the configuration is shown in Figure 6. The two-phase mixture was sampled by using an isokinetic nozzle which had a half inch diameter determined by assuming the total mass of droplets. The sampled two-phase mixture was passed through the wet scrubber tank and two different types of hydrophobic porous filters. The large droplets were removed in the wet scrubber tank and the remaining or entrained droplets ranging from 0.45 to 40 μ m were removed by passing though the two filters. The weight of the wet scrubber tank, including the filters, was measured together by using a load cell. The m ˙ w ¯ can be calculated by the difference of the weight, as shown in Equation (2). The separated air can be independently measured by using the mass flow controller ( m ˙ M F C ¯ ) and the flow rates were integrated during the measurement, as defined in Equation (3).

2.3. Prediction Model for the Two-Phase Pressure Drop

We developed the empirical correlation to predict the two-phase pressure drop of the CE type separator based on a separated flow model [12]. The empirical model was expressed using non-dimensional parameters, such as the liquid fraction (quality), the working fluids (density ratio), the buoyancy and interfacial friction (non-dimensional superficial velocity) in the two-phase flow and the scaling ratio. The two-phase pressure drop multiplier was determined by the large database from the air-water and the steam-water experiments [12], as shown in Equation (4):
L O ,   m 2 = 1.89 ( 1 + x ) 9.4 ( j g * ) 0.91 ( ρ f / ρ f 18.3 ) 0.483 ( D h , p D h , m ) 0.7
where, ρ and D h are the density and the hydraulic diameter of the separator, respectively. f and g denote the phase, and p and m are the prototype and the model, respectively. The quality and non-dimensional superficial velocity are defined in Equations (5) and (6), respectively. The j g * was derived from the force balance equation of the driving force between the buoyance and interfacial friction, and was represented the flooding phenomena as a correlation by Wallis [15]:
x = ρ g j g ρ g j g + ρ l j f
j g * = ρ g j g 1 / 2 [ g D h ( ρ g ρ f ) ]
where, j and g are the superficial velocity and the gravitational acceleration, respectively. The pressure drop multiplier can be used to predict the two-phase pressure drop under the plant condition using Equation (7) [16]:
Δ P 2 = L O , m 2 × Δ P L O
Δ P L O = E u 1 × ρ l j f
where the Δ P L O is the total liquid pressure drop when assuming the whole flow passage is occupied by liquid. The E u 1 is the single-phase Euler number and should be obtained from the single-phase air pressure drop tests. The methodology was verified with the benchmark data under the plant condition of the CE type separator [11]. However, there is no benchmark data for the swirl-vane separator; thus, Equation (4) should be improved based on the physics and additional experiments are indispensable to quantify the Eu number for the swirl-vane separator. The improved model is described in the next section with the experimental results.

3. Experimental Results

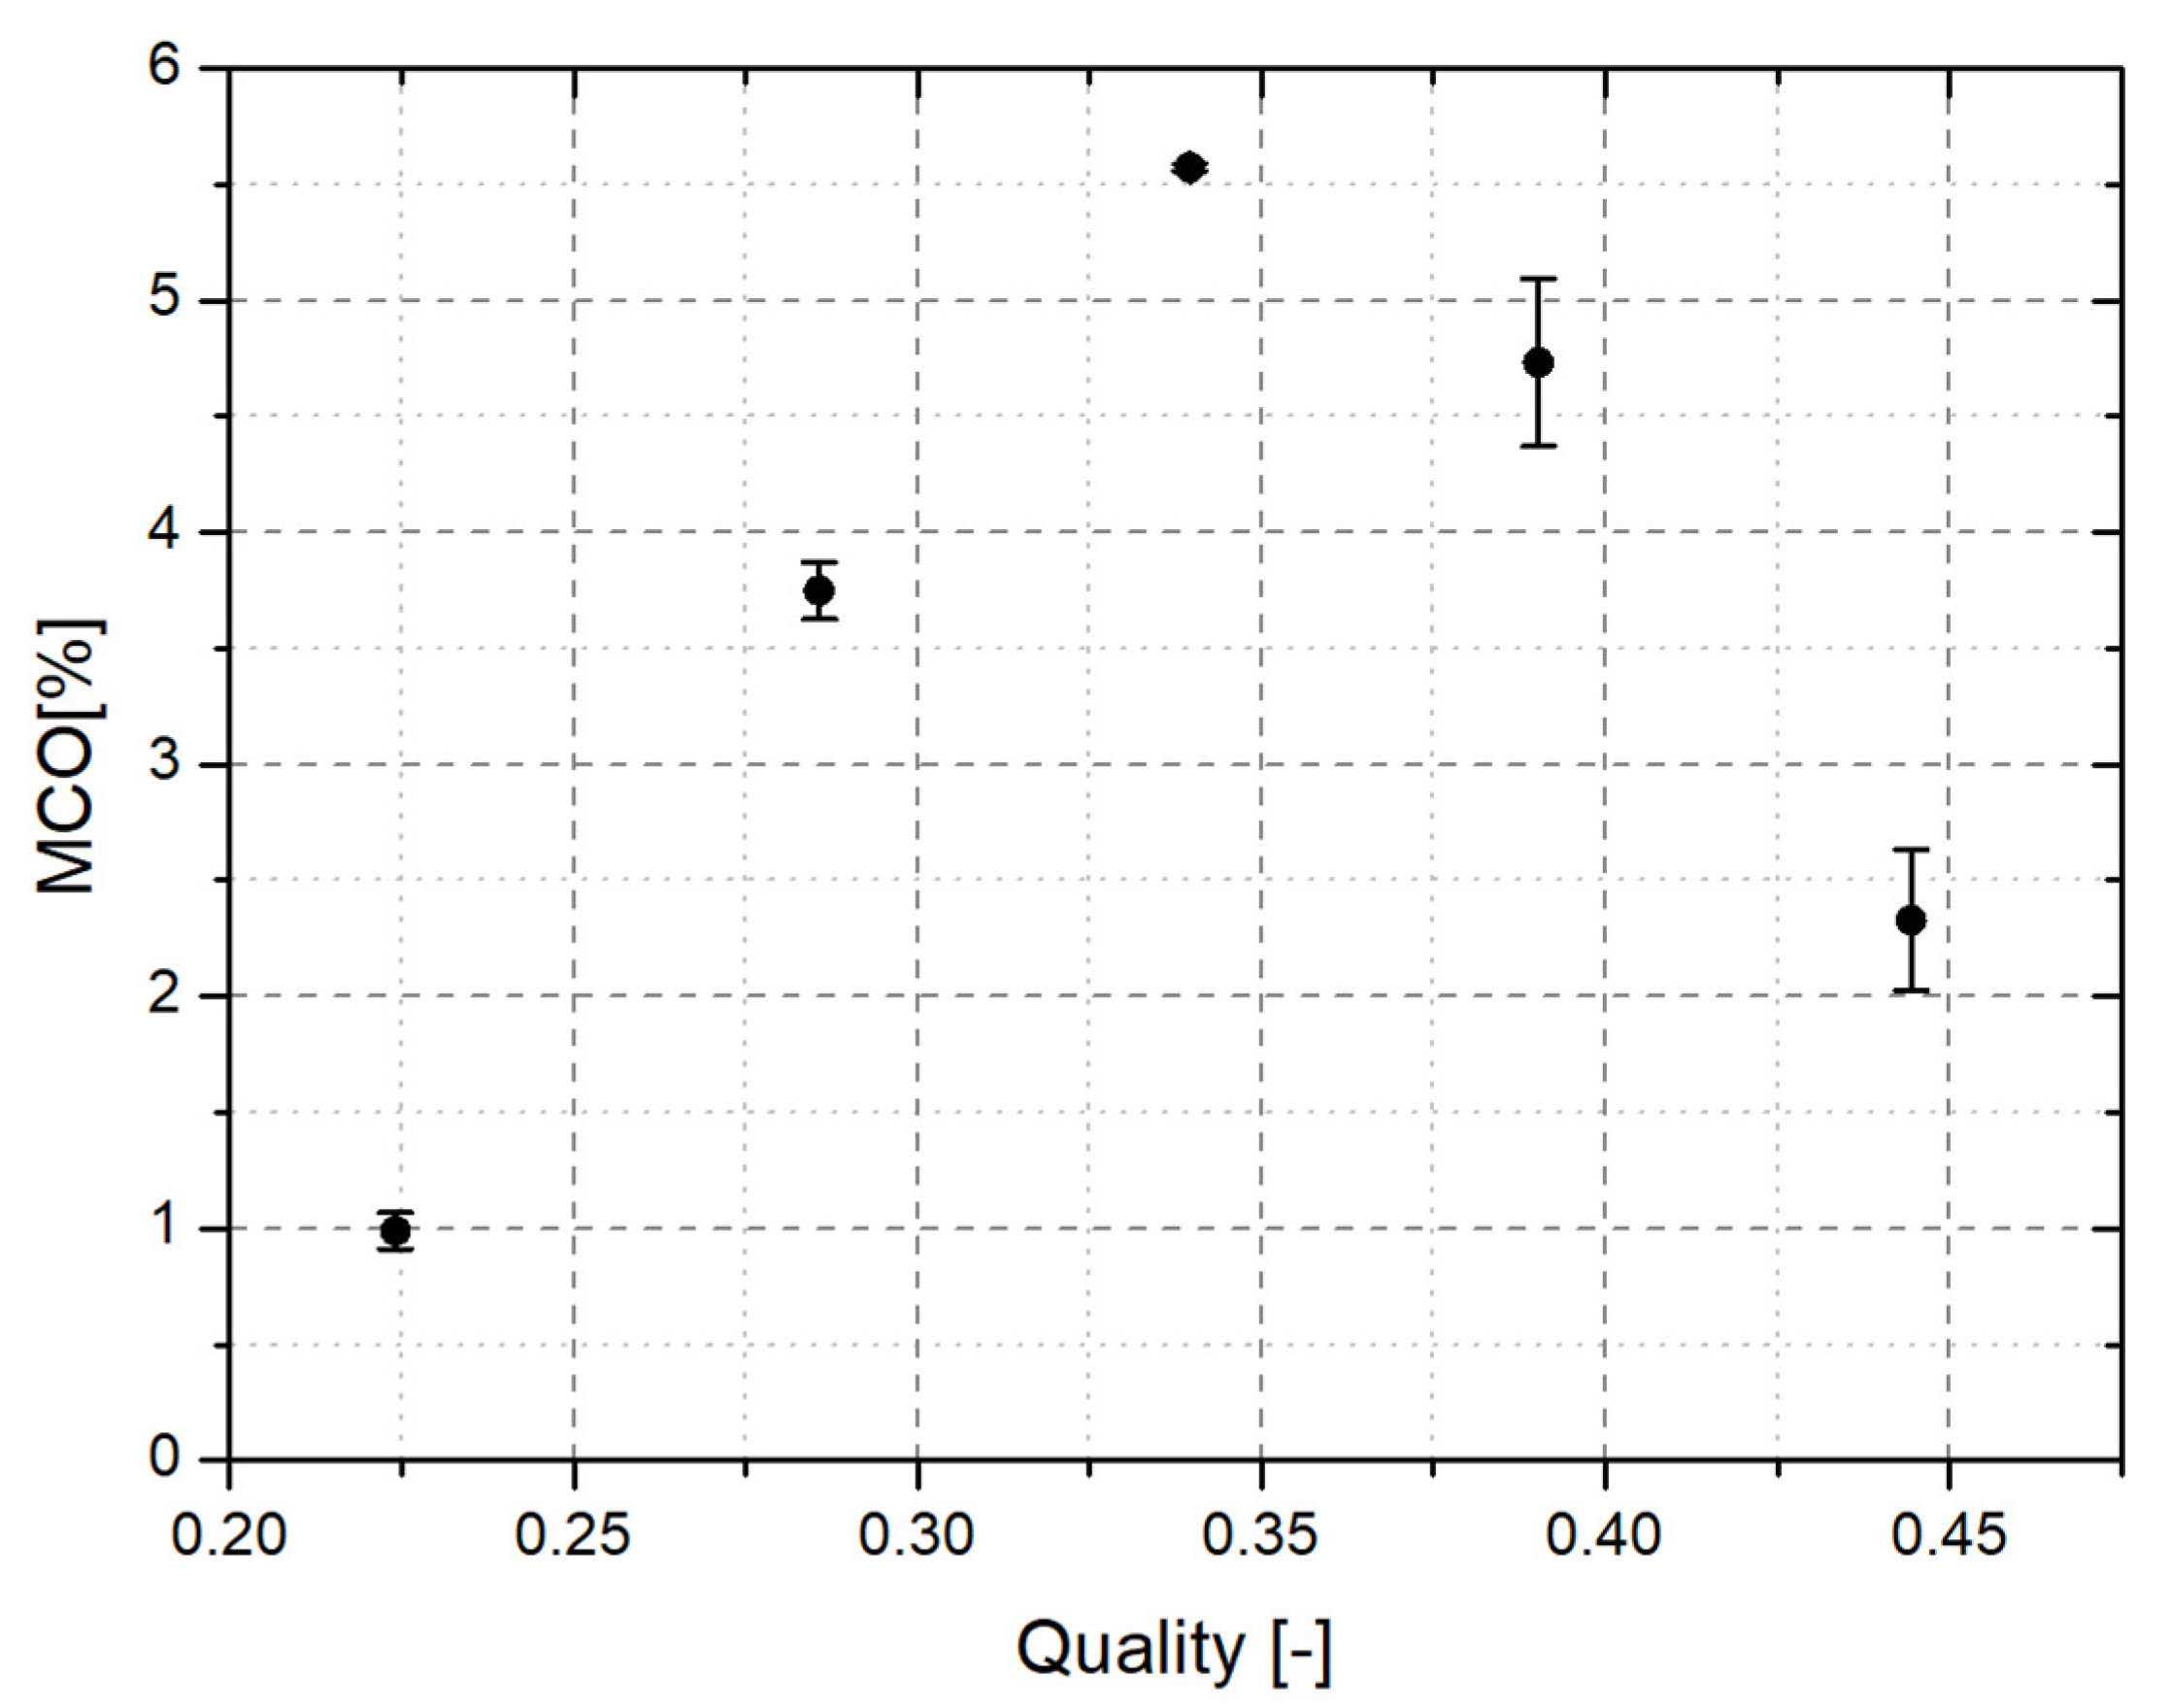
3.1. MCO Test Condtions and Results

The steam-water test conditions were converted to air-water test conditions preserving the quality and the two-phase centrifugal force, as shown(expressed) in Equation (9). The two-phase centrifugal force is defined in Equation (10), and the homogeneous density of Equation (11) is calculated by using the void fraction of Equation (12) and the density of each phase. From Equations (9)–(12), the independent variables of the PEMS test facility were derived to the superficial velocities of each phase, as shown in Equations (13) and (14). The scaling ratio of the PEMS test facility are summarized in Table 2.
( F C ) p ( F C ) m = 1 1   and   ( x ) p ( x ) m = 1 1
F c = ρ h ( j g + j f ) 2 D h / 2
ρ h = ρ g α + ( 1 α ) ρ f
α = x ρ f x ( ρ f ρ g ) + ρ g
j g , m = [ ( D h F c ρ h ) ( x ρ f x ρ g + ( 1 x ) ρ g ) ] p
j f , m = [ 1 x x ρ g j g ρ f ] p
All experiments were conducted under the steady-state condition maintaining the inlet flow rates of each phase. The integrity of the test conditions was checked by using the coefficient of variation (C.V) of Equation (15). The inlet pressure, temperature, and flow rates satisfied the test requirement within ± 3 % .
C . V ( % ) = σ S T D . X ¯ A V G . × 100
The test conditions were divided by the operating pressure and the water mass fluxes. Thirty-four cases were tested corresponding to 53–133% of full load (100% reactor coolant system) of the steam generator operating condition. Figure 7 shows the dependency of MCO on quality, and the G L is the water mass flux. The G L , O means the liquid mass flux for the normal condition of a steam generator. The MCO increased along with the water liquid mass flux and the quality and decreased when the operating pressure increased. In the present study, the MCO was measured at the dryer inlet, as shown in Figure 5. The droplets were generally removed through the flow holes by the centrifugal force at the internal region of the separator, but the inertial force became dominant at the gravity region. The effect of the operating pressure can be confirmed by comparing the two-phase centrifugal forces under the same quality test conditions as shown in Table 3. The two-phase centrifugal force of 5.5 MPa cases was larger than that of the 6.5 MPa, but the gas superficial velocity of 5.5 MPa cases was higher than 19–20%, regardless of quality. When the centrifugal force is not enough to perfectly separate all droplets, a large quantity of droplets may be entrained by the inertial force at the separator exit. The number density of droplets also increased in proportion the water mass flux at the gravity region. This means that the entrained droplets faithfully follow the gas velocity from the separator inlet to the dryer inlet. Overall, the MCO were in range of 0.30~7.05% for the test conditions. The repeatability tests were also carried out for the various qualities, and the results are shown in Figure 7. The uncertainties of the MCO and quality were in range of 0.30 to 0.36% and 0.00 to 0.85%, respectively. Uncertainties for the high quality were relatively large due to the turbulent structure within the flow as shown in Figure 8.

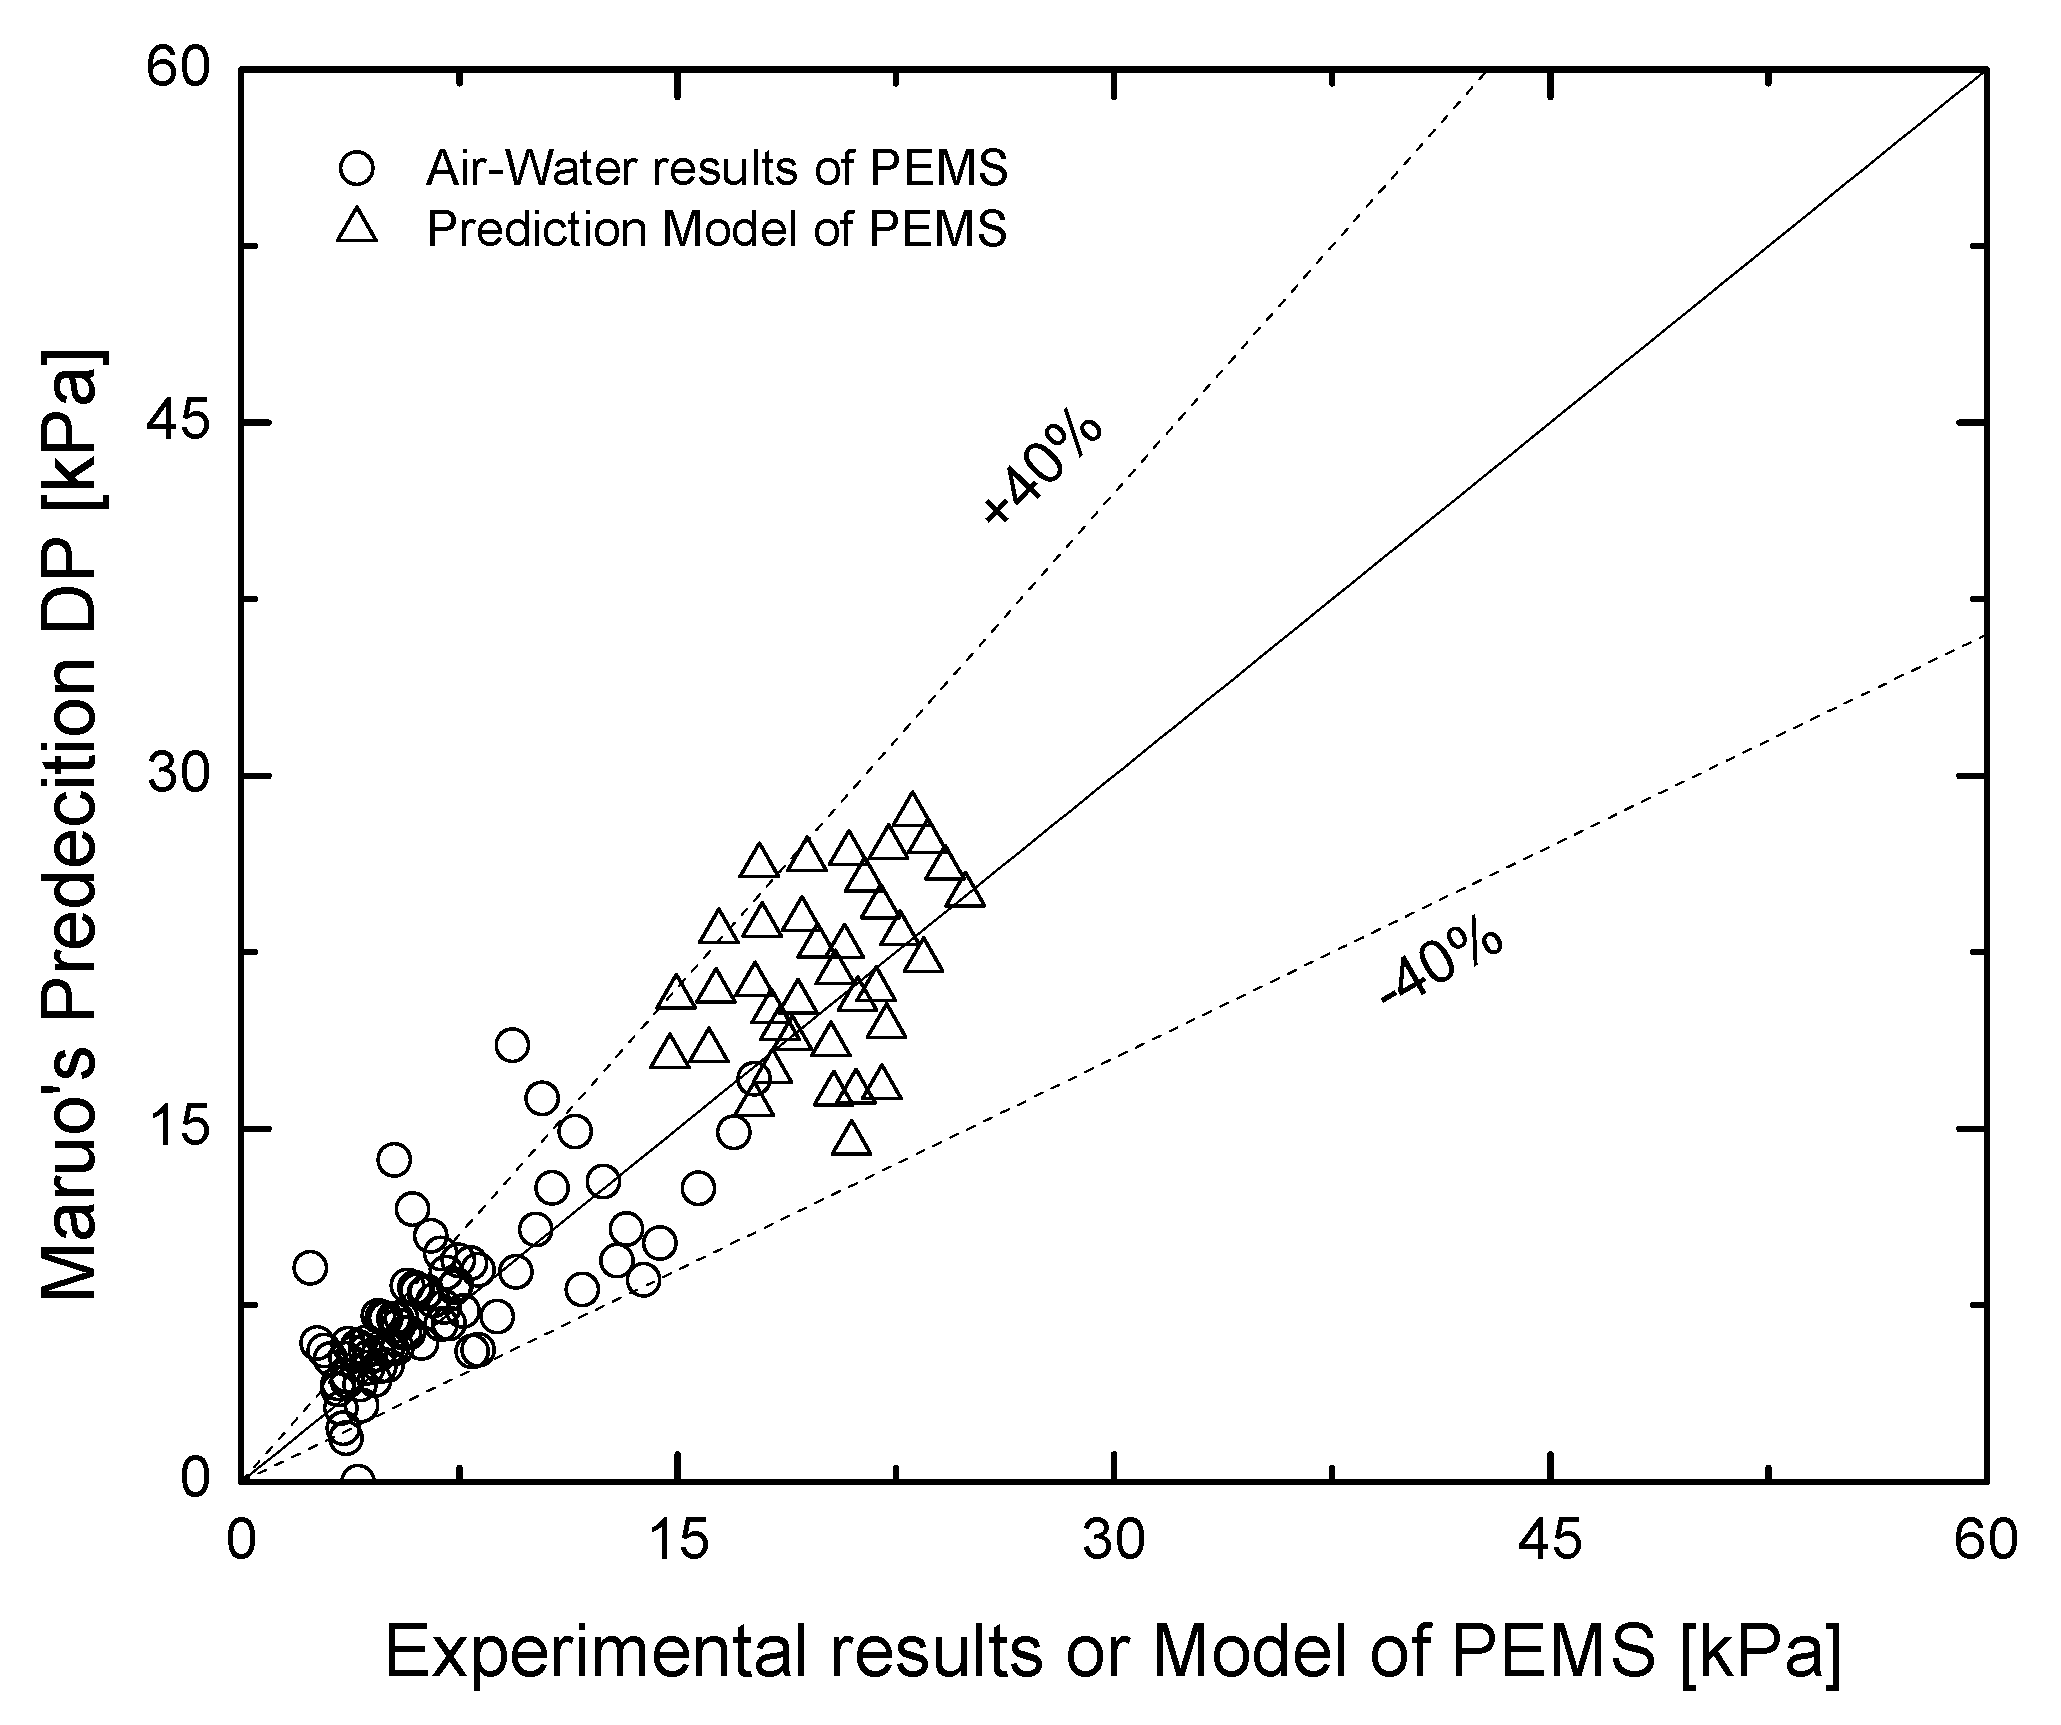
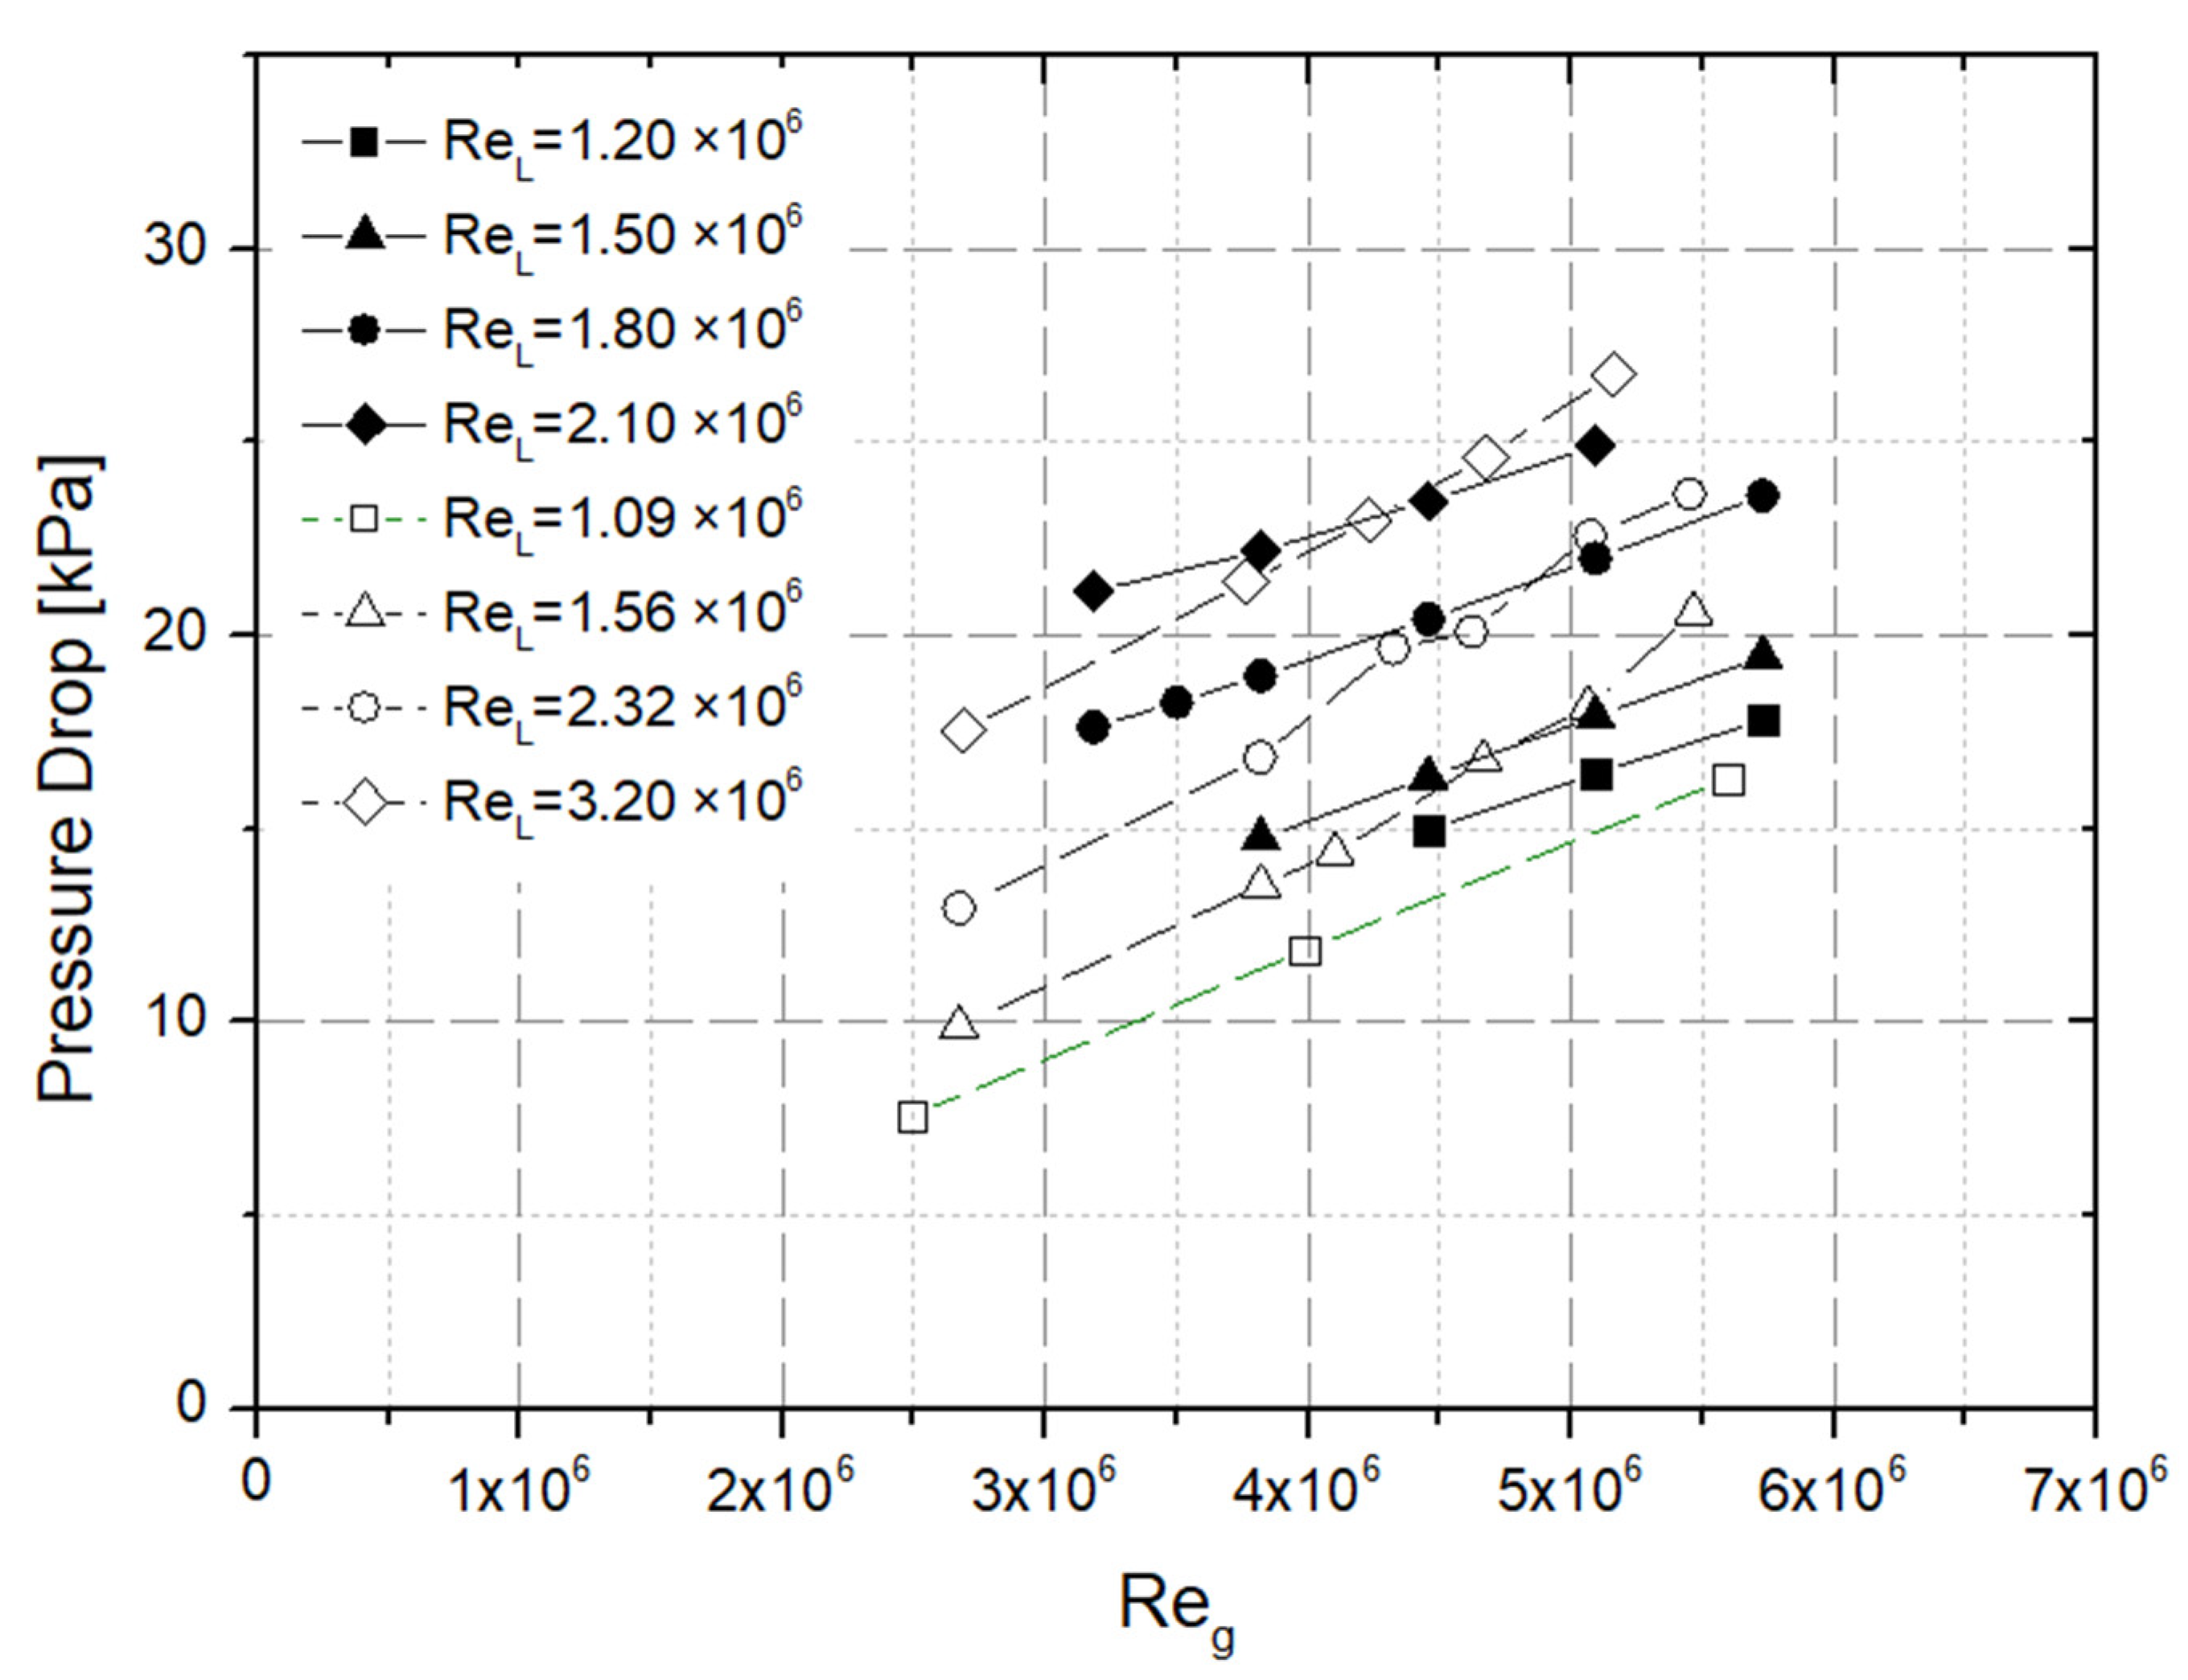
3.2. Improvement of the Emprical Correlation for Two-Phase Pressure Drop

Single and two-phase flow experiments were carried out to improve the empirical model proposed by Kim et al. [12]. First, the Eu number should be quantified, as defined in Equation (16). The single-phase experiments were performed under the steady-state condition for various air velocities, and the results are summarized in Table 4. The obtained Eu number was a constant, approximately equal to 6.77, and is used to calculate the total liquid pressure drop ( Δ P L O ) of Equation (8).
E u 1 = Δ P g ρ g j g 2
There was an inherent limitation in improving the empirical constants of Equation (4) for the swirl-vane separator, since there was no benchmark experimental data for optimizing the pressure drop multipliers. The principle of separation of the CE type and the WH type separators were similar in that both of their two-phase mixtures were subjected to a high centrifugal force field, and the droplets were separated based on physical differences between each phase, such as the density, the liquid fraction, and the gas momentum. The main difference between the two separators were the swirl generation location, the decay of swirl and the geometric shape. Based on this assumption, Equation (4) was extended by adding the swirl-shape factor ( S f ) in the form.
L O ,   m 2 = 1.89 ( 1 + x ) 9.4 ( j g * ) 0.91 ( ρ f / ρ g 18.3 ) 0.483 ( D h , p D h , m ) 0.7 S f
Additional two-phase pressure drop experiments were performed to quantify the swirl-shape factor. The quality, the non-dimensional superficial velocity and the density ratio of working fluids in Equation (17) were maintained under the same conditions for the CE type and WH type separators. The hydraulic diameter of the CE type and WH type were 0.25 m and 0.28 m, respectively. The experiments were performed under the steady-state, and the ratio of the measured two-phase pressure drop is calculated and the test conditions are summarized in Table 5. As shown in Table 4, the ratio of pressure drop showed no significant differences for 0.217~0.440 of the quality. The average value of S f was 1/2.37 with ± 4 % of the standard deviation. The two-phase pressure drop of the swirl-vane separator was biased by a constant amount from the CE type separator regardless of hydraulic parameters such as the quality, superficial velocities and the properties of working fluids. This means that the inherent difference of swirl location or geometric shape induces the discrepancy of the two-phase pressure drop as a constant value, even though the two-phase pressure drop is accompanied by the multi-dimensional two-phase vortex flow. Therefore, the original empirical correlation was still valid for the swirl-vane separator by adding the swirl-shape factor, and the two-phase pressure drop under the steam-water condition can be predicted by using Equation (7).

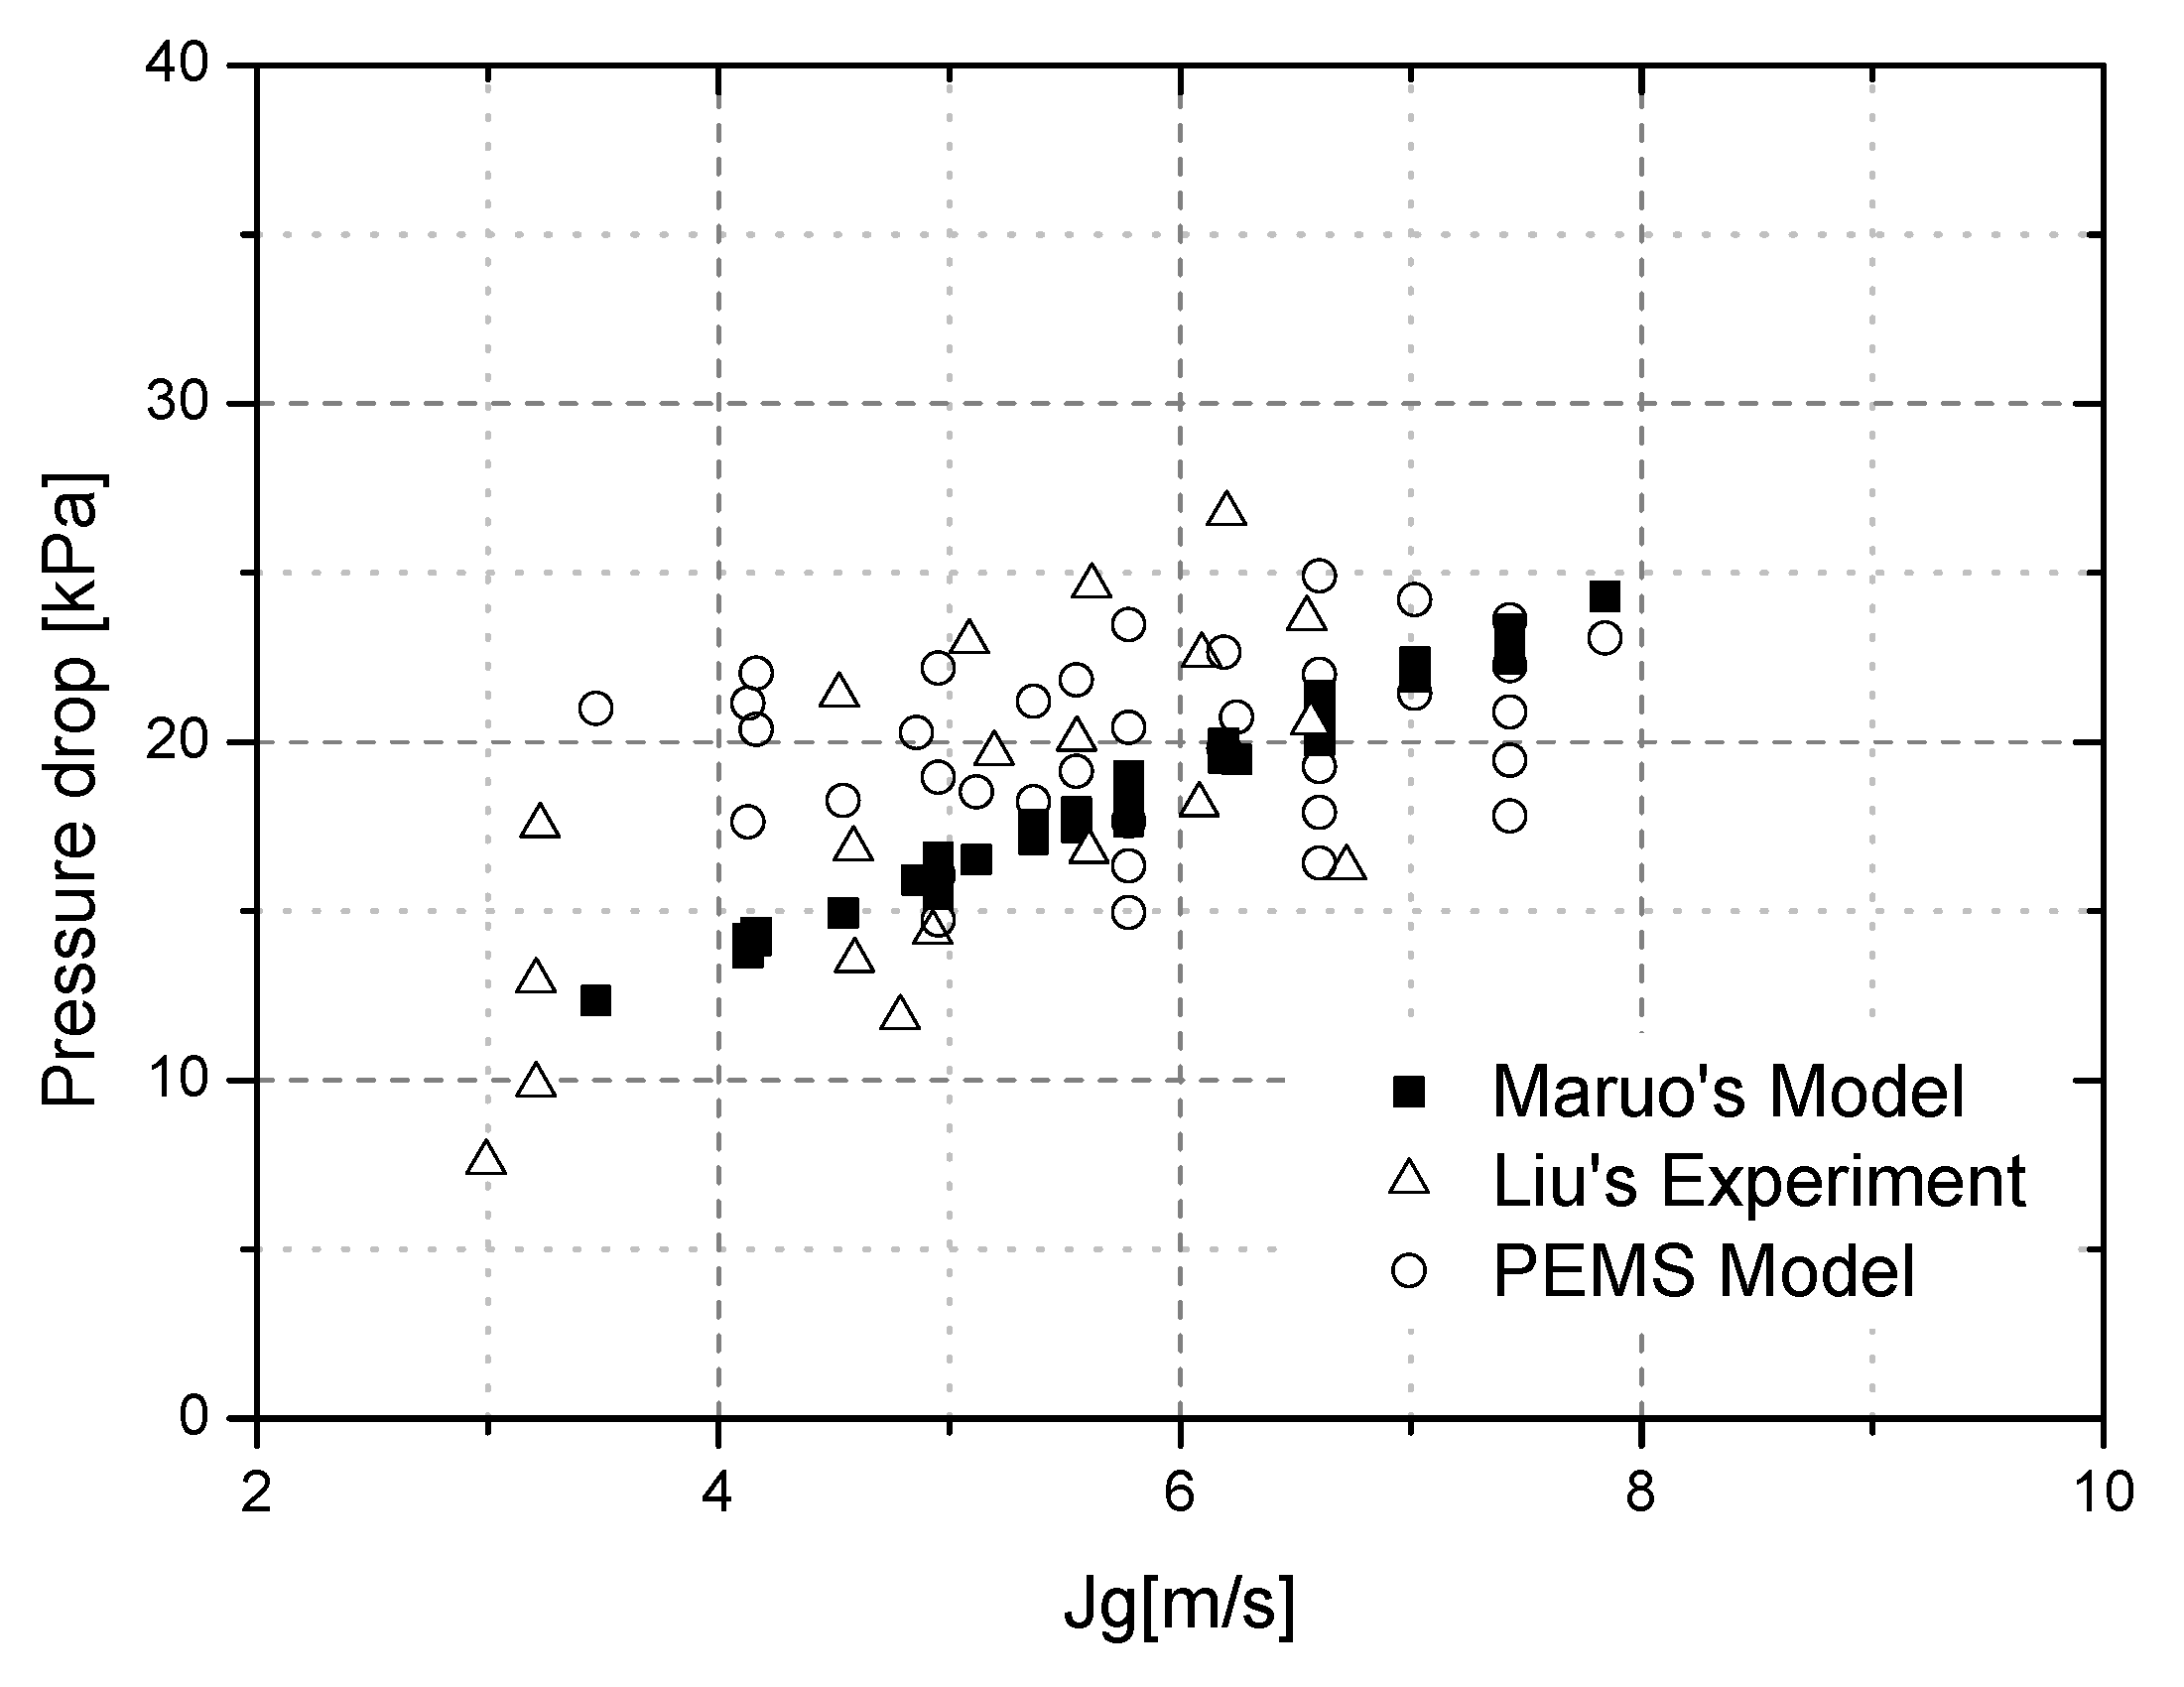
3.3. Discusssion of the Empricial Correlation Model

Finally, the two-phase pressure drop under the plant condition can be predicted by scaling-up using Equation (7) by substituting the two-phase pressure drop multiplier of Equation (17) and the Eu number for each test condition. As mentioned above, there were not any benchmark solutions for the swirl-vane separator. The only way to verify the scaled up two-phase pressure drop was to qualitatively compare it with Maruo’s [9] model and Liu’s experimental data [13].
Maruo suggested that the two-phase pressure drop was expressed from the full-scale air-water and steam-water experiments as follows [9]:
Δ P 2 = K G t o t 2 ρ f [ 1 + x ( ρ f ρ g 1 ) ]
where K is the loss coefficient and G t o t is the total mass fluxes of the two-phase mixture at the separator inlet. The gas density ( ρ g ) is available for both air and steam. There wasn’t any information for the loss coefficient, detailed properties of working fluids and the dimension of the separator; thus, Equation (18) was calculated by using the test conditions of this study. All test results were compared with Maruo’s prediction model, as shown in Figure 9. There was a large discrepancy with the air-water test results, but the prediction model ranged within ± 40 % .
Recently, Liu [13] experimentally evaluated for the performance of the full-scale swirl-vane separator under steam-water conditions. They investigated the two-phase pressure drop and presented the experimental data for 1 × 10 6 ~ 6 × 10 6 of Reg and 8.27 × 10 5 ~ 3.2 × 10 6 of ReL at 6 MPa of operating pressure. The geometry was nearly identical to that of the test section of the PEMS, except for the top cap which has an additional structure at the top of the orifice ring. The scaled-up pressure drop was compared with that of Liu’s results, as shown in Figure 10. Identifying the trend of the two-phase pressure drop and evaluating the range of the pressure drop would be valuable since the maximum pressure drop was important in the design process of the overall separator. The test conditions were not exactly the same, but the tendency was similar to Liu’s results.
The discrepancy between the PEMS model and the other models was examined by evaluating the dependency of the gas superficial velocity. As shown in Figure 11, the dependency of Maruo’s model was quite different than others. The pressure gradients generally increase along with the liquid mass flux and quality, while the operating pressure and geometry decrease [6,14]. Therefore, the pressure drop significantly increased when the droplets were suspended in the gas phase due to the interfacial shear effect [17]; thus, the pressure drop did not follow the trend of gas superficial velocity in the two-phase flow. Maruo’s model showed an almost linear distribution along the gas superficial velocity, but the prediction model results were similar with Liu’s results since the prediction model was considered as the dissipative effect in Equation (17).
Figure 12 shows all prediction results of the two-phase pressure drop using the prediction model for 36 cases. The prediction results ranged from 15~25 kPa according to various test conditions. The pressure drop increased with the quality and liquid mass flux which yielded a steeper velocity profile due to the acceleration of flow and interfacial friction. As the operating pressure increased, the pressure drop decreased because the reduction of the density ratio and deceleration of the flow have a milder velocity profile.

4. Conclusions

The air-water test facility named the PEMS was constructed to evaluate the performance of the swirl-vane separator, such as the MCO and the two-phase pressure drop. The PEMS test facility operated at the atmosphere pressure and temperature with the half-scale of the swirl-vane separator. In this study, an experimental method based on the scaling law and the proposed new empirical correlation was scrutinized and proved its applicability by the experimental data. All experiments were carried out under the steady-state condition, and the test conditions were strictly satisfied according to the test requirement within ± 3 % of variation. The MCO was measured at the dryer inlet for 34 cases corresponding to 53–133% of the full load steam generator conditions. Based on the scaling law, the air-water test conditions were derived in terms of the superficial velocities by preserving the quality and two-phase centrifugal force of steam-water test conditions. The isokinetic sampling system, which can independently measure the flow rates of each phase, was developed and applied to quantify the MCO. Overall, the MCO was in range of 0.30–7.05%, which depended on the quality and operating pressure. The measured MCO directly represents the MCO under the prototype condition. For the two-phase pressure drop, a series of single-phase experiments and two-phase experiments was carried out to identify the pressure drop characteristics using the CE and WH test sections. The Eu number of the swirl-vane separator was 6.77, and the empirical correlation was extended by quantifying the swirl-shape factor. The two-phase pressure drop for 36 cases can be scaled up to the prototype conditions using the developed model, and the versatility was evaluated by comparing it to previous research works. The results ranged from 15–25 kPa, and the trends of pressure drop were similar to the steam-water experimental data. The experimental results and new empirical correlation model were found to be applicable and suitable to evaluate the performance of the swirl-vane separator.

Author Contributions

Formal analysis, K.K.; Investigation, W.-S.K. and J.-B.L.; Methodology, K.K.; Project administration, K.K.; Supervision, K.K.; Writing—original draft, K.K.; Writing—review & editing, J.-B.L. and W.-S.K. All authors have read and agreed to the published version of the manuscripts.

Funding

Korea Institute of Energy Technology Evaluation and Planning (KETEP): 20181510102390.

Institutional Review Board Statement

Not applicable.

Informed Consent Statement

Not applicable.

Data Availability Statement

The data presented in this study are available on request from the corresponding author. The data are not publicly available due to design information security.

Acknowledgments

This work was supported by a Korea Institute of Energy Technology Evaluation and Planning (KETEP) grant funded by the Korean government (MOTIE) (20181510102390, Localization of Westinghouse Steam Generator Submerged Separator).

Conflicts of Interest

The authors declare no conflict of interest.

Nomenclature

C.Vcoefficient of variation
D h hydraulic diameter of a moisture separator (m)
EuEuler number
gacceleration due to gravity (m/s2)
Fccentrifugal force per unit volume (N/m3)
Gmass flux (kg/m2 s)
jsuperficial velocity (m/s)
j*non-dimensional superficial velocity
Kloss coefficient
m ˙ ¯ average mass flow rate (kg/s)
Ppressure (kPa)
R e Reynolds number
S f swril-shape factor
tsampling time (sec)
T Time (sec)
xvapor quality
X ¯ A V G averaged value
Greek symbols
α void fraction
ρ density (kg/m3)
ρ h homogeneous density (kg/m3)
σ S T D standard deviation
two-phase pressure drop multiplier
Subscripts
1 single-phase
2 two-phase
aair
CEcombustion engineering type
fliquid phase
ggas phase
iindex of sampling time
LOmeaning of liquid only
mair/water model
MFCmass flow controller
pprototype model
tottotal
Tmeasurement time (s)
wwater
WHwestinghouse type

References

  1. Paik, C.Y.; Mullen, G.; Knoess, C.; Griffith, P. Steam separator modeling for various nuclear reactor transients. Nucl. Eng. Des. 1988, 108, 83–97. [Google Scholar] [CrossRef]
  2. Green, S.J.; Hestroni, G. PWR steam generators. Int. J. Multiph. 1995, 21, 1–97. [Google Scholar] [CrossRef]
  3. Xiong, Z.; Lu, M.; Wang, M.; Gu, H.; Chen, X. Study on flow pattern and separation performance for air-water swirl-van separator. Ann. Nucl. Energy 2014, 63, 138–145. [Google Scholar] [CrossRef]
  4. Funahashi, H.; Hayashi, K.; Hosokawa, S.; Tomiyama, A. Study on two-phase swirling flows in a gas-liquid separator with three pick-off rings. Nucl. Eng. Des. 2016, 308, 205–213. [Google Scholar] [CrossRef]
  5. Liu, S.; Yang, L.L.; Zhang, D.; Xu, J.Y. Separation characteristics of the gas and liquid phases in a vane-type swirling flow field. Int. J. Multiph. Flow 2018, 107, 131–145. [Google Scholar] [CrossRef] [Green Version]
  6. Hoffmann, A.C.; Stein, L.E. Gas Cyclones and Swirl Tubes, 2nd ed.; Springer: New York, NY, USA, 2007. [Google Scholar]
  7. Sun, F.T.; Xiangbo, L.; Ming, X.; Zhongning, S. The investigation on performance of steam generator stationary vane separator. Chin. J. Nucl. Sci. Eng. 1994, 15, 213–219. [Google Scholar]
  8. Liu, L.; Bai, B. Scaling laws for gas–liquid flow in swirl vane separators. Nucl. Eng. Des. 2016, 298, 229–239. [Google Scholar] [CrossRef]
  9. Mauro, G.; Sala, M.; Hetsroni, G. Improved Italian moisture separators (IIMS). Nucl. Eng. Des. 1990, 118, 179–192. [Google Scholar] [CrossRef]
  10. Katono, K.; Ishida, N.; Sumikawa, T.; Yasuda, K. Air-water Downscaled Experiments and Three-dimensional Two-phase Flow Simulations of Improved Steam Separator for Boiling Water Reactor. Nucl. Eng. Des. 2014, 278, 465–471. [Google Scholar] [CrossRef]
  11. Kim, K.; Kim, W.; Lee, J.; Jeon, W. Development and experimental validation for quantifying the moisture carryover in a moisture separator using an air/water test facility. Sci. Technol. Nucl. Install. 2021, 2021, 5522439. [Google Scholar] [CrossRef]
  12. Kim, W.; Lee, J.; Kim, K. Development of empirical correlation of two-phase pressure drop in moisture separator based on separated flow model. Energies 2021, 14, 4448. [Google Scholar] [CrossRef]
  13. Liu, L.; Ying, B.; Gu, H.; Xu, D.; Huang, C.; Chen, S. Experimental study on the separation performance of a full-scale SG steam-water separator. Ann. Nucl. Energy 2020, 141, 1–12. [Google Scholar] [CrossRef]
  14. Kim, K.; Lee, J.; Kim, W.; Choi, H.; Kim, J.I. Development of a prediction model relating the two-phase pressure drop in a moisture separator using an air/water test facility. Nucl. Eng. Technol 2021, in press. [Google Scholar]
  15. Wallis, G.B. One-Dimensional Two-Phase Flow; McGraw-Hill Inc.: New York, NY, USA, 1969. [Google Scholar]
  16. Zeghloul, A.; Azzi, A.; Saidj, F.; Messilem, A.; Azzopardi, B.J. Pressure drop through orifices for single- and two-phase vertically upward flow–implication for metering. J. Fluids Eng. 2017, 139, 031302. [Google Scholar] [CrossRef]
  17. Funahashi, H.; Kirkland, V.; Hayashi, K.; Hosokwa, S.; Tomiyama, A. Interfacial and wall friction factors of swirling annular flow in a vertical pipe. Nucl. Eng. Des. 2018, 330, 97–205. [Google Scholar] [CrossRef]
Figure 1. Schematic view and picture of PEMS test facility adapted from [14].
Energies 14 07072 g001
Figure 2. Schematic diagram of PEMS test facility.
Energies 14 07072 g002
Figure 3. Schematic of the swirl-vane separator ((a) schematic diagram, (b) picture of separator).
Energies 14 07072 g003
Figure 4. Simulation of flow holes on the middle deck ((a) prototype layout, (b) PEMS layout).
Energies 14 07072 g004
Figure 5. Instrumentation of the test section (ISO: isokinetic sampling system).
Energies 14 07072 g005
Figure 6. Conceptual configuration of the isokinetic sampling system.
Energies 14 07072 g006
Figure 7. Moisture carry over at dryer inlet.
Energies 14 07072 g007
Figure 8. Repeatability test results along the quality.
Energies 14 07072 g008
Figure 9. Comparison of the air-water and the scaled up two-phase pressure drop with Maruo’s model and the PEMS.
Energies 14 07072 g009
Figure 10. Comparison of the scaled up two-phase pressure drop along the Re numbers with the steam-water experiments of Liu (solid symbol: PEMS at 5.6 MPa, hollow symbol: Liu’s results adapted from [13] at 6 MPa).
Energies 14 07072 g010
Figure 11. Dependency of the gas superficial velocity on the two-phase pressure drop.
Energies 14 07072 g011
Figure 12. Prediction results of the two-phase pressure drop for the swirl-vane separator.
Energies 14 07072 g012
Table 1. Design Specification of the PEMS test facility.
ParameterOperating Range
Design Pressure0.5 MPa
Design Temperature60
Separator Diameter0.14~0.5 m
Separator Height0.79~3.4
Water mass flow rate0.6 m3/min (ref. 1 atm, head of 57 m)
Air mass flow rate110 m3/min (ref. 1 atm, head of 1.2 kgf/cm2)
Table 2. Scaling ratio between the prototype and the model.
ParameterPrototypePEMS
Operating pressure [MPa]5.6 or 6.60.1 to 0.2
Operating temperature [ ]270.9~281.415~30
Separator diameter ratio [-]11/2
Aspect ratio [-]11/2
Area ratio [-]11/4
Quality [-]11
Centrifugal force [N/m3]11
Table 3. Comparison of the PEMS test condition for the same quality case.
Parameter/Pres. (Prototype)5.5 MPa6.5 MPa
Quality0.3480.3750.3480.375
Centrifugal force [N/m3]15,445.718,000.413,169.715,325.5
j f [m/s] of PEMS0.0530.0530.0490.049
j g [m/s] of PEMS23.526.321.724.3
Table 4. Single-phase test conditions and results.
No.Inlet Pres.
(kPa)
Inlet Temp.
(°C)
ρg
(kg/m3)
ΔPg
(kPa)
jg
(m/s)
Eu
(-)
1103.311.51.2651.67714.26.574
2103.917.81.2432.20716.26.728
3105.118.01.2573.51020.46.722
4106.719.01.2735.14624.56.749
5108.620.61.2887.01928.46.745
6110.923.91.3009.30232.16.929
7113.526.21.32111.86136.06.943
Table 5. Comparison of the two-phase pressure drop between the CE type and the WH type.
CE SeparatorWH Separator Δ P C E Δ P W H
Qualityjg (m/s)ΔP (kPa)Qualityjg (m/s)ΔP (kPa)
0.31423.316.780.31523.46.472.60
0.36424.015.580.36524.06.372.45
0.44025.014.300.44124.96.382.24
0.41923.412.320.42223.55.602.20
0.34622.713.480.34622.85.672.38
0.29721.914.550.29621.85.572.61
0.28821.213.430.28721.35.272.55
0.33521.912.500.33622.05.252.38
0.41022.811.390.41122.85.182.20
0.37520.29.050.37620.24.152.18
0.30519.59.950.30319.64.292.32
0.26018.910.720.26019.04.372.45
0.21715.47.060.21615.43.092.29
Publisher’s Note: MDPI stays neutral with regard to jurisdictional claims in published maps and institutional affiliations.

