
Differential Thermal Evolution between Oil and Source Rocks in the Carboniferous Shale Reservoir of the Qaidam Basin, NW China

Abstract
:1. Introduction
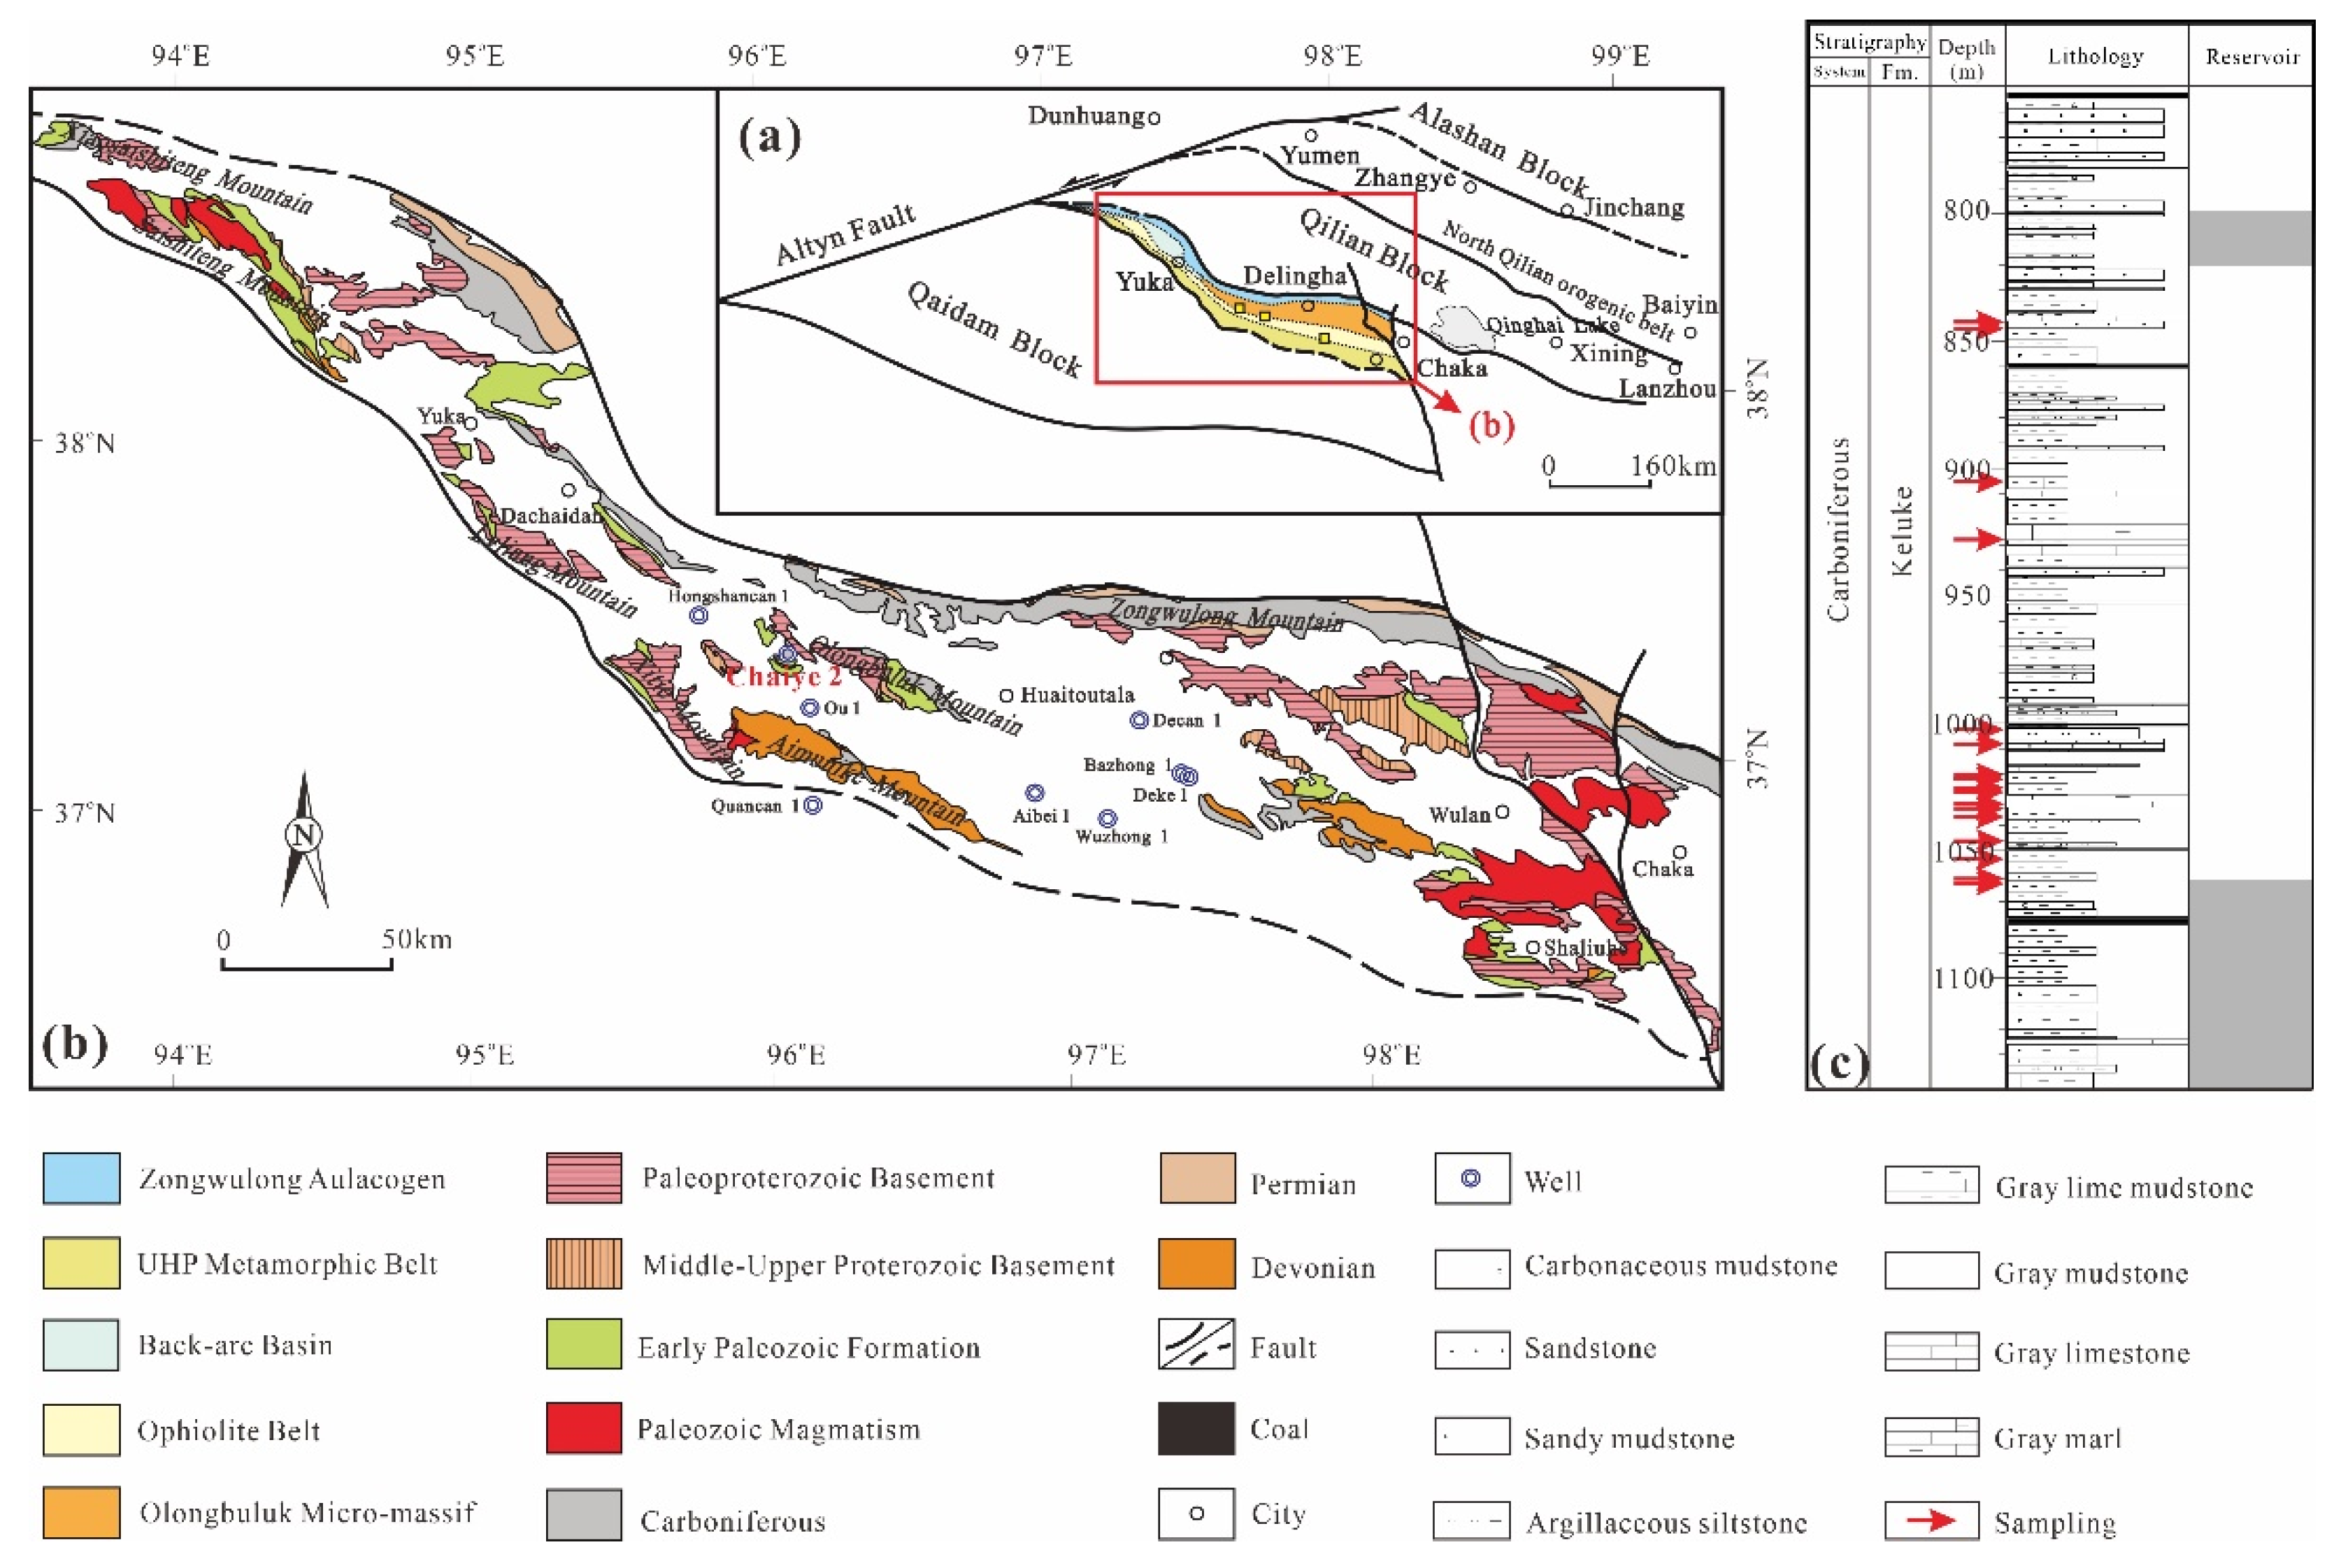
2. Geological Setting
3. Methods
3.1. Vitrinite Reflectance Measurements and Rock-Eval Analyses
3.2. Gas Chromatography–Mass Spectrometry (GC-MS) Analysis
3.3. X-ray Diffraction Mineralogy
4. Results
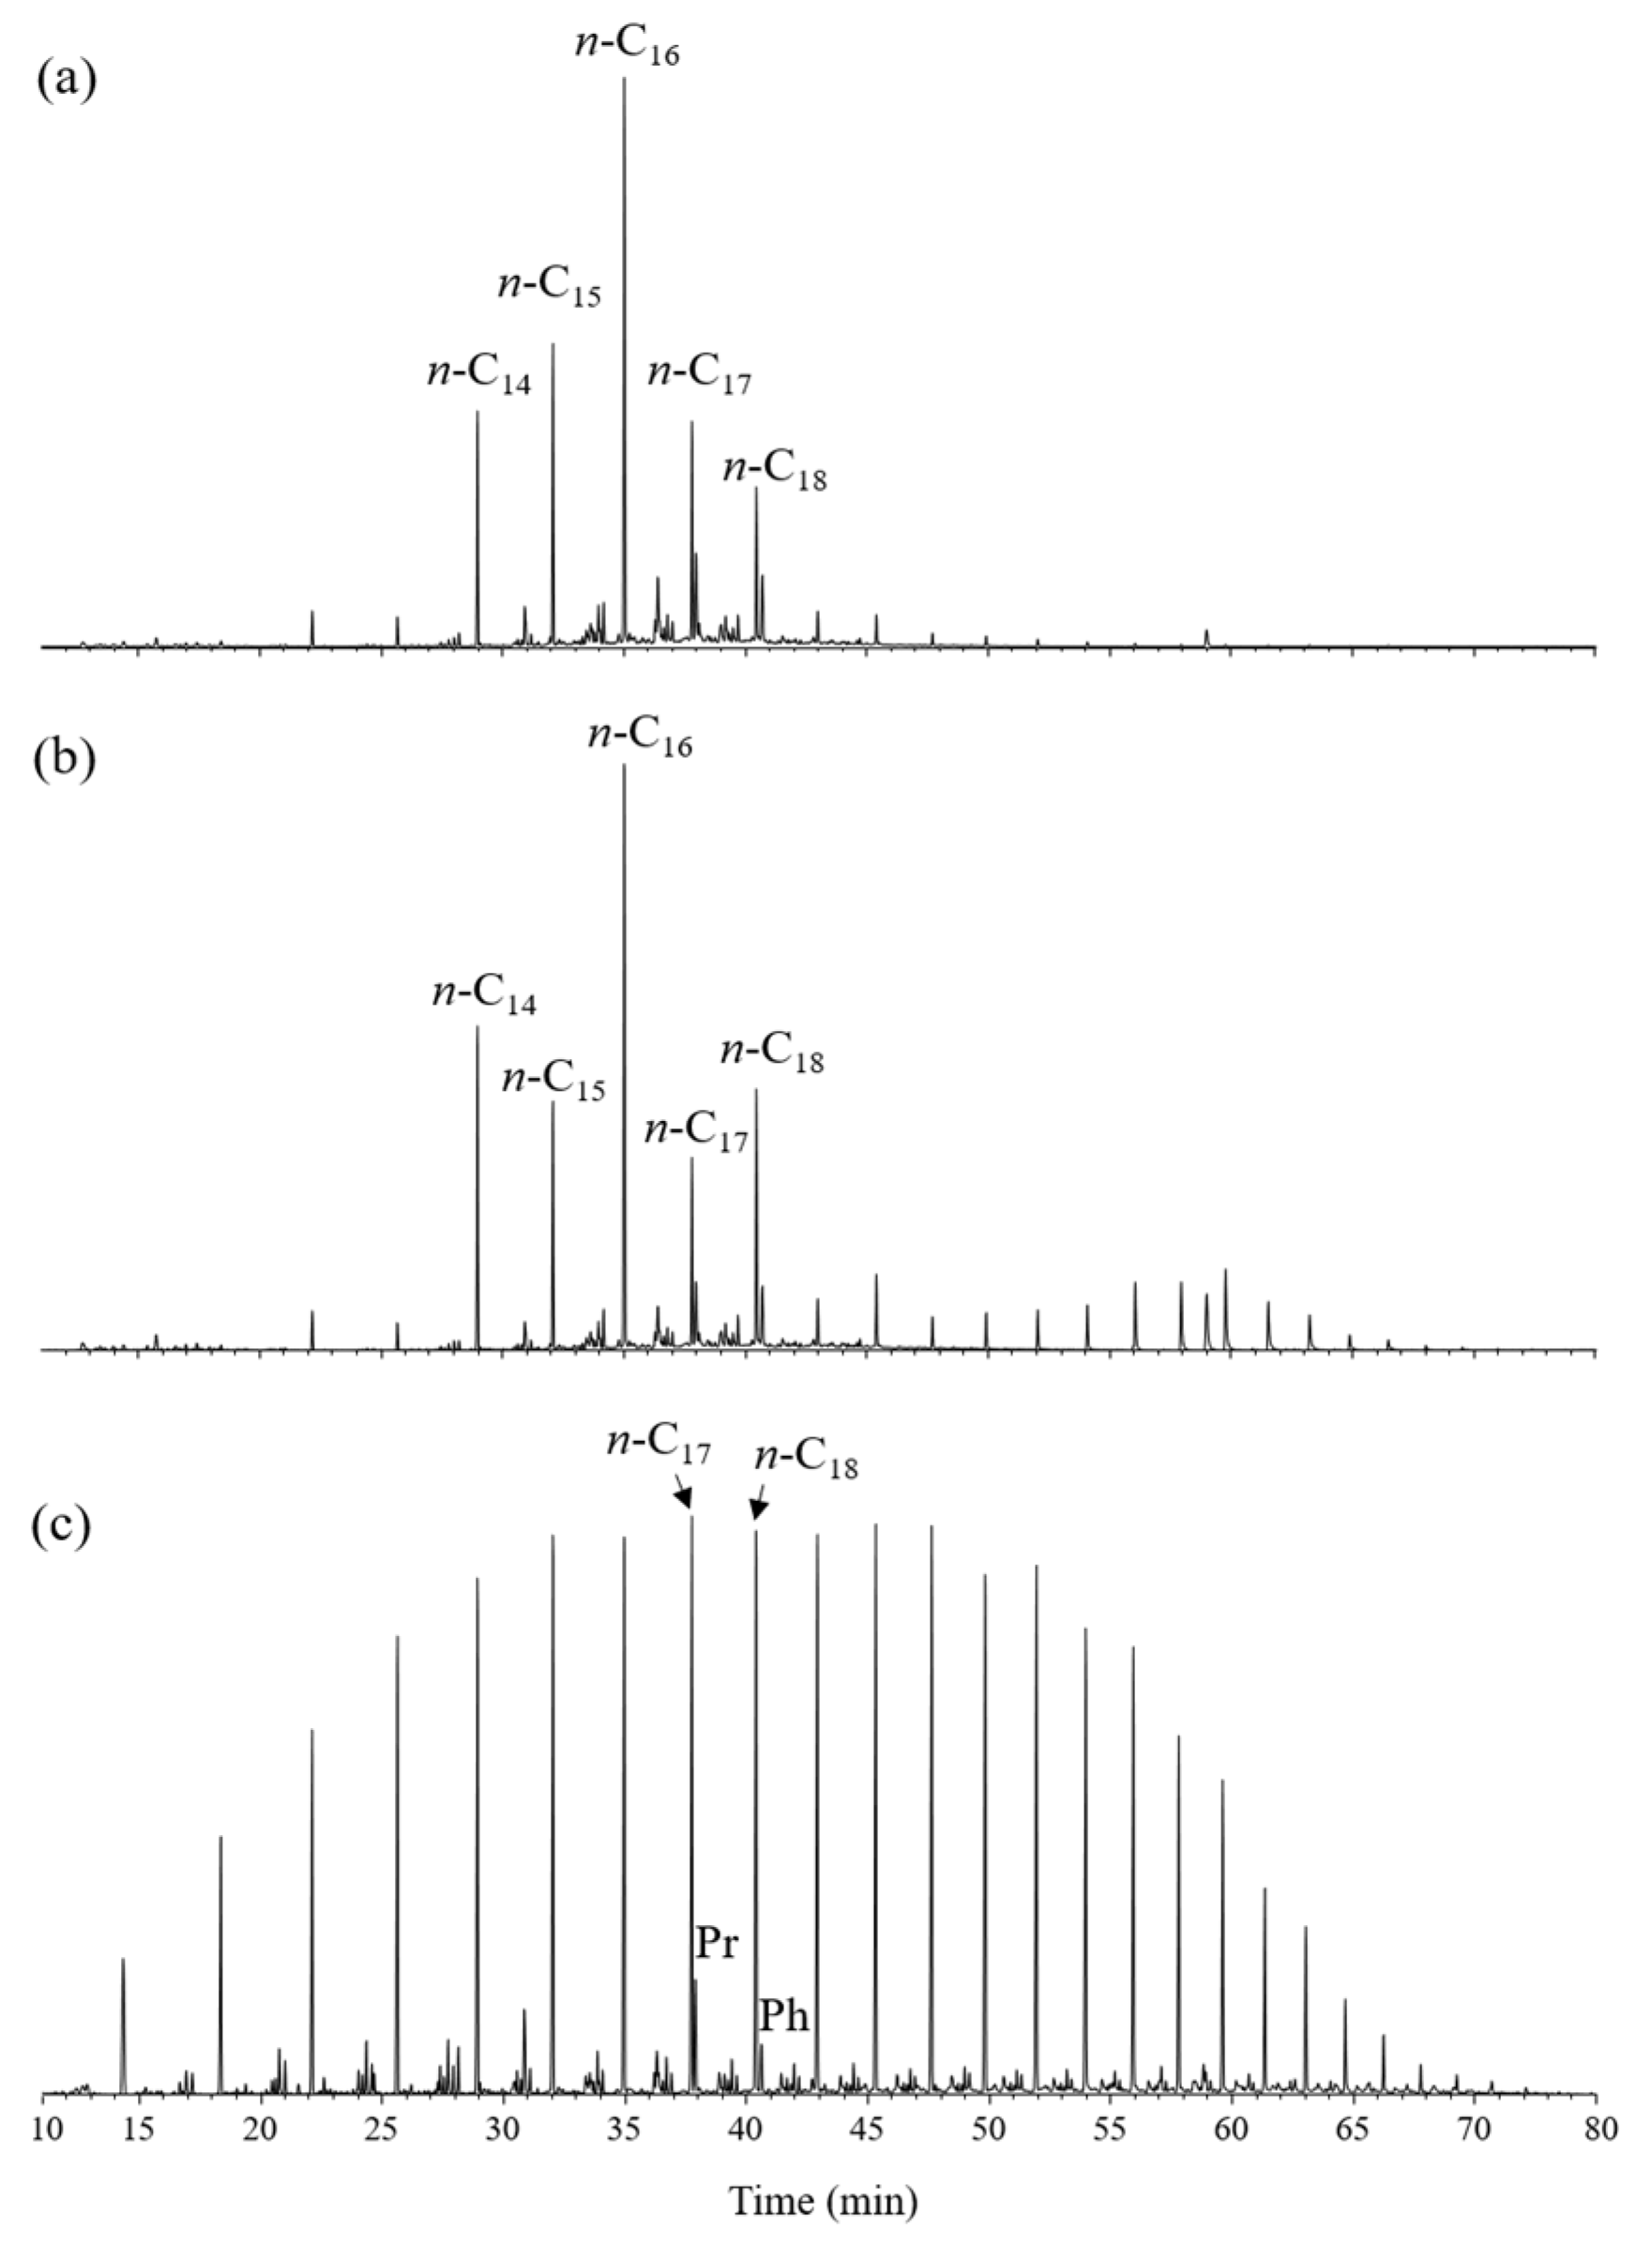
4.1. Bulk Geochemical Characterization
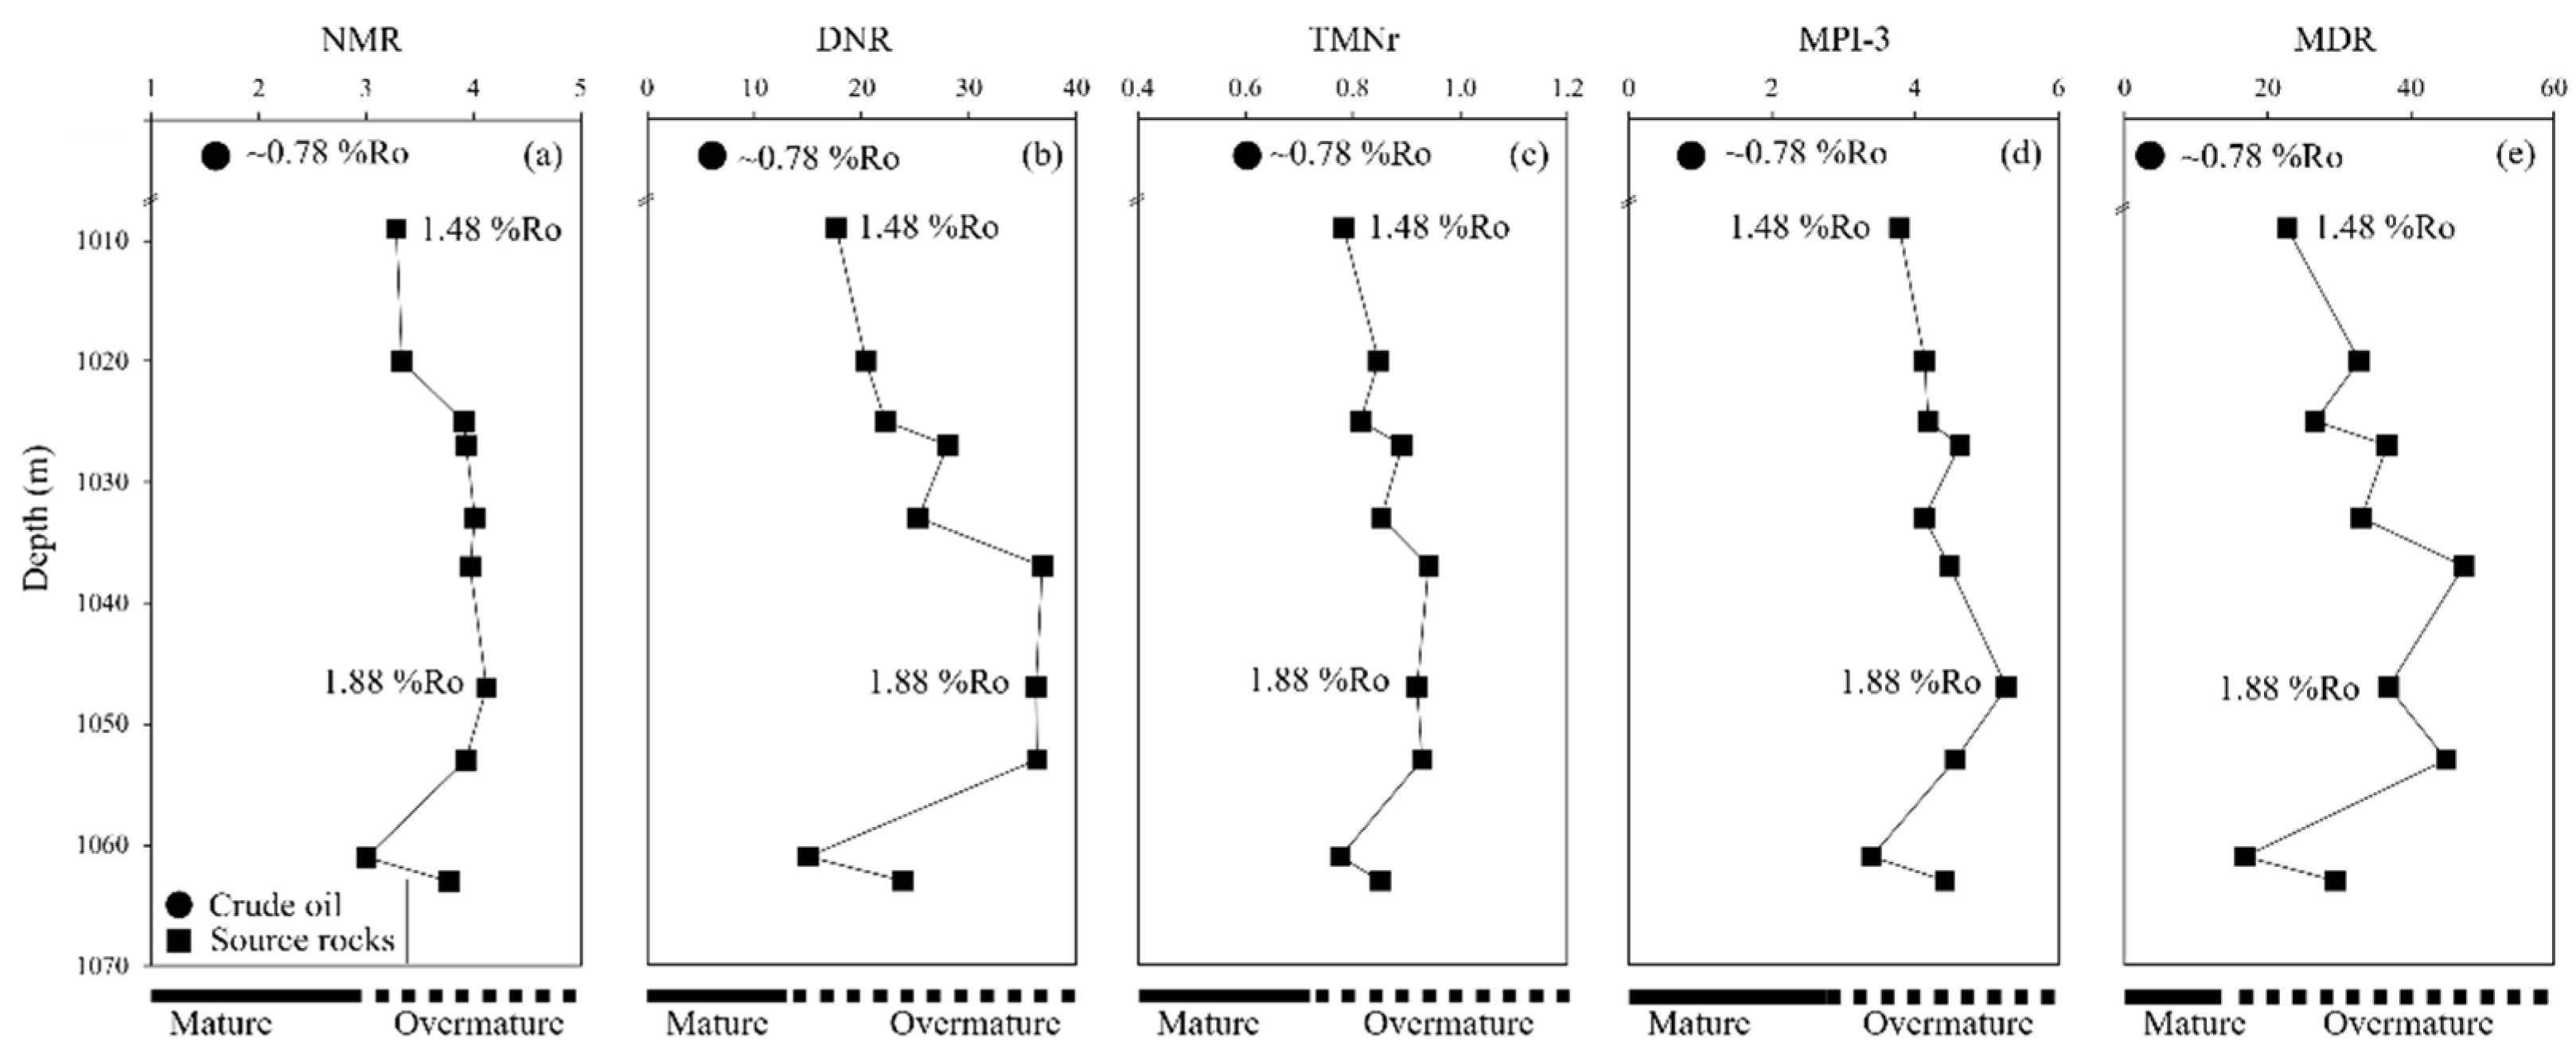
4.2. Geochemical Characterization of Source Rocks
4.3. Geochemical Characterization of Crude Oil
4.4. Mineralogy
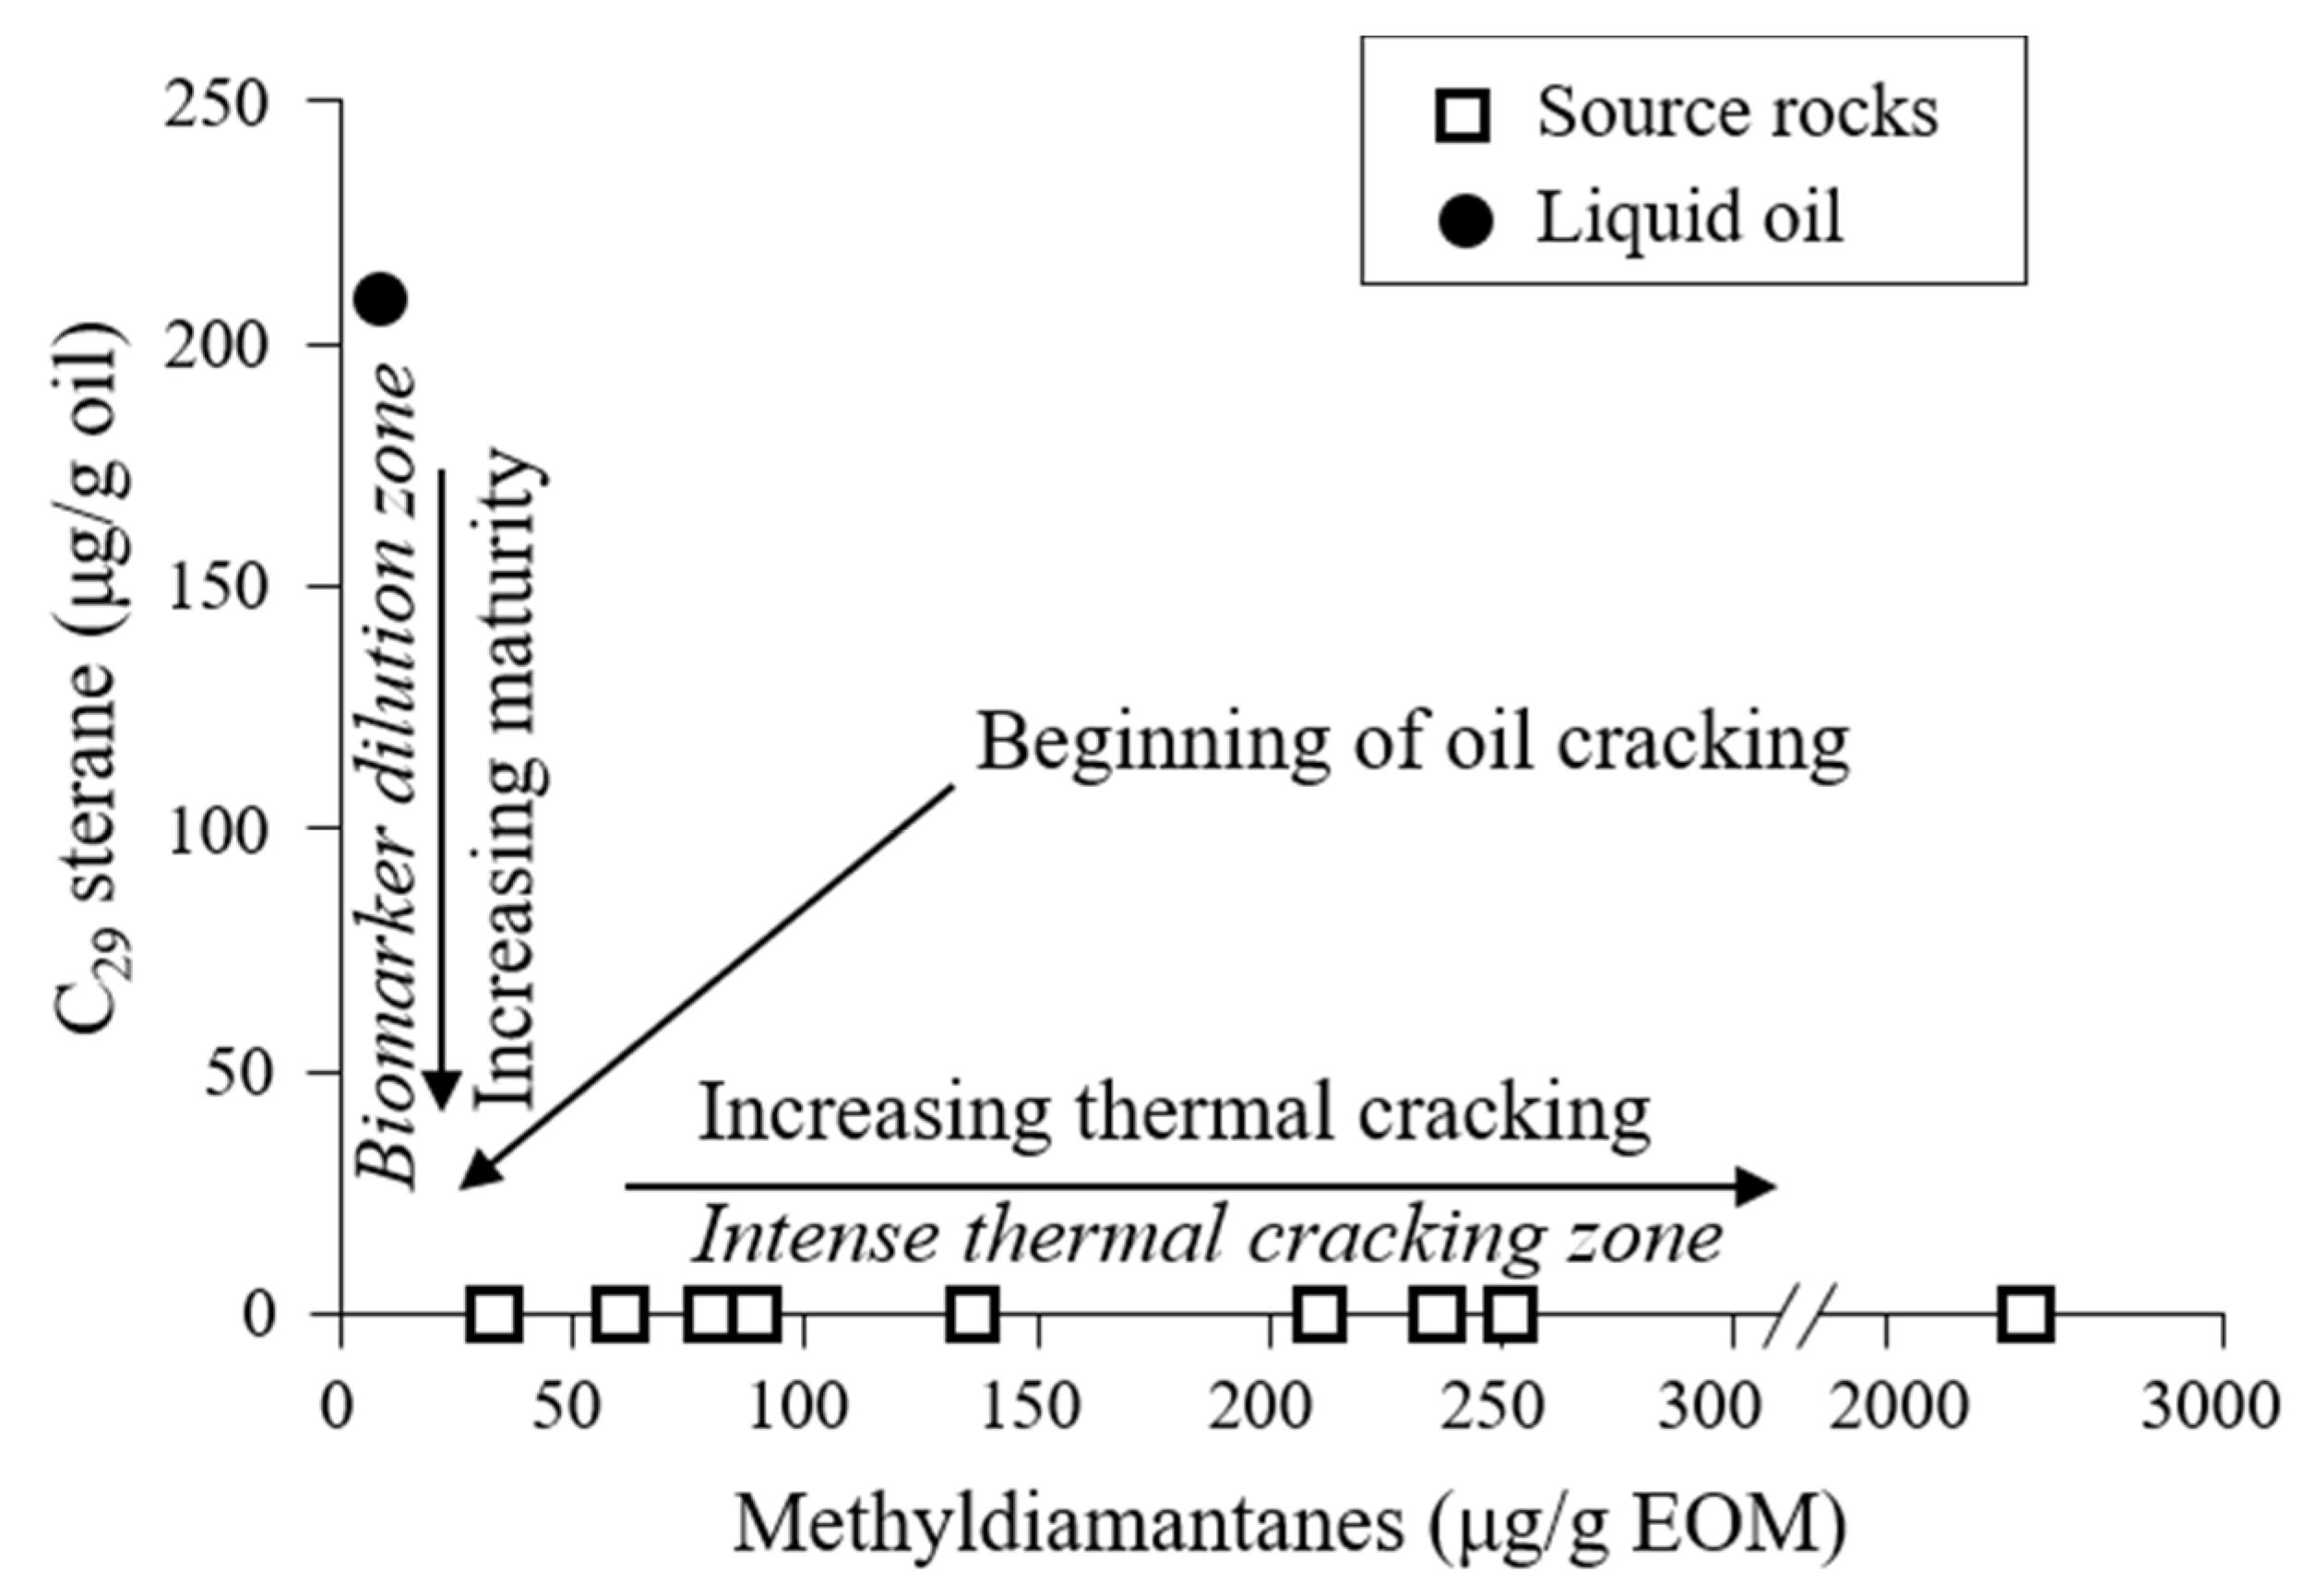
5. Discussion
6. Conclusions
Author Contributions
Funding
Institutional Review Board Statement
Informed Consent Statement
Data Availability Statement
Acknowledgments
Conflicts of Interest
References
- Jin, Q.; Zha, M.; Zhen, L.; Gao, X.; Peng, D.; Lin, L. Geology and geochemistry of source rocks in the Qaidam Basin, NW China. J. Pet. Geol. 2002, 25, 219–238. [Google Scholar] [CrossRef]
- Shao, L.; Li, M.; Li, Y.; Zhang, Y.; Lu, J.; Zhang, W.; Tian, Z.; Wen, H. Geological characeristics and controlling factors of shale gas in the Jurassic of the northern Qaidam Basin. Earth Sci. Front. 2014, 21, 311–322. [Google Scholar] [CrossRef]
- Zhang, B.; He, Y.; Chen, Y.; Meng, Q.; Yuan, L. Geochemical charateristics and oil accumulation sigificance of the high quality saline lacustrine source rocks in the western Qaidam Basin, NW China. Acta Pet. Sin. 2017, 38, 1158–1167. [Google Scholar] [CrossRef]
- Fu, S.; Ma, D.; Chen, Y.; Zhang, G.; Wu, K. New advance of petroleum and gas exploration in Qaidam Basin. Acta Pet. Sin. 2016, 37, 1–10. [Google Scholar] [CrossRef]
- Wang, W.; Liu, W.; Wang, G.; Wang, C. Biodegradation of depositional organic matter and identification of biogenic gas source rocks: An example from the Sanhu depression of Qaidam Basin. Shiyou Xuebao/Acta Pet. Sin. 2016, 37, 318–327. [Google Scholar] [CrossRef]
- Cao, J.; Liu, C.; Ma, Y.; Li, Z.; Yang, Y.; Wang, G.; Peng, B.; Zhang, X.; Dun, C. Geochemical characteristics and genesis of shale gas for Carboniferous marine-continental transitional facies coal measure strata in Eastern Qaidam Basin. Earth Sci. Front. 2016, 23, 158–166. [Google Scholar] [CrossRef]
- Liu, C.; Ma, Y.; Zhou, G.; Yin, C.; Du, J.; Gong, W.; Fan, T.; Liu, W.; Xu, Y.; Zhang, Q. Evidence for the Carboniferous hydrocarbon generation in Qaidam Basin. Acta Pet. Sin. 2012, 33, 925–931. [Google Scholar]
- Xu, Y.H.; Lu, M.; Wen, Z.G. Discovery of carboniferous oil seepage in qaidam basin and its geological significance. Pet. Sci. Technol. 2014, 32, 1704–1712. [Google Scholar] [CrossRef]
- Li, Z.; Peng, B.; Ma, Y.; Hu, J.; Wei, X.; Ma, L.; Fang, X.; Yang, Y.; Liu, K. Progress of Carboniferous oil and gas survey in Qaidam Basin. Geol. Surv. China 2019, 6, 79–87. [Google Scholar] [CrossRef]
- Wang, L.; Zongxing, L.I.; Liu, C.; Peng, B.; Fang, X.; Yuan, G. Thermal History since the Paleozoic in the Eastern Qaidam Basin, Northwest China. Acta Geol. Sin. 2019, 93, 297–306. [Google Scholar] [CrossRef]
- Li, Z.; Qiu, N.; Ma, Y.; Guo, Y.; Xiao, Y.; Zhao, W. The tectono-thermal evolution in the eastern Qaidam Basin, Northwest China since the Paleozoic. Earth Sci. Front. 2017, 24, 157–167. [Google Scholar] [CrossRef]
- Gao, J.; Li, Z. Water saturation-driven evolution of helium permeability in Carboniferous shale from Qaidam Basin, China: An experimental study. Mar. Pet. Geol. 2018, 96, 371–390. [Google Scholar] [CrossRef]
- Ma, Y.; Yin, C.; Liu, C.; Du, J.; Cheng, H.; Fan, T. The progress of Carboniferous oil and gas investigation and assessment in Qaidam Basin. Diqiu Xuebao (Acta Geosci. Sin.) 2012, 33, 135–144. [Google Scholar]
- Li, Z.; Huang, H.; He, C.; Fang, X. Maturation impact on polyaromatic hydrocarbons and organosulfur compounds in the Carboniferous Keluke Formation from Qaidam Basin, NW China. Energy Fuels 2019, 33, 4115–4129. [Google Scholar] [CrossRef]
- Lafargue, E.; Marquis, F.; Pillot, D. Rock-Eval 6 applications in hydrocarbon exploration, production, and soil contamination studies. Rev. Inst. Fr. Pet. 1998, 53, 421–437. [Google Scholar] [CrossRef] [Green Version]
- Wang, Q.; Huang, H. Perylene preservation in an oxidizing paleoenvironment and its limitation as a redox proxy. Palaeogeogr. Palaeoclimatol. Palaeoecol. 2021, 562, 110104. [Google Scholar] [CrossRef]
- Peters, K.E.; Walters, C.C.; Moldowan, J.M. Biomarkers and Isotopes in Petroleum Exploration and Earth History. In The Biomarker Guide; Cambridge University Press: Cambridge, UK, 2005; Volume 2, ISBN 0 521 83763 4. [Google Scholar]
- Wang, Q.; Huang, H.; Li, Z. Mixing scenario of a vagarious oil in the Dongying Depression, Bohai Bay Basin. Fuel 2021, 294, 120589. [Google Scholar] [CrossRef]
- Wang, Q.; Huang, H.; Zheng, L. Thermal maturity parameters derived from tetra-, penta-substituted naphthalenes and organosulfur compounds in highly mature sediments. Fuel 2021, 288, 119626. [Google Scholar] [CrossRef]
- Radke, M.; Welte, D.H.; Willsch, H. Geochemical study on a well in the Western Canada Basin: Relation of the aromatic distribution pattern to maturity of organic matter. Geochim. Cosmochim. Acta 1982, 46, 1–10. [Google Scholar] [CrossRef]
- Alexander, R.; Kagi, R.I.; Rowland, S.J.; Sheppard, P.N.; Chirila, T.V. The effects of thermal maturity on distributions of dimethylnaphthalenes and trimethylnaphthalenes in some Ancient sediments and petroleums. Geochim. Cosmochim. Acta 1985, 49, 385–395. [Google Scholar] [CrossRef]
- Van Aarssen, B.G.K.; Bastow, T.P.; Alexander, R.; Kagi, R.I. Distributions of methylated naphthalenes in crude oils: Indicators of maturity, biodegradation and mixing. Org. Geochem. 1999, 30, 1213–1227. [Google Scholar] [CrossRef]
- Radke, M.; Welte, D.H. The methylphenanthrene index (MPI): A maturity parameter based on aromatic hydrocarbons. Adv. Org. Geochem. 1981, 1983, 504–512. [Google Scholar]
- He, C.; Huang, H.; Wang, Q.; Li, Z. Correlation of maturity parameters derived from methylphenanthrenes and methyldibenzothiophenes in the Carboniferous source rocks from Qaidam Basin, NW China. Geofluids 2019, 2019, 5742902. [Google Scholar] [CrossRef]
- Szczerba, M.; Rospondek, M.J. Controls on distributions of methylphenanthrenes in sedimentary rock extracts: Critical evaluation of existing geochemical data from molecular modelling. Org. Geochem. 2010, 41, 1297–1311. [Google Scholar] [CrossRef]
- Radke, M.; Welte, D.H.; Willsch, H. Maturity parameters based on aromatic hydrocarbons: Influence of the organic matter type. Org. Geochem. 1986, 10, 51–63. [Google Scholar] [CrossRef]
- Van Graas, G.W. Biomarker maturity parameters for high maturities: Calibration of the working range up to the oil/condensate threshold. Org. Geochem. 1990, 16, 1025–1032. [Google Scholar] [CrossRef]
- Wilhelms, A.; Larter, S. Shaken but not always stirred. Impact of petroleum charge mixing on reservoir geochemistry. Geol. Soc. Spec. Publ. 2004, 237, 27–35. [Google Scholar] [CrossRef]
- Mackenzie, A.S.; Maxwell, J.R. Assessment of thermal maturation in sedimentary rocks by molecular measurements. Org. Matur. Stud. Foss. Fuel Explor. 1981, 239–254. Available online: https://pascal-francis.inist.fr/vibad/index.php?action=getRecordDetail&idt=PASCALGEODEBRGM8220126224 (accessed on 20 September 2021).
- Mackenzie, A.S.; Patience, R.L.; Maxwell, J.R.; Vandenbroucke, M.; Durand, B. Molecular parameters of maturation in the Toarcian shales, Paris Basin, France—I. Changes in the configurations of acyclic isoprenoid alkanes, steranes and triterpanes. Geochim. Cosmochim. Acta 1980, 44, 1709–1721. [Google Scholar] [CrossRef]
- Seifert, W.K.; Moldowan, J.M. The effect of thermal stress on source-rock quality as measured by hopane stereochemistry. Phys. Chem. Earth 1980, 12, 229–237. [Google Scholar] [CrossRef]
- Chen, J.; Fu, J.; Sheng, G.; Liu, D.; Zhang, J. Diamondoid hydrocarbon ratios: Novel maturity indices for highly mature crude oils. Org. Geochem. 1996, 25, 179–190. [Google Scholar] [CrossRef]
- Dahl, J.E.; Moldowan, J.M.; Peters, K.E.; Claypool, G.E.; Rooney, M.A.; Michael, G.E.; Mello, M.R.; Kohnen, M.L. Diamondoid hydrocarbons as indicators of natural oil cracking. Nature 1999, 399, 54–57. [Google Scholar] [CrossRef]
- Pepper, A.S.; Dodd, T.A. Simple kinetic models of petroleum formation. Part II: Oil-gas cracking. Mar. Pet. Geol. 1995, 12, 321–340. [Google Scholar] [CrossRef]
- Wang, L.; Li, Z.; Liu, C.; Peng, B.; Hu, J.; Peng, X.; Liu, L. The carboniferous source rock maturity evolution in the delingha depression in the Qaidam Basin, northwest China. J. Geomech. 2019, 25, 370–381. [Google Scholar] [CrossRef]
- Takach, N.E.; Barker, C.; Kemp, M.K. Stability of natural gas in the deep subsurface: Thermodynamic calculation of equilibrium compositions. Am. Assoc. Pet. Geol. Bull. 1987, 71, 322–333. [Google Scholar] [CrossRef]
- Hill, R.J.; Tang, Y.; Kaplan, I.R. Insights into oil cracking based on laboratory experiments. Org. Geochem. 2003, 34, 1651–1672. [Google Scholar] [CrossRef]
- Domine, F. Kinetics of Hexane Pyrolysis at Very High Pressures. 1. Experimental Study. Energy Fuels 1989, 3, 89–96. [Google Scholar] [CrossRef]
- Dominé, F. High pressure pyrolysis of n-hexane, 2,4-dimethylpentane and 1-phenylbutane. Is pressure an important geochemical parameter? Org. Geochem. 1991, 17, 619–634. [Google Scholar] [CrossRef]
- Dominé, F.; Marquaire, P.M.; Muller, C.; Côme, G.M. Kinetics of Hexane Pyrolysis at Very High Pressures. 2. Computer Modeling. Energy Fuels 1990, 4, 2–10. [Google Scholar] [CrossRef]
- Dominé, F.; Dessort, D.; Brévart, O. Towards a new method of geochemical kinetic modelling: Implications for the stability of crude oils. Org. Geochem. 1998, 28, 597–612. [Google Scholar] [CrossRef]
- Dominé, F.; Enguehard, F. Kinetics of hexane pyrolysis at very high pressures-3. Application to geochemical modeling. Org. Geochem. 1992, 18, 41–49. [Google Scholar] [CrossRef]
- Mango, F.D. The origin of light cycloalkanes in petroleum. Geochim. Cosmochim. Acta 1990, 54, 23–27. [Google Scholar] [CrossRef]
- Price, L.C.; Clayton, J.L.; Rumen, L.L. Organic geochemistry of the 9.6 km Bertha Rogers No. 1. well, Oklahoma. Org. Geochem. 1981, 3, 59–77. [Google Scholar] [CrossRef]
- Price, L.C. Origins, characteristics, controls, and economic viabilities of deep-basin gas resources. Chem. Geol. 1995, 126, 335–349. [Google Scholar] [CrossRef]
- Schenk, H.J.; di Primio, R.; Horsfield, B. The conversion of oil into gas in petroleum reservoirs. Part 1: Comparative kinetic investigation of gas generation from crude oils of lacustrine, marine and fluviodeltaic origin by programmed-temperature closed-system pyrolysis. Org. Geochem. 1997, 26, 467–481. [Google Scholar] [CrossRef]
- Stevens, N.P.; Bray, E.E.; Evans, E.D. Hydrocarbons in sediments of Gulf of Mexico. Am. Assoc. Pet. Geol. Bull. 1956, 40, 975–983. [Google Scholar] [CrossRef]
- Bray, E.E.; Evans, E.D. Distribution of n-paraffins as a clue to recognition of source beds. Geochim. Cosmochim. Acta 1961, 22, 2–15. [Google Scholar] [CrossRef]
- Cooper, J.E. Fatty acids in recent and ancient sediments and petroleum reservoir waters. Nature 1962, 193, 744–746. [Google Scholar] [CrossRef]
- Pusey, W.C. Paleotemperatures in the Gulf Coast Using the Esr-Kerogen Method. Gcags Trans. 1973, 23, 195–202. [Google Scholar]
- Grim, R.E. Relation of clay mineralogy to origin and recovery of petroleum. Am. Assoc. Pet. Geol. Bull. 1947, 31. [Google Scholar] [CrossRef]
- Galwey, A.K. Reactions of alcohols and of hydrocarbons on montmorillonite surfaces. J. Catal. 1970, 19, 330–342. [Google Scholar] [CrossRef]
- Galwey, A.K. The rate of hydrocarbon desorption from mineral surfaces and the contribution of heterogeneous catalytic-type processes to petroleum genesis. Geochim. Cosmochim. Acta 1972, 36, 1115–1130. [Google Scholar] [CrossRef]
- Brooks, B.T. Evidence of Catalytic Action in Petroleum Formation. Ind. Eng. Chem. 1952, 44, 2570–2577. [Google Scholar] [CrossRef]
- Henderson, W.; Eglinton, G.; Simmonds, P.; Lovelock, J.E. Thermal alteration as a contributory process to the genesis of petroleum. Nature 1968, 219, 1012–1016. [Google Scholar] [CrossRef]
- Greensfelder, B.S.; Voge, H.H.; Good, G.M. Catalytic and Thermal Cracking of Pure Hydrocarbons: Mechanisms of Reaction. Ind. Eng. Chem. 1949, 41, 2573–2584. [Google Scholar] [CrossRef]
- Thomas, C.L. Chemistry of Cracking Catalysts. Ind. Eng. Chem. 1949, 41, 2564–2573. [Google Scholar] [CrossRef]
- Solomon, D.H.; Rosser, M.J. Reactions catalyzed by minerals. Part I. Polymerization of styrene. J. Appl. Polym. Sci. 1965, 9, 1261–1271. [Google Scholar] [CrossRef]
- Solomon, D.H. Clay minerals as electron acceptors and/or electron donors in organic reactions. Clays Clay Miner. 1968, 16, 31–39. [Google Scholar] [CrossRef]
- Theng, B.K.G. Mechanisms of formation of colored clay-organic complexes. A review. Clays Clay Miner. 1971, 19, 383–390. [Google Scholar] [CrossRef]
- Johns, W.D. Clay mineral catalysis and petroleum generation. Annu. Rev. Earth Planet. Sci. 1979, 7, 183–198. [Google Scholar] [CrossRef]
- Connan, J. Time-Temperature Relation in Oil Genesis. Am. Assoc. Pet. Geol. Bull. 1974, 56, 2068–2071. [Google Scholar]


| Depth (m) | Total Rock (%) | Organic Composition (%) | Kerogen Type | |||||
|---|---|---|---|---|---|---|---|---|
| Total OM | Pyrite | Other Minerals | Sapropelic OM | Liptinite | Vitrinite | Inertinite | ||
| 1009 | 3.3 | 4.7 | 92.0 | 0.0 | 0.0 | 72.7 | 27.3 | III |
| 1020 | 2.6 | 2.9 | 94.5 | 0.0 | 0.0 | 38.5 | 61.5 | III |
| 1027 | 4.9 | 3.3 | 91.8 | 0.0 | 0.0 | 53.1 | 46.9 | III |
| 1033 | 3.6 | 2.6 | 93.8 | 0.0 | 0.0 | 52.8 | 47.2 | III |
| 1053 | 3.2 | 2.1 | 94.7 | 0.0 | 0.0 | 43.8 | 56.3 | III |
| Depth (m) | TOC (wt%) | Tmax (°C) | HI (mg/g) | OI (mg/g) | EOM (mg/g Rock) |
|---|---|---|---|---|---|
| 1009 | 1.58 | 490 | 30 | 6 | 0.25 |
| 1020 | 1.8 | 486 | 39 | 8 | 0.28 |
| 1025 | 1.32 | 490 | 33 | 9 | 0.18 |
| 1027 | 3.28 | 492 | 34 | 5 | 0.21 |
| 1033 | 2.86 | 488 | 27 | 5 | 0.41 |
| 1037 | 31.8 | 493 | 9 | 0 | 0.56 |
| 1047 | 7.18 | 497 | 51 | 3 | 0.79 |
| 1053 | 22.4 | 500 | 101 | 1 | 0.61 |
| 1061 | 8.61 | 497 | 51 | 2 | 0.16 |
| 1063 | 2.13 | 502 | 43 | 10 | 0.25 |
| Depth (m) | %Ro | Valid Measured Points | Standard Deviation (%) | ||
|---|---|---|---|---|---|
| Minimum | Maximum | Mean | |||
| 1009 | 1.10 | 1.71 | 1.48 | 35 | 0.139 |
| 1020 | 1.35 | 1.63 | 1.48 | 21 | 0.100 |
| 1027 | 1.29 | 1.67 | 1.45 | 27 | 0.112 |
| 1033 | 1.50 | 2.18 | 1.88 | 44 | 0.167 |
| 1053 | 1.41 | 2.07 | 1.76 | 52 | 0.174 |
| Sample | Depth (m) | ∑n-C20-/∑n-C21+ | Pr/Ph | Pr/n-C17 | Ph/n-C18 | Ts/(Ts + Tm) | 20S/(20S + 20R) | 22S/(22S + 22R) | Ββ (αα + ββ) | MNR | DNR | TMNr | MPI-3 | MDR | MAI |
|---|---|---|---|---|---|---|---|---|---|---|---|---|---|---|---|
| Oil | 800–820 | 1.35 | 2.19 | 0.23 | 0.11 | 0.75 | 0.44 | 0.57 | 0.44 | 1.6 | 6.08 | 0.6 | 0.87 | 3.65 | 53 |
| R1 | 1009 | 27.3 | 1.29 | 0.58 | 0.64 | n/a | n/a | n/a | n/a | 3.28 | 17.6 | 0.78 | 3.78 | 22.7 | 74.4 |
| R2 | 1020 | 11.1 | 1.04 | 0.48 | 0.49 | n/a | n/a | n/a | n/a | 3.34 | 20.4 | 0.85 | 4.13 | 32.8 | 77.7 |
| R3 | 1025 | 15.8 | 1.01 | 0.46 | 0.34 | n/a | n/a | n/a | n/a | 3.91 | 22.2 | 0.81 | 4.18 | 26.6 | 72.6 |
| R4 | 1027 | 16.8 | 1.11 | 0.52 | 0.53 | n/a | n/a | n/a | n/a | 3.93 | 28 | 0.89 | 4.62 | 36.7 | 73.3 |
| R5 | 1033 | 2.6 | 1.02 | 0.5 | 0.35 | n/a | n/a | n/a | n/a | 4.01 | 25.3 | 0.85 | 4.13 | 33.1 | 59.4 |
| R6 | 1037 | 4.5 | 1.16 | 0.46 | 0.49 | n/a | n/a | n/a | n/a | 3.97 | 36.8 | 0.94 | 4.48 | 47.4 | 63.7 |
| R7 | 1047 | 5.24 | 0.92 | 0.44 | 0.38 | n/a | n/a | n/a | n/a | 4.12 | 36.2 | 0.92 | 5.28 | 36.9 | 63.5 |
| R8 | 1053 | 22.5 | 1.29 | 0.43 | 0.43 | n/a | n/a | n/a | n/a | 3.93 | 36.4 | 0.93 | 4.56 | 44.9 | 61.9 |
| R9 | 1061 | 8.25 | 1.24 | 0.48 | 0.45 | n/a | n/a | n/a | n/a | 3 | 15 | 0.78 | 3.39 | 16.8 | 78.2 |
| R10 | 1063 | 8.34 | 0.89 | 0.42 | 0.43 | n/a | n/a | n/a | n/a | 3.77 | 23.8 | 0.85 | 4.42 | 29.4 | 74.9 |
| Depth (m) | Mineral (wt.%) | |||||||||
|---|---|---|---|---|---|---|---|---|---|---|
| Quartz | Potassium Feldspar | Plagioclase Feldspar | Calcite | Siderite | Pyrite | Hematite | Anatase | Ankerite | Clay Minerals | |
| 842.25 | 1.3 | n.d. | n.d. | 95.9 | n.d. | n.d. | 2.8 | n.d. | n.d. | n.d. |
| 844.75 | 50.8 | n.d. | 3.9 | 1.9 | n.d. | 4.4 | n.d. | n.d. | n.d. | 39.0 |
| 905.31 | 52.1 | n.d. | 2.0 | 3.2 | 2.4 | n.d. | n.d. | 2.0 | n.d. | 38.3 |
| 927.65 | 47.6 | n.d. | 1.2 | 19.3 | n.d. | n.d. | n.d. | n.d. | 11.3 | 20.6 |
| 1002.5 | 55.9 | n.d. | 1.2 | 1.9 | 4.9 | n.d. | n.d. | 1.7 | n.d. | 34.4 |
| 1021.7 | 50.1 | 1.3 | 5.6 | 1.3 | 4.0 | 2.1 | n.d. | n.d. | n.d. | 35.6 |
| 1031.7 | 1.5 | n.d. | n.d. | 91.8 | n.d. | n.d. | n.d. | n.d. | 6.7 | n.d. |
| Depth (m) | Clay Mineral (wt.%) | Montmorillonite Clay (wt.%) | ||||
|---|---|---|---|---|---|---|
| Smectite | I/S | Illite | Kaolinite | Chlorite | I/S | |
| 844.75 | n.d. | 41 | 18 | 41 | n.d. | 30 |
| 927.65 | n.d. | 57 | 27 | 16 | n.d. | 30 |
| 905.31 | n.d. | 73 | 15 | 12 | n.d. | 20 |
| 1002.5 | n.d. | 61 | 33 | 6 | n.d. | 15 |
| 1021.7 | n.d. | 56 | 19 | 25 | n.d. | 25 |
Publisher’s Note: MDPI stays neutral with regard to jurisdictional claims in published maps and institutional affiliations. |
© 2021 by the authors. Licensee MDPI, Basel, Switzerland. This article is an open access article distributed under the terms and conditions of the Creative Commons Attribution (CC BY) license (https://creativecommons.org/licenses/by/4.0/).
Share and Cite
Wang, Q.; Huang, H.; He, C.; Li, Z. Differential Thermal Evolution between Oil and Source Rocks in the Carboniferous Shale Reservoir of the Qaidam Basin, NW China. Energies 2021, 14, 7088. https://doi.org/10.3390/en14217088
Wang Q, Huang H, He C, Li Z. Differential Thermal Evolution between Oil and Source Rocks in the Carboniferous Shale Reservoir of the Qaidam Basin, NW China. Energies. 2021; 14(21):7088. https://doi.org/10.3390/en14217088
Chicago/Turabian StyleWang, Qianru, Haiping Huang, Chuan He, and Zongxing Li. 2021. "Differential Thermal Evolution between Oil and Source Rocks in the Carboniferous Shale Reservoir of the Qaidam Basin, NW China" Energies 14, no. 21: 7088. https://doi.org/10.3390/en14217088
APA StyleWang, Q., Huang, H., He, C., & Li, Z. (2021). Differential Thermal Evolution between Oil and Source Rocks in the Carboniferous Shale Reservoir of the Qaidam Basin, NW China. Energies, 14(21), 7088. https://doi.org/10.3390/en14217088