
Investigation of R290 Flow Boiling Heat Transfer and Exergy Loss in a Double-Concentric Pipe Based on CFD


Abstract
:1. Introduction
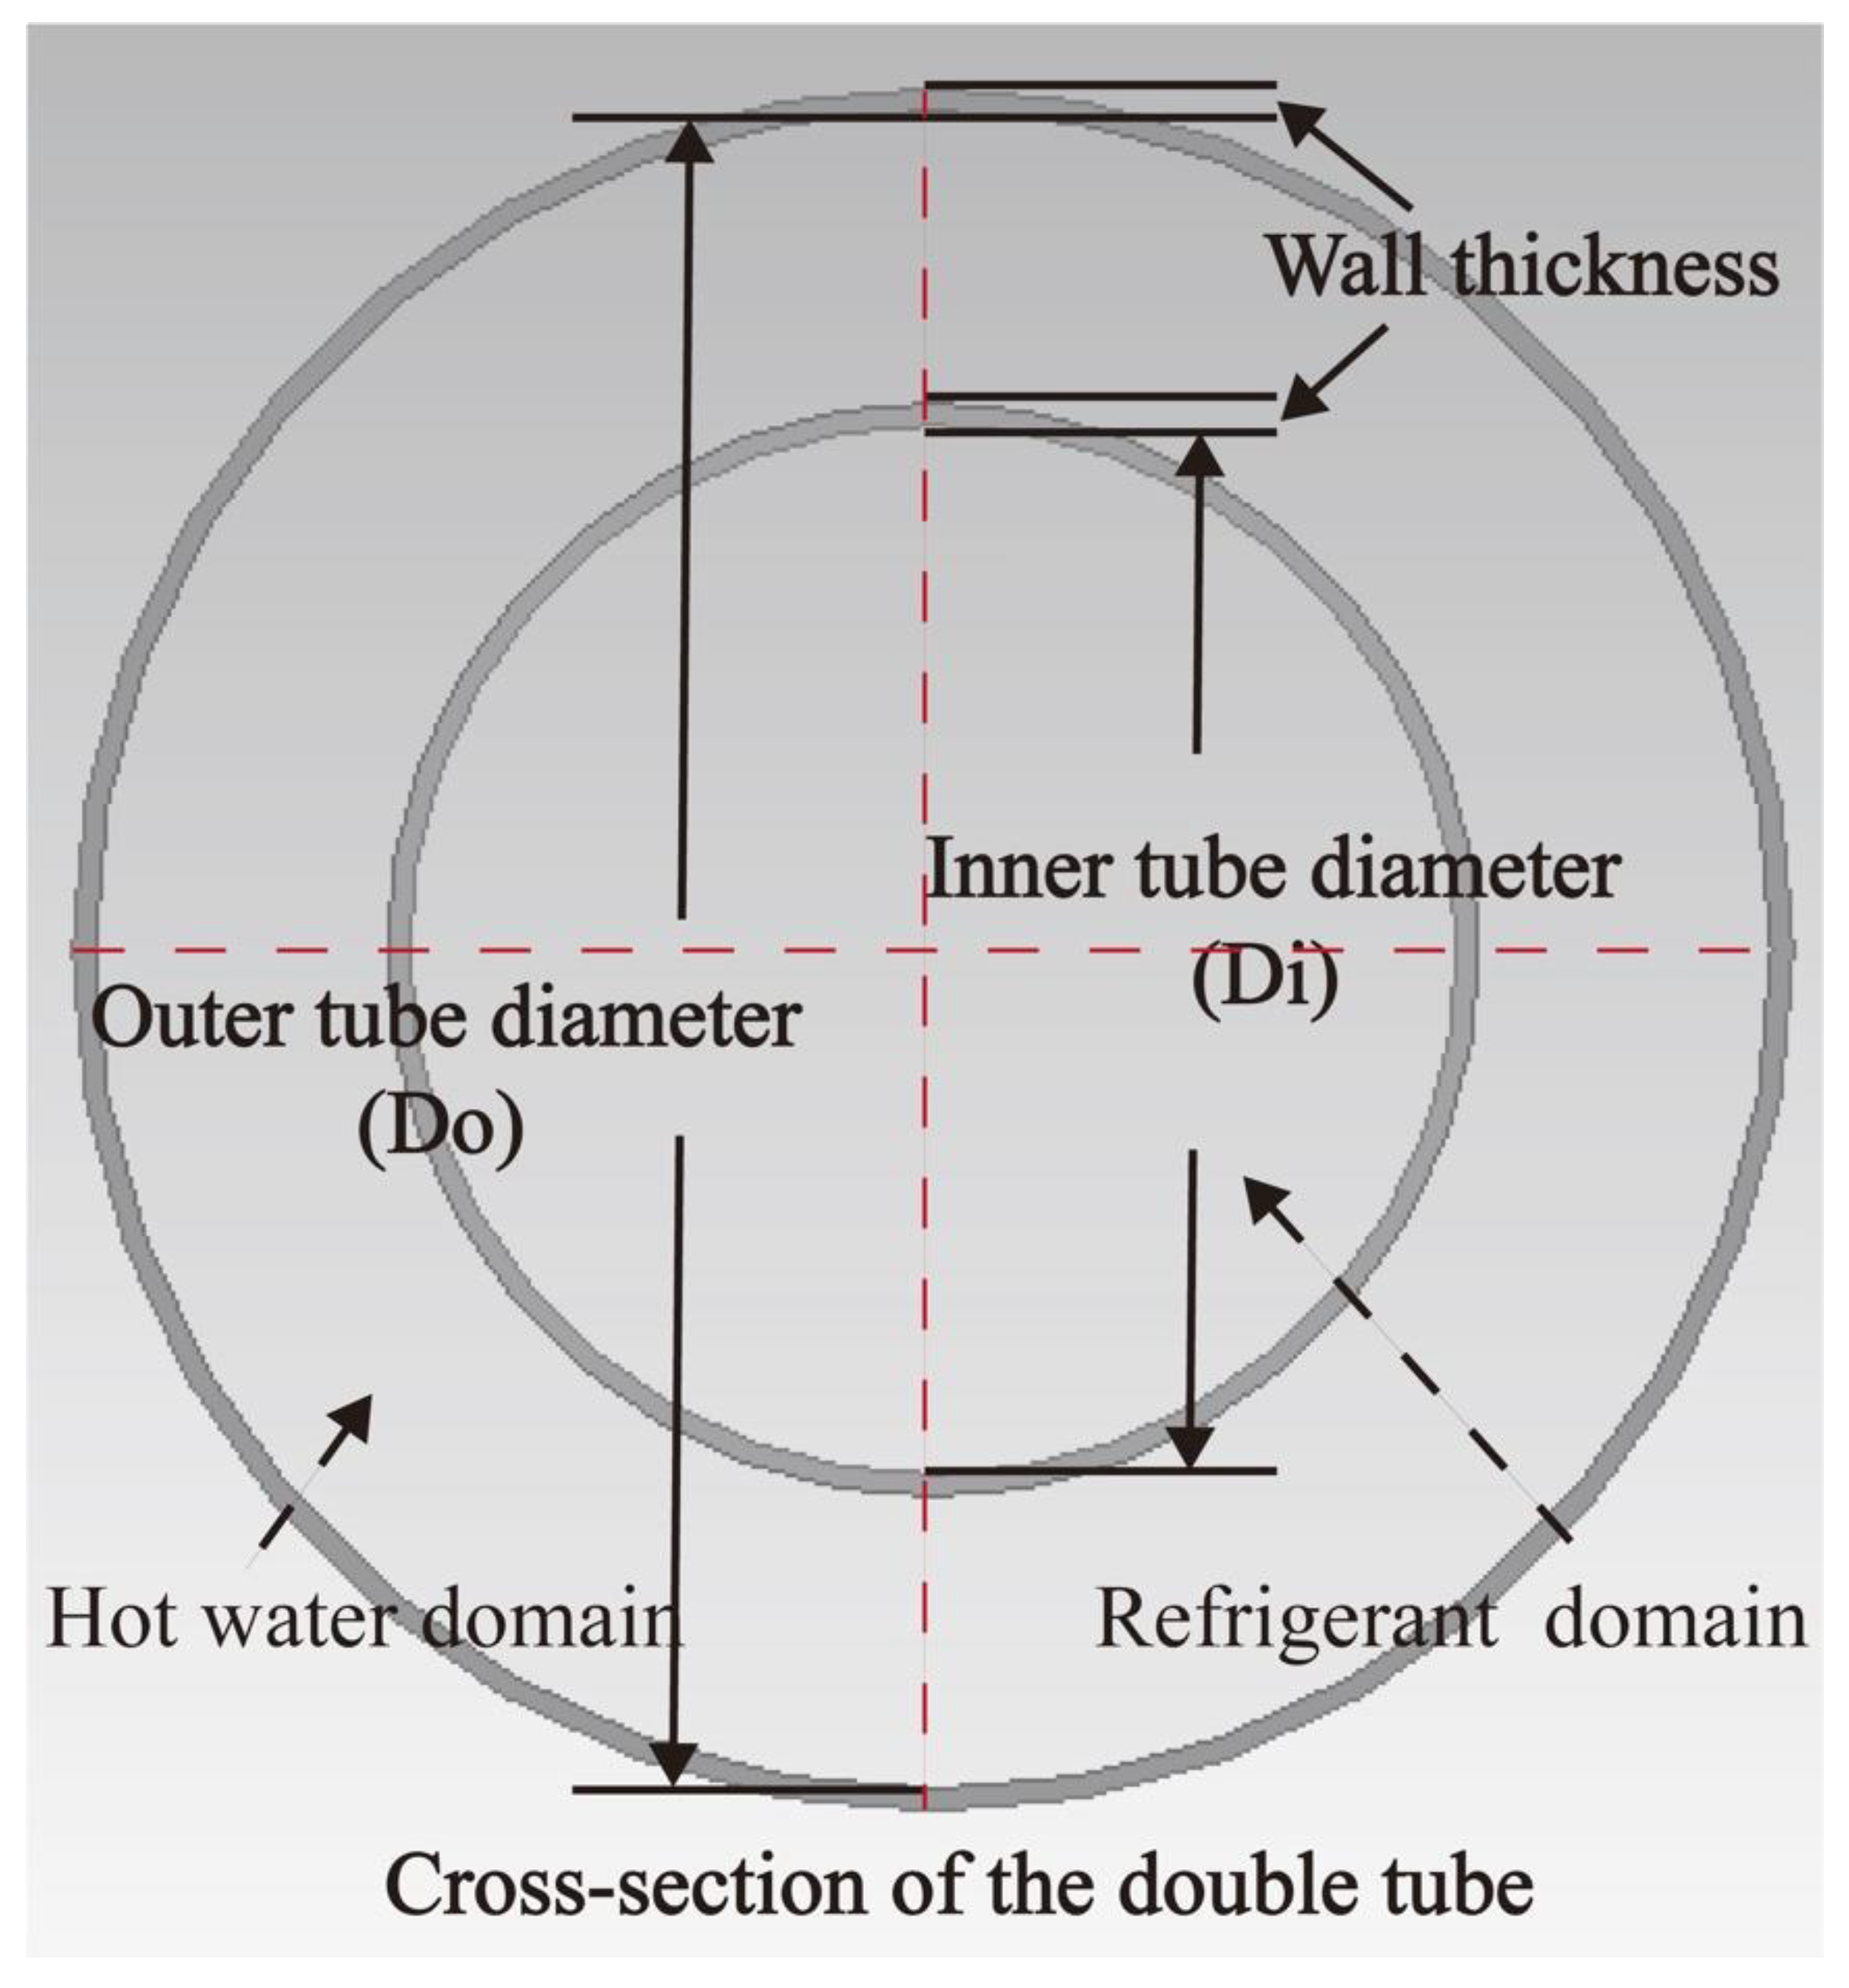
2. Numerical Model
2.1. Numerical Procedure
2.2. Governing Equations
2.3. Boundary Condition and Numerical Method
- (a)
- The velocity-inlet and pressure-outlet conditions are used in present simulation model.
- (b)
- The inner pipe wall is set as the coupling boundary, and the outer pipe wall is set as adiabatic. Copper is the material of the tube wall.
- (c)
- The viscosity, thermal conductivity, density, and specific heat of each phase of the fluid are constant, and the latent heat and surface tension of the fluid are also constant.
- (d)
- The effect of surface tension is taken into account in the model, and the option “implicit body force” is activated in the Mixture Model. The liquid phase of R290 is set as the first phase, the gas phase of R290 is set as the second phase, and the water in the outer tube is set as the third phase in the Model.
- (e)
- The governing equations are solved by steady-sated implicit format.
- (f)
- This simulation algorithm is set up: COUPLE is chosen to be used for the pressure-velocity coupling and QUICK is chosen for the volume fraction equation. The first-order upwind scheme is adopted for the energy, the volume and the turbulent kinetic energy equations.
- (g)
- The convergence is achieved for energy up to 10−6 and for other variables (continuity, x-velocity, y-velocity, z-velocity, k, epsilon, volume fraction-R290-vapor, volume fraction-water) up to 10−3.
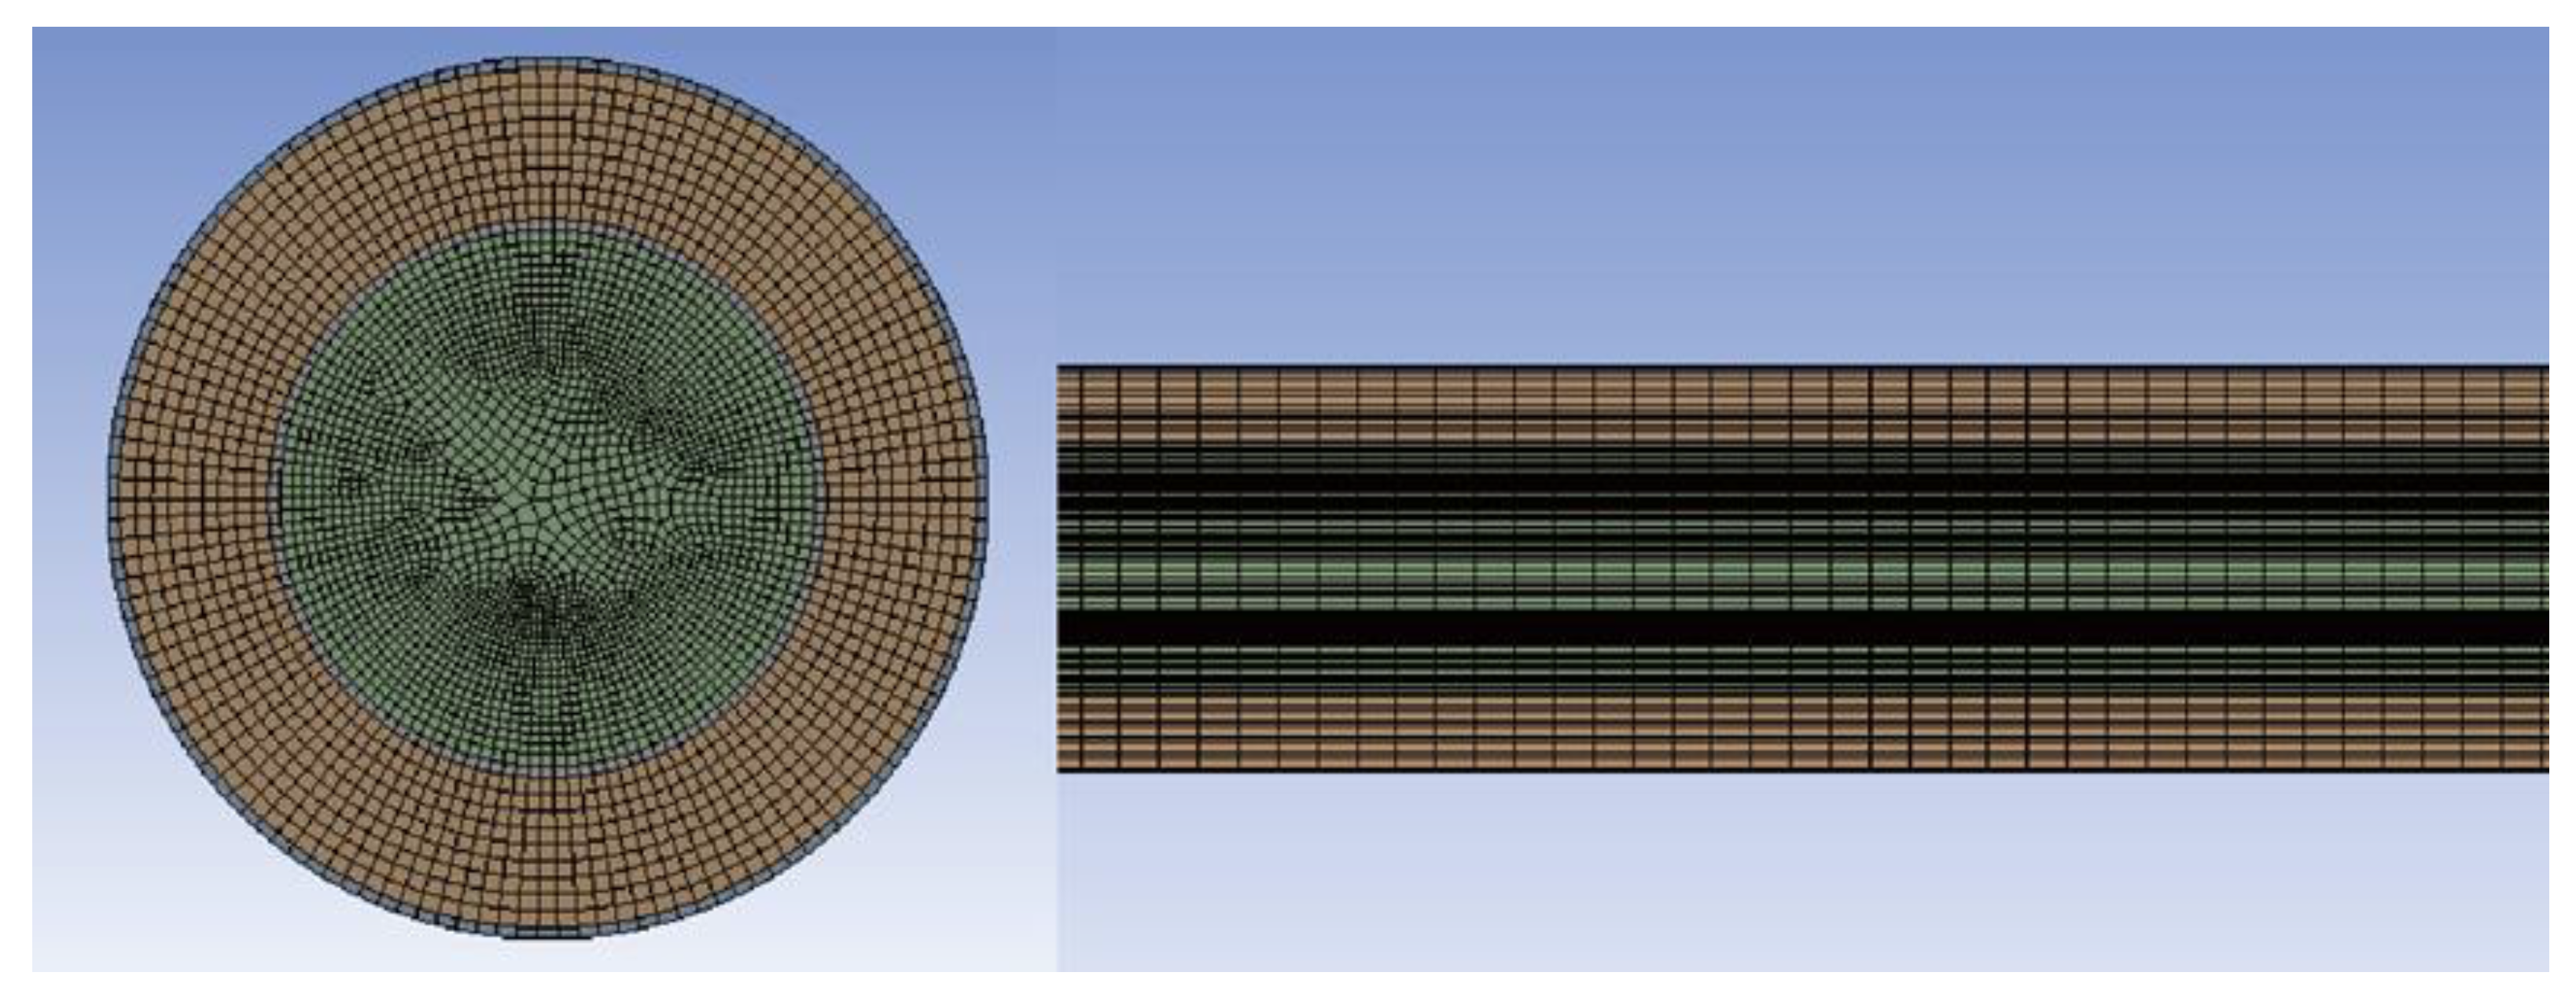
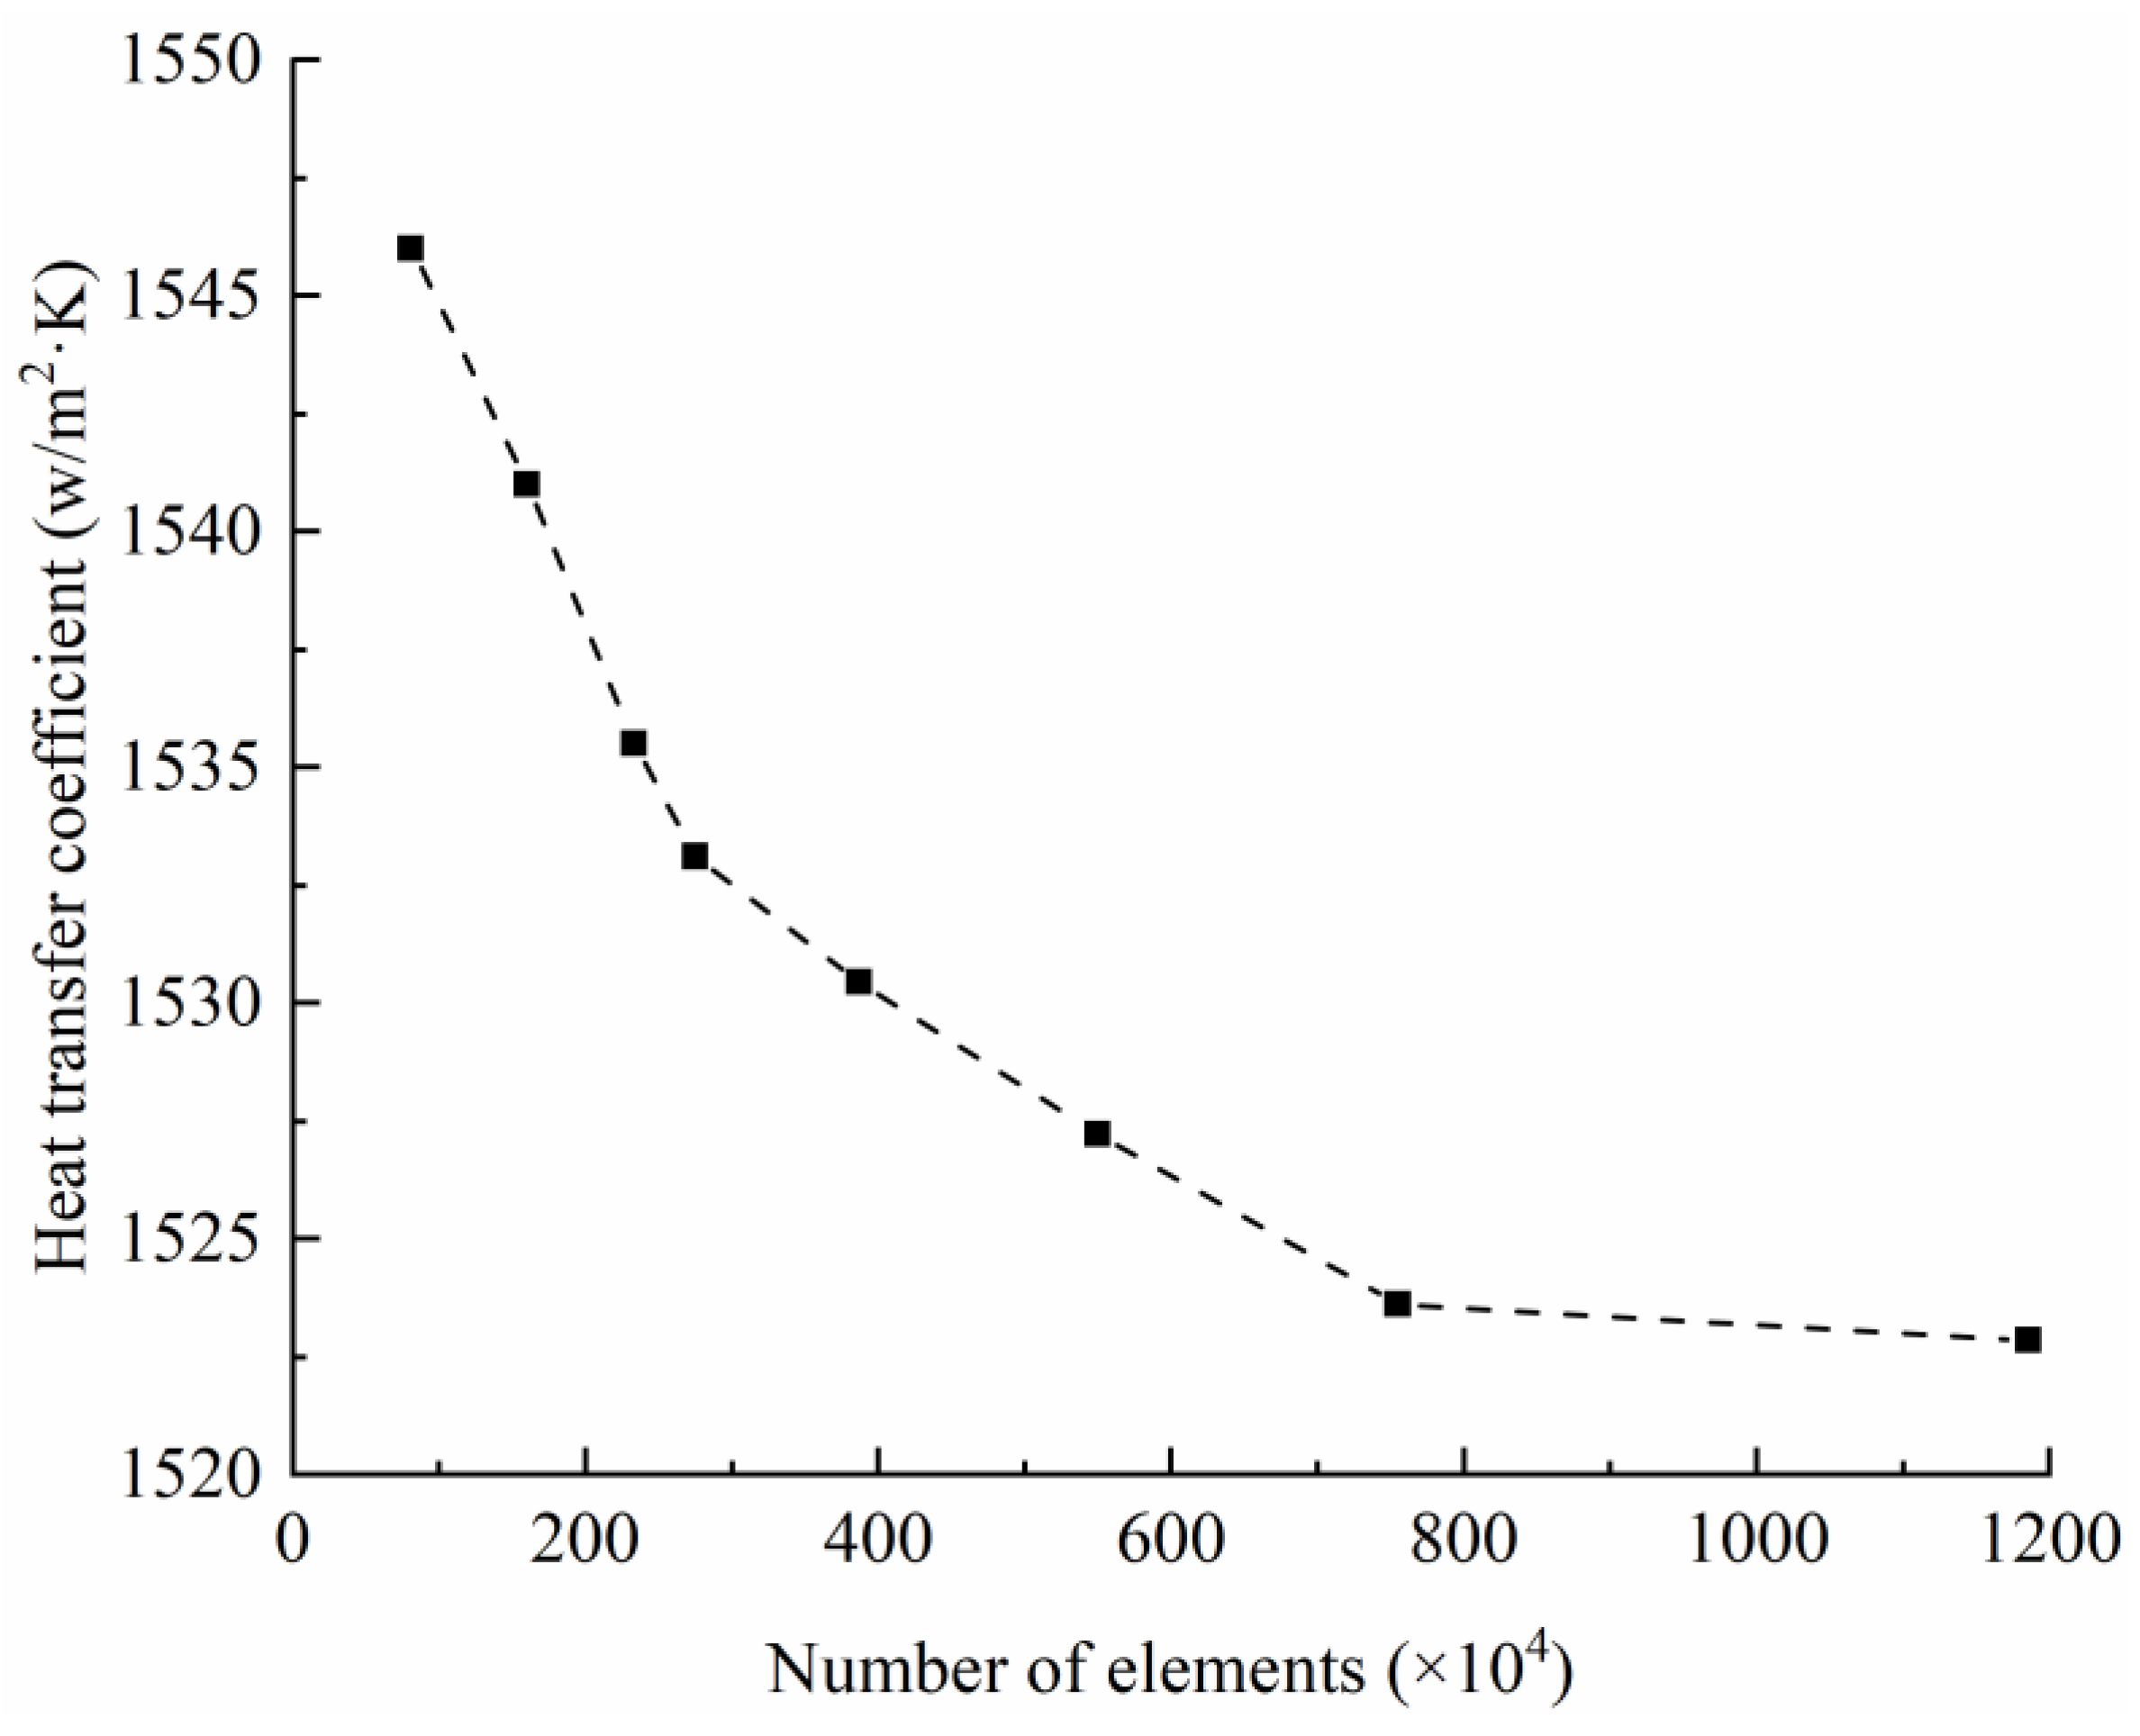
2.4. Grid Independence Check
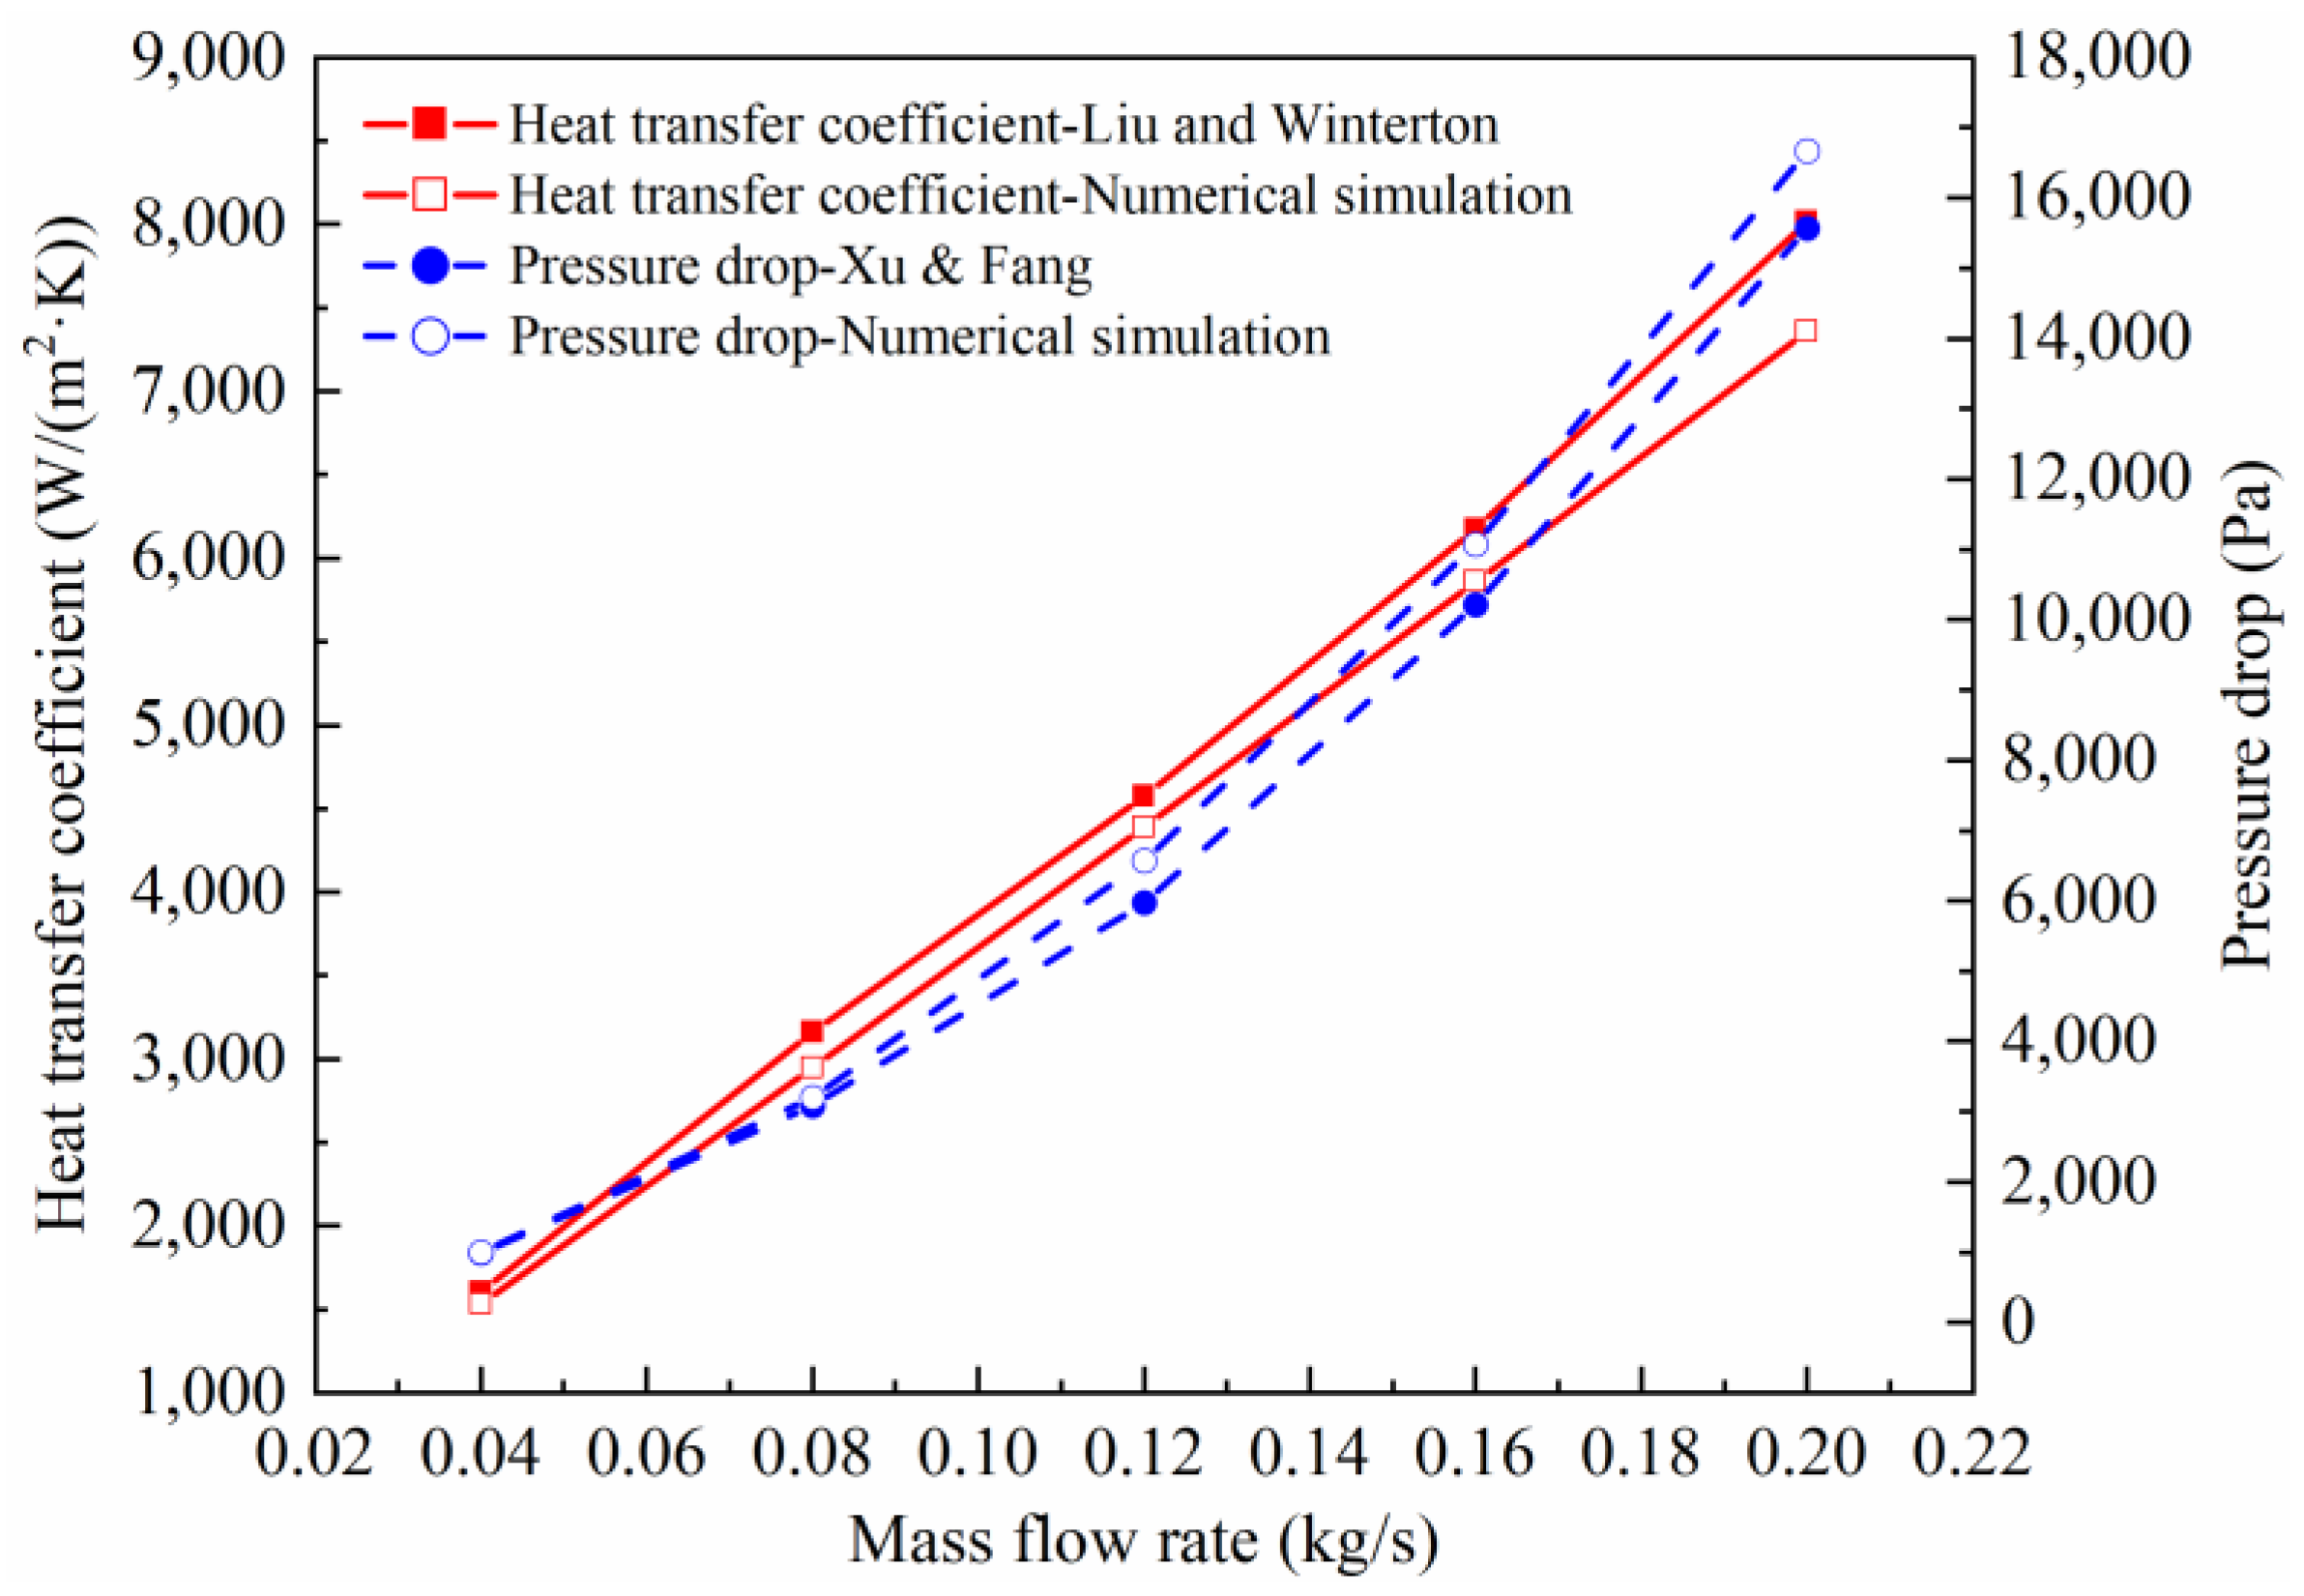
2.5. Model Verification
3. Calculation Method
4. Results and Discussion
4.1. HTC Analysis
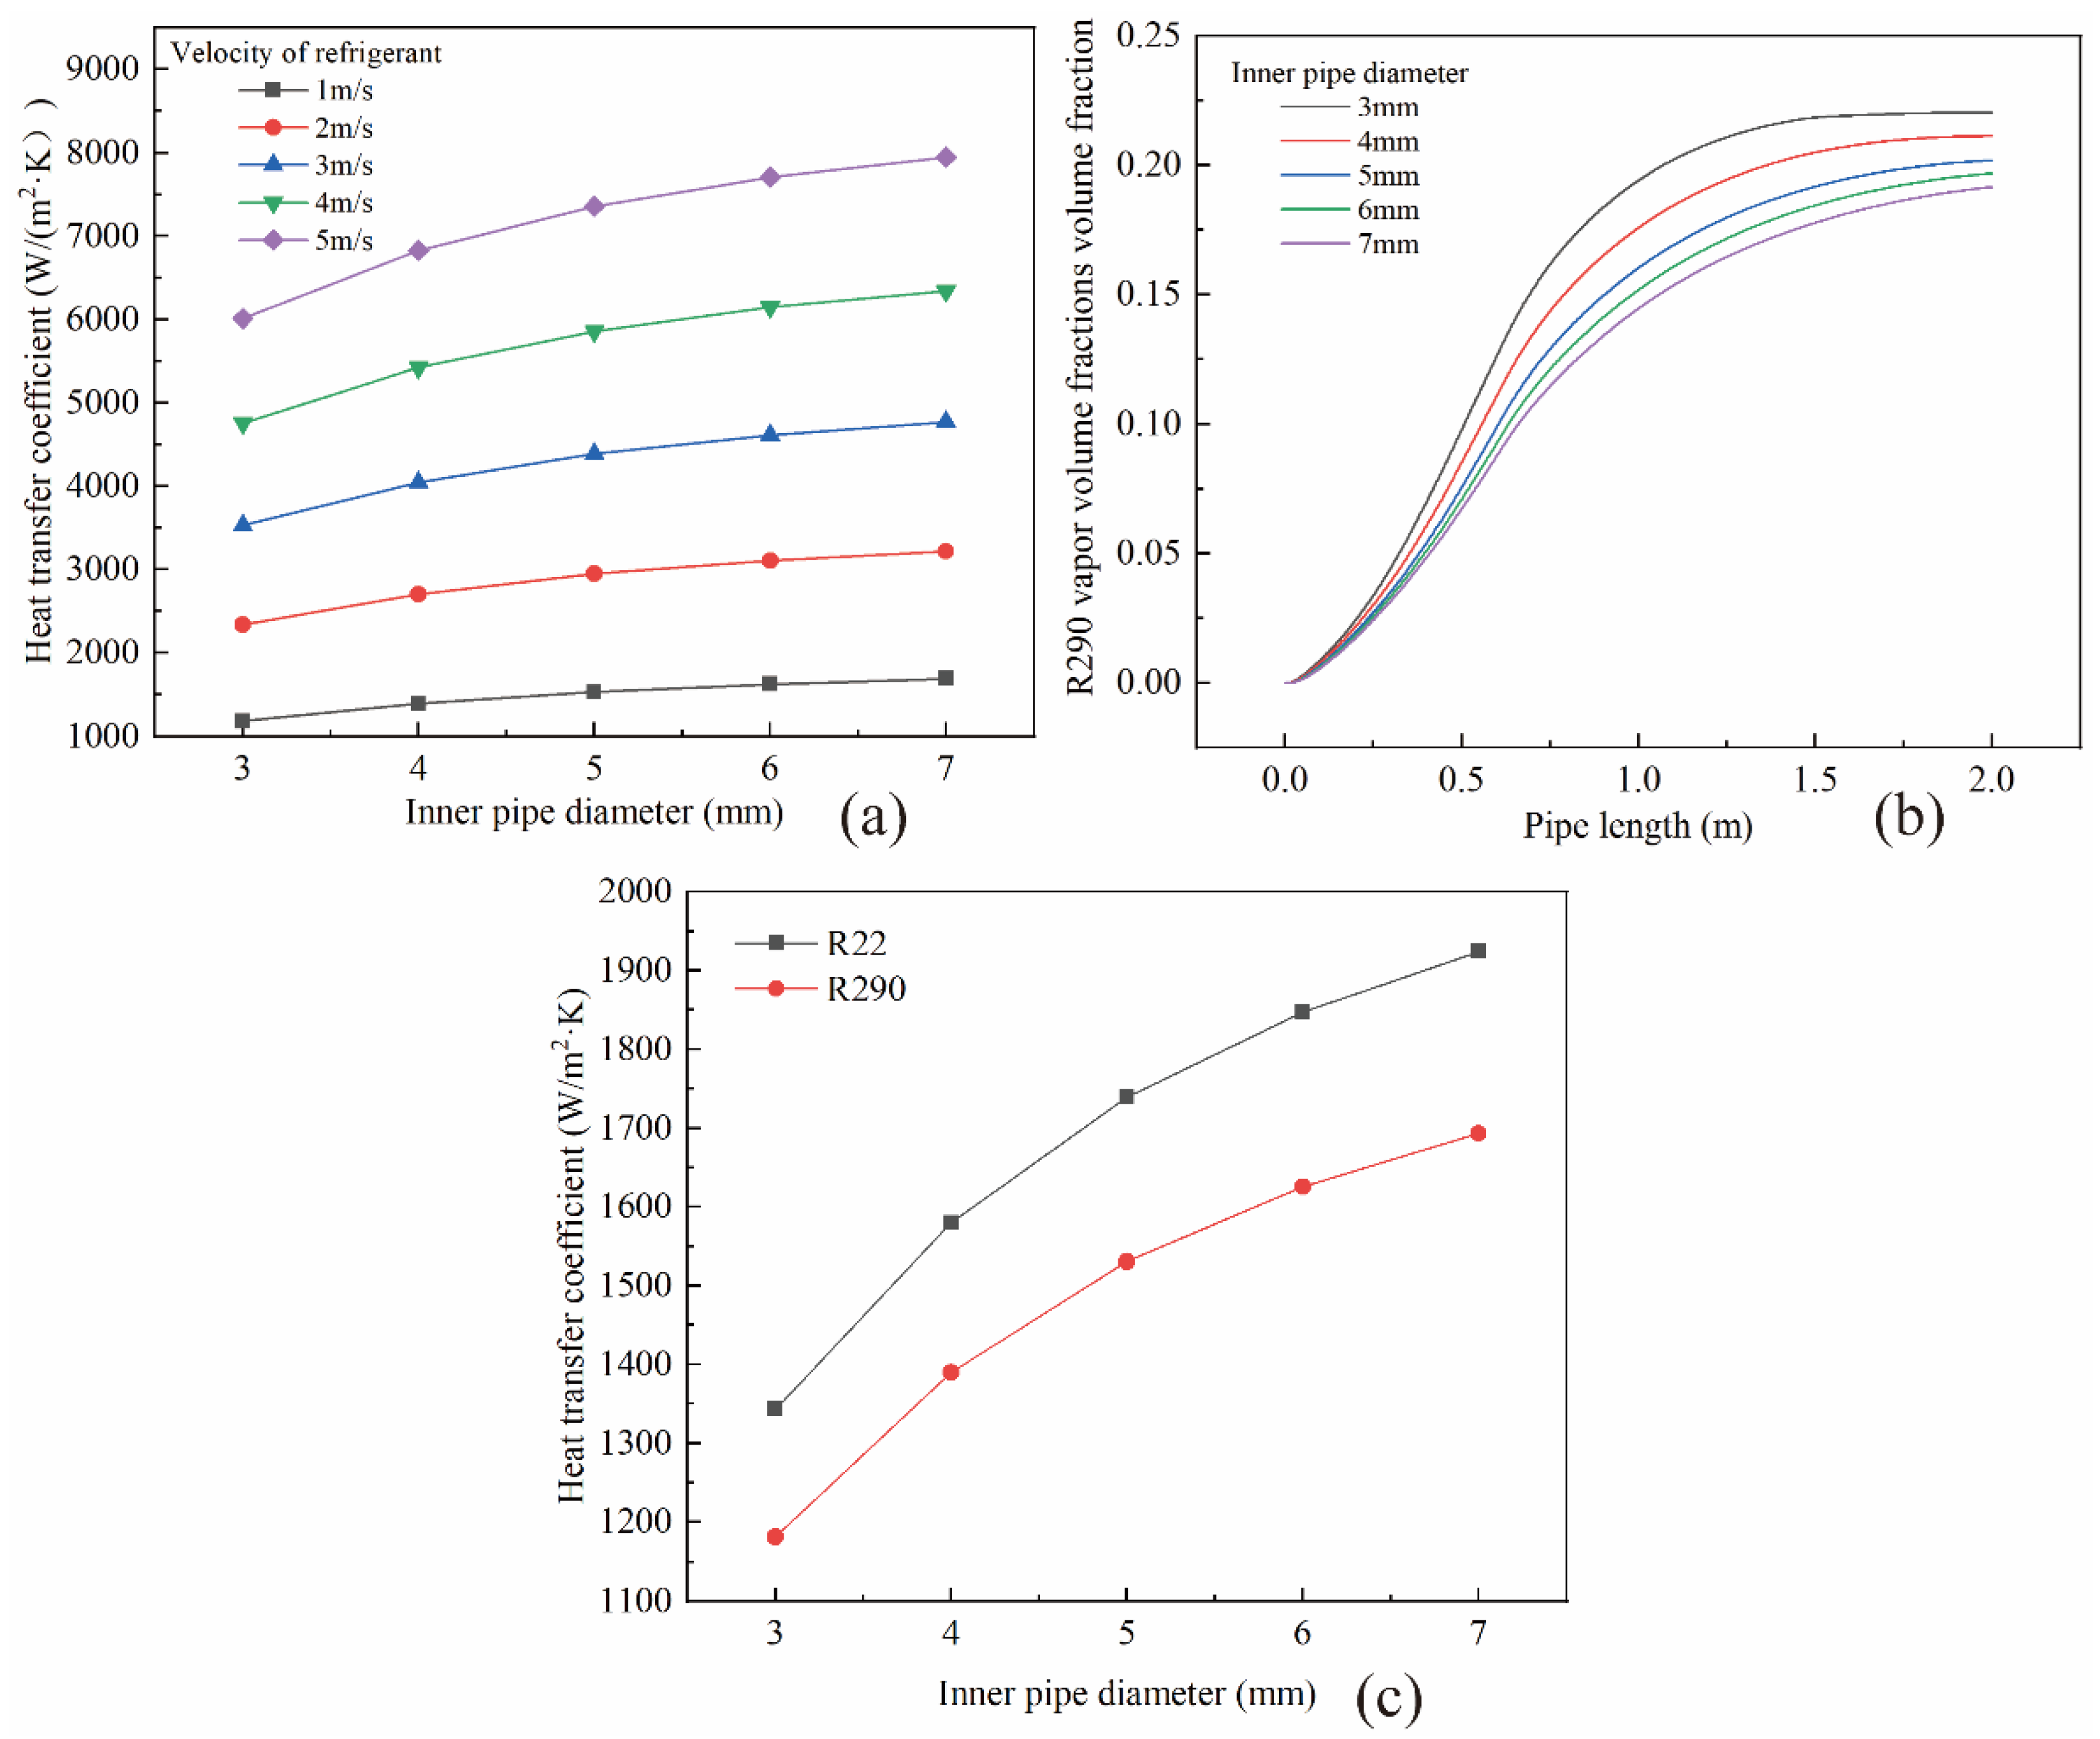
4.1.1. The Impact of Diameter on HTC
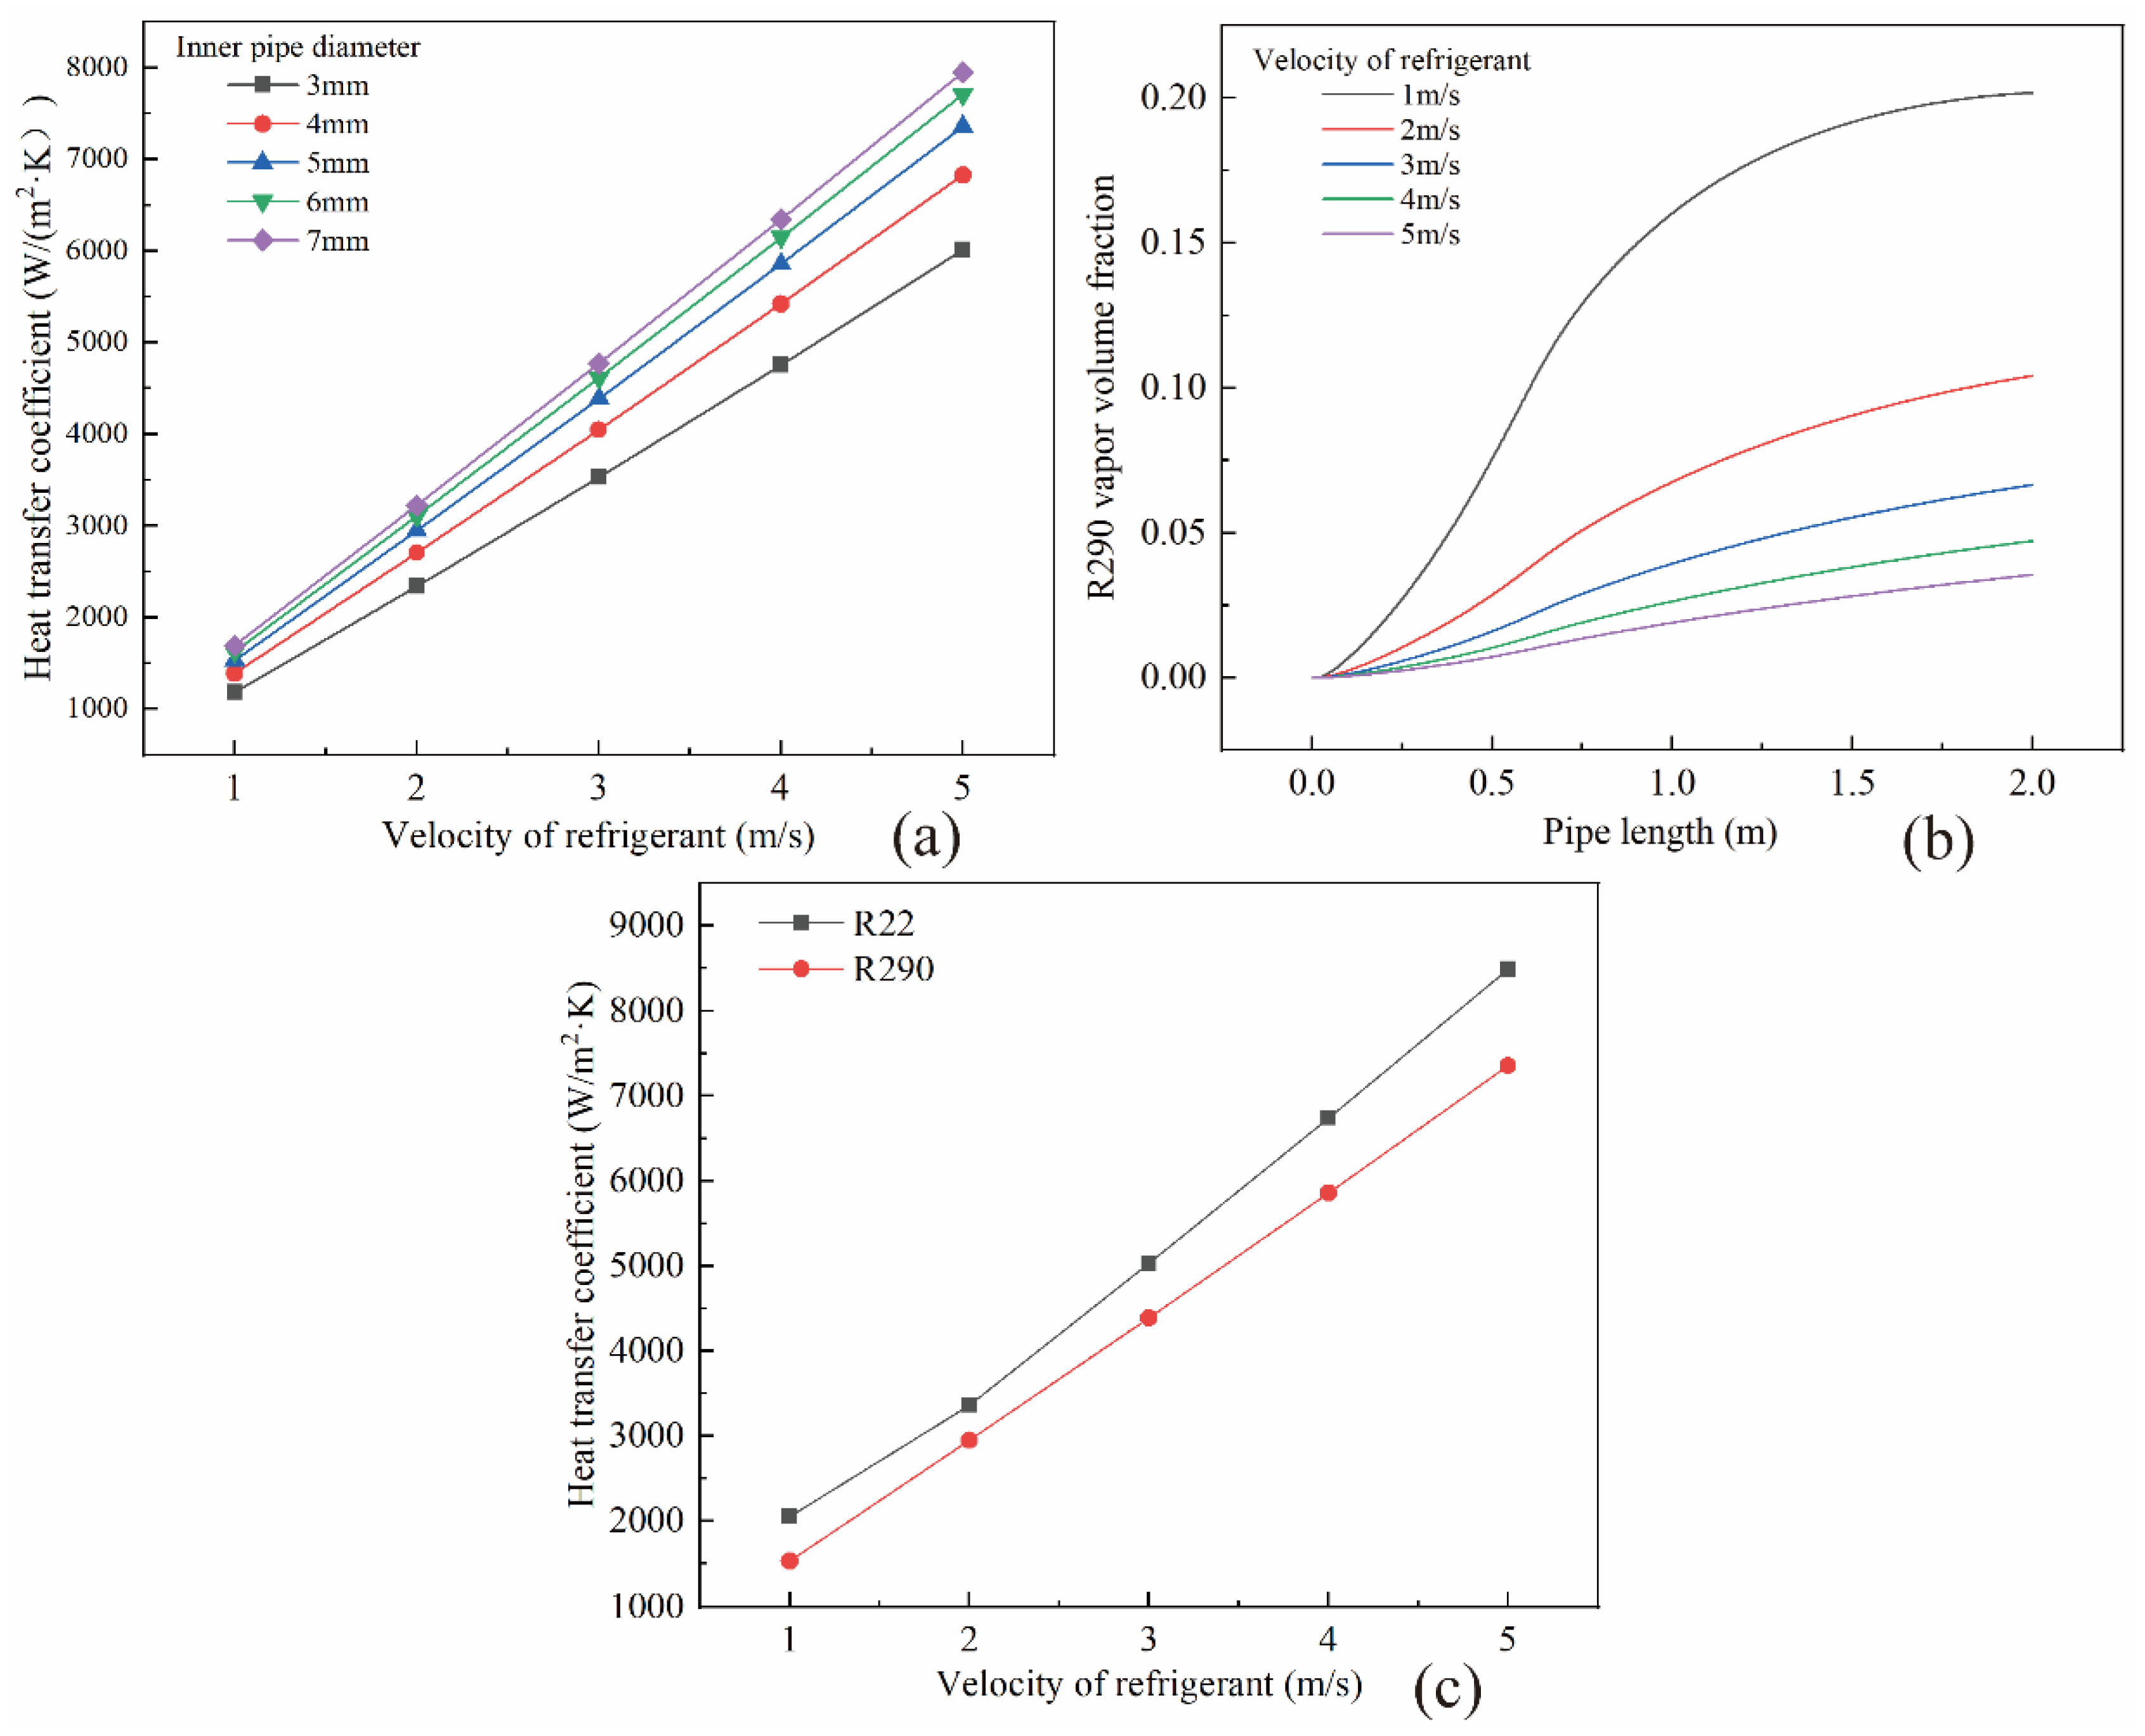
4.1.2. The Impact of Refrigerant Velocity on HTC
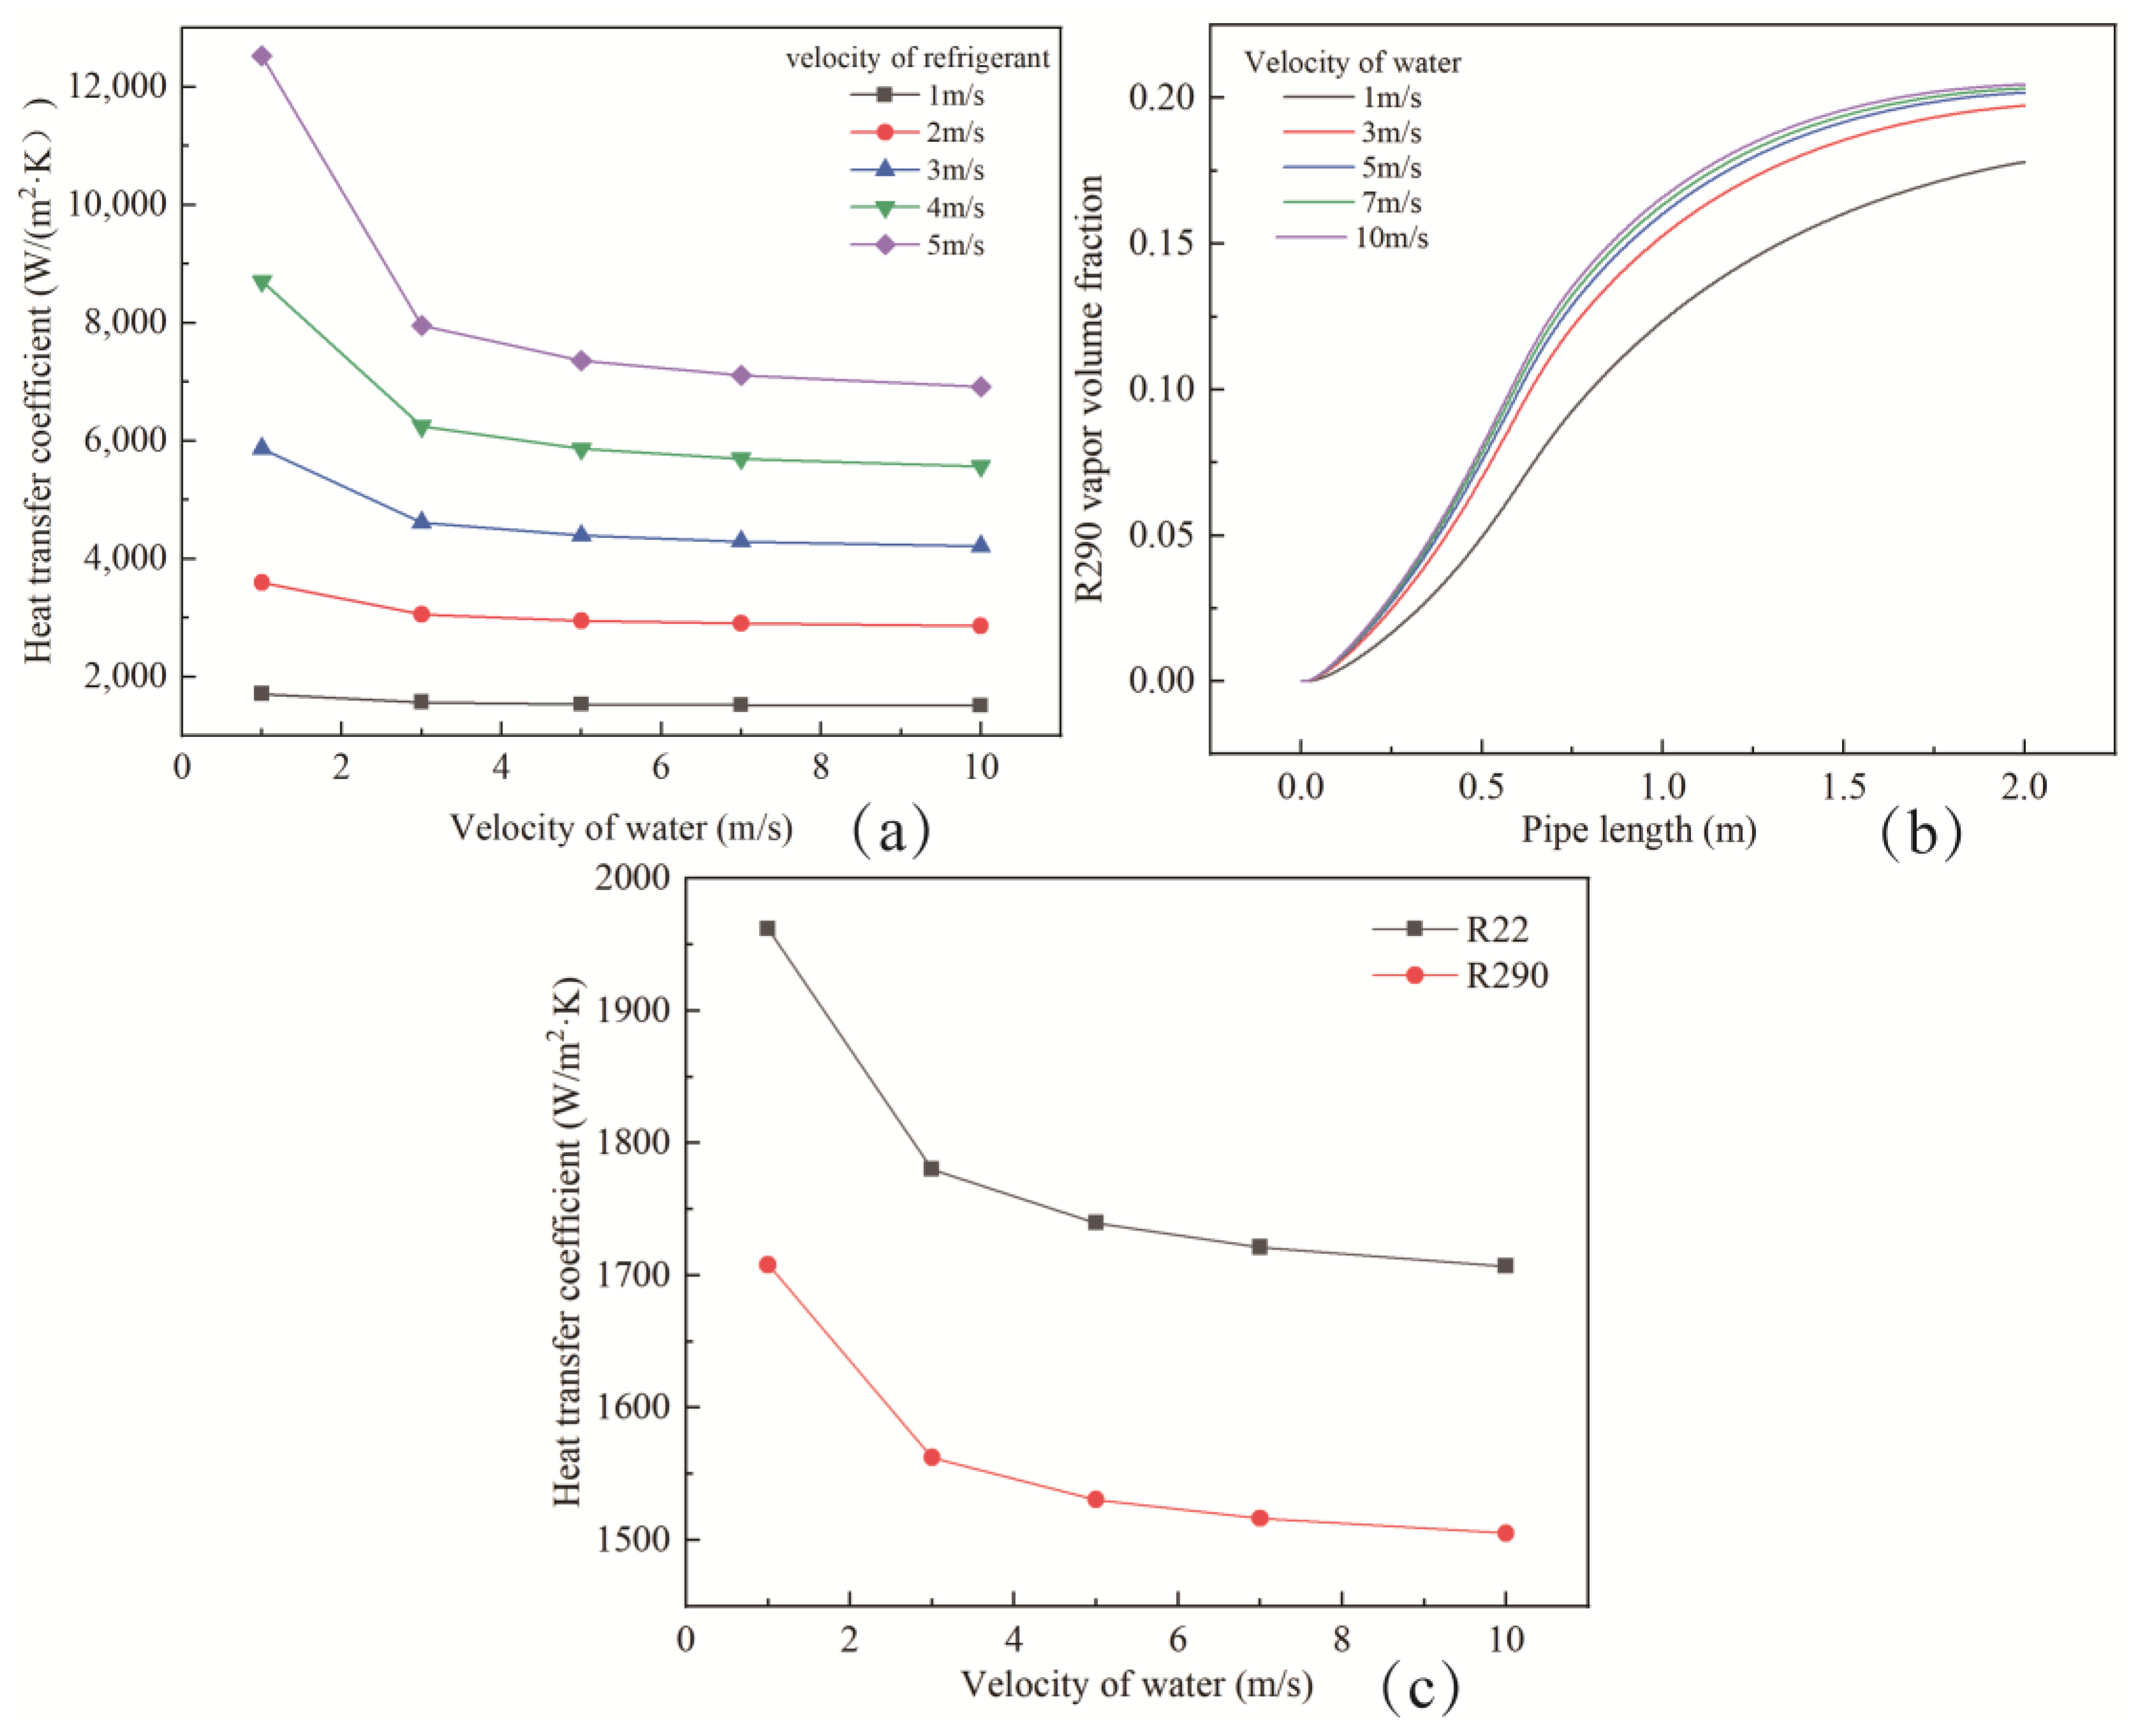
4.1.3. The impact of water velocity on HTC
4.1.4. The Impact of Saturation Temperature on HTC
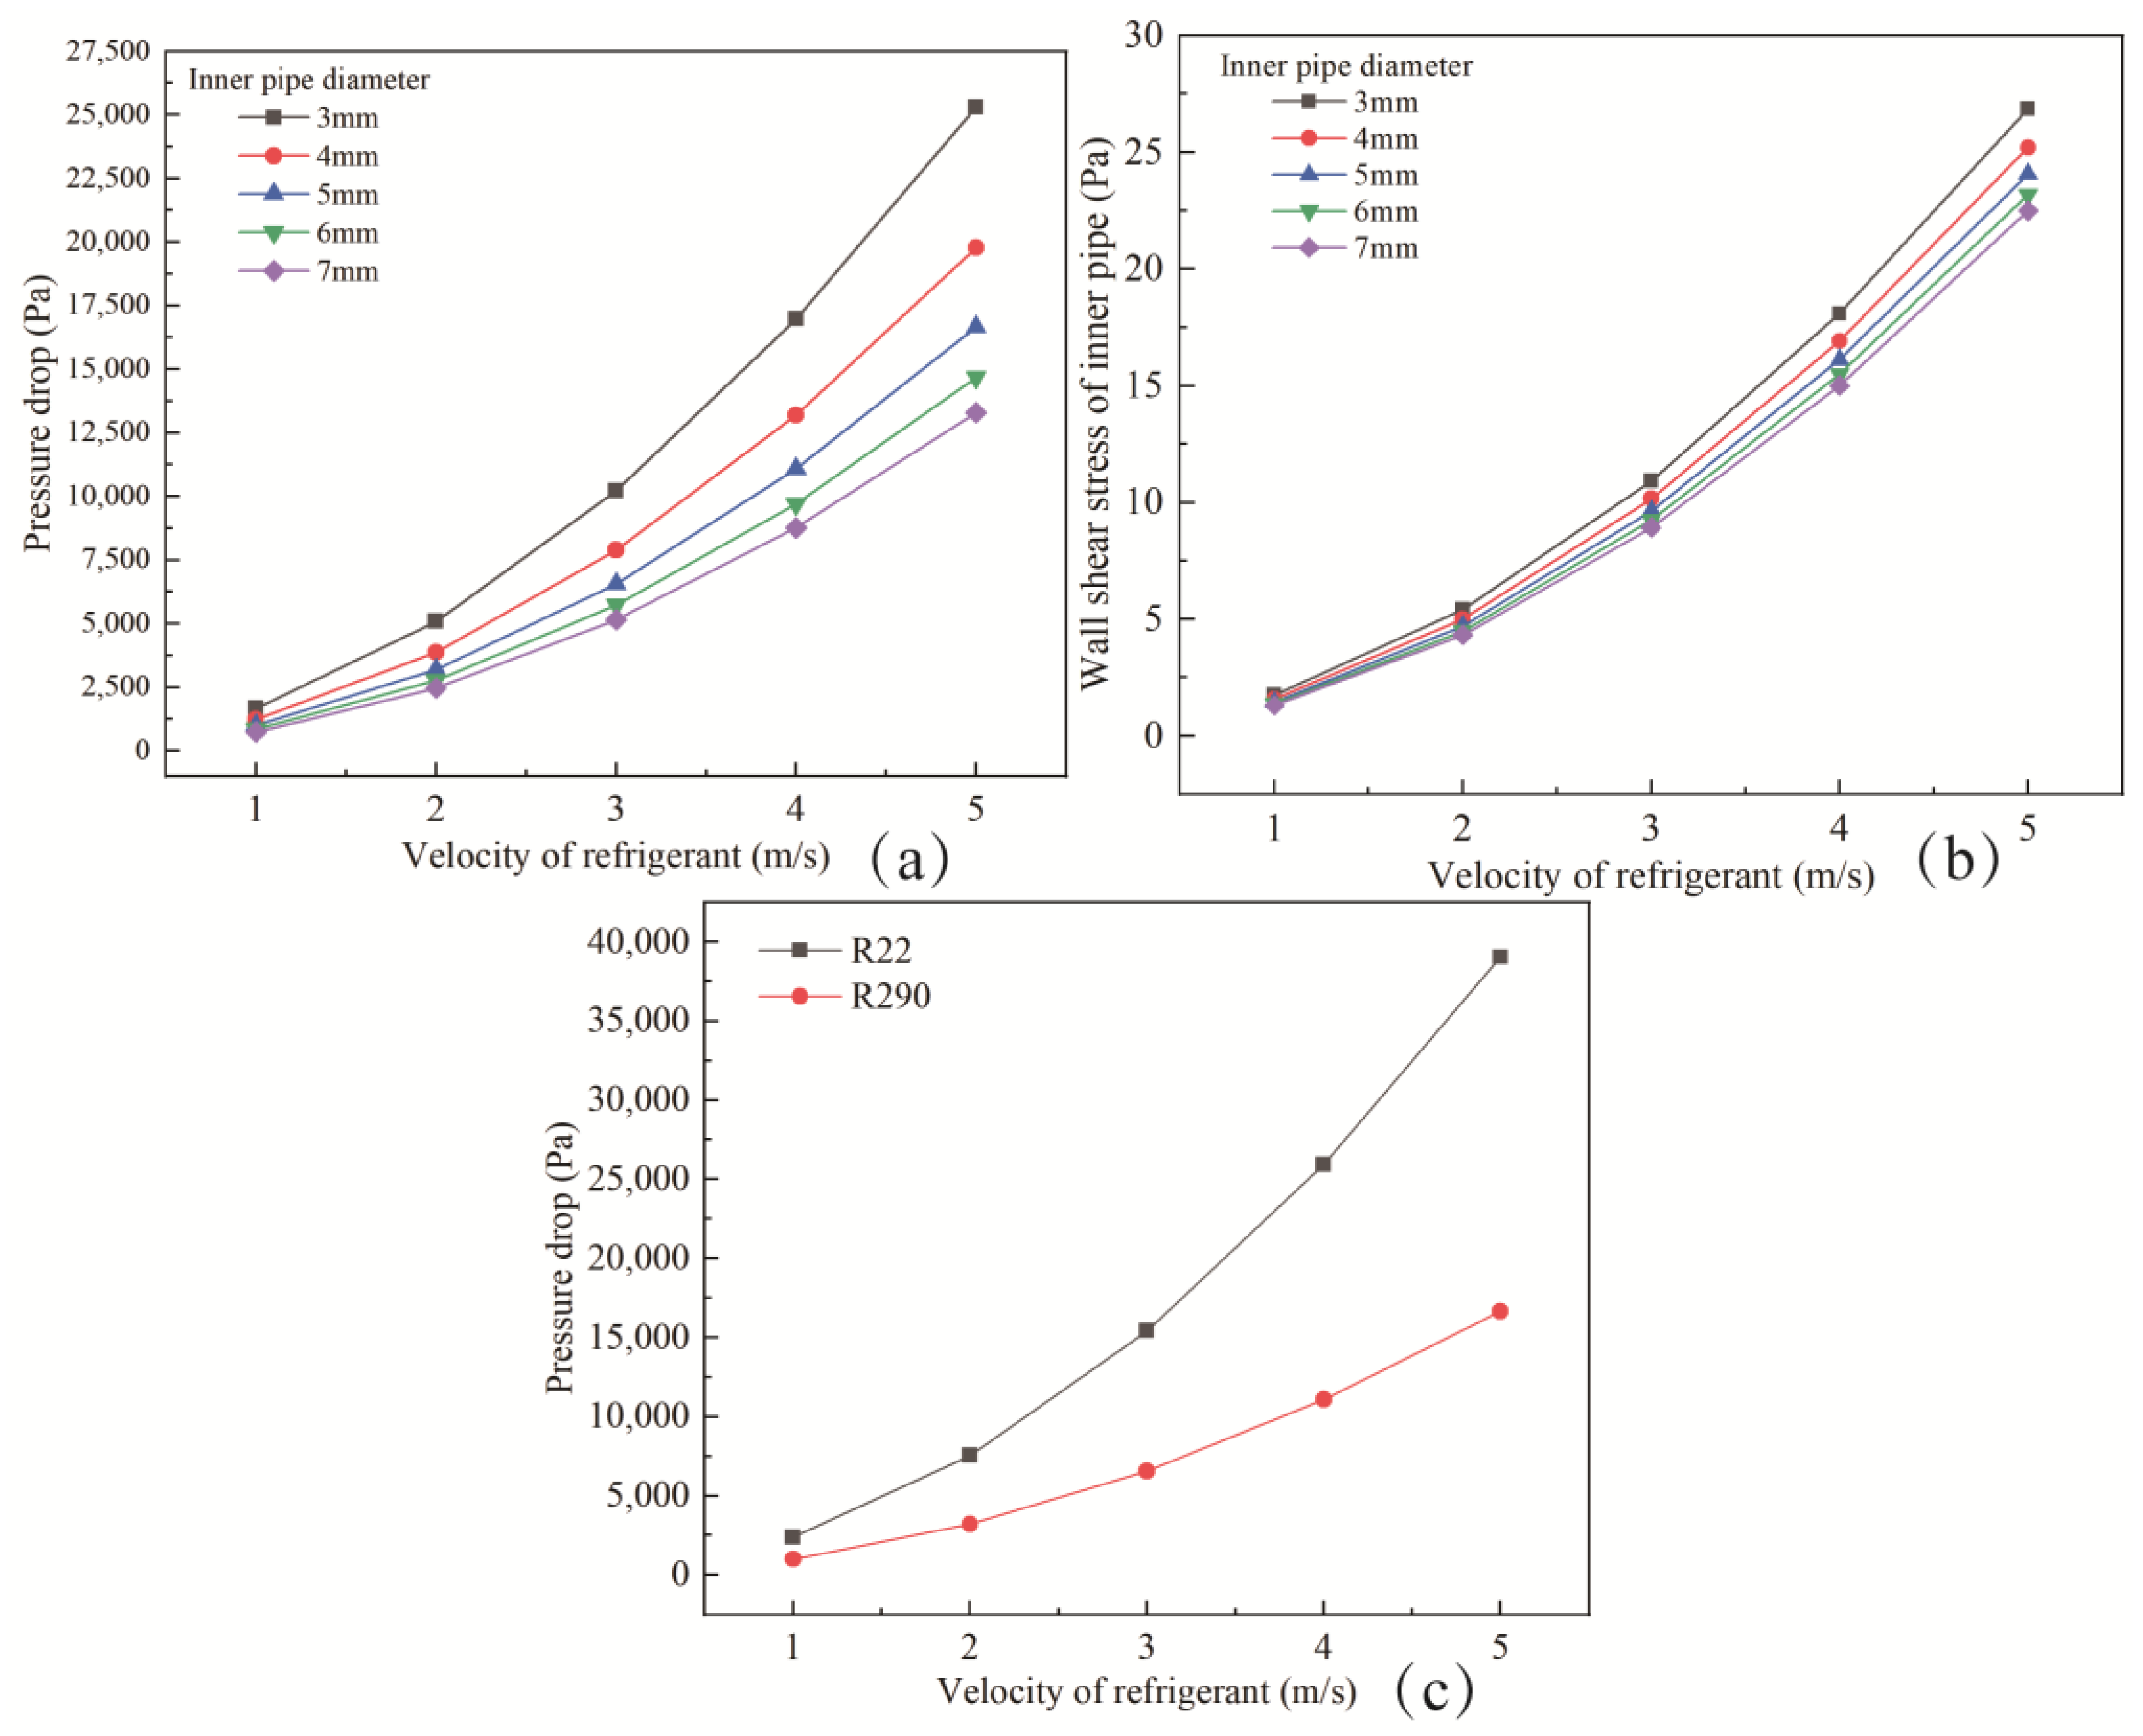
4.2. Pressure Drop Analyses
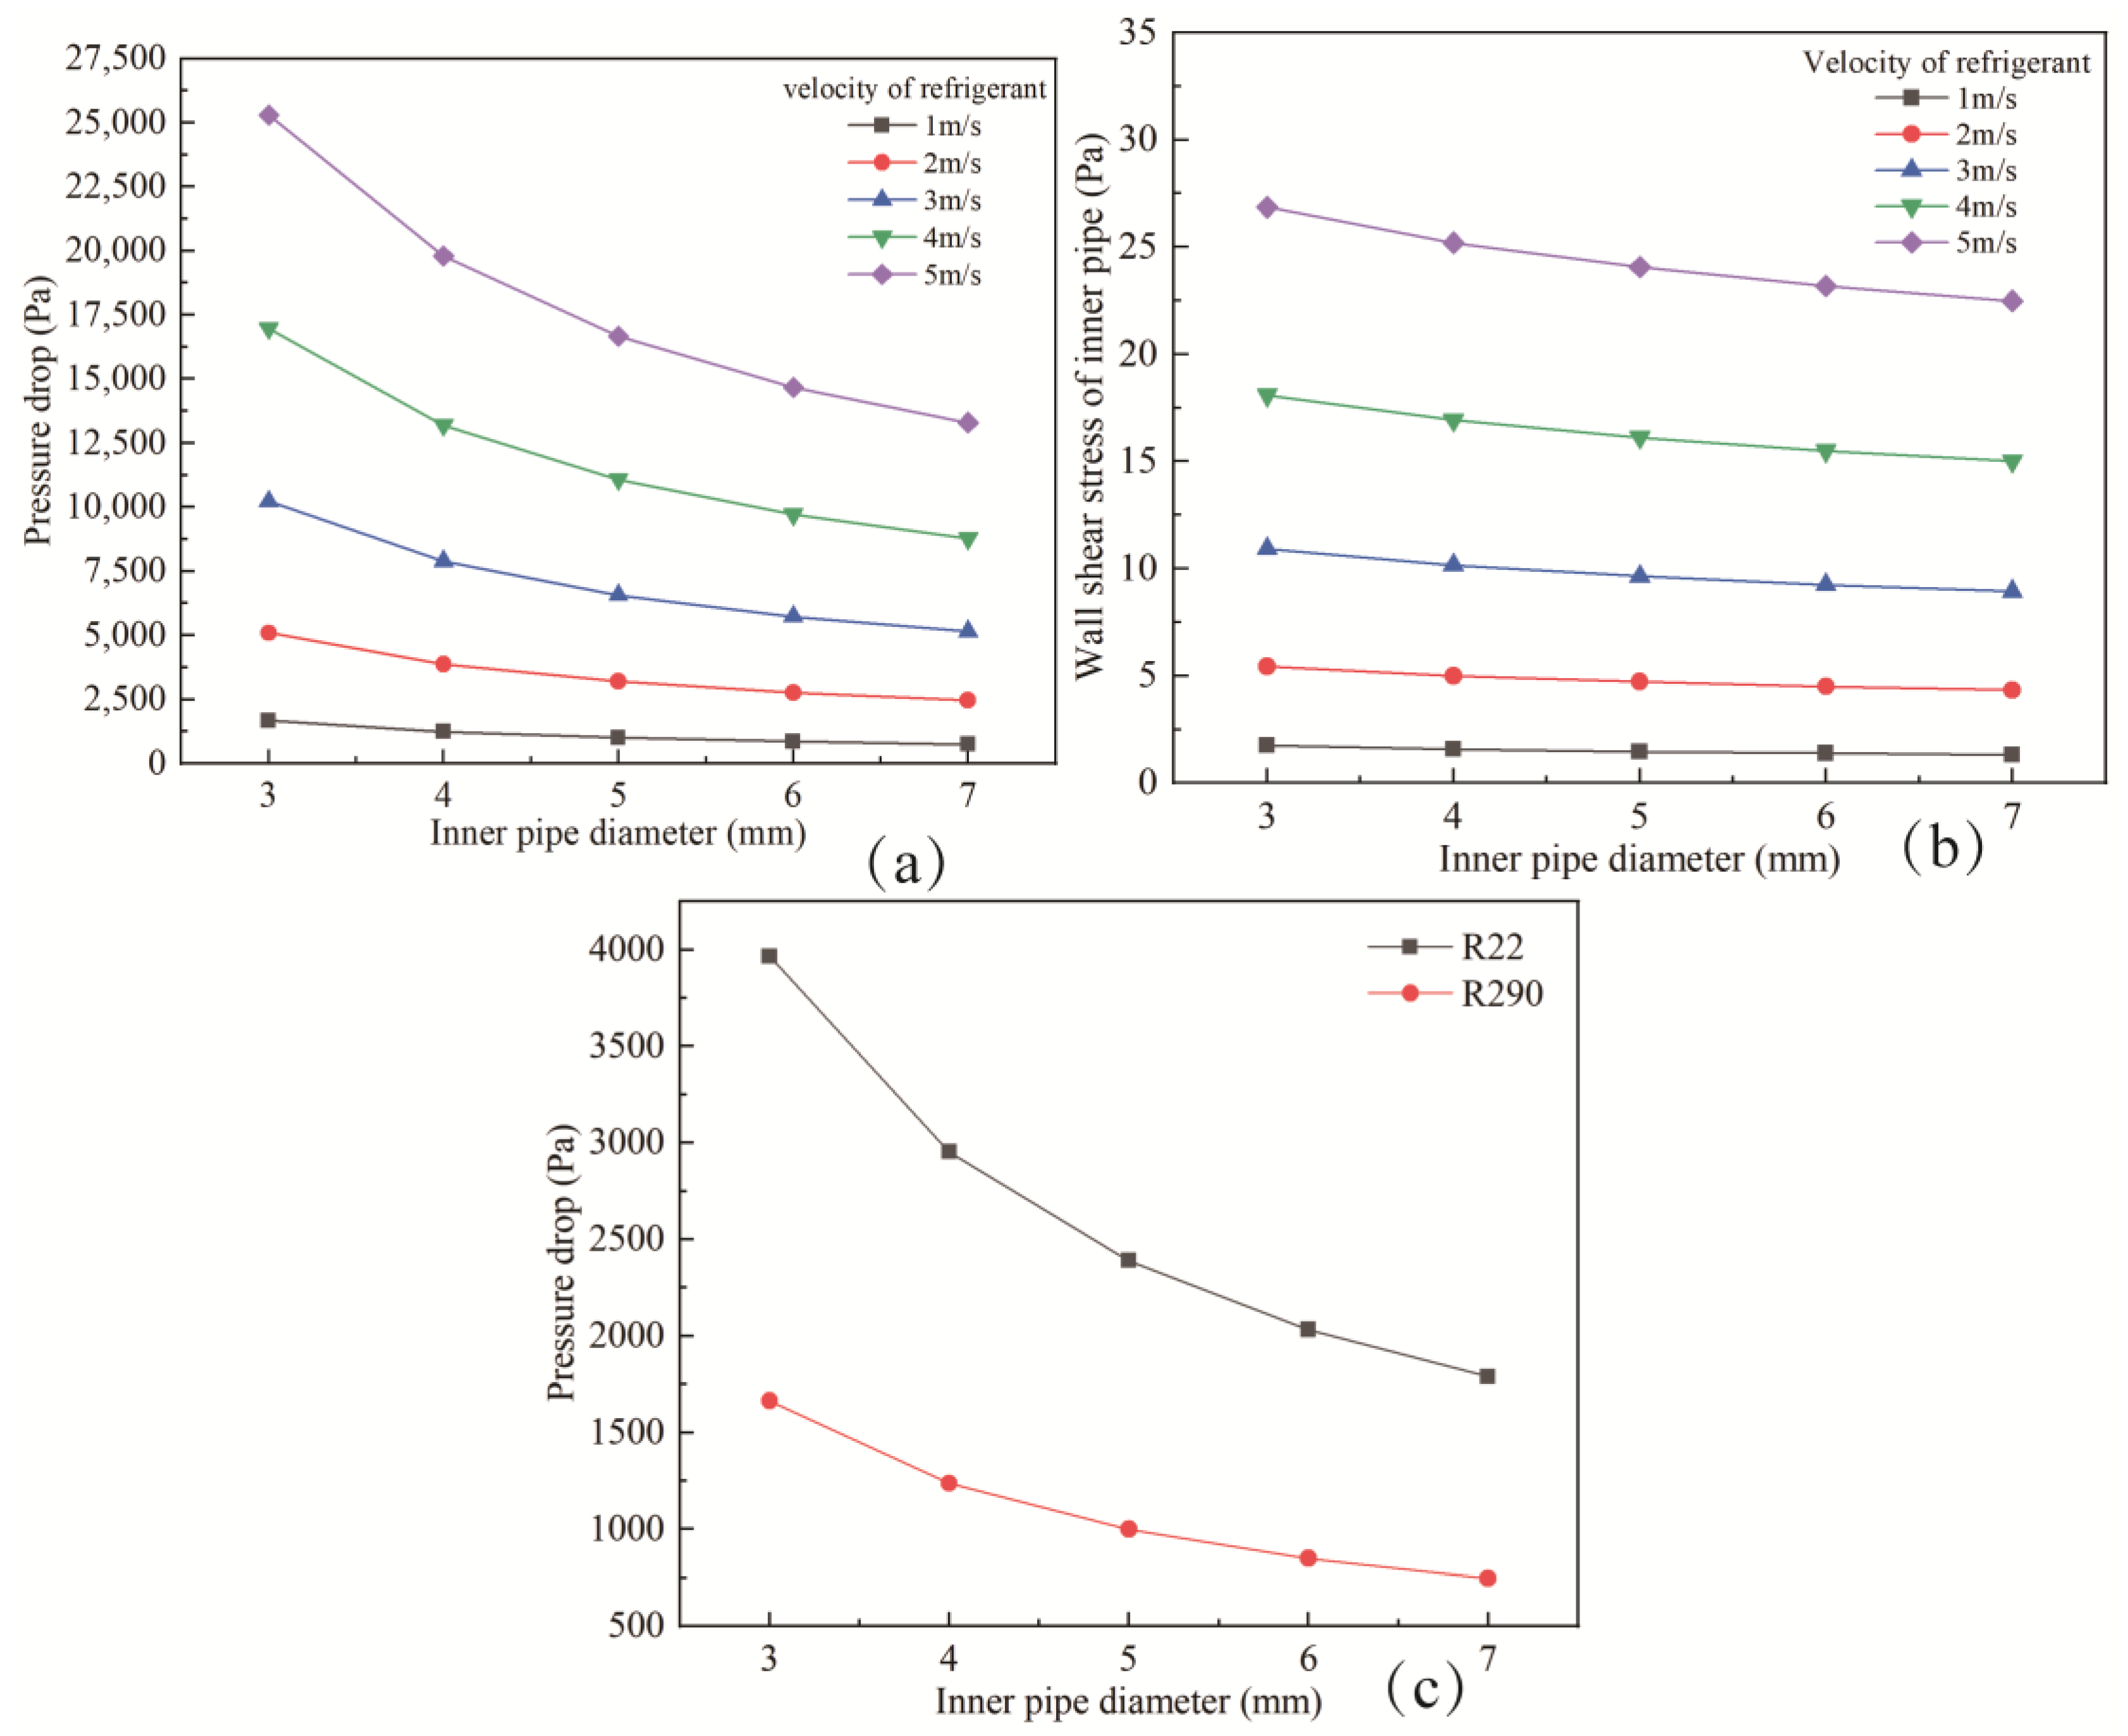
4.2.1. The Impact of Diameter on Pressure Drop
4.2.2. The Impact of Refrigerant Velocity on Pressure Drop
4.2.3. The Impact of Water Velocity on Pressure Drop
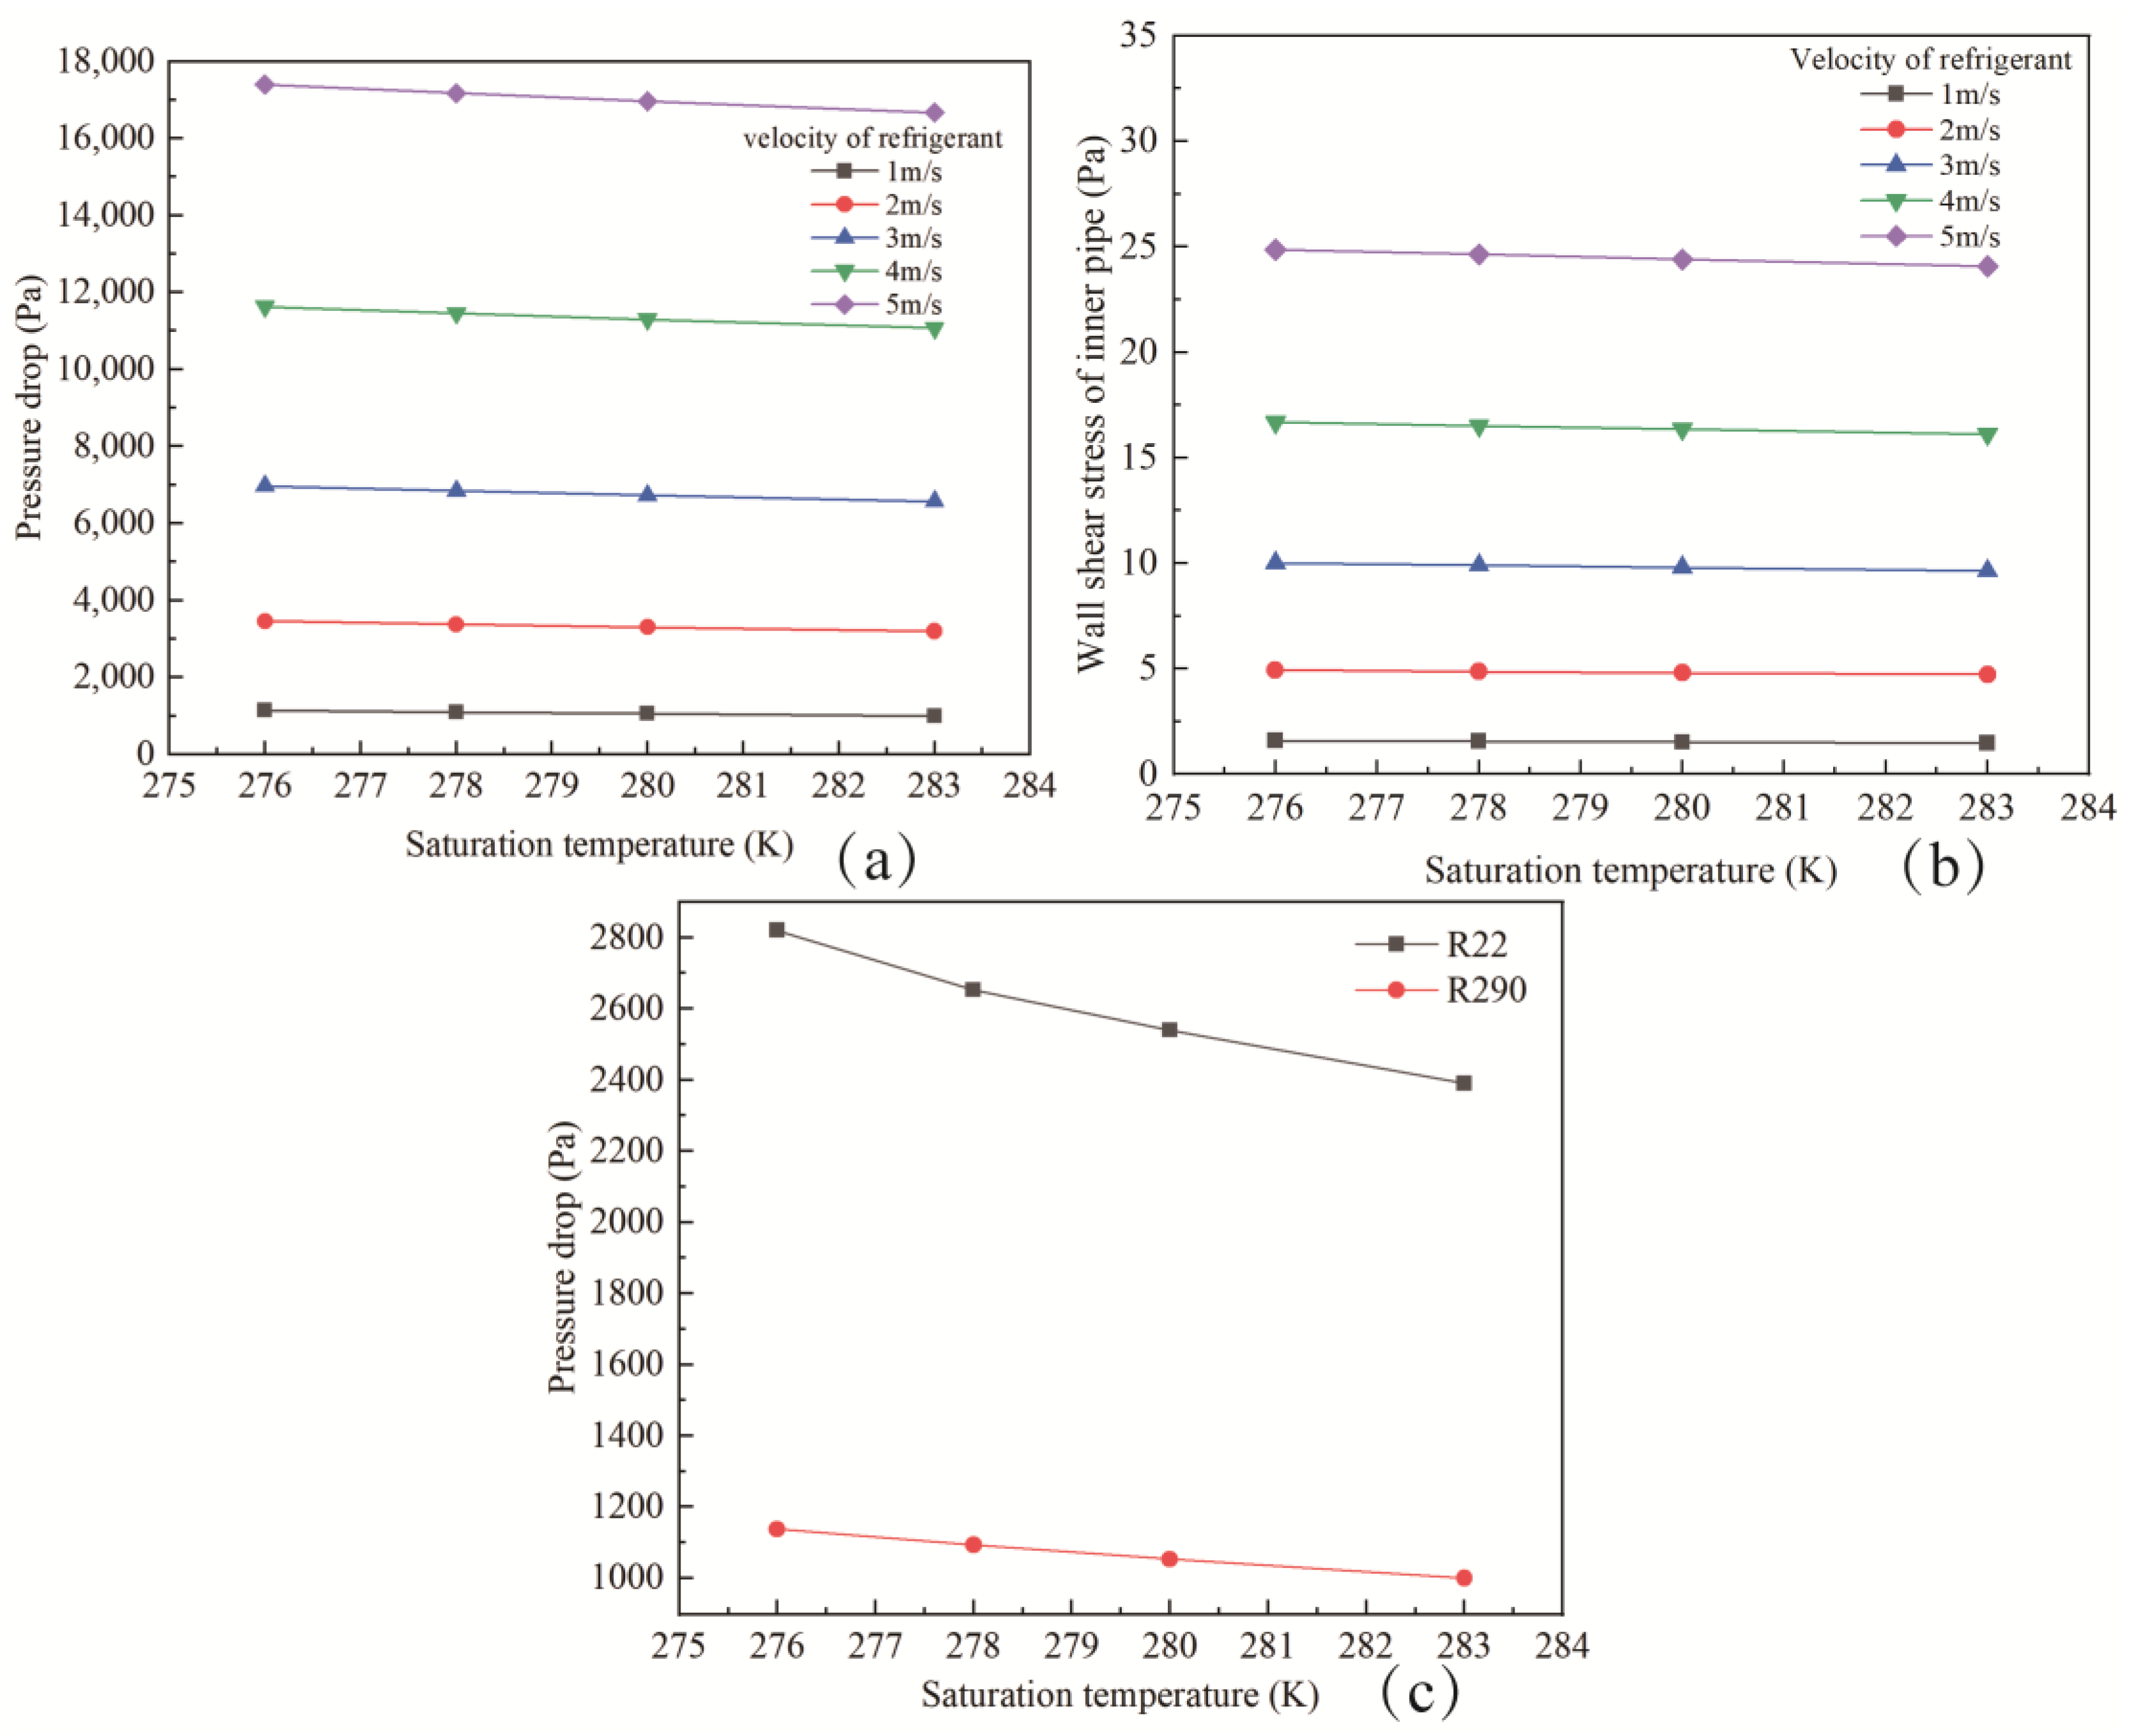
4.2.4. The Impact of Saturation Temperature on Pressure Drop
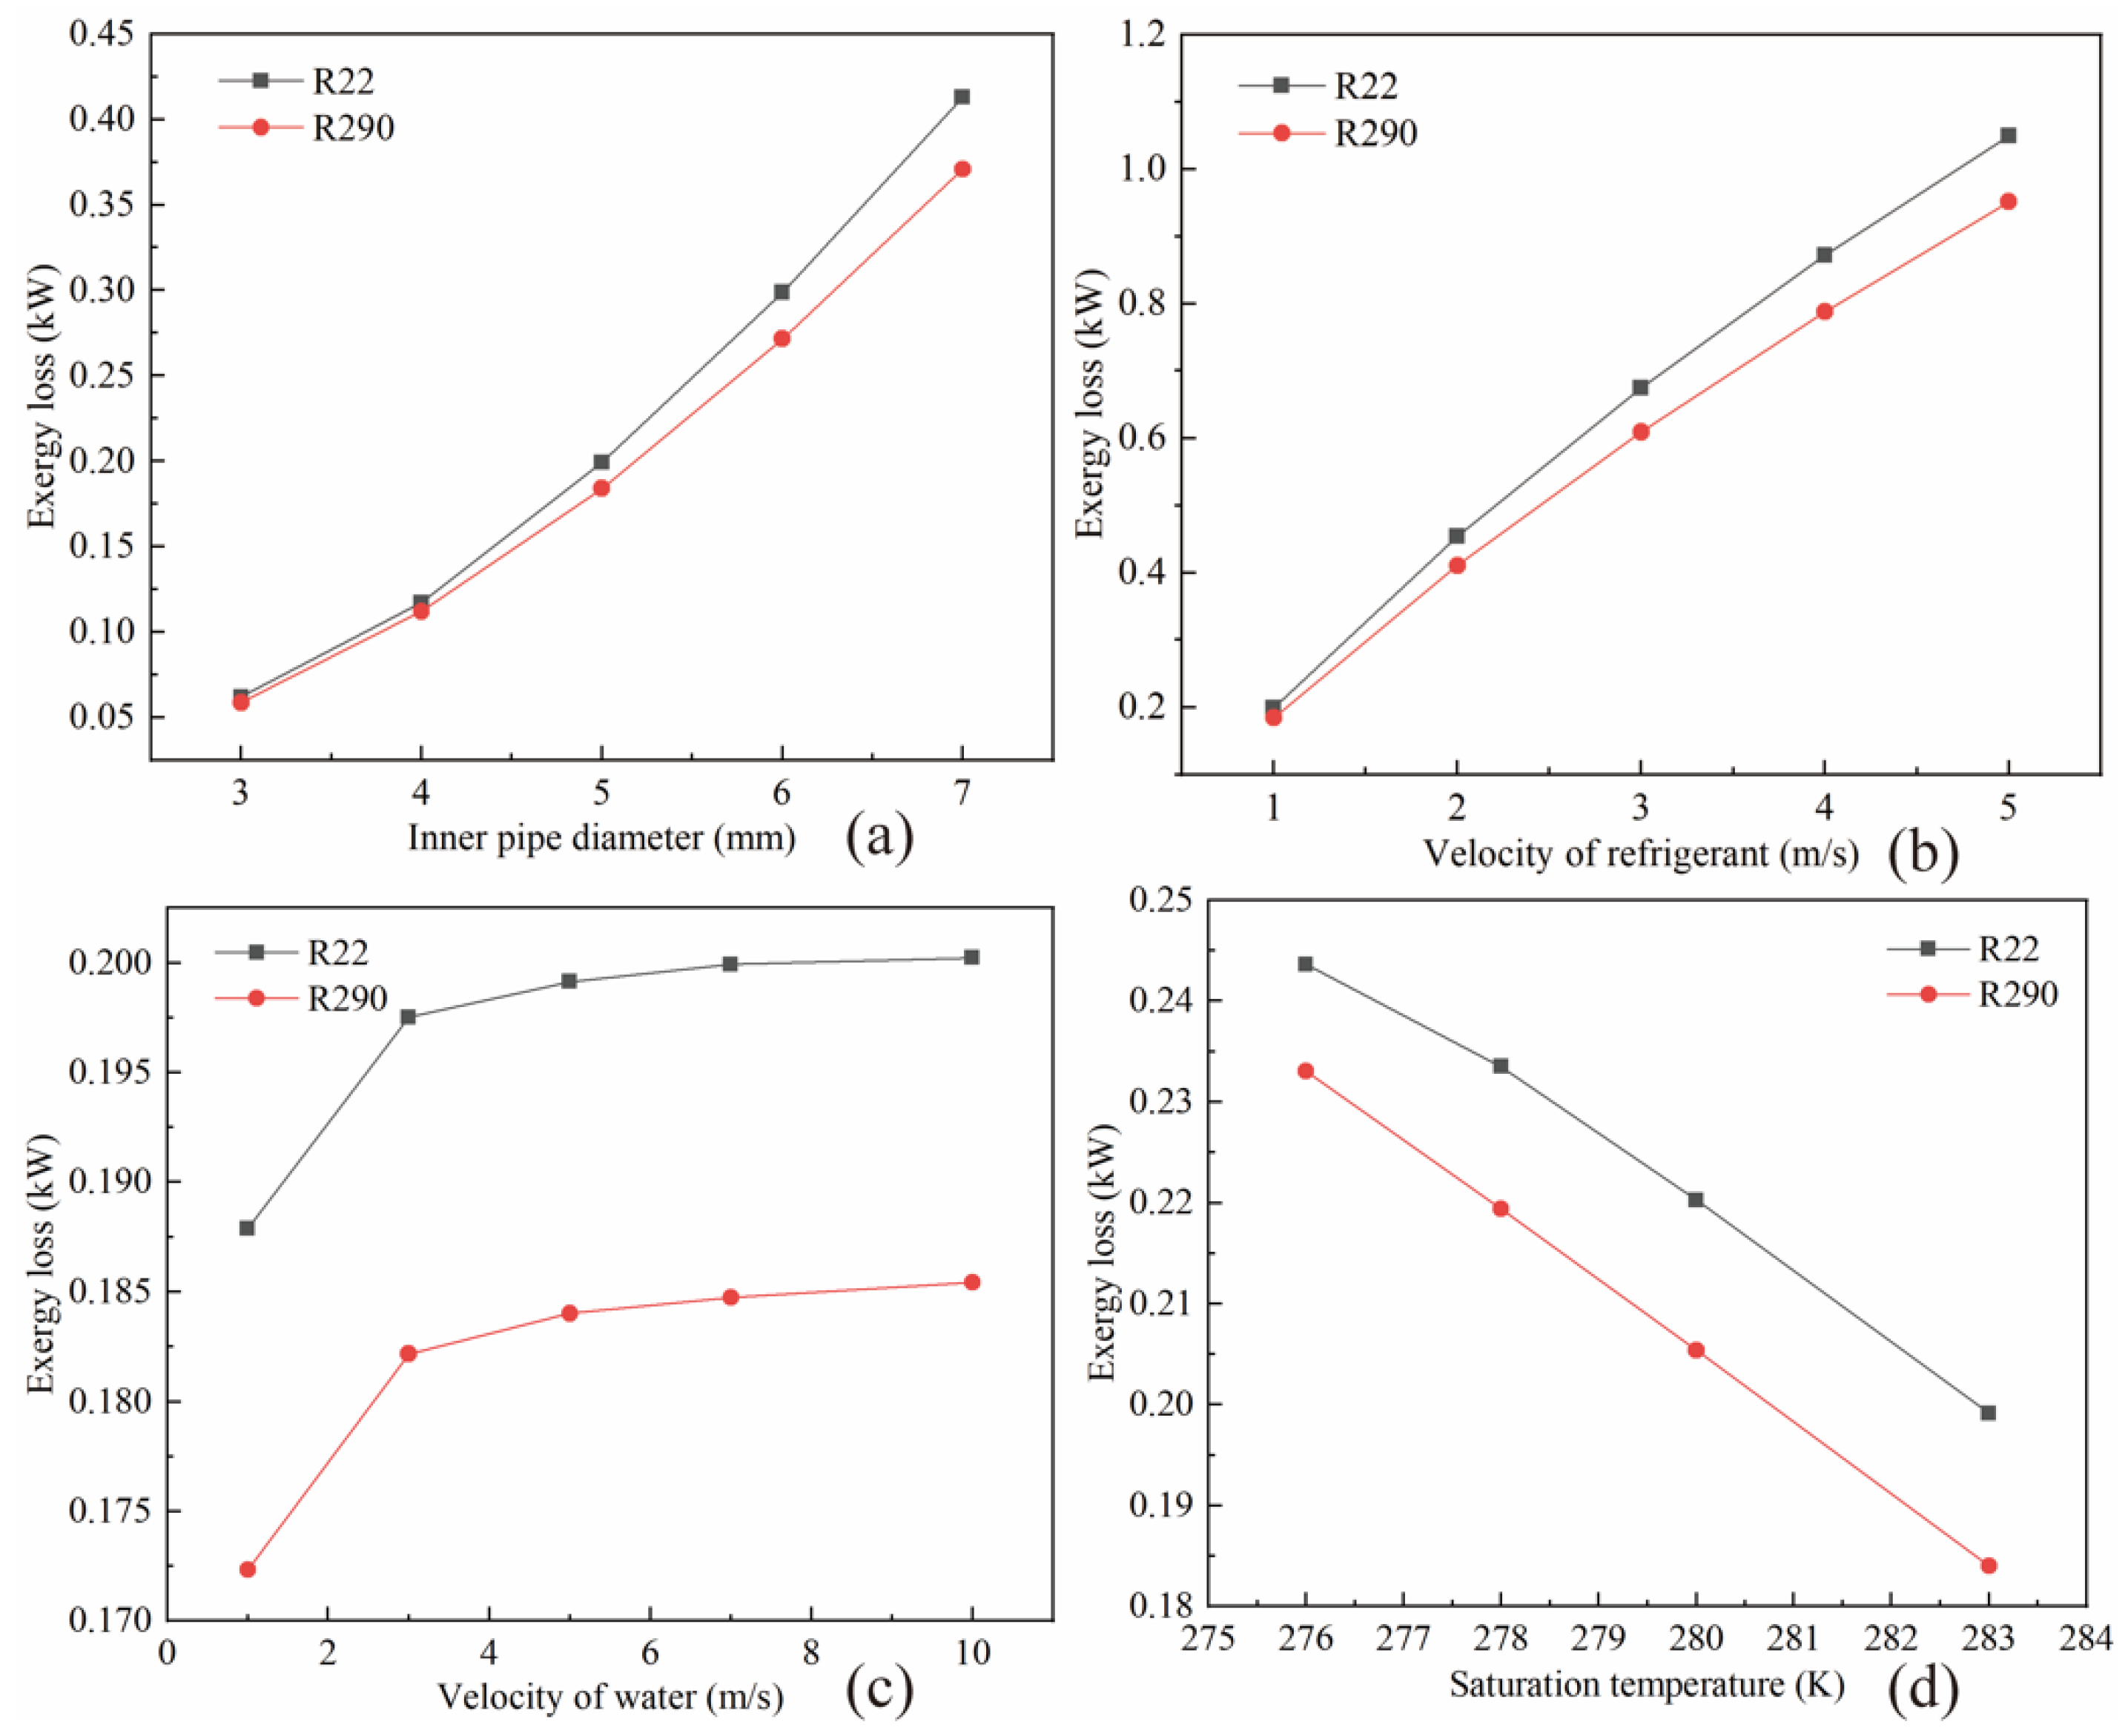
4.3. Exergy Loss Analyses
5. Conclusions
- (1)
- The maximum deviation between the numerical simulated values of HTC from the empirical equation of Liu and Winterton is 9%. The maximum deviation of the numerical simulated values of pressure drop from the empirical equation of Liu and Winterton is 9.1%.
- (2)
- The pipe diameter and refrigerant velocity have more significant impact on the HTC and the pressure drop of the R290 side. While water velocity and saturation temperature have slight impact on the HTC and the pressure drop of the R290 side.
- (3)
- With the operating conditions being the same, the exergy loss and pressure drop of R290 are 4.3–10.2% and 57.3–59.7% lower than that of R22, respectively.
- (4)
- The HTC of R290 is 11.83–13.31% lower than that of R22 at different conditions. But at the same refrigerant velocity, water velocity and saturation temperature, the HTC of R290 are 3.4%, 13.9%, 21.0% and 26.1% higher at the pipe diameter of 4 mm, 5 mm, 6 mm and 7 mm than that of R22 at the pipe diameter of 3 mm, respectively. And at the same refrigerant velocity, water velocity and saturation temperature, the HTC of R290 is larger than that of R22 when the velocity of R290 is more than that of R22. Therefore, the HTC of R290 can be improved by increasing the pipe diameter or the R290 velocity.
Author Contributions
Funding
Acknowledgments
Conflicts of Interest
Nomenclature
| C | thermal capacities | temperature ratio | |
| Cp | specific heat at constant pressure, (J/kg K) | v | Velocity, m/s |
| Cr | Work, kW | ||
| Di | Inner tube diameter, mm | mass-averaged velocity, m/s | |
| DO | Outer tube diameter, mm | Mixture density, kg/m3 | |
| E | enhancement factor | Volume fraction of the kth phase | |
| Ex | Total exergy, kW | Density of the kth phase, kg/m3 | |
| ExPH | physical exergy, kW | The velocity of the kth phase, m/s | |
| ExKN | kinetic exergy, kW | Mixed viscosity, Pa·s | |
| ExPT | potential exergy, kW | Drift velocity vector of the kth phase, m/s | |
| ExCH | chemical exergy, kW | Velocity of phase k relative to phase q, m/s | |
| Exergy loss, kW | Relative velocity, m/s | ||
| F | suppression factor | λ | Thermal conductivity, W/(m K) |
| Bulk force | ρ | Density, kg/m3 | |
| Turbulence kinetic energy of buoyancy | |||
| Turbulence kinetic energy of mean velocity gradients | ε | heat transfer efficiency | |
| H | Enthalpy of species, kJ/kg | ||
| Diffusive flux of species, kg/(m2·s) | |||
| Effective conductivity, W/m·K | Subscripts | ||
| Turbulent thermal conductivity, W/(m·K) | p | Secondary phase | |
| M | Molecular weight, kg/kmol | q | Primary phase |
| m | mass flux, kg/(m2s) | l | liquid |
| n | Number of phase | v | vapour |
| Prandtl number | c | Cold liquid | |
| Pf | Reduced pressure (absolute pressure/critical pressure) | h | Hot liquid |
| Q | Heat flux, W/m2 | i | inlet |
| Re | Reynolds number | o | outlet |
| Source terms | max | maximum | |
| s | Enthalpy, kJ/(kg·K) | min | minimum |
| Volumetric heat sources | |||
| Heat transfer coefficient, W/(m2·K) | |||
| T | Temperature, K | ||
References
- Berkah Fajara, T.K.; Restu Bagasb, P.; Ukhib, S.; Alhamidc, M.I.; Lubis, A. Energy and exergy analysis of an R410A small vapor compression system retrofitted with R290. Case Stud. Therm. Eng. 2020, 21, 100671. [Google Scholar] [CrossRef]
- Allymehr, E.; Pardinas, A.A.; Eikevik, T.M.; Hafner, A. Characteristics of evaporation of propane (R290) in compact smooth and microfinned tubes. Appl. Therm. Eng. 2020, 181, 115880. [Google Scholar] [CrossRef]
- Chien, N.B.; Vu, P.Q.; Choi, K.-I.; Oh, J.-T. Boiling Heat Transfer of R32, CO2 and R290 inside Horizontal Minichannel. Energy Procedia 2017, 105, 4822–4827. [Google Scholar] [CrossRef]
- De Oliveira, J.D.; Passos, J.C.; Copetti, J.B.; van der Geld, C.W.M. Flow boiling heat transfer of propane in 1.0 mm tube. Exp. Therm. Fluid Sci. 2018, 96, 243–256. [Google Scholar] [CrossRef]
- Pamitran, A.S.; Choi, K.-I.; Oh, J.-T.; Hrnjak, P. Experimental investigation on two-phase flow boiling heat transfer of five refrigerants in horizontal small tubes of 0.5, 1.5 and 3.0 mm inner diameters. Int. J. Heat Mass Transf. 2011, 54, 2080–2088. [Google Scholar]
- Oh, J.-T.; Pamitran, A.S.; Choi, K.-I.; Hrnjak, P. Characteristics of two-phase flow pattern transitions and pressure drop of five refrigerants in horizontal circular small tubes. Int. J. Refrig. 2010, 33, 578–588. [Google Scholar]
- Maqbool, M.H.; Palm, B.; Khodabandeh, R. Investigation of two phase heat transfer and pressure drop of propane in a vertical circular minichannel. Exp. Therm. Fluid Sci. 2013, 46, 120–130. [Google Scholar] [CrossRef]
- Lillo, G.; Mastrullo, R.; Mauro, A.W.; Viscito, L. Flow boiling heat transfer, dry-out vapor quality and pressure drop of propane (R290): Experiments and assessment of predictive methods. Int. J. Heat Mass Transf. 2018, 126, 1236–1252. [Google Scholar] [CrossRef]
- Lee, H.S.; Bansal, P.; Kim, J.D.; Yoon, J.I. Evaporating heat transfer and pressure drop of hydrocarbon refrigerants in 9.52 and 12.70 mm smooth tube. Int. J. Heat Mass Transf. 2005, 48, 2351–2359. [Google Scholar] [CrossRef]
- Mikielewicz, D.; Jakubowska, B. Prediction of flow boiling heat transfer data for R134a, R600a and R290 in minichannels. Arch. Thermodyn. 2014, 35, 97–114. [Google Scholar] [CrossRef]
- Bejan, A. A Study of Entropy Generation in Fundamental Convective. Heat Transfer. J. Heat Transfer. 1979, 101, 718–725. [Google Scholar] [CrossRef]
- Sheikholeslami, M.; Darzi, M.; Li, Z. Experimental investigation for entropy generation and exergy loss of nano-refrigerant condensation process. Int. J. Heat Mass Transf. 2018, 1087–1095. [Google Scholar] [CrossRef]
- Abu-Hamdeh, N.H.; Alimoradi, A. Investigation of the effect of the finned coiled wire insert on the heat transfer intensification of circular tube: Energy and exergy analysis. Chem. Eng. Process. 2021, 160, 108245. [Google Scholar] [CrossRef]
- Etghani, M.M.; Hosseini Baboli, S.A. Numerical investigation and optimization of heat transfer and exergy loss in shell and helical tube heat exchanger. Appl. Therm. Eng. 2017, 121, 294–301. [Google Scholar] [CrossRef]
- Liu, Z. A general correlation for saturated and subcooled flow boiling in tubes and annuli, based on a nucleate pool boiling equation. Int. J. Heat Mass Transf. 1991, 34, 2759–2766. [Google Scholar] [CrossRef]
- Xu, Y.; Fang, X. A new correlation of two-phase frictional pressure drop for evaporating flow in pipes. Int. J. Refrig. 2012, 35, 2039–2050. [Google Scholar] [CrossRef]
- Dincer, I.; Sahin, A.Z. A new model for thermodynamic analysis of a drying process. Int. J. Heat Mass Transf. 2004, 47, 645–652. [Google Scholar] [CrossRef]
- Ogulata, R.T.; Doba, F. Experiments and entropy generation minimization analysis of a cross-flow heat exchanger. Int. J. Heat Mass Transf. 1998, 41, 373–381. [Google Scholar] [CrossRef]
- Dincer, I. The role of exergy in energy policy making. Energy Policy 2002, 30, 137–149. [Google Scholar] [CrossRef]
- Bejan, A. Advanced Engineering Thermodynamics; John Wiley and Sons Inc: New York, NY, USA, 1988. [Google Scholar]
- McNeil, D.A.; Raeisi, A.H.; Kew, P.A.; Hamed, R.S. Flow boiling heat-transfer in micro to macro transition flows. Int. J. Heat Mass Transf. 2013, 65, 289–307. [Google Scholar] [CrossRef]
- He, G.; Zhou, S.; Li, D.; Cai, D.; Zou, S. Experimental study on the flow boiling heat transfer characteristics of R32 in horizontal tubes. Int. J. Heat Mass Transf. 2018, 125, 943–958. [Google Scholar] [CrossRef]
- Choi, K.-I.; Pamitran, A.S.; Saito, K.; Oh, J.-T. Pressure drop and heat transfer during two-phase flow vaporization of propane in horizontal smooth minichannels. Int. J. Refrig. 2008, 32, 837–845. [Google Scholar] [CrossRef] [Green Version]
- Jige, D.; Sagawa, K.; Inoue, N. Effect of tube diameter on boiling heat transfer and flow characteristic of refrigerant R32 in horizontal small-diameter tubes. Int. J. Refrig. 2017, 76, 206–218. [Google Scholar] [CrossRef]
- Lockhart, R.W. Proposed correlation of data for isothermal two-phase, two- component flow in pipes. Chem. Eng. Prog. 1949, 45, 39–48. [Google Scholar]
- Lillo, G.; Mastrullo, R.; Mauro, A.W.; Viscito, L. Flow boiling of R32 in a horizontal stainless steel tube with 6.00 mm ID. Experiments, assessment of correlations and comparison with refrigerant R410A. Int. J. Refrig. 2018, 97, 143–156. [Google Scholar] [CrossRef]


| Tube | Wall Thickness (mm) | L (mm) | Do/Di (mm) |
|---|---|---|---|
| External tube/internal tube | 0.21 | 2000/2000 | 9.42/3 |
| External tube/internal tube | 0.21 | 2000/2000 | 10.42/4 |
| External tube/internal tube | 0.21 | 2000/2000 | 11.42/5 |
| External tube/internal tube | 0.21 | 2000/2000 | 12.42/6 |
| External tube/internal tube | 0.21 | 2000/2000 | 13.42/7 |
Publisher’s Note: MDPI stays neutral with regard to jurisdictional claims in published maps and institutional affiliations. |
© 2021 by the authors. Licensee MDPI, Basel, Switzerland. This article is an open access article distributed under the terms and conditions of the Creative Commons Attribution (CC BY) license (https://creativecommons.org/licenses/by/4.0/).
Share and Cite
Wang, J.; Zhu, S.; Xie, J. Investigation of R290 Flow Boiling Heat Transfer and Exergy Loss in a Double-Concentric Pipe Based on CFD. Energies 2021, 14, 7121. https://doi.org/10.3390/en14217121
Wang J, Zhu S, Xie J. Investigation of R290 Flow Boiling Heat Transfer and Exergy Loss in a Double-Concentric Pipe Based on CFD. Energies. 2021; 14(21):7121. https://doi.org/10.3390/en14217121
Chicago/Turabian StyleWang, Jinfeng, Shenglin Zhu, and Jing Xie. 2021. "Investigation of R290 Flow Boiling Heat Transfer and Exergy Loss in a Double-Concentric Pipe Based on CFD" Energies 14, no. 21: 7121. https://doi.org/10.3390/en14217121