Abstract
With the rapid progress of socio-economic development and urbanization in China, a wide variety of literature has focused on the phenomenon of energy-consumption disparity, which in turn could be related to numerous fundamental energy dilemmas that China must deal with now or soon, including energy use inefficiency, regional energy shortage, insufficient use of green energy, etc. However, in most cases, only a tendency scenario is discussed, while identifying which factors are more likely to affect the improvement of energy supply/use has not yet been fully explored. Therefore, this paper attempts to explore differences in energy consumption in specific, household-level aspects. Based on the information provided by Chinese General Social Survey (CGSS2015), the Gini coefficient and the Lorentz asymmetry coefficient are used to measure the difference among various categories of energy type and end use within and between different geographical sub-groups. The findings show that: (1) household energy-consumption behaviors exhibit a complicated effect on the overall level of energy-consumption difference; (2) from the supply side, energy users show the most significant difference in biomass energy consumption, while from the demand side, the contribution of space heating to the difference in total energy consumption is the highest; (3) a great urban–rural difference in energy consumption is generally observed with its difference within rural areas being much greater than in urban areas; (4) the eastern, middle and western regions weight differently in explaining the overall difference of energy consumption. These findings provide meaningful materials and references for policymakers in China to understand the overall situation of individual energy consumption to a great extent, and to locate key points to reform the current energy policy framework.
1. Introduction
As the largest developing country in the world, China has also been the one with the largest increase in primary energy consumption for 15 consecutive years. While the total amount of energy consumed is mounting rapidly, the progress of socio-economic development results in a dramatic change in the structure of energy consumption. The increase of per capita income of urban and rural residents, alone with the progress of urbanization, inevitably create more demands for commercial energy resources e.g., electricity, instead of highly-pollutant, traditional energy sources e.g., coal [1,2]. At the same time, the consumption habit in traditional, highly-pollutant energy resources is still evidently prevalent in non-metropolitan or rural areas [3,4], which are less likely to be completely changed in a short time. Therefore, disparities in energy consumption/supply have become much increasingly significant, which in turn result in a host of collateral issues, such as a further increased socio-economic development gap across regions [5,6]. With this mind, understanding such a contradictory interaction between socio-economic development and stubborn/newly emerged energy-consumption patterns seems important for policymakers to formulate effective policy frameworks to optimize energy structure, as well as secure energy supply and promote environmental protection under the dominant milieu that both the goals of energy use/supply efficiency and a continuous increase in total energy consumed must be achieved. If key points that cause the present contradiction/disparity in energy consumption is identified, specific policymaking may be complementary to the reform of the present energy policy framework, wherein much attention has been given to macro perspectives such as traditional energy-consumption structure improvement or technological progress.
In our review of previous literature, extensive studies have investigated China’s consumption structure of energy from miscellaneous macro perspectives, such as efficiency estimation, structure change forecasting, etc. [7,8,9], or specific micro aspects such as households’ energy-consumption decisions [10,11]. It is noteworthy, however, that this strand of literature either bases on traditional statistical methods that only describes the relationship between energy-consumption data and influence factors or focuses on exploring the determinants of consumers’ behaviors. Few empirical studies have attempted to absorb how a micro level change affects the validity and rationality of overall energy-consumption structure at a macro level [12].
In addressing the above issue, this paper proposes a full-scale measure towards energy-consumption patterns in China. Specifically, we seek answers to the following questions: (a) how individuals’ energy-consumption decisions generally affect energy-consumption structure from supply and demand sides, (b) how individuals’ energy-consumption decisions are linked with spatial disparities in energy consumption, (c) through multidimensional comparisons, which factors have the greatest impacts on differences in energy consumption. The findings are expected to bring more insights concerning detailed features of energy consumption in miscellaneous aspects and to provide meaningful references and materials for policymakers in China or other counties with similar issues to cope with the challenge of unoptimized energy structure and energy waste.
There are three contributions of this study. First, compared to previous studies that focus on one or a few energy types, all major energy types and end uses are incorporated into the analytical framework, including coal, gasoline, natural gas, biomass energy, etc. To authors’ best knowledge, this study is one of few that holistically investigates the issue of energy-consumption disparities in the context of China. Second, the dataset the study adopts is Chinese General Social Survey (CGSS2015) (this is the up-to-date source, as no further waves, such as CGSS2017, containing energy information will be released) which contains a wide range of information regarding Chinese households’ perceptions and choices towards socio-economic issues. Unlike common causal or descriptive analyses, this study uses a bottom-up approach to categorize and estimate energy-consumption data. The methods of Gini coefficient and the Lorentz asymmetry coefficient further visualize and quantify how variations of specific energy types or end uses explain the total difference. This line of thought provides viable directions for further research to generate and utilize energy indicators based on micro-level datasets. Finally, as CGSS is a representative, weight-based dataset, the study proposes a “micro-macro” framework which, to a certain extent, integrates a multitude of fragmented concepts into one broadly defined framework and provides a clearer logic thread towards how individuals’ decisions form disparities in energy consumption among cities and regions. This provides a theoretical basis for improving the current energy policy.
This paper compares different types of energy in terms of standard units, based on Gini coefficient and Lorentz asymmetry coefficient, and further uses these two approaches to decompose consumption differences. The findings reveal that household energy-consumption behaviors have a complex impact on the overall level of energy-consumption differences, and they have different features with changing divisions such as in the context of urban and rural areas or among regions. The findings provide a range of policy implications, including proposing specific plans of energy transition for both urban and rural areas with different aims and scopes, reducing consumption disparities caused by biomass use or the demand for space-heating, and cultivating a public awareness of efficient energy-consumption behaviors, etc.
The rest of this paper is organized as follows. In Section 2, a clear research motivation is demonstrated based on the feature of present studies. In Section 4, the approaches for measuring disparities including Lorentz curve and Gini coefficient, which decompose differences according to subcategory weights, are presented. In Section 3, the process of data collection and indicator generation is given. The main empirical results and policy implications are discussed in Section 5, Section 6, Section 7, Section 8 and and the policy implications are discussed in Section 9, respectively.
2. Literature Review
2.1. Disparities in Energy Consumption and Determinants
Monitoring the level of energy efficiency has become increasingly crucial under the dominant milieu of global sustainable development [13]. Extensive research has proposed various methodologies to discuss and evaluate this issue, including production frontiers estimation [14], indicator-based approaches [15], or principal component analysis [16], etc., and the results generally confirm that energy supply or demand has strong spatial properties. Regional factors such as socio-economic development level, technological level, industrial level, urbanization degree, etc., determine features of energy efficiency [17,18].
In the context of China, figuring out spatial disparities in a sea of energy aspects has also aroused interests from scholars and practitioners, as the socio-economic development level and the distribution of resource endorsements are particularly unbalanced at the regional level [19]. Up to now, there has been an army of studies centered on the most representative proxy of energy efficiency i.e., energy consumption at aggregate levels. For instance, Li et al. (2014) [20] studied the common characteristics of regional energy intensity decomposition through the input–output method, revealing that, for developing and energy-exporting regions, transforming primary energy into high-value-added products would be beneficial for economic development and energy conservation. Liu et al. (2019) [21] argued that the contribution rate of eastern regions to the growth of energy consumption is gradually decreasing, while that of western regions has grown speedily, thus western China became the region with the highest level of energy consumption in China in 2010–2015. In comparison, a few scholars also attempted to understand such a disparity at the sectoral level, such as Chen et al. (2017) [22], who evaluated China’s production sector and residential sector CO2 emissions inequality; Yue et al. (2018) [23], who investigated industrial energy-intensity mitigation in the urban cluster of the Pearl River Delta in China; and Zhang et al. (2019) [24], who claimed that the energy demand from building sectors shows an annual increase of 7.6% since 2001 in China.
The above strand of literature confirms that the regional energy-consumption pattern, similarly to many other aspects of energy efficiency, varies from regions to regions in China. Moreover, exploring socio-economic factors that could affect energy-consumption patterns is increasingly common. Shi (2019) [25] used the Shapley value decomposition method to examine the role played by circumstances beyond the control of individuals—for instance, gender, hukou status, family background, and region of birth—in generating inequality in energy-consumption expenditure in China. The results show that hukou status and region of birth are the two largest contributors to inequality of opportunity across birth cohorts. Dong et al. (2018) [26] also used the Shapley value decomposition method to study the interprovincial differences in residential energy consumption between urban and rural areas in China. The empirical results indicate that income level has a positive impact on residential energy consumption in general, and income level is the most paramount factor that causes such differences. Zhou and Shi (2019) [27] stated that both the progress of urbanization and industrialization have had a profound impact on the difference in energy consumption of residents. Fan et al. (2020) [28] categorized urban and rural residents into groups, based on the input–output model, and examined the impact of consumption activities of residents with different income levels on China’s energy and water consumption. These conclusions further support that energy-consumption difference across cities and regions is also likely to be linked with notable features of individuals.
Among the aforementioned factors, household income appears to be a particularly typical indicator for measuring energy-consumption differences in China [29,30], which opens up new ideas for the study of energy-consumption differences from a micro perspective i.e., household level. However, there still exists a clear inconsistency between studies at macro levels and at micro levels. Macroscopic research mainly focuses on regional differences; on the contrary, microcosmic top-down data can readily overlook many energy sources that cannot be quantified into the system, such as biomass energy consumption. In contrast, microcosmic data can more easily reveal differences in energy consumption caused by different household consumption patterns; yet again, little if any holistic research has been undertaken on how consumption patterns of major energy sources vary in different spatial dimensions. Therefore, it remains unclear on how individuals’ consumption patterns vary in a broader context of socio-economic development and how these quite differential, dynamic behaviors affect regional disparity at the next level.
2.2. Hypotheses Development
In line with the seminal works mentioned above and the clear research gap regarding an in-depth understanding of the root cause of energy-consumption disparities in China, the following hypotheses are proposed. These hypotheses, to a large extent, contain the hotly discussed topics in the research domain of energy consumption in China that have not been fully explored using previous analytical frameworks.
First, previous studies have not clearly demonstrated how individuals’ consumption behaviors vary towards different energy types. Along with the progress of urbanization and socio-economic progress, the consumption of electricity is evidently higher than other energy types [31]. However, access to a particular energy source is likely to be different among individuals with different socio-economic levels. Therefore, even though the total volume of electricity consumed is undoubtedly higher, people’s consumption behaviors may be quite different (i.e., a high electricity-consumption level vs. a low electricity-consumption level among households), which in turn leads to a significant overall disparity. Therefore, it is interesting to verify hypothesis 1 below:
Hypothesis 1 (H1).
The difference in electricity consumption is higher than those of other energy types.
Next, there is a particularly important research gap, as consumption patterns are likely to be quite different from the supply side (energy types) compared to the demand side (end uses). As mentioned above, many previous studies only focus on the demand side, but differences in the supply side may also play an important role in explaining the total difference/disparity. Few studies have specifically investigated differences in energy consumption from this perspective, and there is no a straightforward answer to this question. Therefore, we propose hypothesis 2 below:
Hypothesis 2a (H2a).
From the perspective of end use, the difference in energy consumption is also significant.
Hypothesis 2b (H2b).
The consumption difference in end uses is generally greater than those in energy types.
Even though extensive studies have investigating spatial disparities/differences in energy consumption, these between group comparisons do not further take decomposition into consideration from both energy supply and demand perspectives. Therefore, this study attempts to reconcile this inconsistency and extend the existing literature by incorporating the contexts of “urban vs. rural” and “among different regions”, at the same time conducting a more elaborative and comprehensive analysis towards household energy-consumption behaviors, including various energy sources and end-use activities. With this model specification, consumption behaviors may exhibit varying effects in explaining the disparity/difference at different spatial levels [32,33,34]. Given that the present studies do not provide sufficient materials for understanding such a dynamic angle, we finally propose the following hypothesis:
Hypothesis 3a (H3a).
In rural areas, energy-consumption behaviors show different patterns in explaining disparities compared to that of urban areas.
Hypothesis 3b (H3b).
Similarly, energy-consumption behaviors show different patterns in explaining disparities among regions with different socio-economic status.
3. Data
3.1. Data Source
The data used in this study derives from the 2015 Chinese General Social Survey (CGSS) data of the Chinese National Survey Data Archive (CNSDA), which covers 478 villages in 28 provinces/cities/autonomous regions across the country. A total of 10,968 valid questionnaires were completed. The content of the questionnaire includes a core module, an economic attitude and behavior evaluation module, a work module, en energy module, and a legal system module, collecting interviewee’s information in the form of single-choice, multiple-choice, and fill-in-the-blank questions. This paper mainly uses the energy module of CGSS data.
This study uses CGSS data for the following reasons: To begin with, it has scientific investigation methods, rigorous data processing procedures, and complete data packages. There is one more point: its survey coverage is wide, covering almost the entire mainland of China, which is overwhelmingly representative [35]. Last but not least, it has accurate energy-consumption data. Its data set provides detailed information on equipment-level energy usage and consumption behavior, as well as energy consumption measured in various units, which fits the aim and scope of this study. As the data collection process is randomized, all observations in different regions are collected based on weights that represent probabilities for chosen observations in target populations. This is a common approach adopted by a variety of world-famous datasets such as the European Labour Forces Survey, the EU Structure Earning Survey, etc. The theory behind this design is that collected data is proportionate to its real, target population, thus associated findings and conclusions are widely applicable.
3.2. Data Collection
The data collection process contains the following steps: (1) screening out available observations. Samples with “unable to answer”, “refused to answer”, “don’t know”, and “other” options are deleted; at the same time samples with missing household registration (military, no household registration, and others) are deleted. The next step is to unify all data to calculate the variables that need to be used in the study, convert the data in non-standard units into standard units, and finally convert them into data in standard coal equivalent unit (kgce) [36]. Obtaining data divided by energy type, we first transform the total annual consumption of various energy sources into standard units (kg or cubic meters) and further shift such units into standard coal equivalent units (kgce) based on actual average calorific values of various energy types. Similarly, obtaining the data divided by end use, we multiply the use time, frequency, and power of each device to obtain the total annual energy consumption of each device (in kilowatt-hours), and then convert these units to standard coal equivalent units (kgce) based on conversion factors. Finally, categorizing observations according to appropriate standards is essential. When studying the difference in energy consumption between urban and rural areas, the sample is divided into urban and rural areas based on household registration information [37]; similarly, when studying regional differences, the sample is divided into eastern, central, and western regions based on their socio-economic development levels [38].
4. Methodology
4.1. Gini Coefficient and Lorentz Curve
The Gini coefficient is used to measure energy-consumption differences, and we visually express such differences through the Lorentz curve. The Lorentz curve and Gini coefficient are the most extensive analytical tools used to measure differences in economics literature [39]. The traditional Lorenz curve is a graph that shows uneven income distribution [40]. In the case of studying energy consumption, an energy Lorentz curve is a sorted distribution of the cumulative percentage on the horizontal axis and the cumulative percentage of energy consumption distributed along the vertical axis [41]. There have been a large number of studies that measure inequality through the Lorenz curve and Gini coefficient and have obtained meaningful results [42,43,44,45]. However, only a few ever used these approaches to calculate energy-consumption differences at a household level. This paper therefore inherits these principles and further applies them in such a context [46].
Under normal circumstances, a point on the energy Lorentz curve indicates that y% of the total energy is consumed by x% of people. Based on the energy Lorentz curve, the energy Gini coefficient is a numerical tool to analyze the level of difference. Mathematically speaking, the energy Gini coefficient can be defined as:
In Equation (1), X indicates the cumulative proportion of a population; Y indicates the cumulative proportion of energy consumption. Xi refers to the number of energy users in population group i divided by the total population, and Xi is indexed in non-decreasing order. Yi is the energy use of the population in group i divided by the total energy use. Yi sorts from the lowest energy consumption to the highest energy consumption. The Gini coefficient is a unitless measure, with a value ranging from 0 to 1, which provides a well-understood quantitative indicator for measuring differences. The greater the Gini coefficient, the greater the difference in energy consumption. A zero value of the Gini coefficient indicates complete equality, and all families receive an equal share. On the contrary, a Gini coefficient of 1 indicates complete inequality, and all energy is used by one unit.
4.2. Lorentz Asymmetry Coefficient
A considerable portion of the surveyed population does not use certain energy sources or certain end uses at all. In the part of the people who use them, it is not clear how uneven the distribution is through the visual observation of Lorentz curve. At this time, the Lorenz asymmetry coefficient (LAC) can be used to capture these features of uneven distribution [47]. LAC quantifies the visual impression, which can be used as a useful supplement to the Gini coefficient to assess the degree of asymmetry of a Lorentz curve and reveal which type of population contributes the most to the differences [48]. The coefficient (S) can be calculated as:
In Equation (2), indicates an average energy consumption; m indicates the number of individuals whose energy consumption is less than average; n indicates the total number of individuals; Lm indicates accumulative energy consumption of individuals whose energy consumption is less than average; Ln indicates accumulative energy consumption of all individuals; Xm indicates the mth data point in an ascending order.
The Lorentz asymmetry coefficient can reveal the distribution structure of data and determine the degree of contribution of values of different levels of individuals to the overall unevenness [47]. If the point of Lorentz curve parallel to the line of symmetry is located below the axis of symmetry, then S < 1, which means that the low value in the data significantly contributes to the uneven distribution, that is, the contribution of users with low energy consumption is greater. Correspondingly, if the point of Lorentz curve parallel to the line of symmetry is located above the axis of symmetry, then S > 1, indicating that the high value in the data contributes to the unevenness, that is, the uneven distribution is mainly caused by a small quantity of users who have large energy consumption. When the point of Lorentz curve parallel to the line of symmetry happens to fall on the axis of symmetry, then S = 1. At this moment, the Lorentz curve is symmetric, indicating that a high value and a low value equally contribute to the unevenness.
4.3. Decomposing Gini Coefficient by Energy-Consumption Composition
After measuring the Gini coefficient by energy type and end-use activity, this study decomposes the energy-consumption Gini coefficient to obtain the contribution of each consumption difference to the total difference and to understand how each consumption affects the total energy-consumption difference. If the total consumption Y is composed of k items of energy consumption, Y1, Y2, Y3,…, Yk, the corresponding average values of k items are μ1, μ2, μ3,…, μk, and the average total consumption is μ [48].
In Equation (4), G(Y) indicates a Gini coefficient of total consumption; Si indicates a proportion of consumption source in total consumption; C(Yi) indicates a concentration coefficient of factor source i. According to this decomposition method, the weighted average of energy-consumption concentration coefficients of each sub-item is a Gini coefficient. Therefore, the decomposition formula of Gini coefficient can be further decomposed as [41]:
In Equation (5), G(Yi) indicates the Gini coefficient of a consumption source i; Ri indicates correlation coefficients of each consumption source. At this time, the concentration coefficient C(Yi) = G(Yi)Ri represents the degree of difference in the energy consumption of sub-items and also expresses the correlation between Yi and total consumption. The coefficient takes a value between −1 and 1.
According to the above decomposition, SiG(Yi)Ri can be used to express the contribution of consumption sources i to a total consumption difference. This method allocates a total difference into each subcategory, which is helpful in estimating what extent does a subcategory explain an overall difference. However, it is worth mentioning that subcomponents must have a same measurement unit to ensure they can be added up [49,50]. This method is used to decompose Gini coefficient by energy types (coal, gasoline, diesel, bottled liquefied gas, pipeline natural gas, pipeline gas, biomass energy, electricity) and end-use activities (cooking, household appliance power supply, plumbing, space heating, and space cooling).
4.4. Decomposing Gini Coefficient by Urban–Rural Areas and Regions
The data can be divided by urban–rural and regional subgroups, and accordingly, the calculation of Gini coefficient can be further rearranged as below [51]:
ni/n indicates the proportion of group i in a total population; wi indicates the proportion of group i in the total consumption; Gi indicates the Gini coefficient of group i; Gwithin indicates the difference contribution within group i; Gbetween indicates the difference contribution among groups; Goverlap indicates the difference intensity contribution among groups.
Intergroup difference contribution Gwithin implies the contribution of difference within the group i to the total difference; the intergroup difference contribution Gbetween implies the contribution of difference between each group to the total difference. The larger the number of groups, the greater a difference contribution among groups. The difference intensity contribution among groups, as known as the overlap effect, depends on the frequency and degree of overlap between the energy consumption of different groups. If the range of household energy consumption does not overlap, it will have a zero value. For example, if the highest power consumption of one group is lower than the lowest power consumption of another group, the overlap effect is equal to zero.
5. Differences in Energy Consumption by Energy Types
5.1. Descriptive Statistics
Measuring the difference in household energy consumption, this study divides energy consumption into coal, gasoline, diesel, bottled liquefied petroleum gas, pipeline natural gas, pipeline gas, biomass energy, and electricity from the perspective of supply. The unit of standard coal equivalent unit (kgce) is used for descriptive statistics.
As shown in Table 1, less than 100 households use pipeline gas, such as gasoline, diesel, and pipeline gas, which accounts for less 10% of the total sample. The consumption of coal and pipeline natural gas account for 14.87% and 7.40% of the total energy consumption, respectively. The ratio of households using biomass energy is only 22.75%, nevertheless it accounts for 48.79% of the total energy consumption. The electricity penetration rate reaches 99.76%; however because the average household consumption level is not high, it accounts for only 17.62% of the total energy consumption.

Table 1.
Descriptive statistics of each energy type.
5.2. Analysis Based on Gini Coefficient and Lorentz Asymmetry Coefficient
After studying the internal differences of various energy sources, Gini coefficients, and Lorentz curves are incorporated into one coordinate system for intuitive comparison. The results are shown in Figure 1 and Table 2 respectively.
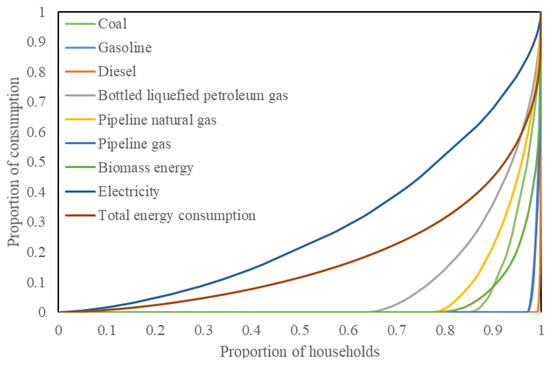
Figure 1.
Lorentz curve by energy types.
Table 2.
Gini coefficient by energy types.
In Figure 1, except for electricity, the proportion of households using other energy types is less than half. Table 2 further reveals that this has caused the Gini coefficient of bottled liquefied gas and pipeline natural gas to reach 0.8 or more. Surprisingly, the Gini coefficient of coal, gasoline, diesel, pipeline gas, and biomass energy even reached 0.9 or more. The Lorentz asymmetry coefficients of coal, gasoline, diesel, bottled liquefied gas, and electricity are all less than 1, indicating that households with low energy consumption are the main reason for the difference in energy consumption of the above types; the Lorentz asymmetry coefficients of pipeline natural gas, pipeline gas, and biomass energy are all greater than 1, indicating that the difference in consumption of the above-mentioned types of energy is mainly caused by the massive consumption from a small number of top consumers.
Moreover, observing Lorentz curves of coal and biomass energy cross, the number of households using biomass energy is greater than that of coal, and the Gini coefficient of biomass energy is even greater, which shows that the internal difference of energy users of biomass energy is greater than that of coal energy users. Combined with the Lorentz asymmetry coefficient, it appears that the large amount of energy consumed by top consumers of biomass energy is the cause. Returning to the original data, it can be found that the top 20 households with the highest total energy consumption and the top 20 households with the highest biomass energy consumption in the overall sample are highly overlapped (16 households overlap each other), and the biomass energy used by these families is all firewood and straw. Ultimately, it needs to be pointed out that the Gini coefficient of electricity consumption is only 0.43, and almost all households have electricity consumption, which shows that the popularity of household electricity in China has a huge advantage over other energy sources.
The overall Gini coefficient is further decomposed by energy types. As shown in Figure 2, biomass energy accounts for 71.77% of the total energy-consumption difference, which is the most significant reason for the total energy-consumption difference, followed by coal (17.7%), electricity (7.19%), and gasoline (1.41%), and the contribution of the fewest energy sources is less than 1%. These findings reveal that Chinese households have differentiated energy-consumption behaviors regarding the consumption of electricity, as the dominant energy type that have been discussed by a sea of previous studies do not exhibit a significant difference [28,31]. Therefore, H1 is rejected
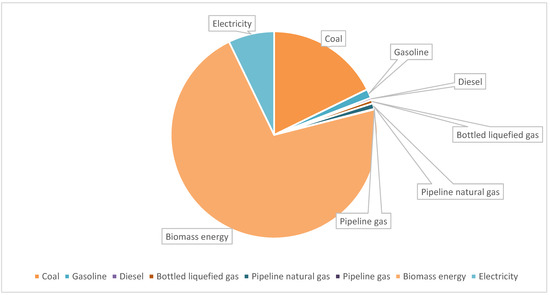
Figure 2.
Decomposing Gini coefficients by energy types.
6. Differences in Energy Consumption by End Uses
6.1. Descriptive Statistics
This section divides energy consumption into five categories according to end use types i.e., cooking, household appliance power supply, plumbing, space heating, and space cooling. The unit also refers to standard coal equivalent unit (kgce) for studying the difference in household energy consumption from the demand side.
The descriptive statistics depicts that the penetration rate of power supply for household appliances reached 99.83% consumption, which however only accounted for 12.16% of total consumption due to the low average usage. The situation of cooking is similar to that of home appliances, which constitute 65.13% of households’ demand for energy for cooking, yet this only accounts for 5.51% of the total energy consumption. More than half of households use water heating and space cooling, and their consumption accounts for 13.01% and 24.52%, respectively. Households with space heating requirements account for 44.69% of the total. The average consumption of this item reaches 743.95 kgce, which is higher than the average of the total energy consumption. The descriptive statistics results are demonstrated in Table 3:
Table 3.
Descriptive statistics of end use.
6.2. Analysis Based on Gini Coefficient and Lorentz Asymmetry Coefficient
Measuring the internal differences of various end uses, the Gini coefficients are calculated separately, and the Lorentz curve is incorporated into one coordinate system for intuitive comparison. The results are illustrated in Figure 3 and Table 4 respectively.
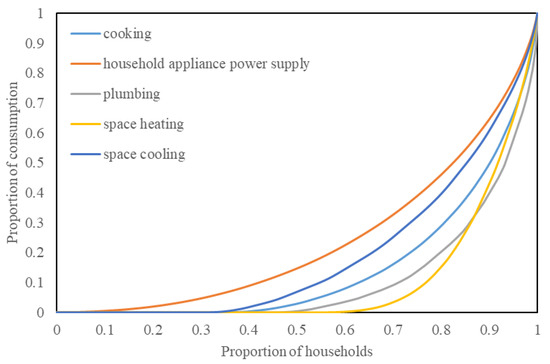
Figure 3.
Lorentz curve by end use.
Table 4.
Gini coefficient by end use.
Combining the findings of Figure 3 and Table 4, the Gini coefficients of cooking, plumbing, and space heating are all above 0.7. Space heating has the highest Gini coefficient of 0.79, mainly for the reason that about 55% of households do not have energy consumption for space heating. This can be deemed realistic, as people are less likely to possess an active or passive space heating system in the southern regions where it is comparatively warmer in winter. In comparison, the Gini coefficient for space cooling is only 0.61, as people all have the demand for space cooling regardless of locations. Also, the Gini coefficient for household appliance power supply is only 0.52 [52]. At the same time, the Lorenz asymmetry coefficient is less than 1 for all types of end uses, indicating that there are no top consumers with excessive energy consumption in terms of end uses (demand) and that the main reason for the difference in energy consumption is the presence of a large number of small users.
6.3. Analysis Based on Decomposing Gini Coefficient
As described in Figure 4, the contribution of space heating to the difference in total energy consumption is more than half, reaching 56.29%, firstly because space heating has the highest Gini coefficient and secondly owing to the proportion of space heating in the total consumption reaching 44.84% [53]. The Gini coefficient for space cooling is higher than that for household appliance power supply at 0.61 but contributes 22.18% to the difference in total energy consumption due to its much higher consumption than cooking, household appliance power supply, and plumbing. In comparison, cooking contributes only 3% to the total energy-consumption difference, as its share is small.
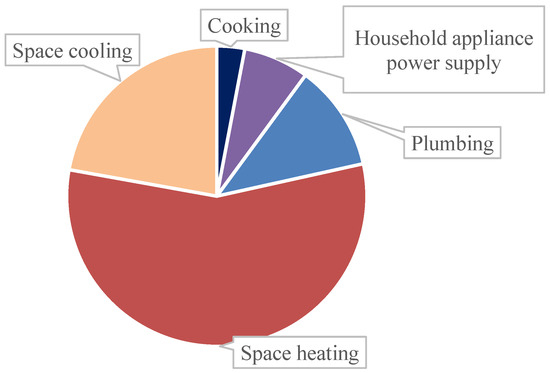
Figure 4.
Decomposing Gini coefficients by end use.
In summary, it appears that households’ consumption differences are also significant and complicated in terms of energy end uses. Therefore, H2a can be verified. However, the Gini coefficients of energy end uses are generally lower than those of energy types, implying that households’ behavioral differences in energy consumption from this perspective is lower. Consequently, H2b is rejected. Most of the research on the difference in energy consumption for end uses is carried out on one type of end use, such as electricity or heating [49,50]. This section compares the end uses commonly observed in households and reveals that varying types of end uses have different contributions to inequality.
7. Energy-Consumption Differences in Urban–Rural Areas
In this section, gasoline, diesel, and pipeline gas were excluded from the analysis as the number of households using them was too small to accurately reflect urban–rural differences, thus six indicators were finally selected: coal, bottled liquefied gas, pipeline natural gas, biomass energy, electricity, and total energy consumption, which were all measured in standard coal equivalent unit (kgce).
7.1. Analysis Based on Gini Coefficient and Lorenz Curve
The Gini coefficients are calculated separately, and Lorenz curves are drawn for each indicator to visualize the differences. The results are shown in Figure 5 and Table 5, respectively.
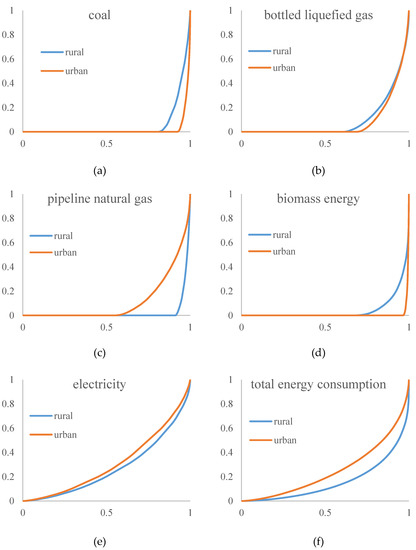
Figure 5.
Lorenz curves by rural and urban area.
Table 5.
Gini coefficient by rural and urban area.
The findings show that rural electricity consumption differences are slightly higher than that of urban users, but both are at a lower level. Compared to electricity consumption, total energy consumption shows a greater urban–rural difference, with its difference within rural areas being much greater than in urban areas. The difference between the urban and rural Lorenz curves for bottled liquefied gas is very minor. The overall Gini coefficients for both coal and biomass exceed 0.9, and because both have higher penetration rates in rural area, their Gini coefficients in rural area are both lower. Pipeline natural gas has a penetration rate of 45.19% in urban areas, yet only 8.79% in rural areas, resulting in greater intrarural difference than intraurban difference. It is a similar case for coal and biomass too. In addition, Table 3 shows that the Lorenz asymmetry coefficients for coal, bottled liquefied gas, pipeline natural gas, and biomass energy are all less than 1, implying that these differences are mainly produced by many users with a low level of energy consumption.
7.2. Analysis Based on Decomposing Gini Coefficient
After studying the relationship between the overall Gini coefficient and the urban–rural Gini coefficient and further investigating the source of such a difference, the overall Gini coefficient is decomposed as below:
In Figure 6, more than half of the total energy-consumption difference derives from within the rural areas. The structure of the sources of difference for coal, bottled liquefied gas, and electricity is very similar, all deriving primarily from intrarural household differences. The structure of differences in biomass energy reveals the most extreme urban–rural differences, because only an intensely small number of households use biomass energy in urban areas.
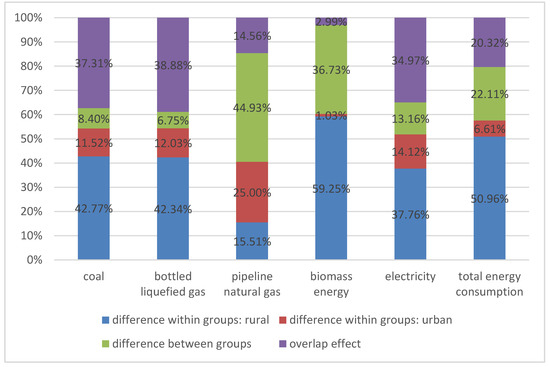
Figure 6.
Decomposing Gini coefficients by rural and urban areas.
Pipeline natural gas is the only energy type wherein the contribution of intraurban difference is greater than the contribution of intrarural difference, because pipeline natural gas is used by nearly 50% of households in urban areas but just under 10% in rural areas, with urban consumption being more than three times greater than rural consumption. At the same time, the contribution of between-group difference of pipeline natural gas is 44.93%, the highest of the six indicators, indicating that there are significant differences in the household consumption of natural gas between rural and urban areas.
Comparing the six indicators horizontally, it can be found that, in addition to pipeline natural gas, internal differences in rural areas have always been the main cause of overall differences. In terms of differences between groups, the differences of pipeline natural gas and biomass energy are large. The urban–rural differences in coal, bottled liquefied gas, and electricity are all small, claiming that urban and rural households have no significant difference in the three types of energy consumption, and urban and rural factors are not the main factors affecting consumption. There have been an ocean of studies on the difference in energy consumption between urban and rural areas, but most of them are carried out from a macro perspective, such as Dong et al. (2018) [26] and Fan et al. (2020) [28]. More importantly, this section integrates urban–rural differences with intraurban differences and intrarural differences and has a more comprehensive discussion, revealing that the different energy types have different patterns in the relationship between differences within groups and differences between groups. Considering all above, it is evident that with further decomposition between urban and rural areas, new trends and features have emerged, in addition to the solid findings obtained by H1 and H2. Therefore, H3a is confirmed, and this result implies the complex and dynamic feature of energy-consumption patterns in China.
8. Energy-Consumption Differences among Regions
8.1. Analysis Based on Gini Coefficient and Lorenz Curve
This study also divides the sample into east, middle, and west based on geographic location and development stage, choosing electricity consumption (in standard coal equivalent unit), energy consumption (in standard coal equivalent unit), and energy expenditure (in yuan), which can reflect the development status to measure the energy difference within and between the eastern, middle, and western groups. Electricity is the only type of energy selected because electricity can well represent regional development, while other types of energy are more susceptible to non-regional factors [54]. The results are shown in Figure 7 and Table 6 respectively.
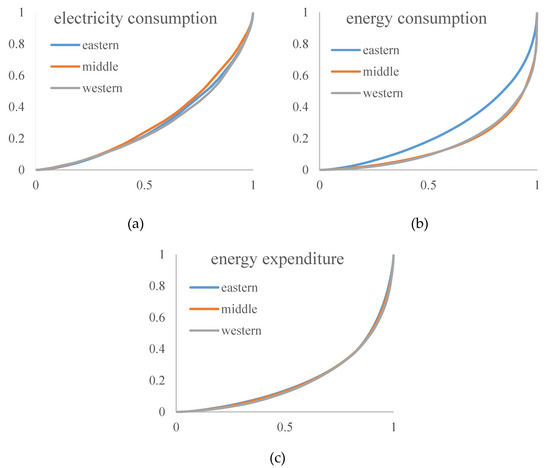
Figure 7.
Lorenz curve by region.
Table 6.
Gini coefficient by region.
The difference in energy expenditure between the east, the middle, and the west is small, and their Lorentz asymmetry coefficients are all greater than 1, indicating that the differences are mainly composed of a few top consumers. When it comes to energy consumption, the Gini coefficient of the eastern region is significantly lower than that of the middle and western regions, besides their Lorentz asymmetry coefficients are all greater than 1, indicating that the main reason for the difference is the presence of a small number of top consumers of biomass energy located in the middle and western regions. Regarding electricity consumption, the middle Gini coefficient is the lowest, and the Lorentz asymmetry coefficient is the closest to 1, indicating that households in the middle region consume relatively even electricity.
8.2. Analysis Based on Decomposing Gini Coefficient
For further determining the source of such differences, the Gini coefficients of the sample population is decomposed as below:
Figure 8 shows, regarding electricity consumption, that the contribution of difference in the eastern region is greater than the sum of the middle and western regions, which is mainly because the eastern region has a more developed economy that demands more electricity. When it comes to energy consumption, the contribution of the difference in the middle region is greater than the sum of the eastern and western regions. This is mainly because the middle region includes a larger agricultural population and associated industrial sectors, which are likely to consume more energy [55]. In terms of energy expenditure, the contribution of difference in the eastern region is greater than the sum of the middle and western regions, since eastern households use more energy they must pay for, such as electricity; however, middle households use more energy that they do not need to pay for, such as biomass energy [56].
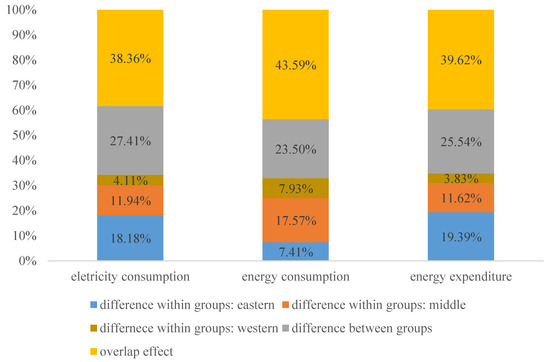
Figure 8.
Decomposing Gini coefficients by region.
Moreover, it is evident that households in the middle and western regions tend to obtain and use biomass energy without payment, which causes the average electricity consumption and energy expenditure in the eastern region to be higher than those in the middle and western regions; however, the average energy consumption is only one-half of that of the middle and western regions. Furthermore, the differences between groups and overlapping effects of the three sets of data are relatively stable, and the contributions of the intergroup effect differences are all higher than the internal differences of each group, reflecting the uneven developmental level among the east, middle, and west.
In summary, after measuring regional differences in energy consumption, we harbor the idea that most regional studies use total energy consumption as a proxy. In comparison, we further add a measure of electricity consumption and energy expenditure to the existing analytical framework. The findings show that the difference in electricity consumption and energy expenditure in the eastern region is both greater than that in other regions. Compared to the existing studies that use energy intensity [20] or contribution rate to growth to measure consumption differences [21], this study provides an alternative measure for understanding regional disparities in energy consumption. These findings also support H3b, as energy-consumption behaviors indeed show different patterns in explaining disparities among regions with different socio-economic statuses in China.
9. Conclusion and Policy Implications
9.1. Conclusions
Considerable literature has shown a prevalence of energy-consumption differences at different aggregate levels in China. However, it is unclear whether individual energy-consumption behaviors could explain such a well-documented difference. For understanding the contradictory interaction between socio-economic development and stubborn/newly emerged energy-consumption patterns and identifying the key points that cause the present contradiction/disparity in energy consumption, the Gini coefficient and the Lorentz asymmetry coefficient are used in this research to measure consumption differences among various categories of energy type and end use, and within and between different geographical sub-groups, based on the household energy-consumption data provided by Chinese General Social Survey (CGSS2015). Through verifying Hypotheses 1–3, the core findings can be refined as: (1) household energy-consumption behaviors exhibit a complicated effect on the overall level of energy-consumption difference; (2) from the supply side, energy users showed the most significant difference in biomass energy consumption, while from the demand side, the contribution of space heating to the difference in total energy consumption is the highest; (3) a great urban–rural difference in energy consumption is generally observed, with its difference within rural areas being much greater than in urban areas, and again, biomass energy reveals the most extreme urban–rural differences; (4) finally, the disparity in socio-economic development also explains the energy difference among regions. These findings, to a certain degree, are consistent with previous studies that confirm relationships between energy-consumption patterns and socio-economic features in China (e.g., [57,58,59,60,61]. Nevertheless, solid evidence is also provided in understanding its complexity and dynamic, as consumers’ specific energy-consumption choices and behaviors are found to be decisive in determining energy-consumption differences at multiple levels. This study contributes to making a judgment on the nature of China’s current energy-consumption structure and identifying the key problematic indicators.
9.2. Policy Implications
It has to be admitted that the present difference in energy consumption, to a great extent, is related to economic, historical and political issues accumulated in the past 70 years since the founding of P.R.China. However, the findings of this study provide an accurate estimation of energy-consumption structure in China, thus helping policymakers to adjust and optimize energy consumption based on notable spatial features and ultimately reach a balance point among environment, energy use, and socio-economic development. In the first place, there is an urgent need to propose a coherent plan of energy transition for both urban and rural areas with different aims and scopes. The priorities of local governments are to promote and popularize an efficient use of biomass energy in rural areas [62] and to guide the cooperation between rural households and enterprises in the biomass energy industry to facilitate the green use of biomass energy together. In comparison, the Chinese characteristic layout with a heating system in the northern and southern urban regions cannot be easily changed in a short time, but since it is vital in determining the overall consumption difference, a step-by-step adjustment is still imperative, such as the promotion of clean energy heating systems, e.g., geothermal heating, etc., which could gradually lead to less demand from urban households using traditional, highly pollutive energy sources. Second, it is also indispensable to cultivate a public awareness of efficient energy-consumption behaviors. For instance, more stringent energy-using standards should be implemented in areas with a high level of energy access and high energy consumption [63], which would enlighten users to consume energy in a wiser way. Finally, imposing energy subsidies may be a viable policy option to compensate for the living expenses of low-income households in rural and urban areas [64], but having a long-run and progressive policy framework towards a more egalitarian distribution of energy resources and associated national wealth should be brought into schedule [65,66].
There are some limitations in this study. To begin with, Chinese General Social Survey (CGSS2015) is the only up-to-date dataset that we could utilize for this analysis. Thus, it is worth mentioning that individuals’ energy-consumption behaviors may have slightly changed in the last 5–6 years. Moreover, only differences in terms of energy supply and end use were discussed, hence further linking these energy-consumption patterns to cleaner energy use can be a viable research direction. Finally, it is ideal to have an empirical analysis among different countries. However, due to inconsistency regarding sampling method, statistical caliber, etc., indicators for research in future need to be generated at a more comparable, harmonized level.
Author Contributions
L.Y., K.Z. conceived of this study and participated in the design, administration of the study, and performed the data analysis. K.Z. and Y.Z. drafted the manuscript. K.Z. and M.Z. revised the manuscript at several stages of the writing process. All authors have read and agreed to the published version of the manuscript.
Funding
This research is funded by the project of high-quality development of service trade in Shaanxi pilot free trade zone, supported by Shaanxi pilot free trade zone.
Institutional Review Board Statement
Not applicable.
Informed Consent Statement
Not applicable.
Data Availability Statement
The data presented in this study are available on request from the corresponding author.
Acknowledgments
We appreciate the anonymous reviewers who added value to this paper by providing feedback.
Conflicts of Interest
The authors declare no conflict of interest.
References
- Hasan, S.A.; Mozumder, P. Income and energy use in Bangladesh: A household level analysis. Energy Econ. 2017, 65, 115–126. [Google Scholar] [CrossRef] [Green Version]
- Cao, J.; Ho, M.S.; Liang, H. Household Energy Demand in Urban China: Accounting for Regional Prices and Rapid Income Change. Energy J. 2016, 37, 87–110. [Google Scholar] [CrossRef]
- Liu, L.; Yin, C. Gray relational analysis of energy consumption and energy structure in rural areas of China during 1999–2010. Acta Agric. Zhejiangensis 2014, 26, 503–509. [Google Scholar]
- Wang, X.; Zhu, L.; Qian, Y.; Tang, L. Rural Household Energy Consumption in Jiangsu Province Of China. Energy Environ. 2015, 26, 631–642. [Google Scholar]
- Jie, S.; Feng, W. The Impact Assessment of Bio-energy Construction Project on Sustainable Development of Eco-economic of China. In Proceedings of the 2nd International Conference on Risk Management and Engineering Management, Beijing, China, 4–6 November 2008. [Google Scholar]
- Huang, C.; Zhang, Z.; Li, N.; Liu, Y.; Chen, X.; Liu, F. Estimating economic impacts from future energy demand changes due to climate change and economic development in China. J. Clean. Prod. 2021, 311, 127576. [Google Scholar] [CrossRef]
- Jiang, P.; Yang, H.F.; Li, H.M.; Wang, Y. A Developed Hybrid Forecasting System for Energy Consumption Structure Forecasting based on Fuzzy Time Series and Information Granularity. Energy 2021, 219, 119599. [Google Scholar] [CrossRef]
- Liu, Z.Q.; Tang, Y.F.; Zhou, H.R.; Yang, S. Life Cycle Performance of a Distributed Energy System in Comparison with a Conventional Energy System for District Heating and Cooling in China. J. Clean. Prod. 2020, 288, 125663. [Google Scholar] [CrossRef]
- Yang, G.M.; Zhang, F.; Zhang, F.T.; Ma, D.L.; Gao, L.; Chen, Y.; Luo, Y.; Yang, Q. Spatiotemporal Changes in Efficiency and Influencing Factors of China’s Industrial Carbon Emissions. Environ. Sci. Pollut. Res. 2021, 28, 1–15. [Google Scholar] [CrossRef]
- Du, Y.M.; Ma, T. Impact of Electricity Pricing Strategy on Residential Energy Consumption Decisions in China: Empirical Evidence from a Household Survey. J. Environ. Econ. Policy 2021, 1–18. [Google Scholar] [CrossRef]
- Zou, B.L.; Luo, B.L. Rural Household Energy Consumption Characteristics and Determinants in China. Energy 2019, 182, 814–823. [Google Scholar] [CrossRef]
- Jiang, L.; Xue, B.; Liu, H. Quantifying Energy Consumption In Household Surveys And Empirical Research. Renesable Energy Resour. 2021, 39, 885–892. [Google Scholar]
- Ding, N.; Pan, J.; Liu, J.; Yang, J. An Optimization Method for Energy Structures based on Life Cycle Assessment and Its Application to the Power Grid in China. J. Environ. Manag. 2019, 238, 18–24. [Google Scholar] [CrossRef] [PubMed]
- Mardani, A.; Zavadskas, E.K.; Streimikiene, D.; Jusoh, A.; Khoshnoudi, M. A Comprehensive Review of Data Envelopment Analysis (DEA) Approach in Energy Efficiency. Renew. Sustain. Energy Rev. 2017, 70, 1298–1322. [Google Scholar] [CrossRef]
- Evans, A.; Strezov, V.; Evans, T.J. Assessment of Sustainability Indicators for Renewable Energy Technologies. Renew. Sustain. Energy Rev. 2009, 13, 1082–1088. [Google Scholar] [CrossRef]
- Arbolino, R.; Boffardi, R.; De Simone, L.; Ioppolo, G. Who Achieves the Efficiency? A New Approach to Measure Local Energy Efficiency. Ecol. Indic. 2020, 110, 105875. [Google Scholar] [CrossRef]
- Huang, G.; Ouyang, X.; Yao, X. Dynamics of China’s Regional Carbon Emissions under Gradient Economic Development Mode. Ecol. Indic. 2015, 51, 197–204. [Google Scholar] [CrossRef]
- Okushima, S. Understanding Regional Energy Poverty in Japan: A Direct Measurement Approach. Energy Build. 2019, 193, 174–184. [Google Scholar] [CrossRef]
- Li, Q.C.; Hu, J.; Yu, B.L. Spatiotemporal Patterns and Influencing Mechanism of Urban Residential Energy Consumption in China. Energies 2021, 14, 3864. [Google Scholar] [CrossRef]
- Li, Z.; Pan, L.Y.; Fu, F.; Liu, P.; Ma, L.W.; Arnorelli, A. China’s Regional Disparities in Energy Consumption: An Input-Output Analysis. Energy 2014, 78, 426–438. [Google Scholar] [CrossRef]
- Liu, H.; Wang, C.; Tian, M.Y.; Wen, F.H. Analysis of Regional Difference Decomposition of Changes in Energy Consumption in China during 1995–2015. Energy 2019, 171, 1139–1149. [Google Scholar] [CrossRef]
- Chen, J.D.; Cheng, S.L.; Song, M.L. Decomposing Inequality in Energy-Related CO 2 Emissions by Source and Source Increment: The Roles of Production and Residential Consumption. Energy Policy 2017, 107, 698–710. [Google Scholar] [CrossRef]
- Yue, W.; Cai, Y.; Yang, Z.; Rong, Q.; Dang, Z. Structural Optimization for Industrial Sectors to Achieve the Targets of Energy Intensity Mitigation in the Urban Cluster of the Pearl River Delta. Ecol. Indic. 2018, 95, 673–686. [Google Scholar] [CrossRef]
- Zhang, M.S.; Ge, X.; Zhao, Y.; Xia-Bauer, C. Creating Statistics for China’s Building Energy Consumption Using an Adapted Energy Balance Sheet. Energies 2019, 12, 4293. [Google Scholar] [CrossRef] [Green Version]
- Shi, X. Inequality of opportunity in energy consumption in China. Energy Policy 2019, 124, 371–382. [Google Scholar] [CrossRef]
- Dong, F.; Yu, B.; Hua, Y.; Zhang, S.; Wang, Y. A Comparative Analysis of Residential Energy Consumption in Urban and Rural China: Determinants and Regional Disparities. Int. J. Environ. Res. Public Health 2018, 15, 2507. [Google Scholar] [CrossRef] [PubMed] [Green Version]
- Zhou, Q.; Shi, W. Socio-economic Transition and Inequality of Energy Consumption among Urban and Rural Residents in China. Energy Build. 2019, 190, 15–24. [Google Scholar] [CrossRef]
- Fan, J.L.; Chen, K.Y.; Zhang, X. Inequality of Household Energy and Water Consumption in China: An Input-Output Analysis. J. Environ. Manag. 2020, 269, 110716. [Google Scholar] [CrossRef] [PubMed]
- Wu, S.M.; Zheng, X.Y.; Wei, C. Measurement of Inequality Using Household Energy Consumption Data in Rural China. Nat. Energy 2017, 2, 795–803. [Google Scholar] [CrossRef]
- Le, T.-H.; Boubaker, S.; Nguyen, C.P. The Energy-Growth Nexus Revisited: An Analysis of Different Types of Energy. J. Environ. Manag. 2021, 297, 113351. [Google Scholar] [CrossRef]
- Yang, Y.; Liu, J.; Lin, Y.; Li, Q. The impact of urbanization on China’s residential energy consumption. Struct. Chang. Econ. Dyn. 2019, 49, 170–182. [Google Scholar] [CrossRef]
- Wang, S.; Liu, H.; Pu, H.; Yang, H. Spatial disparity and hierarchical cluster analysis of final energy consumption in China. Energy 2020, 197, 117195. [Google Scholar] [CrossRef]
- Wang, X.; Li, N.; Chen, J.; Lu, X. Spatialtemporal Differentiation Characteristics and Driving Forces Of Urban Natural Gas Consumption In China. Fresenius Environ. Bull. 2021, 30, 10205–10214. [Google Scholar]
- Mohammadi, N.; Taylor, J.E. Significance of Scale in Spatial Dependencies of Urban Human Mobility and Energy Use: A Decision Making Perspective. In Proceedings of the International Conference on Sustainable Infrastructure, New York, NY, USA, 26–28 October 2017. [Google Scholar]
- Bian, Y.J.; Li, L.L. The Chinese General Social Survey (2003-8) Sample Designs and Data Evaluation. Chin. Sociol. Rev. 2012, 45, 70–97. [Google Scholar] [CrossRef]
- Jia, G.P. Reasonable Choice of Standard Coefficient of Energy Conversion. Metall. Energy 2011, 1, 3–4+11. [Google Scholar]
- Tan, D.; Huang, X.J. Correlation Analysis and Comparison of Economic Development and Carbon Emissions in the Eastern, Middle and Western Regions of China. Chin. Popul. Resour. Environ. 2008, 3, 54–57. [Google Scholar]
- Li, M.; Li, L. The Impact of Urbanization and Industrialization on Energy Security: A Case Study of China. Energies 2019, 12, 2194. [Google Scholar] [CrossRef] [Green Version]
- Silber, J. Factor Components, Population Subgroups and The Computation of the Gini Index of Inequality. Rev. Econ. Stat. 1989, 71, 107–115. [Google Scholar] [CrossRef]
- Sarabia, J.M.; Castillo, E.; Slottje, D.J. An Ordered Family of Lorenz Curves. J. Econom. 1999, 91, 43–60. [Google Scholar] [CrossRef]
- Fei, J.; Ranis, G.; Kuo, W.Y. Growth and the Family Distribution of Income by Factor Components. Q. J. Econ. 1978, 92, 17–53. [Google Scholar] [CrossRef]
- Asongu, S.A.; Odhiambo, N.M. The green economy and inequality in Sub-Saharan Africa: Avoidable thresholds and thresholds for complementary policies. Energy Explor. Exploit. 2021, 39, 838–852. [Google Scholar] [CrossRef]
- Lawrence, S.; Liu, Q.; Yakovenko, V.M. Global Inequality in Energy Consumption from 1980 to 2010. Entropy 2013, 15, 5565–5579. [Google Scholar] [CrossRef] [Green Version]
- Pascual Saez, M.; Cantarero-Prieto, D.; Pires Manso, J.R. Gross Inland Energy Consumption Inequality in Europe: An Empirical Approach. Rev. De Econ. Mund. 2018, 49, 149–163. [Google Scholar]
- Lee, J. Analysis of the Regional Inequalities of Renewable Energy Resources using Gini’s Coefficients. J. Korean Soc. Rural Plan. 2016, 22, 109–119. [Google Scholar] [CrossRef]
- Roice, T.; Lopez, N.S. Energy Equity Analysis In Metro Manila Using Household Expenditure Data. In Proceedings of the 11th AUN/SEED-Net Regional Conference on Mechanical and Manufacturing Engineering (RCMEManuE 2020), Manila, Philippines, 11–15 January 2021; IOP Publishing: Bristol, UK; 1109, p. 012043. [Google Scholar]
- Damgaard, C.; Weiner, J. Describing inequality in plant size or fecundity. Ecology 2000, 81, 1139–1142. [Google Scholar] [CrossRef]
- Kakwani, N.C. Applications of lorenz curves in economic-analysis. Econometrica 1977, 45, 719–727. [Google Scholar] [CrossRef]
- Seidl, C. Ethical Social Index Numbers—Chakravarty, Sr. J. Econ. Z. Fur Natl. 1992, 55, 222–227. [Google Scholar]
- Li, H. A Research on Gini Coefficient Decomposition Analysis. Quant. Tech. Econ. 2005, 22, 127–135. [Google Scholar]
- Yang, D.T. Urban-Biased Policies and Rising Income Inequality in China. Am. Econ. Rev. 1999, 89, 306–310. [Google Scholar] [CrossRef]
- Kim, M.J.; Kim, Y.R. Characteristics and Determinants of Household Electricity Consumption for Different Levels of Electricity Use in Korea. Trans. Korean Inst. Electr. Eng. 2017, 66, 1025–1031. [Google Scholar]
- Kozarcanin, S.; Andresen, G.; Staffell, I. Estimating Country-Specific Space Heating Threshold Temperatures from National Consumption Data. Energy Build. 2019, 199, 368–380. [Google Scholar] [CrossRef]
- Yang, D.W. Study of Economic Development Trend Based on Electric Power Data Analysis. East China Electric Power 2013, 41, 1292–1295. [Google Scholar]
- Liu, Y.S.; Zhang, Z.W.; Wang, J.Y. Regional Differentiation and Comprehensive Regionalization Scheme of Modern Agriculture in China. Acta Geogr. Sin. 2018, 73, 203–218. [Google Scholar]
- Wang, X.H.; Feng, Z.M. Partition of Regional Types on Rural Household Energy Consumption of Province-Level Regions in China. Int. J. Glob. Energy Issues 2002, 18, 266–273. [Google Scholar]
- Bai, A.Z. Study on the Sustainability of Urban Household Energy Consumption in China. In Proceedings of the 2010 International Symposium on Low-Carbon Economy and Technology Science, Zibo, China, 29–31 October 2010; pp. 334–342. [Google Scholar]
- Sun, C.W.; Ouyang, X.L.; Cai, H.B.; Luo, Z.C.; Li, A.J. Household Pathway Selection of Energy Consumption during Urbanization Process in China. Energy Convers. Manag. 2014, 84, 295–304. [Google Scholar] [CrossRef]
- Wang, X.H.; Li, K.Q.; Li, H.; Bai, D.; Liu, J.R. Research on China’s Rural Household Energy Consumption—Household Investigation of Typical Counties in 8 Economic Zones. Renew. Sustain. Energy Rev. 2017, 68, 28–32. [Google Scholar]
- Meng, M.; Wang, L.X.; Shang, W. Decomposition and Forecasting Analysis of China’s Household Electricity Consumption Using Three-Dimensional Decomposition and Hybrid Trend Extrapolation Models. Energy 2018, 165, 143–152. [Google Scholar] [CrossRef]
- Zhang, H.Y.; Lahr, M. Households’ Energy Consumption Change in China: A Multi-Regional Perspective. Sustainability 2018, 10, 2486. [Google Scholar] [CrossRef] [Green Version]
- Lin, T.Y.; Chiu, S.H. Sustainable Performance of Low-Carbon Energy Infrastructure Investment on Regional Development: Evidence from China. Sustainability 2018, 10, 4657. [Google Scholar] [CrossRef] [Green Version]
- Zhou, Y.; Zhang, S.X.; Lin, Y.; Gao, Y. A Game Study on Developing Low Carbon Economy by Using Biomass Energy in Chinese Rural Areas. In Proceedings of the 7th Euro-Asia Conference on Environment and CSR, Huangshan, China, 9–12 May 2011. [Google Scholar]
- Xu, X.H.; Li, Z. Research on Chinese Electrovalent Subsidy Policy for Biomass Energy Electricity Generation Industry. In Proceedings of the International Conference on Management Science and Engineering, Melbourne, VIC, Australia, 24–26 November 2010; pp. 1594–1599. [Google Scholar]
- Saboohi, Y. An Evaluation of the Impact of Reducing Energy Subsidies on Living Expenses of Households. Energy Policy 2001, 29, 245–252. [Google Scholar] [CrossRef]
- Wang, Q.W.; Zhou, B.; Zhang, C.; Zhou, D.Q. Do Energy Subsidies Reduce Fiscal and Household Non-Energy Expenditures? A regional heterogeneity assessment on coal-to-gas program in China. Energy Policy 2021, 155, 112341. [Google Scholar] [CrossRef]
Publisher’s Note: MDPI stays neutral with regard to jurisdictional claims in published maps and institutional affiliations. |
© 2021 by the authors. Licensee MDPI, Basel, Switzerland. This article is an open access article distributed under the terms and conditions of the Creative Commons Attribution (CC BY) license (https://creativecommons.org/licenses/by/4.0/).